Detailed results SECTION B - NZTA
←
→
Page content transcription
If your browser does not render page correctly, please read the page content below
Detailed
                       SECTION B

results

           55
                Footnote text to look like this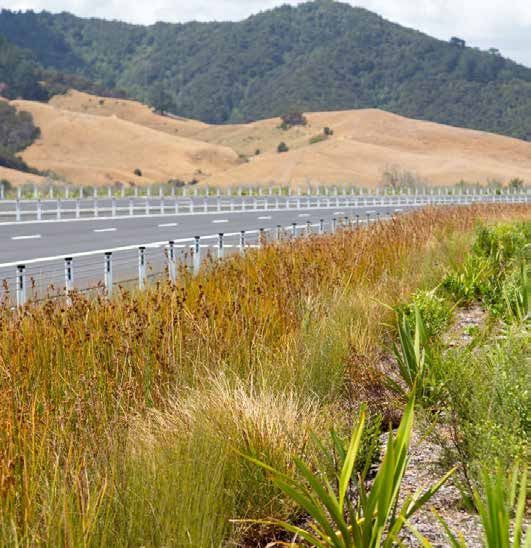
264        NATIONAL LAND TRANSPORT FUND ANNUAL REPORT 2020 INVESTMENT SUMMARY

Delivering on the government
policy statement on land transport
2018/19–2027/28
This section summarises the investment made towards achieving the strategic
priorities in the Government Policy Statement on land transport 2018/19–2027/28.
Investments made through the National Land Transport Programme by Waka Kotahi
and its co-investment partners align with Government Policy Statement strategic
priorities through the Waka Kotahi Investment Assessment Framework (explained on
page 262).
The impact of National Land Transport Programme investment is assessed through
Waka Kotahi position statement measures and output class measures that directly
align with Government Policy Statement measures. These measures are quantitative
indicators of progress against the Government Policy Statement’s strategic priorities
and intended long-term and short-term results. More detail on each measure is in the
annual report for Waka Kotahi (section B, pages 25–103).

INVESTMENT TO GOVERNMENT POLICY STATEMENT STRATEGIC
PRIORITIES
The overall spend over the first two years of the 2018–21 National Land Transport
Programme was $10.8 billion, four percent below the planned amount when the
programme was adopted in August 2018.
During 2019/20, approximately $5.3 billion was invested across the safety, access and
environment strategic priorities of the Government Policy Statement on land transport.4
An estimated 29 percent of this investment was directed towards safety benefits, 58
percent towards access benefits and 13 percent towards environment benefits.
Value for money, the fourth priority, is delivered by carrying out robust economic
appraisals of investments rather than being a benefit itself. For information on value for
money see pages 280–281.
TABLE 1
2018/19 planned investment in strategic priorities
Strategic priority                                        2019/20 Planned investment (%)

Safety                                                                                  29

Access                                                                                  58

Environment                                                                             13

Table 2 identifies the planned benefits of investments made through the 2018–21
National Land Transport Programme. These have been mapped to each Government
Policy Statement strategic priority.

                                                                                             4	This figure and the figures
                                                                                                presented in the following
                                                                                                sections on safety, access and
                                                                                                environment include funding
                                                                                                from the National Land Transport
                                                                                                Fund, local share and the Crown,
                                                                                                and exclude investment from
                                                                                                the Provincial Growth Fund,
                                                                                                SuperGold Card funding and
                                                                                                investment in the investment
                                                                                                management activity class.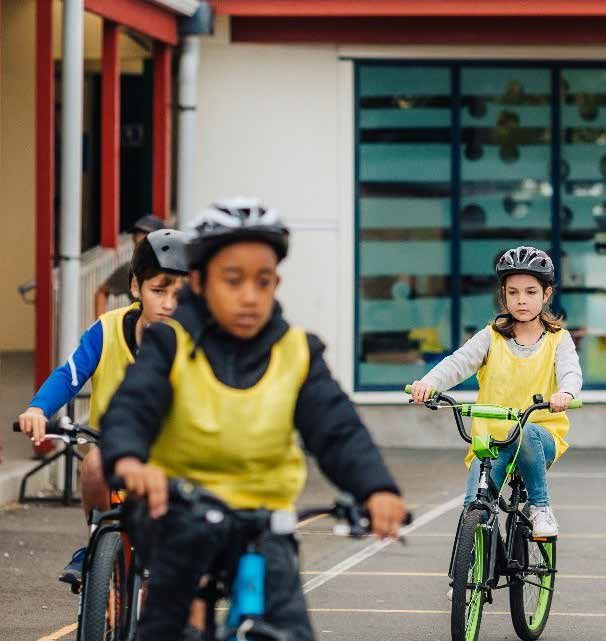
INVESTMENT SUMMARY NATIONAL LAND TRANSPORT FUND ANNUAL REPORT 2020   265

TABLE 2
Planned investment benefits mapped to Government Policy Statement strategic
priorities
Measure           Safety                 Access                     Environment

Benefits          Safety                 ACCESS                     Pollution
identified in     Physical health        Throughput                 Health noise
Transport
                                         Reliability                Pollution and
Investment
                                         Travel time                greenhouse gases
Online
                                         Access                     Environmental noise
                                         Resilience                 Resource
                                                                    consumption
                                         Comfort and
                                         customer experience        Biodiversity
                                         Financial cost             Community
                                                                    cohesion
                                         Pricing
                                                                    Amenity value

Relationship of the new Waka Kotahi benefits framework to the government’s
strategic priorities for the land transport system
The 2021-24 National Land Transport Programme will use the new Waka Kotahi
benefits framework to inform investment decisions and measure investment benefits.
Waka Kotahi also plans to use the new framework to report on benefits of investment
in the 2020/21 National Land Transport Fund annual report, the last report for the
2018–21 National Land Transport Programme.
Table 3 shows how the benefits identified by the new framework relate to the strategic
priorities in the current Government Policy Statement on land transport. In this report,
each strategic priority section includes an example of related benefits and how these
might be measured.
TABLE 3
Mapping the Government Policy Statement on land transport 2018/19–27/28 to the
new Waka Kotahi benefits framework

Measure           Safety                 Access                      Environment

Safety            Healthy and safe       Impact on social cost       Impact on
                  people                 and incidents of crashes    perceptions of
                                         Impact on a safe            safety and security
                                         system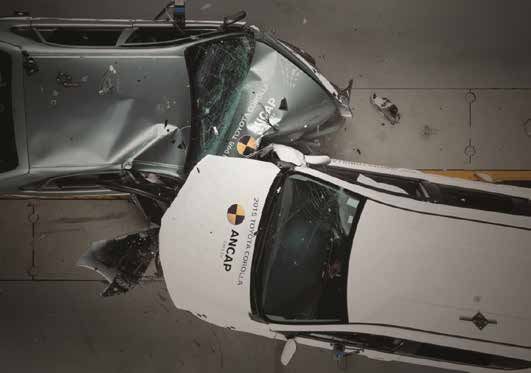
266       NATIONAL LAND TRANSPORT FUND ANNUAL REPORT 2020 INVESTMENT SUMMARY

Measure           Safety              Access                    Environment

Access            Inclusive access    Impact on mode choice     Impact on user
                                      Impact on access to       experience
                                      opportunities             Impact on
                                                                community
                                                                cohesion

                  Resilience          Impact on system          Impact on heritage
                  and security        vulnerabilities           and cultural values
                                      (resilience)              Impact on
                                                                landscape
                                                                Impact on
                                                                townscape
                                                                Impact on te ao
                                                                Māori

Environment       Environmental       Impact on greenhouse      Impact on resource
                  sustainability      gas emissions             efficiency
                                      Impact on water
                                      Impact on land and
                                      biodiversity

                  Healthy and         Impact of mode
                  safe people         on physical and
                                      mental health
                                      Impact of air
                                      emissions on health
                                      Impact of noise and
                                      vibration on health

Value for money Economic prosperity Impact on system
                                    reliability
                                      Impact on network
                                      productivity and
                                      utilisation
                                      Wider economic benefit
                                      (productivity)
                                      Wider economic benefit
                                      (employment impact)
                                      Wider economic benefit
                                      (imperfect competition)
                                      Wider economic benefit
                                      (regional economic
                                      development)
INVESTMENT SUMMARY NATIONAL LAND TRANSPORT FUND ANNUAL REPORT 2020 267
Safety
National Land Transport Programme objective $1.503
A land transport system that is a safe system, free of death and serious injury. BILLION
invested in safety
Long-term results through the National
Significant reductions in deaths and serious injuries. Land Transport
Programme in
Short-term results 2019/20 including:
• Renewed strategic focus to have the greatest impact on reducing death and serious $278m 18.5%
injury (including developing a new road safety strategy and action plan) in state highway
• State highways and local roads are safer for everyone improvements
• Cycling and walking are safer $213m 14.2%
• Effective enforcement activity to promote safe behaviour by road users in state highway
• Safer road use through appropriate education and promotion activities and maintenance
regulatory changes
$131m 8.7%
INVESTMENT HIGHLIGHTS in local road
• The Safe Vehicles programme launched in February 2020 with a national improvements
advertising campaign and refreshed Rightcar website that combines three safety
rating systems – the Australasian New Car Assessment Program (ANCAP), Used $293m 19.5%
Car Safety Ratings and Vehicle Safety Risk Ratings. This enables over 95 percent of in local road
New Zealand’s fleet to have up-to-date safety ratings. maintenance
• Road to Zero 2020–2030 was launched by the Ministry of Transport in December $47m 3.1%
2019 and is the New Zealand government’s plan to reduce deaths and serious in road safety
injuries on New Zealand roads, cycleways and footpaths by 40 percent over the next promotion and
10 years. The strategy will guide the Waka Kotahi work programme for the next 10 demand management
years and identifies where the transport sector needs to be putting its road safety
efforts. $363m 24.1%
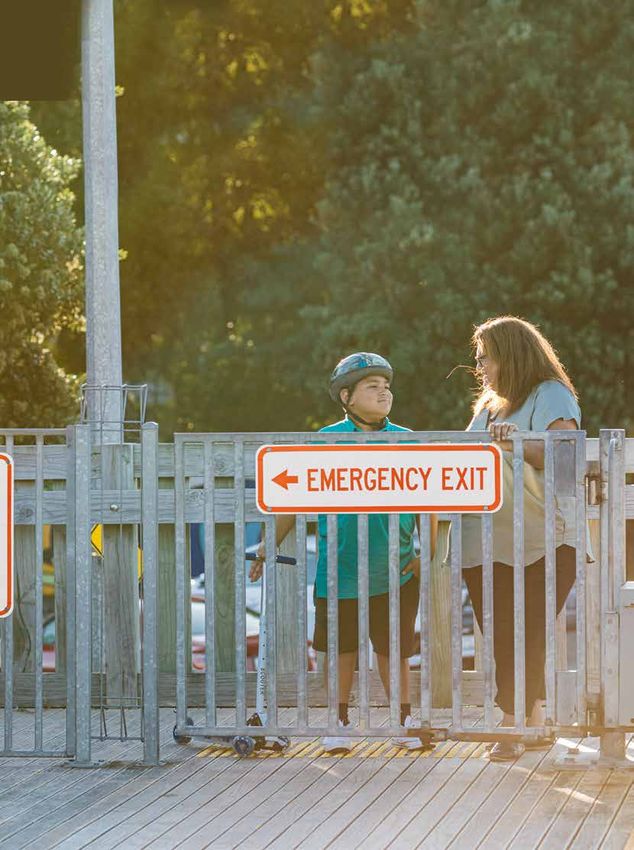
• Safer speed limits were introduced on state highways in Auckland and Bay of in road policing
Plenty, the first implemented for 2020 under the Safe Network programme.
By reducing speeds on high risk roads, Waka Kotahi is giving effect to the Safe
$59m 3.9%
System principle to reduce impact speeds in crashes to levels the human body can in regional
withstand, making a positive contribution to Vision Zero. The setting of safer speed improvements
limits followed extensive engagement with councils, iwi, local communities, our road
$67m 4.5%
safety partners and other road users.
in public transport
• Together with Waka Kotahi, NZ Police has implemented a new governance structure
to provide increased assurance on the delivery of the Road Safety Partnership $50m 3.3%
Programme. This new approach includes the Road Safety Partnership Programme in walking and cycling
Governance Board, providing oversight on the delivery of the programme and improvements
progress against key targets, supplemented by a separate Portfolio Governance
Board, providing oversight on the delivery of change initiatives funded through this $1m 0.07%
programme. in rapid transit
$2m 0.13%
in transitional rail268 NATIONAL LAND TRANSPORT FUND ANNUAL REPORT 2020 INVESTMENT SUMMARY
• The Huntly section of the Waikato Expressway was completed with State
Highway (SH) 1 now running east of Huntly, across lowlands and streams and over
Taupiri Range, which is sacred to Waikato–Tainui. The Huntly section connects the
completed expressway sections at Ohinewai in the north and the Ngāruawāhia
section at Gordonton Road in the south. It brings major improvements in safety and
efficiency, taking traffic away from the congestion point through Huntly, which has
a poor safety record. The support of iwi was critical to the success of this project
and building this section in such a culturally significant area. Waka Kotahi set out to
recognise this cultural significance through pou and other artwork along the route,
and the restoration of two paa sites.
Safety-related benefits
In the new benefits framework, safety-related investment benefits include reduced
social costs and incidents of crashes. Current measures of these benefits include
deaths and serious injuries, collective risk (crash density), personal risk (crash
rate) and crashes by severity.
Another benefit is impact on a safe system. Current measures of this benefit
include road assessment risk for roads and state highways. Waka Kotahi is also
developing a measure of the travel speed gap (the difference between safe and
appropriate speed, and actual speed).
PERFORMANCE
Deaths and serious injuries
In the year to 31 March 2020, there were 346 deaths and 2451 serious injuries (five
percent fewer deaths and four percent fewer serious injuries than in the previous year
– see Figure 2). However, the year to 31 March 2020 was the third-highest year for
deaths and the fourth-highest year for serious injuries in the past 10 years. The number
of deaths in the year ending 31 March 2020 was almost identical to the number of
deaths in the year ending 31 March 2011.
FIGURE 2
Number of road deaths and serious injuries
Total deaths and
3500 serious injuries
3000
2500 Serious
injuries
2000
1500
1000
500
Deaths
0
2011 2012 2013 2014 2015 2016 2017 2018 2019 2020INVESTMENT SUMMARY NATIONAL LAND TRANSPORT FUND ANNUAL REPORT 2020 269
The government’s national road safety strategy Road to Zero was launched in
December 2019. It outlines the government’s plan to stop people being killed or injured
on New Zealand’s roads. Road to Zero articulates the government’s vision, guiding
principles for how Waka Kotahi designs the road network and makes road safety
decisions, as well as targets and outcomes to be achieved in the decade to 2030. This
includes a target of a 40 percent reduction in deaths and serious injuries by 2030.
See the 2019/20 Waka Kotahi annual report, page 28, for more information on Road to
Zero.
Other safety-related results
119km (1.1%) More trains stop safely
of state highway network In 2019/20, 93 trains went through a stop
modified to align with a safe signal when they could have stopped safely,
and appropriate speed. a decrease of 41 trains from 2018/19.
6,728 90%
cycling trips of road safety advertising
observed in Auckland, campaigns met or exceeded
Wellington and their agreed success criteria.
Christchurch central
business districts.
490 more trips
than in 2018/19
(6,238 trips)270 NATIONAL LAND TRANSPORT FUND ANNUAL REPORT 2020 INVESTMENT SUMMARY CASE STUDY How safe is your car? Safe vehicles are one of the four pillars of the Safe System approach used to help prevent crashes and protect road users from the forces that cause death and serious injury on New Zealand’s roads. The safety rating of a vehicle, from 1 to 5 stars, indicates the likely performance of a vehicle in a crash. People are twice as likely to die or be seriously injured in a crash involving a 1-star rather than a 5-star vehicle. Waka Kotahi launched its Safe Vehicles Programme in February 2020 with a national advertising campaign and a refreshed Rightcar website. Rightcar now combines three safety rating systems – ANCAP, Used Car Safety Ratings and a new rating system known as Vehicle Safety Risk Ratings. This means more than 95 percent of New Zealand’s fleet has an up-to-date safety rating. Through agreements with Trade Me and CarJam, these safety ratings are now displayed on vehicle listings at places where people are looking to buy vehicles. The Trade Me Motors app also has a vehicle safety filter option, making it easy for people to search for affordable and safe cars to purchase. Vehicle safety ratings are supported by several industry organisations, such as the Automobile Association, the Motor Trade Association, Vehicle Testing New Zealand, Vehicle Inspection New Zealand and the Imported Motor Vehicle Industry Association. An education module has been created for car dealers so they can understand the ratings system and explain vehicle safety ratings to their customers. Safety ratings for most registered vehicles on New Zealand’s roads can be found by searching the Rightcar website at www.rightcar.govt.nz
INVESTMENT SUMMARY NATIONAL LAND TRANSPORT FUND ANNUAL REPORT 2020           271

Access

National Land Transport Programme objective                                               $3.079
• A land transport system that provides increased access to economic and social           BILLION
  opportunities                                                                           invested in access
• A land transport system that enables transport choice and access                        through the National
• A land transport system that is resilient                                               Land Transport
                                                                                          Programme in
Long-term results                                                                         2019/20 including:

• Metropolitan and high-growth urban areas are better connected and accessible            $731m 23.8%
• Better access to markets and business areas and supports tourism                        in state highway
                                                                                          improvements
• Sustainable economic development of regional New Zealand is supported by safer
  and better transport connections                                                        $463m 15.0%
• Increased mode shift from private vehicle trips to walking, cycling and public          in state highway
  transport                                                                               maintenance
• More transport choice (including for people with less or limited access to transport)
                                                                                          $262m 8.5%
• Improved network resilience for the most critical connections
                                                                                          in local road
Short-term results                                                                        improvements

For short-term results, see the Government Policy Statement on land transport,            $582m 18.9%
page 21.5                                                                                 in local road
                                                                                          maintenance
INVESTMENT HIGHLIGHTS
• Waka Kotahi completed phase 1 of Innovating Streets for People, which included          $12m 0.41%
  case studies in eight cities across Aotearoa and workstreams to address systems         in road safety
  barriers identified through engagement with local councils. As part of phase 2          promotion and
  a fund was launched to encourage councils to try a tactical urbanism approach           demand management
  to project delivery. Funding has been approved for over 40 projects, which will
  be delivered over the coming year with significant support from Waka Kotahi to          $60m 1.9%
  improve capability within councils. Support includes a community of practice, online    in regional
  guidance and training programmes. The programme will be evaluated to identify           improvements
  opportunities to embed this practice into business as usual.
                                                                                          $842m 27.4%
• Keeping Cities Moving aims to deliver on social, environmental and economic
                                                                                          in public transport
  outcomes by growing the share of travel by public transport, walking and cycling
  (also known as mode shift). Plans are also being developed targeting place-             $54m 1.8%
  based changes in the six high-growth urban areas with the greatest potential            in walking and cycling
  to achieve mode shift: Auckland, Hamilton, Tauranga, Wellington, Christchurch           improvements
  and Queenstown. The Auckland mode-shift plan Better Travel Choices has been
  completed and plans for the other five urban areas are underway.                        $8m 0.3%
                                                                                          in rapid transit

                                                                                          $62m 2.0%
                                                                                          in transitional rail

                                                                                          5 Available from https://www.
                                                                                             transport.govt.nz/multi-
                                                                                             modal/keystrategiesandplans/
                                                                                             gpsonlandtransportfunding
272 NATIONAL LAND TRANSPORT FUND ANNUAL REPORT 2020 INVESTMENT SUMMARY
• In this National Land Transport Programme period, more than 80 schools and
27,000 children have become part of the Bikes in Schools programme – with a
further 14,000 children expected to benefit from the programme by mid-2021. Bikes
in Schools involves installing a riding track within school grounds to allow students
to learn and practise riding their bike in a safe area so they build cycling skills and
confidence. Schools’ projects typically also include a fleet of bikes, helmets and bike
storage facilities. Bikes in Schools is part of the wider Waka Kotahi national cycling
education system BikeReady. The BikeReady system delivers best practice cycle skills
training by qualified instructors to children and adults. The aim is to make cycling
feel like a real transport choice for most people.
• A new pedestrian bridge was built over the Southern Motorway near Pescara Point,
linking Pescara Point Reserve (Hingaia) to Pāhurehure Esplanade Reserve as part of
the Southern Corridor Improvements Project. The project extends from Manukau
to Papakura and includes additional lanes in both directions, an upgraded Takanini
Interchange, a new 4.5km shared use path alongside SH1 and the bridge at Pescara
Point.
Access-related benefits
In the new benefits framework, key access-related investment benefits include
the impact of investments on mode choice and access to opportunities. Current
measures of these benefits include traffic mode share and mode distance and
access to key destinations by mode.
Another key access-rated benefit is the impact of investments on system
vulnerabilities and redundancies, which affect the resilience of the network.
Current measures of this benefit include the availability of a viable alternative to
high-risk and high-impact routes.
PERFORMANCE
Access to social and economic opportunities
Measuring access to a key destination, rather than efficiency of transport (such as
6
In 2020 to improve the
accuracy of results for this
travel times on key corridors), is relatively new to the New Zealand transport sector and measure Waka Kotahi changed
is foundational for considering how to improve accessibility, in particular through better from using Google API (via
Connected Journey Solutions
integration of urban development and transport.
in 2018/19) to a whole-of-
Mode share analysis for 2020 shows that the network continues to favour access by network analysis using freely
available sources (GTFS files,
road-vehicles with access coverage lower for walking and public transport (see Figure Open Street Maps, and the
3).6 The network continues to favour access by road-vehicles with access coverage pre-existing TomTom network
lower for walking and public transport. Although cycling access is fairly high, this owned by Waka Kotahi). Results
for 2019 were recalculated
assumes cyclists are confident, able and willing to cycle on public roads. (The analysis using this new method and
uses cycle-paths/shared facilities when they are present.) were: primary schools – 61.5%
walking, 89% cycling, 70.4%
Improvements in access occur slowly on a national scale. Local results show that in public transport; 98.5% driving;
some areas, access improvements have occurred in the past year. For example, in secondary schools – 20.9%
walking, 70.4% cycling, 28%
Waikato and Bay of Plenty, access to general practitioners and primary schools by
public transport; 91.9% driving;
public transport improved slightly between March 2019 and March 2020. general practitioners – 51.3%
walking, 82.2% cycling, 61.6%
See the 2019/20 Waka Kotahi annual report, pages 42–43 for more detail. public transport, 95.2% driving;
supermarkets – 39.6% walking,
81.8% cycling, 51.0% public
transport, 95.3% driving.INVESTMENT SUMMARY NATIONAL LAND TRANSPORT FUND ANNUAL REPORT 2020 273
FIGURE 3
Proportion of population within 15 minutes access to nearest school, general
practitioner and supermarket
62%
89%
PRIMARY
SCHOOLS 70%
99%
21%
70%
SECONDARY
SCHOOLS 28%
92%
51%
82%
GENERAL
PRACTITIONERS 62%
95%
40%
82%
SUPERMARKET 51%
95%
Accessibility of jobs that can be reached within 45 minutes has generally dropped,
indicating that growth of jobs has occurred away from areas that can be easily walked
or cycled to (see Figure 4).
FIGURE 4
Proportion of jobs within 45 minutes access by mode during morning peak, 2019/20
5% 23% 15% 44%274 NATIONAL LAND TRANSPORT FUND ANNUAL REPORT 2020 INVESTMENT SUMMARY
Mode share (percentage of trips by mode)
The mode share results from the Household Travel Survey provide a valuable view
on people’s transport choices. These results show that most trips continue to be
undertaken by car or van, with pedestrian trips being the next most common (see
Figure 5). From the period 2015–18 to 2016–19, there was a slight decrease in travel
by car, van and motorcycle, and a slight increase in public transport and active modes.
Over time, a larger proportion of trips by public transport and active modes such as
walking and cycling is expected as mode shift and travel demand management embed.
FIGURE 5
Mode share 2016–19 rolling averages
Car or van
driver 59.1% Cyclist 1.3%
Car or van driver Other travel
passenger 23.9% mode* 0.7%
Pedestrian Motorcyclist
12.0% 0.2%
Public
transport 2.8%
* Other travel modes include aircraft, boats (excluding ferry trips), mobility scooters and other modes like horse
riding. Skateboarders and children in pushchairs are included with pedestrians.
Other access-related results
19% 24%
of total trips in high- of people in Auckland, Wellington and
growth urban areas Christchurch have access to frequent 71%
on public transport, public transport services of Waka Kotahi
walking and cycling customers report
increased ease
of access to
63.2km transport data
of walking and cycling and journey
139 million facilities delivered choices
passengers
used urban
public transport 81%
services (bus, of unplanned road
train and ferry) closures resolved
within standard
timeframesINVESTMENT SUMMARY NATIONAL LAND TRANSPORT FUND ANNUAL REPORT 2020 275 CASE STUDY Getting children on their bikes Bikes in Schools has given more than 27,000 school children the opportunity to learn to ride a bike in a safe place. The initiative involves installing a riding track on school grounds to allow students to learn and practise riding their bike in a safe area so they build cycling skills and confidence. Cycle skills training helps children not only to be more active but to gain important road safety awareness. Cycling is a key life and confidence-building skill that has a variety of social, economic and environmental benefits. In this National Land Transport Programme period, more than 80 schools and 27,000 children have benefited from the programme. A further 14,000 children are expected to have access to Bikes in Schools by mid-2021. Bikes in Schools is part of the wider national cycling education system BikeReady. BikeReady delivers best practice cycle skills training by qualified instructors to children and adults. The aim of BikeReady is to make cycling feel like a real transport choice for most people.
276      NATIONAL LAND TRANSPORT FUND ANNUAL REPORT 2020 INVESTMENT SUMMARY

Environment

National Land Transport Programme objective                                              $693
A land transport system that reduces greenhouse gas emissions and adverse effects on     MILLION
the local environment and public health.                                                 invested in
                                                                                         environment through
Long-term results                                                                        the National Land
• Reduce greenhouse gas emissions from transport                                         Transport Programme
                                                                                         in 2019/20 including:
• Reduce transport’s negative effects on the local environment and public health
                                                                                         $20m 2.9%
Short-term results
                                                                                         in state highway
For short-term results, see the Government Policy Statement on land transport,           improvements
page 21.7
                                                                                         $113m 16.3%
INVESTMENT HIGHLIGHTS                                                                    in state highway
• Toitū Te Taiao Our Sustainability Action Plan was launched in April 2020. It is the    maintenance
  first step in a long-term commitment to significantly reduce the adverse impacts
                                                                                         $11m 1.5%
  of the land transport system on people, the environment and the climate and to
  significantly improve public health.                                                   in local road
                                                                                         improvements
• New tools have been developed as part of the Investment Decision Making
  Framework review to ensure emissions impacts are considered in planning                $224m 32.3%
  documents and when investment decisions are made. Development of a                     in local road
  methodology for emissions profiling land transport investment programmes is well       maintenance
  advanced and will inform the development of the Waka Kotahi Investment Plan (for
  input into the 2021–24 National Land Transport Programme).                             $0.2m 0.03%
• Waka Kotahi has committed to no longer using ground cover matting that contains        in road safety
  plastics in landscaping applications next to Auckland state highways and is now        promotion and
  using 100 percent biodegradable alternatives. This initiative for positive change      demand management
  was started by Auckland System Management, an alliance between Waka Kotahi,
  Fulton Hogan and HEB Construction, which operates and maintains Auckland’s
                                                                                         $1m 0.14%
  motorway network. Concerns about plastic coir matting were originally raised by iwi    in regional
  and environmental advisors, following increased public concern about the pollution     improvements
  of waterways.
                                                                                         $313m 45.1%
• The Opononi Seawall Project represented a significant resilience upgrade for SH12,     in public transport
  protecting the area from further coastal erosion. The works were critical to future-
  proofing access to this beautiful part of Northland and to ensuring communities from   $11m 1.6%
  end to end of the coast remain connected. Waka Kotahi worked closely with hapū,        in walking and cycling
  its partners and the community to ensure consideration of the environmental and        improvements
  cultural impacts of these works were at the forefront.
• Millions of plants will be planted along the Waikato Expressway, with 1.3 million      $0.05m 0.01%
  already planted along the recently completed 15km Huntly section. The plantings are    in rapid transit
  a key part of the environmental management for this significant project and mitigate
                                                                                         $0.8m 0.12%
  both visual and noise impacts of the new road. By the time the Waikato Expressway
  is complete, 3.457 million plants will have been planted along its seven sections.     in transitional rail

                                                                                            vailable from https://
                                                                                         7 A
                                                                                           www.transport.govt.
                                                                                           nz/multi-modal/
                                                                                           keystrategiesandplans/
                                                                                           gpsonlandtransportfunding
INVESTMENT SUMMARY NATIONAL LAND TRANSPORT FUND ANNUAL REPORT 2020 277
Environment-related benefits
In the new benefits framework, key access-related investment benefits include
the impacts on greenhouse gas emissions, water, and land and biodiversity. Waka
Kotahi currently measures greenhouse gas emissions by measuring the tonnes of
carbon dioxide equivalents emitted, and is working on measuring mode shift from
single occupancy private vehicles as another key measure. It is also working on
developing measures for water quality, biodiversity and productive land.
PERFORMANCE
Greenhouse gas emissions from the land transport system
Carbon dioxide emissions from the road network in 2019 totaled 11,832 kilotonnes (see
Figure 6).8 Road transport emissions have increased by 1 percent relative to the 2018
baseline.
Nationally, urban areas contribute around half of road transport carbon dioxide
emissions, with the most emissions coming from large urban centres such as Auckland,
Wellington and Christchurch where a large portion of economic activity occurs. Aside
from these urban centres, land transport emissions from each region are mostly from
travel in our rural areas.
FIGURE 6
Tonnes of greenhouse gases emitted per year from land transport
14,000
11,717 11,832
12,000 10,812 10,834
10,000
8000
6000
4000
2000
0
2016 2017 2018 2019
oad transport carbon dioxide
8 R
emissions reported here are
derived from the Waka Kotahi
National Vehicle Emission
Database which takes into
account the vehicle fleet profile
and travel on all roads in New
Zealand during 2019. The
calculation method Waka Kotahi
uses is different to the method
the Ministry for the Environment
uses for the national greenhouse
gas emissions inventory, so the
numbers from the two methods
are not directly comparable.278 NATIONAL LAND TRANSPORT FUND ANNUAL REPORT 2020 INVESTMENT SUMMARY
Other environment-related results
Total carbon emissions from staff travel (including flights, rental vehicles, taxis and
claimed mileage) decreased from last year by approximately 33 percent (Figure 7).
A contributing factor for this decrease was the restriction on travel during April and
May due to COVID-19. Waka Kotahi is putting in place measures to maintain ongoing
reductions.
The transition from petrol and diesel internal combustion engine vehicles to battery
electric vehicles has allowed Waka Kotahi to see a decrease in carbon emissions from
its vehicle fleet.
FIGURE 7
Net greenhouse gas emissions and Waka Kotahi fleet vehicle emissions (carbon dioxide
equivalent) from staff travel (including offsets), 2018/19 and 2019/20
6000
5000 4778
4000
3190
3000
2000
1000 469 431
0
2018/19 2019/20
Net emissions from staff travel Fleet vehicle emissionsINVESTMENT SUMMARY NATIONAL LAND TRANSPORT FUND ANNUAL REPORT 2020 279 CASE STUDY Millions of plants line Waikato Expressway By the time the 102km Waikato Expressway is completed next year, 3.457 million native plants will have been planted along it. The expressway, on which construction began in 2009, is being built in seven sections. More than one-third of the plants (1.3 million) are located along the 15km Huntly section, which opened to traffic in March 2020, and more than 650,000 plants have already been planted along the final Hamilton section. The native plantings are a key part of the environmental management for this significant project. Waka Kotahi is committed to improving the contribution state highways make to the environment. The landscaping and planting mitigate both the visual and noise impacts of the new road. All the plants along the expressway have been grown from seed, sourced from the area. The plants are all New Zealand native species, from the grasses and flaxes to the shrubs and small trees. Along the Te Rapa section of the Waikato Expressway there are 547,000 plants, the Ngāruawāhia section 230,000, Cambridge section 350,000, Longswamp section 180,000 and Rangiriri section 200,000.
280       NATIONAL LAND TRANSPORT FUND ANNUAL REPORT 2020 INVESTMENT SUMMARY

Value for money

National Land Transport Programme objective
To contribute to an effective, efficient and safe land transport system in the public
interest

Long-term results
• Better informed investment decision making
• Improved returns

Short-term results
For short-term results, see the Government Policy Statement on land transport, page
21.9
Waka Kotahi has progressed several projects to improve the assessment of value for
money of activities and programmes delivered with National Land Transport Fund
investment

INVESTMENT DECISION MAKING FRAMEWORK REVIEW
Waka Kotahi and the Ministry of Transport jointly reviewed the Investment Decision
Making Framework that guides investment in New Zealand’s land transport system.
The review was prompted by changes in the Government Policy Statement on land
transport to support a system-based and outcomes focused approach and take a mode
neutral approach to assessing transport interventions. Changes include giving due
weight to social, economic, environmental and other outcomes that cannot be readily
monetised. Waka Kotahi also wanted the framework to be easy to use and understand,
and to support the delivery of a better transport system.
Waka Kotahi also reviewed the criteria it uses to decide how transport projects will be
funded by the National Land Transport Fund.
The changes apply to business case development and assessment, and the benefits
framework from 31 August 2020.

MEASURING THE BENEFITS OF NATIONAL LAND TRANSPORT
PROGRAMME INVESTMENTS
To improve the way Waka Kotahi measures the benefits delivered from National
Land Transport Programme investments, it identified a consistent and enduring set of
benefits that aligns with the Ministry of Transport’s Transport Outcomes Framework.
Waka Kotahi developed a tool to capture baseline data for a selection of the measures,
so it is possible to compare the scale of problems before it invests with the scale of
problems after the investment has been delivered. Data sources and methodologies for
each measure have been identified, and benefits measurement data will be stored in
Transport Investment Online, which is the system that records, processes and monitors
funding applications.
For investments with selected measures in Transport Investment Online reporting
against benefits is expected to begin in the 2020/21 National Land Transport
Fund annual report, covering the last year of the 2018–21 National Land Transport            vailable from the Ministry of
                                                                                          9 A
                                                                                            Transport Website at https://
Programme.
                                                                                            www.transport.govt.nz/multi-
                                                                                            modal/keystrategiesandplans/
                                                                                            gpsonlandtransportfunding
INVESTMENT SUMMARY NATIONAL LAND TRANSPORT FUND ANNUAL REPORT 2020 281 Value for money Waka Kotahi constantly considers how to deliver the outcomes sought by the government in the most effective and efficient manner to obtain the best value for money. It has a responsibility to ensure costs are kept under control, and that all funding delivers the best possible outcomes for New Zealand. The application of investment principles, policies and tools and investment assurance help ensure investment decisions deliver value for money. Tools include the Investment Assessment Framework, business case approach, benefits management framework and Economic Evaluation Manual, which support the sector in delivering ongoing value for money. Monitoring of benefits realised and tracking the benefit-cost ratios of approved investments provide objective data on value for money. During 2019/20, benefit cost ratios were reported monthly on the Waka Kotahi website for approved investments in activities. CASE STUDY Innovating streets for people Innovating Streets for People is a $13.95 million investment aimed at supporting Waka Kotahi local partners to take a tactical urbanism approach to transport planning. Tactical urbanism focuses on making urban streets safer, healthier and more people-friendly by testing layouts, materials and new designs before making permanent upgrades. The Innovating Streets for People pilot fund will see 40 projects delivered across New Zealand to make streets more people friendly. These projects will reduce traffic and create more appealing environments for people to walk, cycle and play in; improve safety outcomes at intersections, making it easier for people to cross; and make business districts more vibrant. The projects will be developed in partnership with local communities, and pop-ups and interim treatments will be installed to test potential changes and gain valuable community feedback to inform long-term solutions. Innovating Streets for People will also support councils and communities to gain experience and knowledge in co-design processes and to deliver urban street upgrades faster and with more community involvement. Innovating Streets for People will help achieve value for money through Waka Kotahi working closely with its local partners to understand local community needs, to test new ideas before making permanent changes and to build capability amongst its local partners in co-design and delivery.
282        NATIONAL LAND TRANSPORT FUND ANNUAL REPORT 2020 INVESTMENT SUMMARY

Use of the National
Land Transport Fund
SUMMARY OF NATIONAL LAND TRANSPORT FUND EXPENDITURE
IN 2019/20
Revenue for the National Land Transport Fund during 2019/20 was $362.7 million
lower than forecast in the published 2018–2021 National Land Transport Programme.
At the end of year two of the three-year 2018–21 National Land Transport Programme,
overall National Land Transport Fund spend across all activity classes is seven percent
below budget. This is largely the result of using financing rather than the National Land
Transport Fund money to fund the National Land Transport Programme following the
significant revenue and cost impacts of the COVID-19 lockdown.

COVID-19 and reporting on our results
We have been working to better understand and assess the impact that the COVID-19
pandemic has had, and will continue to have, on the delivery of our core services and
significant capital projects and the achievement of our performance targets.
For the purpose of reporting at year-end, Waka Kotahi has applied a COVID-impact
rating against all impacted measures and financial results reported on in this section.

Planned and actual expenditure by activity class
Activity class   Planned and actual expenditure

State highway    Above budget     This is the result of two public–private partnership
improvements     (2%)             settlements ($274 million) and additional COVID-19
                                  related costs ($100 million). This is offset by $247
                                  million of expenditure being funded through debt
                                  rather than the National Land Transport Fund in
                                  2019/20 and an underspend in the activity class in
                                  2018/19.

State highway    Below budget     This is the result of $173 million of expenditure
maintenance      (3%)             being funded through debt rather than the National
                                  Land Transport Fund. This is offset by additional
                                  costs in emergency works and rising cost pressure
                                  from contract variations relating to additional traffic
                                  volumes; contract renewals or rewards; and the
                                  establishment of Auckland System Management
                                  and Total Traffic Management.

Local road       Above budget     Performance is being driven, in part, by targeted
improvements     (1%)             enhanced funding assistance rates as well as
                                  completion of work that was approved in the
                                  2015–18 National Land Transport Programme.
                                  This has been offset by minor delays and reduced
                                  expenditure due to the COVID-19 lockdown and $13
                                  million of expenditure being funded through debt
                                  rather than the National Land Transport Fund.
INVESTMENT SUMMARY NATIONAL LAND TRANSPORT FUND ANNUAL REPORT 2020 283
Local road Below budget The result reflects lower than forecast emergency
maintenance (7%) works claims in 2018/19 and the minor delays and
reduced expenditure due to the COVID-19 lockdown
in 2019/20. In addition, $33 million of expenditure
was funded through debt rather than the National
Land Transport Fund reducing actual expenditure
against budget.
Road safety Below budget This is due to the slow start to a number of Waka
promotion (14%) Kotahi and locally delivered activities, in particular
and demand the Alcohol Interlock Device Programme and the
management impacts of the COVID-19 lockdown resulting in a
subsequent reduction in promotional activity.
Road policing Materially on Road policing expenditure was materially on budget.
budget
Regional Below budget Mainly driven by delays in project negotiations,
improvements (4%) property acquisition challenges, and complexity in
certain designs.
Public Below budget This is the result of a result of $109 million of
transport (2%) expenditure being funded through debt rather than
the National Land Transport Fund and lower than
planned activity across various public transport
infrastructure projects. This was offset by the
increased expenditure ($90 million) in 2019/20
to fund public transport during the COVID-19
lockdown.
Walking Below budget Expenditure was under budget in 2018/19 due
and cycling (30%) to delays with the National Land Transport Fund
improvements expenditure component of the Urban Cycleways
Programme projects and later than planned start up
for several large projects. Expenditure was expected
to recover in 2019/20 but was further delayed by
the COVID-19 lockdown and the reduced claims
received from approved organisations. In addition,
the Northern Gateway project over the Auckland
harbour bridge is now funded by the Crown.284 NATIONAL LAND TRANSPORT FUND ANNUAL REPORT 2020 INVESTMENT SUMMARY
Rapid transit Below budget Budgeted spend was based on anticipated progress
(86%) on the original plan for the City Centre to Māngere
Light Rail project. Progress and expenditure on
the Auckland Light Rail project have continued to
be affected by the Crown evaluation process to
assess alternative approaches to project design and
delivery. As a result, rapid transit activity class will
not meet budget over the remainder of the current
National Land Transport Programme.
Transitional rail Below budget Spending in 2018/19 was 49 percent below budget
(56%) due to lower than expected expenditure on projects
including Wellington Metro Upgrade Programme
and the Rail Network Growth Impact Management
project. The recently announced New Zealand
Upgrade Programme (NZUP) will fund some
projects that were programmed in this activity
class. A significant amount of spend is forecast for
2020/21.
Investment On budget Investment management expenditure was on
management budget at the end of 2019/20.
The actual investments from the 2018–21 National Land Transport Fund for the planned
level of funds allocated in the 2018–21 National Land Transport Programme are
illustrated in the tables in the next sections. These tables do not account for National
Land Transport Programme funds contributed by local authorities or other sources,
including Crown grants and loans.
OVERALL USE OF THE NATIONAL LAND TRANSPORT FUND
GPS range
Budget 8,650 4,294
Actual 8,076 4,522
2,000 4,000 6,000 8,000 10,000 12,000 14,000 16,000
2018/19-2019/20 2020/21 $ millions
At the end of year two of a three-year programme, overall National Land Transport
Fund spend across all activity classes is seven percent below budget. This is largely
the result of using debt financing rather than funding from the National Land Transport
Fund for the National Land Transport Programme following the significant revenue and
cost impacts of the COVID-19 lockdown. In the statement of comprehensive revenue
and expense, the expenditure financed through the borrowing facilities is not shown as
an outflow from the current National Land Transport Fund balance. Instead it is shown
as National Land Transport Programme expenditure to be funded long-term. This
represents the obligation of the National Land Transport Fund to repay the debt when
it becomes due. Repayment of the debt will be shown as an outflow from the current
National Land Fund balance in the period the repayment is made.INVESTMENT SUMMARY NATIONAL LAND TRANSPORT FUND ANNUAL REPORT 2020 285
STATE HIGHWAY IMPROVEMENTS
State highway improvements expenditure
GPS range
Budget 2,482 943
Actual 2,528 1,190
1,000 2,000 3,000 4,000 5,000
2018/19-2019/20 2020/21 $ millions
State highway improvements expenditure was $46 million (two percent) above budget
at the end of 2019/20 as a result of the two public–private partnership settlements
($274 million) and additional COVID-19 related costs ($100 million). This is offset by
$247 million of expenditure being funded through debt rather than the National Land
Transport Fund in 2019/20 and an underspend in the activity class in 2018/19.
State highway improvements performance measures
2019/20 2019/20 2018/19
Reference Measure Result Target Actual Variance˚ Actual
SHI1 Proportion of state highway Not ≥90% 71% 19% 88%
improvement activities delivered to achieved
agreed standards and timeframes*
The target was not achieved due to claim settlements during the year totalling $344.2 million causing
a significant overspend. COVID-19 has also negatively affected delivery of the programme due to the
lockdown that delayed construction for at least 5 weeks and the resulting reduced productivity shortly
thereafter with changes in work arrangements.
SHI2 Proportion of state highway network Achieved Increasing 1.1% 0.5% 0.6%
modified to align with safe and (119km)‡ (50.5km) (68.5km)
appropriate speed*
SHI3 Proportion of regional state highway Not ≥90% 60% 30% 61%
activities delivered to agreed achieved
standards and timeframes*
The target was not met because of the Mt Messenger Bypass, which is progressing more slowly than
originally planned due to consenting delays, Resource Management Act appeals to the Environment
Court, property acquisition challenges, and a stalled compulsory acquisition process. Although delivery
of activities was negatively affected by COVID-19, the result would have only slightly improved and
target still missed.
See appendix 2 of the 2019/20 Waka Kotahi annual report, page 231 for technical details.
* This is also a performance measure for an appropriation in Vote Transport. See appendix 3 of the
2019/20 Waka Kotahi annual report, page 241 for all appropriation measures.
˚ The variance is a percentage point change unless stated otherwise.
‡†
This does not include engineering interventions on road segments. This means the actual length of
the network modified to align with safe and appropriate speed is actually higher. The full qualifying
list of improvements is being scoped for inclusion in this measure in the future.286 NATIONAL LAND TRANSPORT FUND ANNUAL REPORT 2020 INVESTMENT SUMMARY
STATE HIGHWAY MAINTENANCE
State highway maintenance expenditure
GPS range
Budget 1,319 668
Actual 1,276 750
500 1,000 1,500 2,000 2,500
2018/19-2019/20 2020/21 $ millions
State highway maintenance expenditure was $43 million (three percent) below
budget at the end of 2019/20 due to $173 million of expenditure being funded through
debt rather than the National Land Transport Fund. The reduction in expenditure is
offset by additional costs in emergency works and rising cost pressure from contract
variations relating to additional traffic volumes; contract renewals or rewards; and the
establishment of Auckland System Management and Total Traffic Management.
State highway maintenance performance measures
2019/20 2019/20 2018/19
Reference Measure Result Target Actual Variance˚ Actual
SHM1 Proportion of state highway Achieved ≥90% 95% 5% 94%
maintenance activities delivered to
agreed standards and timeframes*
Renewal activities were affected by COVID-19 because majority of them are undertaken during the
summer season and peaks from February to April. However, we were still able to achieve target
because we were ahead of programme in some regions, and risk management activities were
undertaken on those that were not. This enabled us to recover time lost during the lockdown. We
continue to manage remaining activities (for example structural renewals) that still need to be
completed.
SHM2 Safe stopping: proportion of network Achieved ≥98% 99% 1% 99%
meeting surface texture standards
SHM3 Network resilience: proportion of Achieved ≤3%◊ 1% 2% 1%
rutting ≥20mm over state highway
networkINVESTMENT SUMMARY NATIONAL LAND TRANSPORT FUND ANNUAL REPORT 2020 287
SHM4 Safe stopping: proportion of network Not ≥98% 95% 3% 97%
above skid threshold achieved
The survey to collect this information was conducted 27 November 2019 to 12 February 2020.
During this period, the country experienced a hot dry spell of weather. This weather affected the
road surface in many regions, causing it to become contaminated and making the survey results
about road condition appear much worse than the actual condition of the road. This condition has
happened before. The safe stopping threshold returns to above target levels soon after the road surface
temperature has cooled down and the abrasion from vehicle tyres removes the contamination.
SHM5 Smooth ride: proportion of travel on Achieved ≥97% 99% 2% 99%
network classed as smooth*
SHM6 Availability of state highway network: Not ≥84% 81% 3% 85%
proportion of unplanned road achieved
closures resolved within standard
timeframes
The target was not met mainly because of severe weather conditions and road crashes. Extended
closures in the first half of the year in the South Island were the result of prolonged snow, ice and
avalanche hazards over winter, as well as flooding and slips. In quarter three, closures were mainly the
result of serious crashes around the country. An improvement in the result was seen in quarter four,
which was likely to be the result of limited traffic and travel being undertaken during the COVID-19
lockdown.
SHM7 State highway maintenance cost per Achieved $24,000– $25,352 - $22,997
lane kilometer delivered* $28,000
Actual cost was higher due to COVID-19 claims and additional cost to undertake pavement and
surfacing renewals outside the summer season, which required additional additives or design changes.
Delivery of some of the renewal programmes were also reduced in particular structures and other
assets.
SHM8 Restoration and rebuild of State Achieved ≥90% 97%‡ 81%
Highway 1 between Picton and
Christchurch – proportion of activities
delivered to agreed standards and
timeframes*‡
See appendix 2 of the 2019/20 Waka Kotahi annual report, page 231 for technical details.
The result could have been affected by COVID-19 but Waka Kotahi is unable to clearly determine
this.
* This is also a performance measure for an appropriation in Vote Transport. See appendix 3 of the
2019/20 Waka Kotahi annual report, page 241 for all appropriation measures.
˚ The variance is a percentage point change unless stated otherwise.
◊ The ‘less than or equal to’ symbol was missed in the Statement of performance expectations 2019/20.
‡ Activities delivered are based on the number of projects completed rather than activities delivered.
The methodology was changed this year to address last year’s audit recommendations on improving
robustness of the performance report. The result is not comparable to the 2018/19 result.288 NATIONAL LAND TRANSPORT FUND ANNUAL REPORT 2020 INVESTMENT SUMMARY
LOCAL ROAD IMPROVEMENTS
Local road improvements expenditure
GPS range
Budget 465 275
Actual 471 313
200 400 600 800 1,000 1,200
2018/19-2019/20 2020/21 $ millions
Local road improvements expenditure was $6 million (one percent) above budget at
the end of 2019/20. Performance is being driven, in part, by targeted enhanced funding
assistance rates as well as completion of work that was approved in the 2015–18
National Land Transport Programme. This has been offset by minor delays and reduced
expenditure due to the COVID-19 lockdown and $13 million of expenditure being
funded through debt rather than the National Land Transport Fund.
Local road improvements performance measures
2019/20 2019/20 2018/19
Reference Measure Result Target Actual Variance Actual
LRI1 Proportion of the local road network Not Not Not - Not
modified to align with safe and measured available measured available
appropriate speed*
Waka Kotahi is unable to report against this measure because sufficiently robust data remains
unavailable. Development of the National Speed Limit Register from which data will be sourced is
ongoing. This work awaits the new land transport rule required to implement the Tackling Unsafe
Speeds Programme announced in December 2019.
LRI2 Provincial Growth Fund enabling Achieved ≤20 10 10 13
infrastructure projects – average working working working working
number of days to release Provincial days days days days
Growth Fund infrastructure funding
once approved*
LRI3 Housing Infrastructure Fund loans – Achieved 100% 100% - 100%
The loan will be drawn down for the
purposes and on the terms agreed
between Waka Kotahi and the
Minister of Transport*
See appendix 2 of the 2019/20 Waka Kotahi annual report, page 231 for technical details.
* This is also a performance measure for an appropriation in Vote Transport. See appendix 3 of the
2019/20 Waka Kotahi annual report, page 241 for all appropriation measures.INVESTMENT SUMMARY NATIONAL LAND TRANSPORT FUND ANNUAL REPORT 2020 289
LOCAL ROAD MAINTENANCE
Local road maintenance expenditure
GPS range
Budget 1,357 662
Actual 1,262 664
500 1,000 1,500 2,000 2,500
2018/19-2019/20 2020/21 $ millions
Local road maintenance expenditure was $95 million (seven percent) below budget
due to lower than forecast emergency works claims in 2018/19 and the minor delays
and reduced expenditure due to the COVID-19 lockdown in 2019/20. In addition, $33
million of expenditure was funded through debt rather than the National Land Transport
Fund reducing actual expenditure against budget.
Local road maintenance performance measures
2019/20 2019/20 2018/19
Reference Measure Result Target Actual Variance˚ Actual
LRM1 Pavement integrity index of the Not ≥94§ 93 1 94
sealed network*◊ achieved
Although we did not achieve the target, this level of variability is within steady and acceptable levels.
LRM2 Surface condition index of the sealed Achieved ≥98§ 98 - 98
network*‡
LRM3 Smooth ride: proportion of travel on Achieved ≥86% 87% 1% 87%
smooth roads*
LRM4 Local road maintenance cost per local Not ≤$3,000 $3,628 $628 $3,455
road lane kilometer delivered* achieved
The target was not achieved because costs associated with recently awarded local authority maintenance
contracts were higher than previously awarded contracts by 20-40 percent. The main reasons for local
road authority contracts increasing are: Resource Management Act compliance, health and safety
compliance, and the industry resetting the costs of maintenance physical works. Waka Kotahi is reviewing
this measure in light of the steady cost increase across the National Land Transport Programme.
See appendix 2 of the 2019/20 Waka Kotahi annual report, page 231 for technical details.
* This is also a performance measure for an appropriation in Vote Transport. See appendix 3 of the
2019/20 Waka Kotahi annual report, page 241 for all appropriation measures.
˚ The variance is a percentage point change unless stated otherwise.
◊
This was published incorrectly as ‘proportion of the sealed local road network that meets pavement
integrity targets’ in the Statement of performance expectations 2019/20.
‡
This was published incorrectly as ‘proportion of the sealed local road network that meets surface
condition targets’ in the Statement of performance expectations 2019/20.
§
This was incorrectly published as a percentage in the Statement of performance expectations 2019/20.290 NATIONAL LAND TRANSPORT FUND ANNUAL REPORT 2020 INVESTMENT SUMMARY
ROAD SAFETY PROMOTION AND DEMAND MANAGEMENT
Road safety promotion and demand management expenditure
GPS range
Budget 108 80
Actual 93 54
50 100 150 200 250
2018/19-2019/20 2020/21 $ millions
Expenditure was $15 million (14 percent) below budget at the end of 2019/20. This
was due to the slow start to a number of Waka Kotahi and locally delivered activities,
in particular the Alcohol Interlock Device Programme and the impacts of the COVID-19
lockdown resulting in a subsequent reduction in promotional activity during this time.
Road safety promotion and demand management performance measures
2019/20 2019/20 2018/19
Reference Measure Result Target Actual Variance˚ Actual
RSP1 Proportion of road safety advertising Achieved ≥80% 90% 10% 89%
campaigns that meet or exceed their
agreed success criteria*
RSP2 Proportion of road safety education Baseline Baseline to 100% - New
programmes meeting targets for set be set measure
access to road safety information
RSP3 Proportion of travel demand Not Baseline to Not - New
management activities delivered to measured be set measured measure
agreed timelines
Waka Kotahi is unable to report against this measure because it intended to track the 2019/20
programme milestones agreed in the travel demand management single stage business case, which
was not approved. Although there were some travel demand management activities this year, this
measure is not applicable as there was no active programme timeline to monitor against.
RSP4 Proportion of travel demand Not Baseline to Not - New
management strategies in high-growth measured be set measured measure
centres approved jointly with councils
Waka Kotahi is unable to report against this measure because travel demand management work has
been subsumed by mode shift work. Travel demand management activity remains part of the work
plan, but the indicator worked to this year was the number of mode shift plans created and agreed
with regional and city councils for high-growth centres. Mode shift plans include travel demand
management activities, but they were mainly funded and delivered under other output classes.
See appendix 2 of the 2019/20 Waka Kotahi annual report, page 231 for technical details.
* This is also a performance measure for an appropriation in Vote Transport. See appendix 3 of the
2019/20 Waka Kotahi annual report, page 241 for all appropriation measures.
˚ The variance is a percentage point change.You can also read