HBM Healthcare Investments Ltd - Unique Access to a Global and Diversified Healthcare Portfolio of Private and Public Companies February 2021
←
→
Page content transcription
If your browser does not render page correctly, please read the page content below
HBM Healthcare Investments Ltd

Unique Access to a Global and Diversified Healthcare
Portfolio of Private and Public Companies

February 2021

HBM Healthcare Investments Ltd

About HBM Healthcare Investments Ltd
Investment Strategy / Investment Process
Healthcare Sector
Portfolio Structure
Investment Positions
Outlook & Concluding Remarks
Appendix: Organisation, Team

A Leading Investment Company in Healthcare                                                           3

►   With $2.8bn assets under management, established 2001
►   Dedicated private and public equity investment teams with              SIX-listed healthcare-
    a global industry network and external business advisors               focused company
                                                                           holding private and
►   Proven track record of exits validated by about 60 trade               public equity
    sales and IPOs over past 10 years

                                                     Bellwethers
                                                                           Mid to high teens
                         Emerging Leaders
                                                                           percentage increase in
                                    Investments
                                                                           net asset value and
                                      in Listed
                     Potential Gems Companies                              share price over the
                                                                           last five years (p.a.)
                                                                   Break
                       Investments                                 even
                         in Private
                        Companies
                                                                           Attractive distribution
                                                                           policy (3-5% p.a.)
             Early      Later / Growth     IPO
             stage          stage        SMid caps
Data as of 31 January 2021
Facts & Figures                                                                                                 4

Registered Shares (CHF)                             Performance (CHF)

                                                                                                   5Y     10Y
Total assets                        2’440 million   Net return
                                                                                                  Return Return
                                                    (including
Net assets (NAV)                    2’032 million   distributions)   2021   2020    2019     2018  p.a.   p.a.

Market capitalisation               2’112 million   Share price      -0.5% 40.5% 48.0% 21.8% 27.5% 23.1%
Share price                         303.50
                                                    NAV              -0.4% 36.7% 33.0% 9.9% 17.8% 18.3%
NAV per share                       292.14
                                                    Dividend CHF            7.70    7.50     7.00
Premium                             3.9%
                                                    Dividend yield          4.1%    4.4%     4.9%

Average daily liquidity (1 year)   11’630 shares
                                    ~ 3.5 million
                                                                        5Y Volatility p.a.     1Y Volatility p.a.
Number of issued shares             6.96 million    Share price                    19.7%                 31.8%
Number of shareholders              ~ 3’100

Data as of 31 January 2021
Value Creation over 5 Years                                                                                          5

                      CHF Performance                                           USD Performance
 350                                                             700

 300                                                             600

 250                                                             500

 200                                                             400

 150                                                             300

 100                                                             200

  50                                                             100

   0                                                               0
   Jan-16    Jan-17     Jan-18   Jan-19     Jan-20      Jan-21     Jan-16   Jan-17   Jan-18    Jan-19      Jan-20   Jan-21

                        NAV HBM               Share price HBM               MSCI World Health Care Index

Data as of 31 January 2021, indexed (12.7.2001 = 100)
Portfolio Highlights in 2020 6
20 new
private investments
10 IPOs
6 Trade sales
Positive
clinical data
7 market approvals
Upcoming catalysts
Data as of 31 January 2021Over 30 Trade Sales and IPOs during the Last 5 Years 7
BioAtla
(US)
Trade Seer
IPOs
sales (US)
Everest Med.
(US)
Galecto
(US)
C4 Therapeutics
Y-mAbs (US) (US)
Westmed
ARMO Bio (US) Principia (US) Harmony (US)
(USA)
TandemLife Shriji Polymers
Aptinyx (US) Galera (US) Cathay (CN)
(Cardiac) (US) (IN)
Interventional
Kolltan (US) Eiger (US) Homology (US) Viela Bio (US) Forbius (CA) iTeos (US)
Spine (US)
Skyepharma SpringWorks ALX Oncology
Curetis (DE) True North (US) Obseva (CH) Vitaeris (US)
(UK) (US) (US)
Turning Point
Ellipse (US) Nabriva (US) AAAP (US) AnaptysBio (US) Corvidia (US) Arcutis (US)
(US)
2015-16 2017-18 2019 2020
Data as of 31 January 2021Close to CHF 550 million invested in Private Co’s Since 2014 8
45
Revenue /
Clinical
40
Profitable
35
Average investment size overall: CHF 10 million
30
25
20
15
10
5
0
Data as of 30 September 2020Latest IPOs from Private Equity Portfolio 9
Invested US$m Post - IPO Performance
Company IPO Year
(private + at IPO) Until End of Period or Exit
BioAtla 2020 29.1 147.3%
Galecto 2020 16.8 -16.7%
C4 Therapeutics 2020 9.7 100.3%
Harmony 2020 40.3 89.7%
Cathay 2020 37.0 -40.7%
iTeos Therapeutics 2020 17.9 69.6%
ALX Oncology 2020 12.6 326.4%
Arcutis 2020 22.6 109.3%
Viela Bio 2019 29.5 177.9%
SpringWorks 2019 15.2 365.2%
Turning Point 2019 14.5 591.4%
Y-mAbs 2018 32.7 165.8%
Principia 2018 Acquired by Sanofi for USD 3.7bn
Aptinyx 2018 8.5 -78.3%
Homology 2018 10.0 53.6%
ARMO * 2018 Acquired by Eli Lilly for USD 1.6bn
ObsEva 2017 18.5 -84.7%
AnaptysBio 2017 9.3 260.3%
AAA ** 2016 Acquired by Novartis for USD 3.9bn
324.2
Data as of 31 January 2021HBM Healthcare Investments Ltd About HBM Healthcare Investments Ltd Investment Strategy / Investment Process Healthcare Sector Portfolio Structure Investment Positions Outlook & Concluding Remarks Appendix: Organisation, Team
HBM Investment Focus along the Healthcare Value Chain                                             11

Suppliers           Manufacturers            Service Providers                       Payers

 Life Sciences
                    Pharmaceuticals
 Tools & Services
                                                 Distributors /
                                                                                      Patients
                                                 wholesalers
 Contract
                                                                  Insurers
 research           Biotechnology
                                                                  (managed health)
 Organizations
                                                 Services
                                                                                      Employers
                                                 (pharmacies)
                                                                  Pharmacy
 Chemicals          Medical devices
                                                                  benefit managers
                                                 Facilities
                                                 (hospitals /                         Government
                                                 clinics)
Diagnostics &       Generics /
Genomics            specialty pharma
                                                                                         Core

                                                                                         Opportunistic

                                    Digital health                                       Out of focus
Investment Strategy 12
► Investment focus continues to lie on companies with innovative platforms and drug
candidates (i.e. bispecific antibodies, novel immunotherapy/combinations, targeted and
gene therapies, neurological and orphan diseases)
► Portfolio of both private and small-cap public companies (generally companies with a
market capitalization below USD 2 bn)
► Investments typically first made in a venture round when target company has product(s) in
clinical development and has achieved “proof of concept”
► Subsequently, investment may be increased substantially in follow-on financings, provided
the value-creation potential is intact
► Active participation with companies to develop towards trade sale or IPO
► At or post IPO: the flexibility of HBM Healthcare Investments allows for further increasing
its investments in the most attractive investment casesPrivate Equity Investment Process 13
Personal contacts, Investment Other VCs Direct
industry network banks
Deal Sourcing
(>700 deals p.a., 45% USA/Canada, 40% Western Europe, 15% RoW)*
Initial Due Diligence
(~200 deals p.a.)
Comprehensive Due Diligence
(~25 deals p.a.)
Investments
(8-12 deals p.a.) *
60% Biotech
30% Medtech & Diagnostics
10% OtherInvestment Approach 14
► Fundamental long with private and public healthcare investments
► Bottom-up selection of investments with solid long-term growth potential
► Diversified portfolio approach
► Sourcing of proprietary private deal flow
► Active lead/co-lead investor in private companies with board representation
► HBM takes an active role and assumes entrepreneurial responsibility together with the
management team
► Maximum single position limit at time of investment up to 10% of NAVPublic Equity Investment Process 15
Portfolio & Risk Idea Generation
Management Universe of 750+ companies
Evaluation of global Tracking of healthcare trends
markets and macro incl conference attendances
themes and close relationship to
Continuous Portfolio experts and executives
review and adjustment Company pre-selection
Comprehensive risk
management process
Stock Selection & Due Diligence
Portfolio Construction Fundamental qualitative
Determination of exposure and quantitative analysis
and position size Stakeholder assessment
Individual stock selection and intellectual property
review
Initiating new positions
Investment write-up and
conclusionInvestment Case Advanced Accelerator Applications 16
Investment rationale
► Combination of unique business proposition with strong growing medical
imaging business (profitable) and promising late-stage therapeutic (phase III)
First institutional investor in
Investment process (2014)
2014
► Growth capital and partial buyout of existing founders
► Founders wanted specialist (non-US) investor with know-how and good Sold in 2017 to Novartis for
industry network
approx USD 3.9 billion
Investment period (2014-2017)
► Board representation
► Strategy executed on three pillars: → Gain of over CHF 200
► Expanding its diagnostic business for PET/CT and SPECT organically million (IRR > 60%)
and through acquisitions
► Bringing first therapeutic to the market
► Broadening of pipeline through in-house development and in-licensing
► HBM backed pre-IPO financing round to strengthen investor syndicate
Exit (2016-2017)
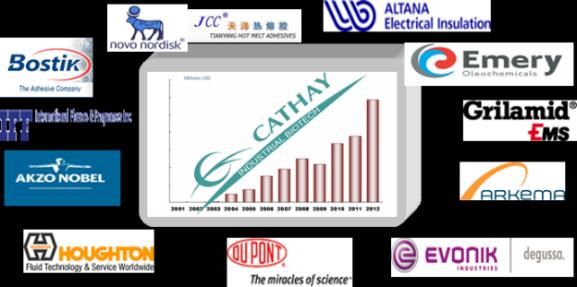
► IPO and take over by NovartisCathay Biotech (ex private) 17
Main attractions
Company uses biological manufacturing
▪ Cathay’s main products include long-chain dicarboxylic acids
methods as an alternative to chemical (“LCDA”), fine chemical intermediates, which are used for nylon,
production on an industrial scale. The polyester, adhesives and organic solvents. The company is
world market leader with market share of 90%.
objective is to reduce costs through lower
energy and raw materials inputs, as well as ▪ The biosynthesis method mainly uses petroleum by-product light
wax oil (normal paraffin) as raw material, and converts it into
to improve the quality and properties of the long-chain dibasic acid through the catalysis of intracellular
final products. enzymes. Compared with chemical synthesis, the production
process of biosynthesis is simpler and the production conditions
are less demanding
Invested since ▪ Potentially, Cathay will be the first company worldwide with a
▪ May 2006 commercial scale production of bio-based Diamine 5. Diamine is
used in combination with dicarboxylic acids to manufacture nylon
Financing and Valuation ▪ Analysts expect revenues for 2020 at previous year level ($287
million) according to Bloomberg consensus and for 2022 sales of
▪ Invested: USD 38.0m for 7.1% ownership $600 million – this would translate in a EPS of $0.362 or CNY
▪ IPO in August 2020 on Shanghai’s Star Market 2.445 respectively
▪ Current book value: USD 308m* High profit margin
▪ Market cap: USD 5.1bn $m Revenue CAGR 2016-19: 28%
300 254 271 Net profit margin 2016-19 (on
195
average): 23%
200
Position HBM 131 Revenue and net profit
100 declined by 28% and 18% (in
▪ HBM with Board representative 0
CNY) respectively in H1 2020
caused by COVID-19
2016 2017 2018 2019 disruption.
Data as of 31 January 2021, * Net of lock-up discount (15.3%); 3 years until August 2023Leader in Synthetic Biology (example of applications) 18
LCDA market / bio-based DN5
▪ High performance polyamide e.g. engineering
plastic with many automotive applications; widely
used in toothbrush filaments
▪ Polyester, e.g. widely used in furniture and soft
drink container coatings
▪ Hot melt adhesive, e.g. use in high end clothing
▪ Synthetic lubricants (dibasic esters)
▪ Powder coating, e.g. car surface, wheels Major customers worldwide
▪ Perfume synthesis, e.g. biodegradable musks
▪ Rust protection, e.g. anti-metal corrosion function,
metal working fluids / industrial cooling system
▪ Pharmaceutical Intermediates
Bio-based Polyamide / Polyesteramide
▪ When corn is turned into clothing Polyamide is
essential for many objects, from garments and
shoes to car parts. In its digital factory, Cathay
produces the popular material from renewable
biomass and it uses solutions from Siemens.
Source: Shanghai Cathay BiotechHarmony Biosciences (ex private) 19
Status company at the time of investment
▪ Wakix approved in the EU for narcolepsy (with or without
Focus on the central nervous system, cataplexy); small commercial success
including disorders of sleep and
▪ Drug licensed from French company Bioprojet for the US
wakefulness. Harmony's lead asset Wakix launch; low clinical and regulatory risk expected
is safe, tolerable, and non-scheduled (no ▪ Seasoned management with prior commercial experience in
abuse liability) the narcolepsy space
Status company now
Invested since ▪ Wakix (Pitolisant) available on the US market since end of
2019; promising launch so far – current run rate translates
▪ September 2017
into annual product sales of $150m for 2020 (Bloomberg
consensus estimates: $325m for 2021, $662m for 2023)
Financing and Valuation
▪ FDA decides on label expansion for cataplexy in autumn
▪ Invested: USD 40.3m private and at IPO (Aug 20)
Share price (USD) # of shares held (milion)
▪ Ownership: 8.2% 60 5.0
▪ Current book value: USD 166m (excluding 4.5
50
realized proceeds) 4.0
3.5
40
▪ Market cap: USD 2.0bn 3.0
30 Share price as of 31 Jan 2021: 2.5
USD 35.86
Position HBM IPO price: USD 24.00 2.0
20
1.5
▪ HBM acted as co-investor among renowned 1.0
10 Cost per share (private round): USD 8.12 -
investor syndicate with Vivo, Novo, Venbio and first investment: September 2017 0.5
Valor 0 0.0
Aug-20
▪ HBM with Board seat Data as of 31 January 2021Y-mAbs Therapeutics (ex private) 20
Status company at the time of investment
Immunotherapy for difficult-to-treat cancers
in childhood as well as certain tumours in ▪ Four antibody programs in clinical development, licensed
from Memorial Sloan Kettering (ww license) – clinical data
adults; no approved treatment available for from more than 100 patients
aggressive forms of cancer in nerve tissue
▪ Strong and experienced management team – ex-Genmab
(ie CNS/Leptomeningeal metastasis from
▪ No institutional shareholders
Neuroblastoma)
Status company now
Invested since ▪ Applications for market approval filed with the FDA, first
approval expected by YE2020, further pos. results achieved
▪ September 2017
▪ Broad early-to-mid-stage drug pipeline
Financing and Valuation
▪ Drug candidates have received Rare Pediatric Disease
▪ Invested USD 53.9 million in two private rounds designations as well as Breakthrough Therapy designations
(Series A) and at/after the IPO
▪ IPO in September 2018 Share price (USD) # of shares held (milion)
60 3.5
▪ Current book value: USD 82m (excluding realized Share price as of 31 Jan 2021:
proceeds) USD 42.01 3.0
50
▪ Market cap: USD 1.7bn 40
2.5
Position HBM 2.0
30
▪ HBM acted as lead investor; formed renowned 1.5
20
investor syndicate with Sofinnova, Scopia, others IPO price: USD 16.00 1.0
▪ HBM stepped down from the board after the IPO 10 0.5
Cost per share (private
round): USD 9.35
0 0.0
Data as of 31 January 2021 Sep-17 Jun-18 Mar-19 Dec-19 Sep-20Viela Bio (ex private) 21
A company spin-off from AstraZeneca Status company at the time of investment
focusing on severe autoimmune disorders ▪ Pre-registration of lead drug candidate Inebilizumab, pivotal
(such as Neuromyelitis Optica -NMOSD-, (phase III) trials successfully completed
Primary Sjogren’s Syndrome, Myositis, ▪ Experienced team with strong track record and investor
syndicate
ANCA vasculitis); diseases with limited
treatment options ▪ Well understood mechanism of action, peak sales potential
for first indication (NMOSD) of $400m alone, plus pipeline
optionality
Invested since Status company now
▪ June 2019 ▪ First drug approved (Uplizna) for the treatment of NMOSD
▪ Drug ready to market launch (sales force in place)
Financing and Valuation
▪ Invested USD 29.5 million in private round
Share price (USD) # of shares held (milion)
(Series B/crossover) and at IPO (October 19) 70 2.0
▪ Current book value: USD 61m (excluding 60
1.8
realized proceeds) Share price as of 31 Jan 1.6
50 2021: USD 34.68 1.4
▪ Market cap: USD 1.9bn 1.2
40 IPO price: USD 19.00
(lock up) 1.0
Position HBM 30 0.8
▪ HBM acted as lead investor in June 2019 round, 20 0.6
HBM represented on the board 0.4
10 Cost per share (private
round): USD 16.00 0.2
▪ HBM is part of a renowned investor syndicate 0 0.0
(AstraZeneca, Boyu, Hillhouse Capital, Jun-19 Sep-19 Dec-19 Mar-20 Jun-20 Sep-20 Dec-20
6Dimension, Temasek) Data as of 31 January 2021HBM Healthcare Investments Ltd About HBM Healthcare Investments Ltd Investment Strategy / Investment Process Healthcare Sector Portfolio Structure Investment Positions Outlook & Concluding Remarks Appendix: Organisation, Team
Investment Opportunities in Healthcare                                                                   23

                                  Large and Growing Industry
                                  ▪   Revenues > $1.3 trillion p.a.*
                                  ▪   Resilient to economic cycles
                                  ▪   High profit margins, strong cash-flows
                                  ▪   Many small & innovative firms and
                                      spin-offs

    Investment Approach                                             Compelling Exit Markets
    ▪   Proprietary global deal sourcing                            ▪   Attractive M&A environment
    ▪   Long-term investment expertise                              ▪   Cash-rich corporate buyers
    ▪   Active lead/co-lead investor                                ▪   Strategic premiums paid
    ▪   Exit-driven investments                                     ▪   IPO as option for mature firms

* Worldwide sales (2015) for pharma, medtech and diagnostics only
Public Healthcare Generated Strong Returns 24
1600
MSCI World Health Care Index: +900% (9.2% p.a.)
MSCI World Index: +330% (5.8% p.a.)
800
570%
400
% log
200
100
50
1995 1997 1999 2001 2003 2005 2007 2009 2011 2013 2015 2017 2019 2021
Data as of 31 January 2021, in USDStill Significant Industry Growth 25
Global Pharma Drug Sales Global Biotech Drug Sales
$ bn CAGR (2018-2024): 5.1% $ bn CAGR (2018-2024): 8.1%
900 450
835
784
800 400 388
738
693 356
652 327
700 350
621 300
620
277
600 300
258
243
500 250
400 200
300 150
200 100
100 50
0 0
2009 2011 2013 2015 2017 2019 2021 2023 2009 2011 2013 2015 2017 2019 2021 2023
Source: Evaluate Pharma World Preview 2017, June 2017Moderate Impact of Covid-19 on Clinical Trials 26
Clinical trial halts per month
1000
750
500
250
0
Jan 19 Mar 19 May 19 Jul 19 Sep 19 Nov 19 Jan 20 Mar 20 May 20 Jul 20 Sep 20 Nov 20
Suspended Terminated Withdrawn
Source: Evaluate Pharma, January 2021Healthcare Trades at Significant Discount Relative
to Broad Market 27
P/E MSCI Health
P/E
relative to World
45 Average: 1.1 1.6
Current: 0.9
40 1.4
-> Historically high 20%
discount
35
1.2
30
1
25
0.8
20
0.6
15
Average: 17.0 0.4
10
Current: 17.8
5 0.2
0 0
2001 2003 2005 2007 2009 2011 2013 2015 2017 2019 2021
P/E MSCI World Health Care Index Relative Valuation Health Care vs. Market
Data as of 31 January 2021, 12M forward P/ESignificant Revenue Contribution from Biotech 28
Global Branded Pharmaceutical Revenues: 1997 – 2020 (in $ bn)
800 45%
Growth from 1997 to 2022E
700 40%
Pharmaceuticals: 4.5% p.a.
Biotech: 12.5% p.a.
35%
600
$268
30%
500
25%
400
20%
300
15%
$415
200
10%
100 5%
0 0%
1997
1998
1999
2000
2001
2002
2003
2004
2005
2006
2007
2008
2009
2010
2011
2012
2013
2014
2015
2016
2017
2018
2019E
2020E
Small molecules Biologics % from Biotech
Source: Evercore Gene Therapy Outlook 2019Biotech as the Innovation Powerhouse 29
R&D Spend (USDbn, 2017) Pipeline (number of clinical programs, 2017)
120 5000
100 x 2.6 4000 x 0.4
80
3000
60
2000
40
20 1000
0 0
Biotech Pharma Biotech Pharma
Source: EY Biotechnology Report 2017, Evaluate Pharma World Preview 2018 Source: Biotechnology Innovation Organization Report, 2018
Market Cap (USDm, 2018) Approvals by origin (count, over last 10yrs)
2’500 250
2’000 x 3.1 200 x 0.5
1’500 150
1’000 100
500 50
0 0
Biotech Pharma Biotech Pharma
Source: MSCI World Healthcare Index, Bloomberg 2018 Source: HBM Biopharma Drug Approval Report, 2018It’s all about Innovation 30
Past and current holdings
▪ In last 1-2 years, multiple "targeted cancer"
Immuno- and companies (drugs for mutations or sub-groups of
targeted oncology broader population) have been acquired
▪ Administered via the bloodstream, in principle RNAi
therapeutics permit any gene that is responsible for
Gene Silencing causing illness to be silenced
▪ Gene editing is the process of changing, replacing,
or removing genes with precision of a single base
Gene editing / pair change if desired
therapy
▪ Antibodies have had a terrific run, but small molecules
Immunology and are making a comeback for I&I, promising oral dosing,
Inflammation ease of travel, transport and safety of dose withdrawal
▪ Dementia psychosis, agitation, behavioral market have
blockbuster potential
Neurology
▪ The complement system helps prevent infection and
Complement fight off invading pathogens like bacteria. But
disorders hyperactivation of the complement system can lead to
autoimmunity and inflammatory diseasesSupportive Regulatory Climate 31
Number of New Drug Approvals and Applications at the US FDA
60 57
50
50
45
43 43 43
41 41 41 41
40 38
36 35 36 36 35
34
32
30
30 28
26 26 26 26
55
Average: 31
53 23
22
45 46
20 39 39 41
35 36
29 30 30
25 27 26 27
24 22 24 22
10 21 21 20 21
17 18
0
1993 1994 1995 1996 1997 1998 1999 2000 2001 2002 2003 2004 2005 2006 2007 2008 2009 2010 2011 2012 2013 2014 2015 2016 2017 2018
New Drug Approvals New Drug Applications
Source: FDA, CDER (2017)Steady Flow of New Investment Opportunities 32
Global venture investments into biotech Biotech IPOs on western exchanges
20 600 8 120
533
512 518
484 7 97
467 500 100
15 6
396 78
400 80
5 68
10 300 4 50 55 60
17.9 45 7.2
6.5
3
13.2 13.9 200 40
5.1 4.9
11.5
5 10.5 2 3.9
7.2 100 20
1 2.3
0 0 0 0
2014 2015 2016 2017 2018 2019 2014 2015 2016 2017 2018 2019
VC investments ($bn) Number of investments Total amount raised ($bn) IPO count
Source: Evaluate Pharma, January 2020Ongoing Pharma and Biotech M&A Activity 33
50% premium over stock price before acquisition
Deal-Volume in $ bn ▪ Allergan / Actavis
▪ Forest / Actavis
▪ Cubist / Merck & Co ▪ Celgene / Bristol Myers
▪ Intermune / Roche ▪ Allergan / AbbVie
250 ▪ Idenix / Merck & Co ▪ Array / Pfizer
▪ Pharmacyclics / ▪ Loxo / Eli Lilly
▪ Viropharma / Shire AbbVie ▪ Spark / Roche
▪ Hospira / Pfizer
▪ Synageva / Alexion
▪ Receptos / Celgene
200 ▪ ZS Pharma / Astra ▪ Shire / Takeda
▪ Bioverativ / Sanofi
▪ Juno / Celgene
▪ Avexis / Novartis
▪ Impact Biomedicines
▪ Baxalta / Shire / Celgene
150 ▪ Medivation / Pfizer
▪ Onyx / Amgen
▪ Meda / Mylan
▪ ViroPharma / Shire ▪ Actelion / J&J
▪ Stemcentrx / AbbVie
▪ Algeta / Bayer ▪ Kite / Gilead
▪ Anacor / Pfizer
▪ Santarus / Salix ▪ Ariad / Takeda
▪ Map / Allergan 219 ▪ Akorn / Fresenius 217
100 ▪ Pharmasset / ▪ Ignyta / Roche
Gilead
▪ Actavis / Watson
185
▪ Amylin / BMS
▪ Inhibitex / BMS 144
▪ Ardea / Astra
50 109 107
79 79
57 48
0
2010 2011 2012 2013 2014 2015 2016 2017 2018 2019
Source: Evaluate Pharma (2020)HBM Healthcare Investments Ltd About HBM Healthcare Investments Ltd Investment Strategy / Investment Process Healthcare Sector Portfolio Structure Investment Positions Outlook & Concluding Remarks Appendix: Organisation, Team
Balance Sheet and Currency Allocation                                                                                                                        35
        2’400

        2’200                        10%; 211                             Cash
        2’000                          4%; 88
                                                                                                                       Others
                                                                                                                INR     6%
        1’800                                                             Other Assets
                                                                                                                4%
                                                                                                       CHF**
        1’600                                                                                           5%

                                                                          Public Equity*            EUR
        1’400                                                             thereof ex private:        6%
                                    68%; 1386                             CHFm 946/ 68%
        1’200
CHF m

                                                                          Private Equity Funds
        1’000                                                                                      CNY 12%

         800                                                                                                                                  USD* 67%
                                                                          Private Equity
         600
                                      9%; 192
         400                                                              Long-term liabilities
                                                                          2023
         200                         19%; 389

           0                                                              Short-term liabilities       * About 20% net of currency hedge (USD/CHF forward)
                                      -2%; -76                            (next 12 months)
                                                                                                       ** About 52% net of currency hedge (USD/CHF forward)
        -200                        -8%; -158
                * Currently around 18% of exposure to public markets (ex Cathay) is hedged
                                                                                                                      in % of assets
 HBM Research, data as of 31 January 2021, in % of net assets
Portfolio Breakdown by Market Cap and Geography 36
Market Capitalisation Geography
> CHF 10 billion 4%
Europe 13%
Asia 28%
CHF 2-10 billion 31%
< CHF 2 billion 65%
North and
South
America 59%
HBM Research, data as of 31 December 2020, in % of investmentsPortfolio Breakdown by Sector, Therapy and Stage 37
Sector Breakdown Therapeutic Area Development Stage
Medical Devices
& Diagnostics 4% Pre-Clinical 2%
Spec.
Pharma 6%
Phase I
12% Profitable
Others 27% 21%
Health IT, Oncology
Services & 31%
Supplies Infectious Phase II
25% diseases 1% 19%
Biotech Metabolic
Central
65% diseases 2%
nervous Market
Digital health system Phase III 33%
4% disorders 13%
15%
Medtech / Diagnostics
4%
Orphan diseases 7%
Immunology /
Inflammation 9%
HBM Research, data as of 31 December 2020, in % of investmentsInvestment Portfolio 38
Neurelis 1.6% 1mg 0.9%
InstilBio 0.7%
Swixx (Amicus) Ambrx 0.7%
1.8%
Jianke 0.7%
Nuance Pharma 0.7%
SAI Life Sciences 0.7%
Other Positions Farmalatam 0.6%
ChemoCentryx 1.0%
< 1% 13.9%
Valo Health 0.5%
Zymeworks 1.1%
Other Positions
< 1% 7.1%
iTeos Therapeutics*
1.2%
Turning Point Therapeutics*
1.3%
Arcutis* 1.5% Private Equity
Funds 8.0%
Biohaven 1.5%
Pacira* 1.7%
SpringWorks* 2.0%
Cathay
Argenx 2.2% Biotech*
11.3%
Viela Bio* 2.2%
Harmony
BioAtla Biosciences* Private equity positions
ALX Oncology* 2.6%
* 3.4% 6.1% Public equity positions
Y-mAbs Therapeutics* 3.0%
* ex private positions
HBM Research, data as of 31 January 2021, in % of assets, Top 10 positions (direct investments): 36.7%Asset Allocation over Time 39
1’600
14%
1’400
1%
10%
1’200
1’000
35%
800
CHF m
600
400
40%
200
0
2003 2004 2005 2006 2007 2008 2009 2010 2011 2012 2013 2014 2015 2016 2017 2018 2019 2020
-9%
-200
Public companies Private companies Private Funds Other assets Cash Liabilities
HBM Research, data as of the end of each financial year (31 March), in % of assetsDevelopment Stage of Lead Product of Portfolio Companies 40
100%
4%
11% 10%
11%
17% 15% 17%
16% 21% 26%
80% 11% 12% 19% 27%
21%
46% 30% 30%
20%
17% 28%
23% 25% 11% 35%
10% 26%
60% 30% 50%
23%
34%
40%
36%
58% 59% 57% 59% 57% 57%
51% 49% 48% 51%
45% 46% 45%
20%
35% 37%
16%
0%
2005 2006 2007 2008 2009 2010 2011 2012 2013 2014 2015 2016 2017 2018 2019 2020
Product(s) on the market and/or profitable Phase III Phase II Phase I Preclinical
HBM Research, data as of the end of each financial year (31 March), in % of investmentsHBM Portfolio by Development Stage of Lead Asset 41
Well balanced portfolio from a risk perspective
HBM book value
in CHF m
150
290
140
280
About half of total assets is exposed to companies
130
270 with lead phase II and phase III drugs
120
150
110
140
100
90
80
70
60
50 Blue: Public
40 Green: Private
30
20
10
0
Phase I / Preclinical Phase II Phase III Market Profitable
HBM Research, data as of 31 December 2020Contribution to NAV 42
Private and Ex Private Equity Positions Account for 65 Percent of Contribution
NAV impact per share (in CHF)
1.37
10.04
4.47
2.84
0.25 12.25 1.33
0.46
12.52
0.54
1.63
5.54
17.45
29.99 32.20 30.69
24.11
9.82
18.75
5.12
-1.97 -0.99 -3.11
-7.40 -5.40
-7.41
-4.88 -5.48
-5.78 -7.18
-1.11
-5.20
-2.43
2013/14 2014/15 2015/16 2016/17 2017/18 2018/19 2019/20
Private and ex private positions Funds Public positions Other gains/losses (e.g. milestones) Fees Share buy-back
Note: IPO allocations in previously private companies are attributed to P&L from private positionsHBM Healthcare Investments Ltd About HBM Healthcare Investments Ltd Investment Strategy / Investment Process Healthcare Sector Portfolio Structure Investment Positions Outlook & Concluding Remarks Appendix: Organisation, Team
Global Portfolio                                                                                                        44

                                                Sphingotec Adrenomed
                        Biohaven  Y-mabs                    Swixx Biopharma
                 Cardialen                        Argenx
        Dren Bio                 Viela Bio     Monte Rosa  Polyneuron
 ALX Oncology                  SpringWorks                                        Everest Medicines
Turning Point    Karius       Harmony   Biosciences
       AMBRX      Arcutis                                              Valcare                      Connect Biopharma
        Neurelis                                  Novellus Biopharma                      Bioshin
                  BioAtla                                                              1mg              Cathay
          Pacira  Longboard Pharma                                                                    Jianke
                                                                     Shriji Polymers
                                                                                                   Nuance
                                                                                      SAI Life Sciences

     Private companies
     Public companies

HBM Research, data as of 31 Janaury 2021 (Selection)
Largest Investments (1/2) 45
Phase of Market Owner- Book % of
Lead Capitalisation ship Value Total
Company Core Business Product Ticker (CHF m) (%) (CHF m) Assets
Synthetic biology (long chain Market 688065 CH 4’557 7.1 274.6 1) 11.3
diacids, carbohydrates, (ex private)
special enzymes, green nylon)
Drug for the treatment of Market HRMY 1’816 8.2 148.2 6.1
narcolepsy (with and without (ex private)
cataplexy)
Developing antibody-based Phase II BCAB 1’260 6.7 83.9 3.4
therapeutics for the treatment (ex private)
of solid tumor cancers
Developing novel antibody Market YMAB 1’516 4.8 72.6 3.0
therapeutics for oncology (ex private)
targets
Develops immuno-oncology Phase I ALXO 2’810 2.2 62.7 2.6
therapies (ex private)
Drug for treatment of severe Market VIE 1’694 3.2 54.0 2.2
inflammation and (ex private)
autoimmune diseases
1) Deferred tax on capital gain and VAT based on difference between potential selling and IPO price not included; lock up discount for 3 years starting August, 2020
reflected
Data as of 31 January 2021, * Implied company valuationLargest Investments (2/2) 46
Phase of Market Owner- Book % of
Lead Capitalisation ship Value Total
Company Core Business Product Ticker (CHF m) (%) (CHF m) Assets
Drugs for autoimmune and Phase III ARGX 12’410 0.4 52.1 2.2
cancer diseases
Pipeline of targeted oncology Phase III SWTX 3’604 1.4 48.7 2.0
programs (ex private)
Full representation of Market Private 149* 28.8 44.1 1.8
biopharma companies in
central and eastern Europe
Injectable medicines with Market PCRX 2’564 1.6 40.8 1.7
(patented) controlled release (ex private)
of active drug
Nasal spray for the treatment Market Private 234* 16.8 39.4 1.6
of epileptic seizures
Drugs for treatment of Market BHVN 4’555 0.8 36.4 1.5
neurological and
neuropsychiatric diseases
(including rare diseases)
Data as of 31 January 2021, * Implied company valuationDevelopment of Share Prices (1/2) 47
Market Cap: USD 4.3bn – (ex private) USD 2.0bn – (ex private) USD 1.4bn – (ex private)
160 55 55
140 45 45
120 35 35
100 25 25
80 15 15
60 5 5
2020 2021 2020 2021 2020 2021
USD 1.7bn – (ex private) USD 3.2bn – (ex private) 5.2bn – (ex private)
USD 1.9bn
60 120 70
50 100 60
40 80 50
30 60 40
20 40 30
10 20 20
0 0 10
2018 2019 2019 2020 2021 2020 2021 2019 2020 2021
HBM Research, data as of 31 January 2021Development of Share Prices (2/2) 48
EUR 11.5bn USD 4.0bn – (ex private) USD 2.9bn – (ex private)
300 100 140
250 120
80
100
200
60 80
150
40 60
100
40
50 20
20
0 0 0
2016 2017 2018 2019 2020 2019 2020 2021 2014 2015 2016 2017 2018 2019 2021
USD 5.1bn USD 1.2bn USD 6.1bn
100 40 140
120
80
30 100
60 80
20
60
40
40
10
20
20
0 0 0
2017 2018 2019 2020 2021 2020 2021 2019 2020 2021
HBM Research, data as of 31 January 2021Largest Private Investments over the last 5 Years 49
IPO or
trade sale
2016 / 2017 2018 2019 2020 2021
Year of initial investment, only investments > CHF 5 million
Data as of 31 January 2021Strategic Fund Investments 50
BioVeda WuXi 6- Dimensions Tata Capital Medfocus HBM
China (I / IV) Healthcare Capital (I / II) Genomics
Invested: 2005 / 2018 2015 2018 2015 / 2019 2005 2015
Investment: 8.5 m / 5 m 20 m 25 m 10 m / 20 m 16 m 22 m
Investment multiple: 3.6x / n.a. 2.1x 1.5x 1.4x / n.a. 2.5x 1.1x
Ownership: 34% / n.a. 7% 5% 67% / n.a. 100% 100%
Healthcare Healthcare Healthcare Healthcare Medical devices Genomics
Fund strategy: Access to early Invest and build Growth and Incubator and Early and
Later and growth stage investment quality platform expansion accelerator development
stage opportunities with companies investments concept, selective stage
opportunities a focus on China currently missing later stage opportunities
in China investments
Investment thesis: Seasoned VC with Partnering with Access to Access to early
One of the first investment team, capabilities in one of the leading promising early stage investments
local investors former China and U.S. to on-shore private stage investments in later rounds;
specialised in the WuXiAppTec, with access innovation equity investors in in later rounds; Network of top
Chinese vast network and build category Indian life “raised” by Silicon Valley
healthcare market facilitating / leaders in sciences successful investors and
offering deal flow healthcare sectors entrepreneurs companies with a
possibilities focus on
genomics
Currently no co-
investment
Data as of 31 January 2021, in CHFPrivate Companies with significant Value-Increasing Potential 51
▪ Full representation service in CEE markets 18 ▪ Cell therapy company developing tumor
44 ▪ Profitable company with net sales exceeding EUR infiltrating lymphocytes (TIL) for the treatment of
130 million in 2019; high double-digit sales growth solid tumor cancers
▪ Signed agreements with 17 multinationals across 17 ▪ The company is advancing its technology into
countries clinical trials
▪ Diazepam (Valtoco) nasal spray for use in 18 ▪ Proprietary platform technology with own clinical
breakthrough epilepsy seizures programs in oncology (HER2-ADC in phase II in US,
39 ▪ US market approval with orphan status phase III in China)
▪ Major unmet need in epilepsy patients, where no ▪ BLA is expected in China in H1 2022 and in the US
drug is approved for controlling break through in 2023
seizures
▪ Focus on NGS-based diagnostics of infectious
diseases from blood samples
4 ▪ Among the top players in microbial cell-free DNA
▪ India’s leading online pharmacy, medicines app (mcfDNA)
21 and health platform ▪ mcfDNA-based testing is initially expected to
▪ Strong sales growth complement (not fully replace) existing microbial
▪ Highest ranked medical app on the Indian diagnostics
Google play-store
Size corresponds to
HBM’s book value (in
Data as of 31 January 2021 Mio. CHF)Promising Public Company Holdings 52
▪ Severe autoimmune diseases (MG, ITP, PV)
▪ Long-chain dicarboxylic acids / bio-based diamine 5 ▪ Novel antibody-based therapies, combining the
▪ Profitable with expected revenues of US$270 million
275 for 2020 52 diversity of the llama immune system with antibody
engineering
▪ Potentially first company with a commercial scale ▪ Strong phase III in MG, submission for market
production of bio-based diamine 5 approval expected by YE2020; ongoing phase III in
ITP; start phase III in PV in H2 2020
▪ Narcolepsy (with and without cataplexy) ▪ Focus on rare and difficult-to-treat cancer diseases; lead
148 ▪ Wakix (Pitolisant) now market approved in the US 49 assets: nirogacestat and mirdametinib
and in the EU for narcolepsy (with or without ▪ Several partnerships with Janssen, GSK, Pfizer with a
cataplexy); unlike other wake-promoting agents, primary focus on BCMA
Wakix is not scheduled as a DEA controlled ▪ 2Q/3Q21: Phase III top-line data for nirogacestat
substance monotherapy in desmoid tumors
73 ▪ Pediatric oncology (neuroblastoma), radio- ▪ Migraine treatment (acute / prevention)
immunotherapy 36 ▪ Lead asset Rimegepant is an oral and CGRP
▪ Market approval received for Danyelza (Naxitamab) antagonist
for the treatment of r/r high-risk neuroblastoma ▪ Approved for acute migraine treatment
▪ Positive phase III in migraine prevention
▪ Market approved lead asset is an anti-CD19 antibody
54 (Inebilizumab monotherapy) – potentially first-in-class – 36 ▪ Topical formulation of PDE4 inhibitor, Roflumilast
in an orphan CNS autoimmune indication known as studied in mid-stage clinical trials for the treatment of
Neuromyelitis optica spectrum disorder (NMOSD) plaque psoriasis and atopic dermatitis
▪ Limited competition, patients often receive off-label ▪ Roflumilast potentially used as an alternative to
immunosuppressants or steroids steroids
Data as of 31 January 2021Pipeline of Catalysts in 2021 53 Important Clinical Results Phase I / II Phase III ALX Oncology* ALX148, MDS Data Update Arcutis* ARQ-151, Psoriasis Argenx Cusatuzumab, AML (unfit for intensive chemotherapy) Arcutis* ARQ-151, Atopic dermatitis BioAtla* BA3011 (AXL-ADC), Indication: AXL Positive Beigene Brukinsa, treatment naïve CLL patients BioAtla* BA3021 (ROR2-ADC), Indication: ROR2 Positive Beigene Tislelizumab, 2L/3L NSCLC and 2L esophageal cancer Biohaven Troriluzole (BHV-4157), Alzheimer's Disease Biohaven Verdiperstat, Multiple system atrophy (MSA) iTeos Therapeutics* EOS-850, monotherapy solid tumors Biohaven Troriluzole, Spinocerebellar ataxia (SCA) iTeos Therapeutics* EOS-448, Dose Finding PK/PD, solid tumors Pacira* Exparel, lower extremity nerve block (STRIDE trial) Rocket Pharmaceuticals RP-L201 for LAD-I SpringWorks Therapeutics* Nirogacestat, DeFi (desmoid tumors) SpringWorks Therapeutics* Lifirafenib + Mirdametinib combination study Y-mAbs* Omburtamab (B7H3), CNS/LM neuroblastoma SpringWorks Therapeutics* BGB-3245, RAFm solid tumors Turning Point Therapeutics* Repotrectinib, ROS1+ NSCLC/TRK+ malignancies Turning Point Therapeutics* TPX-0046, RET+ Malignancies Y-mAbs* Naxitamab, 2L osteosarcoma Zymeworks ZW49, HER2-expressing cancers Zymeworks Zanidatamab (ZW25), 1L HER2+ GEA US Approvals Further IPOs expected Albireo Odevixibat, PFIC Argenx Efgartigimod, Generalized Myasthenia Gravis (US, Japan) Biohaven Nurtec ODT, Migraine Prevention ChemoCentryx Avacopan, ANCA-Associated Vasculitis Pacira* Exparel, pediatric indication Y-mAbs* Omburtamab (B7H3), CNS/LM from neuroblastoma Note: expected catalysts, * private / ex private company
HBM Healthcare Investments Ltd – Attractions for Investors                      54

  Growing Industry                       Value Creation
    Equity investment into promising      Portfolio with significant value-
    private and public companies          increasing potential

  Expertise                              Commitment
    Expertise of the HBM Partners         Transparent valuation and
    team in selecting investments with    reporting, annual cash distribution
    attractive risk and reward            and share buy-back program
Reasons to Invest in HBM 55
► Access to a well-diversified portfolio of private and listed companies – with daily liquidity
► Portfolio with attractive value-increasing potential, companies with significant growth or IPO
plans, plus potential M&A candidates
► Closed-end structure allows optimum exploitation of the value-increasing potential of
healthcare companies
► Competitive edge over other investment companies and investment funds with exclusively
listed investments
► Stable team: Majority of investment professionals have been with HBM for more than 12
years
► HBM is a preferred investment partner, even for larger transactions
► Overall, lower correlation to a “pure” stock market investment thanks to the substantial
allocation in the private market
► Quarterly reporting with high level of transparency and direct access to the HBM portfolio
management teamHBM Healthcare Investments Ltd About HBM Healthcare Investments Ltd Investment Strategy Healthcare Sector Portfolio Structure Investment Positions Outlook & Concluding Remarks Appendix: Organisation, Team
Timely & Transparent Investment Valuations                                                                 57

► Positions in listed companies are valued at market prices
► Positions in private companies are valued at acquisition cost in the investment currency,
  except when:
−   Portfolio company is valued higher or lower in connection with a new round of financing with a third
    party lead investor (not strategic investors)
−   Portfolio company is performing below expectations, leading to a write down in steps
    of 25, 50, 75 or 100%
−   Portfolio company has significant revenues and profits, in which case an appropriate price/sales or
    price/earnings multiple is applied (“sales and earnings multiple method”)

Negative events are reflected in the valuations as they occur. Positive developments (i.e.
good clinical data, partnering deals, etc.) will only be reflected in the valuations if there is a
„liquidity event“ (financing round with third party investor, IPO or trade sale).
Investor Information 58
Share Information Largest shareholders
Latest
% Shareholder Notification
Swiss security number 1.262.725 15-20 Nogra SA, Luxemburg 9.11.2016
German security number 984345
ISIN CH 0012627250 Distribution policy
CUSIP H 3553X112
Withholding tax-exempt distribution yield of 3-5% p.a.
Telekurs 126,126272 from par value repayment
SIX Swiss Exchange Ticker HBMN
Fees
0.75% of company assets plus
Annual Management fees (paid quarterly)
0.75% of the company's market capitalisation
Performance fee (paid annually) 15% on increase in value above the high water mark
High water mark (per share for all outstanding shares) NAV of CHF 204.33Board of Directors 59
Hans Peter Hasler Prof Dr Dr h.c. mult. Heinz Mario G. Giuliani
Riesenhuber
Member of the Compensation
Chairman and Member of the Committee
Compensation Committee Vice Chairman and Member of the
Audit Committee Member of the Board of Directors Jukka
Chairman of the Board of Directors MIAC Chairman of the Advisory Board Rock LLC since 2015, NGR (MONACO) SAM
AG since 2012. Member of the Board of Tech Lithium Inc. since 2018; Member of since 2015, Giuliani Group SpA since
Directors Minerva Neurosciences since the Investors’ Committee Heidelberg 2010, and Giuliani SpA since 1999;
2017, member of the Board of Directors Innovation BioScience Venture II GmbH Member of the Investment Committee
Shield Therapeutics plc since 2018 since 2001 Royalty Pharma since 2001, and Mosaix
Member of the German Parliament 1976 Ventures LLP since 2000 as well as
Since 2017 CEO of Vicarius Pharma. various other directorships within the
Prior to this, international management to 2017; German Federal Minister of
Research 1982 to 1993; Chairman of Nogra Group
positions at Wyeth Pharmaceuticals, German Parliamentary Society 2006 to Previously executive positions and
Biogen and Biogen Idec, as well as Elan 2018; numerous directorships directorships at Giuliani SpA, Recordati
Corporation SpA, and Nogra Group SA
Dr Eduard Holdener Robert A. Ingram Dr Rudolf Lanz
Board Member Member of the Compensation and Member of the Audit and
Nominating Committee Nominating Committee
Chairman of the Board of Directors
NovImmune S.A. since 2008, CEO Chairman of the Board of Directors Chairman of the Board of Directors Dr.
since 2016 Viamet Pharmaceuticals Inc. since Rudolf Lanz AG since 2009; Member of
2015, BioCryst Pharmaceuticals Inc. the Board of Directors MIAC AG since
Medical doctor. Prior to this, specialist 2015, and Pearls Fashion Holding AG
since 2015, Novan Inc. since 2011, and
in internal medicine and oncology; Cree Inc. since 2008 since 2009
various international executive Previously Partner of The Corporate
Various executive positions at Glaxo
positions at F. Hoffmann-La Roche Ltd Finance Group and head of M&A &
Wellcome and GlaxoSmithKline (1990 Corporate Finance of Ernst & Young
to 2010) Switzerland
Dr Stella Xu
Board Member
Member of the Board of NextCure
(Nasdaq: NXTC) since 2018 and a few
other private biotech companies
Ph.D. in Immunology from
Northwestern University, and B.S. in
Biophysics from Peking UniversityManagement & Heads 60
Dr Andreas Wicki (2001) Erwin Troxler (2005) Jean Marc Lesieur (2001)
Chief Executive Officer Chief Financial Officer Managing Director and Member of
Doctorate in chemistry and Economist and Swiss Certified Public the Board of Directors (Cayman)
biochemistry; since 2001 Chief More than 20 years of experience in
Accountant; since 2005 HBM
Executive Officer HBM Healthcare
Healthcare Investments Ltd and HBM trust and corporate management and
Investments Ltd and HBM Partners
Ltd. Prior to this, chief executive of Partners Ltd, since 2011 Chief administration. Former executive
several pharmaceutical companies Financial Officer. Prior to this, auditor director for Vontobel Private Equity
(1988 to 2001), investment and PricewaterhouseCoopers Ltd (1996 Management Ltd.
venture capital advisor (1993 to 2001) to 2002) and Julius Baer Family Associate of the Chartered Institute of
Member of the Board of Directors Office (2002 to 2005) Bankers, ACIB (Trustee), a member
Harmony Biosciences since 2017, Chairman of the Swiss Association of of the Society of Trust and Estate
Vitaeris Inc. since 2016, Pacira Investment Companies (SAIC) since Practitioners (STEP) and a Notary
Pharmaceuticals Inc. since 2007, Public in the Cayman Islands. He
2014
HBM Healthcare Investments
was educated in the Cayman Islands
(Cayman) Ltd since 2001, and
Buchler GmbH since 2000 and England
Dr Matthias Fehr, CFA (2002) Dr Ivo Staijen, CFA (2003)
Head Private Equity Head Public Equity
Over 20 years of experience in Over 20 years experience in the
private and public equity investment pharma industry and in investment
management and research analysis and portfolio management
MSc and PhD in chemistry from ETH PhD in biotechnology from ETH
Zurich Zurich and MSc in chemistry from the
Former senior sell-side analyst at University of Groningen
Lombard Odier for biotech and Previously senior biotechnology
medical technology industries; former analyst at Bank Sarasin and
scientist at the Swiss Federal Institute department head at MDS Pharma
of Technology ServicesPrivate Equity Team 61
Dr Alexander Asam, MBA (2007) Dr Priyanka Belawat (2007) Dr Emil Bujak, CFA (2015)
Investment Advisor Investment Advisor Investment Advisor
More than 20 years of experience in the Over 18 years of experience in venture Over 10 years of experience in venture
life sciences and private equity capital and medicinal research
and private equity investing in
businesses healthcare space and life sciences Holds a PhD and an MSc in Medicinal
and Industrial Pharmaceutical Sciences
MBA degree from ASTON Business research
from ETH Zurich and is a Chartered
School, Birmingham and a MSc and PhD Holds a doctorate in molecular biology Financial Analyst (CFA) since 2019
in chemistry from University of Heidelberg and genetics from the University of Prior experience as a registered
Former managing director and partner of Zurich and a post-doc at HKUST pharmacist and in antibody technology
Deutsche Venture Capital / Deutsche research at Philogen
Bank. Various positions at Hoechst,
Aventis and LION Bioscience
Dr Michael Buschle (2017) Dr Ulrich Geilinger (2001) Dr Romain Kooger (2020)
Investment Advisor Investment Advisor Investment Advisor
More than 25 years of experience in More than 25 years of experience in Over 6 years life science research
biotech and pharma experience
the Venture Capital Industry
PhD from the University of London.
PhD ETH Zurich in Natural Sciences PhD and postdoc in biophysics and
Research at St. Jude’s Children’s
Research Hospital, Boehringer and Industrial Engineering microbiology at ETH Zurich
Ingelheim-owned Institute of Molecular Previously in management functions at BSc and MSc in biochemistry from the
Pathology, Vienna Innoventure, Credit Suisse, Apax and university of Geneva with an emphasis
Co-founder of Intercell with successful Vontobel on chemistry and neurosciences. Year-
IPO, CSO of Glenmark Pharma long research internships at Leiden
University and Nanjing University
Dr Chandra P. Leo, MBA (2007) Dr Asun Monfort (2020)
Investment Advisor Investment Advisor
More than 14 years of experience in life
Over 20 years of experience in private
science research and development of
equity, clinical practice and biomedical advanced therapies
research.
PhD in pharmaceutical development of
Doctor of Medicine from Freie Universität innovative medicines from University of
Berlin (Charité), MAS in Medicines Navarra. Postdoc at the Stem Cell
Development from University of Basel, Institute in the University of Cambridge
MBA with distinction from INSEAD and postdoc at the Institute for Molecular
Health Sciences at ETH
Former postdoc at Stanford University,
Previously senior scientist at ETH
physician at University Hospital Leipzig
and principal at Wellington PartnersPublic Equity Team 62
Steve Chen, CFA (2020) Miranda Guo (2020) Mirjam Heeb (2019)
Investment Advisor (Hong Kong) Investment Advisor (Hong Kong) Investment Advisor
Over 5 years experience in Chinese Over 15 years experience in the pharma
Over 15 years of investing experience
healthcare industry with experience in
with focus on China and global healthcare investment analysis, business industry and global healthcare investment
MBA from Wharton Business School, MSc development and post investment analysis and portfolio management
in Biochemistry and Molecular Biology management MSc in Molecular Biology from the
from Georgetown and BSc from Nankai MSc in Biomedical Engineering from the University of Basel and McGill University,
University Chinese University of HongKong Montreal
Previously managed trading portfolio for Previously PE investment manager at Previously senior portfolio manager of
Barclays (NY) and Huatais’ HK subsidiary LEPU Medical Technology and GAM Health Innovation Fund, senior
investment analyst at BGI Genomics manager with Vifor Pharma, analyst and
and was PM for a large closed-end listed
fund in China portfolio manager at Bellevue Group
Thomas Heimann (2010) Michael Jasulavic (2012) Ny Ken (2004)
Risk Manager and Analyst Investment Advisor to HBM Partners Investment Control
Over 8 years of experience in Over 10 years of experience in More than 10 years experience in
Investment Research, Analysis, FINMA healthcare investment research, trading & execution and administration
Risk Management and client services strategy and trade execution
MSc and BSc in Banking & Finance Bachelor in business administration
MSc in Medical Science from
from the Lucerne University of Applied from Zurich University of Applied
MCP/Hahnemann University
Sciences Sciences
Previously biotechnology analyst at
Previously in investment analysis and Traxis Partners, Sivik Global Previously in administrative functions at
valuation and in client advisory at a Healthcare and Jefferies Asset HBM Partners AG
Swiss bank Management
Gavin MacGregor (2017) Miles Schofield (2007) Dr Thomas Thaler (2006)
Investment Advisor Trading & Execution Investment Advisor
Over 13 years experience in the pharma Over 15 years experience in trading & Over 25 years of experience in the
industry and in global healthcare execution investment management, financial
investment analysis research and in the biotechnology and
Bachelors of Science (Hons) degree
1st Class BSc in Biomedical Sciences, medical technology industry
from the Open University UK
University of Manchester and a Chartered PhD in life sciences and MSc in
Management Accountant (CIMA) Previously in US Equities Middle Office biochemistry and a MBA from ETH Zurich
activities at Salomon Smith Barney and
Previously senior global healthcare Previously senior equity analyst at Bank
Citigroup
analyst at Martin Currie Investment Julius Baer and in senior management
Management, European pharma analyst positions with Sulzer Medica, Schneider
at Credit Suisse and Lehman Brothers and Boston ScientificDisclaimer 63 This document is intended to be for information purposes only. The material is not intended as an offer or solicitation for the purchase or sale of any financial instrument and should therefore not be relied on for accounting, legal or tax advice, or investment recommendations. Information herein is believed to be reliable but HBM does not warrant its completeness or accuracy. No responsibility can be accepted for errors of fact or opinion. Reliance should not be placed on the views and information in the document when taking individual investment and/or strategic decisions. HBM has expressed its own views in this document and these may change. Past performance is not a reliable indicator of future results, prices of shares and the income from them may fall as well as rise and investors may not get back the amount originally invested. An investment entails risks, which are fully described in the prospectus. Some information quoted was obtained from external sources HBM considers to be reliable. No responsibility can be accepted for errors of fact obtained from third parties, and this data may change with market conditions. Third party data is owned or licensed by the data provider and may not be reproduced or extracted and used for any other purpose without the data provider's consent. Third party data is provided without any warranties of any kind. The data provider and HBM shall have no liability in connection with third party data. HBM may be a data controller in respect of your personal data. For information on how HBM might process your personal data, please view our Privacy Policy available at hbmhealthcare.com/privacy-notice or on request should you not have access to this webpage. Issued by HBM Healthcare Investments AG, Bundesplatz 1, 6300 Zug, Switzerland.
Your Contact                           64

HBM Healthcare Investments Ltd
Bundesplatz 1
6301 Zug
Switzerland

Phone      +41 41 710 75 77
Fax        +41 41 710 75 78

investor.relations@hbmhealthcare.com
www.hbmhealthcare.com
You can also read