Heritage Account 2021 Q1 Global Investment Guide - Southeast Asia Edition - PC ...
←
→
Page content transcription
If your browser does not render page correctly, please read the page content below

Southeast Asia Edition

       Heritage Account
2021 Q1 Global Investment Guide

2020 was definitely an unforgettable year. The global economy was first hit by the Covid-19
pandemic and countries as a result introduced unprecedented stimulus policies. The
global stock market also experienced the quickest bull-bear market transition in history.
In 4Q20, the conclusion of the U.S. presidential election and the negotiations on a trade
deal between the UK and the EU did create noises in markets. However, global equities had
repeatedly set new highs on the news of vaccine R&D and vaccination progress, as well as
huge liquidity injected by central banks. The MSCI World Index gained 13.63%, the MSCI
Emerging Markets Index rose 19.34%; while the U.S. Dollar Index fell 4.21% and gold rose
0.45% in 4Q last year.

We remain cautiously optimistic on how global markets will perform in 1Q21, as huge
liquidity injected by central banks, governments' large-scale fiscal stimulus policies and
successful R&D on the Covid-19 vaccine will help the global economy return to normal.
We expect global markets continue to rise in 1Q21. However, much uncertainties still
remain. For example, although vaccines have been successfully developed, issues such as
mutations and the timeline for mass vaccinations will still need to be dealt with. Also, there
is also policy uncertainty under the new U.S. president and U.S.-China relations remained
delicate. These "grey rhino" events will still result volatility in markets.

This uncertainty in equity markets reminds investors to always practice portfolio
diversification to hedge against market uncertainty. As your private professional wealth
manager, we are committed to our mission to continuously create value for our customers.
We aim to safeguard our clients' wealth by delivering sustainable and steady returns,
and accomplish our core mission goals for our clients. We construct asset allocation and
implement our investment strategies with care and diligence, striving to help our customers
navigate their way through unpredictable financial markets.

                                                                                                 2
Markets' Performance in the Previous Quarter

        Brazil                                                                NZD

        India                                                                 AUD
       Korea
                                                                               GBP
       Japan
                                                                               EUR
       Russia
                                                                              CAD
          HK

     China(H)                                                                 CNY

      Global                                                                   JPY

          US                                                                  HKD
    European
                                                                              USD
     China(A)
                                                                                   -10%           -5%     0%         5%          10%         15%
                 0%     5%        10%     15%    20%   25%      30%

          Global Equity Indexes                                                      Major Currencies

     Soybeans                                                                     Energy

          Corn                                                                  Financial

Brent crude                                                                    Industrial

    WTI crude                                                                   Info Tech

       Copper                                                               Discretionary

        Wheat                                                                 Health care

      Iron ore                                                                    Staples

          Gold                                                                     Utility

           Gas
                                                                              Real Estate

                 -10%        0%         10%     20%     30%        40%
                                                                                             0%     5%   10%      15%      20%         25%    30%

          Commodities                                                                Sectors

             Market Commentary on Previous Outperformers and Underperformers

    Outperformers: Brazil, India
    Brazil's Bovespa stock index hit an all-time high as the readings       India has topped the emerging markets in receiving the foreign
    pointed towards improving trends in Latin America's largest             investment in equities. For the year 2020, the foreign institutional
    economy, while investors also expected increased liquidity in the       investors (FIIs) kept pumping money in Indian equities and
    United States to benefit regional risk assets. Although 2020 was        continued with the buying spree. Analysts feel what may be
    a highly volatile year in the financial market, the low interest rate   attracting FIIs to Indian equities may be hopes of strong economic
    scenario prompted individual Brazilian investors to seek more risky     recovery, earnings growth in coming years, decline in COVID-19
    assets when faced with ever lower yields on more conservative           cases at a time when the western world (especially US and
    investments.                                                            European nations) are with hit by second Corona wave and weak
                                                                            dollar index.

    Underperformers: U.S. Dollar
    The U.S. dollar has been sliding for months. Uncertainty from           be more or less conquered in the months ahead. Vaccines will
    the coronavirus pandemic, a tumbling US economy and an                  allow economies around the world to return to normal within
    increase in USD money supply saw the US dollar fall nearly 10%          the coming year, encouraging investors to step back from the
    from over 3-year highs reached in March. The consensus view             relative safety of U.S. assets and invest in stocks, bonds and
    of a falling dollar is based on a big assumption: Covid-19 will         currencies outside the U.S..

3
Quarterly Market Outlook

Investment Market       -2    -1     0   +1   +2 Key Points

Stock Market

                  US                             Loose monetary and fiscal policies will keep U.S. equities buoyant.

               Europe                            Underperformance and relatively cheap valuations increase the attractiveness of European equities.

               Japan                             Strong JPY, profit-taking pressure and spikes in infections may cast a pall on performance.

                China                            Upward trend remains intact due to attractive interest rate differentials + better corporate earnings.

         North Asia                              Dollar liquidity a boost for equity markets' performance.

     Southeast Asia                              Regional Comprehensive Economic Partnership (RECP) is good for regional economic development.

  Other EM markets                               To benefit from weak USD and yield-hunting despite near-term challenges.

Fixed Income

US/EU Bond Market                                Expect high yield to outperform investment grade fixed income .

        Govt. Debts                              Improving investors' risk appetite may induce fund outflows.

        Real Estate                              Low interest rates and ample liquidity will still benefit the real estate market in the short term.

Commodities

               Energy                            Risk and opportunity coexist, the leading energy company is preferred.

        Basic Metal                              Iron ore price is expected to show a weak consolidation pattern.

         Agriculture                             Strong Chinese demand will continue to push up soybean prices.

☆ -2 = Strong Sell;-1 = Underweight; 0 = Neutral; 1 = Overweight; 2 = Strong Buy

        Portfolio Recommendations

                  Aggressive                                   Balanced                                           Conservative
                         0%

                                                              20%
                30%                                                                                              30%
                                                                                 40%

                                   70%                       40%                                                                     70%

                         Growth                          Income                                  Money Market

                                                                                                                                                          4
U.S.: Loose monetary and fiscal policies will keep U.S. equities buoyant

★ Democrat candidate Joe Biden won the                            government both launched large -scale
    presidential election in December last year,                  stimulus policies. After the U.S. economy
    but Congress remained divided as time of                      experienced two consecutive quarters of
    writing (pending Georgia's runoff elections                   contraction, it rebounded rapidly in the third
    in January). In addition, although the world                  quarter, growing at an annualized rate of
    continues to be ravaged by the coronavirus,                   33.4% quarter-on-quarter. The three major U.S.
    the progress in vaccine research was going                    equity benchmarks had maintained an upward
    well. The U.S. has started mass vaccination.                  trend in 4Q20 and repeatedly set new highs.
    At the same time, the Fed and the U.S.

                             U.S. GDP QoQ (%) on An Annualized Basis
                         40

                         30

                         20

                         10

                             0

                         -10

                         -20

                         -30

                         -40
                               Dec-17      Jun-18   Dec-18     Jun-19       Dec-19        Jun-20

★ In their latest policy meeting, the Fed pledged                 cumulatively the amount of fiscal stimulus
    to maintain interest rates unchanged and                      implemented exceeded US$3 trillion. We
    continue to implement quantitative easing                     believe that the economy will continue to
    policies until substantial progress is achieved               recover with mass vaccination underway.
    in achieving maximum employment and price                     Although is limited room for additional fiscal
    stability. The Fed's balance sheet has reached                and monetary policies, but the extremely
    US$7.36 trillion, an increase of 73% from                     loose policy environment will still be beneficial
    March. At the same time, the U.S. government                  to the stock market. U.S. equities can maintain
    launched an economic stimulus package                         their upward trend in 1Q21.
    of more than US$900 billion in December,

                                        Fed Balance Sheet (Trillion USD)
                         8
                         7

                         6
                         5
                         4
                         3
                         2
                         1
                        0
                        Mar-20            May-20      Jul-20       Sep-20            Nov-20
                                                                                          ★ Data Source: Bloomberg, 2020/12/31

5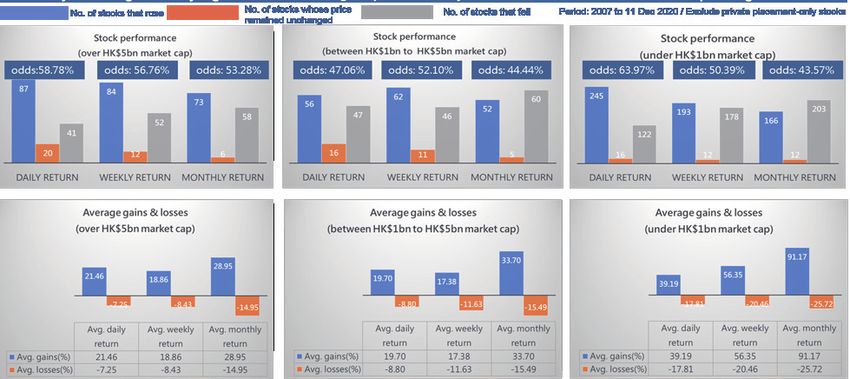
Europe: Underperformance and relatively cheap valuations increase the
             attractiveness of European equities

★ The EU economy rebounded rapidly after two                                 social distancing measures will have a negative
   quarters of contraction. In 3Q20, economic                                impact on the still-recovering economy. With
   growth (GDP) grew by 12.5%. However, the                                  regards to policies, the ECB continues to
   coronavirus continued to spread in Europe.                                maintain an extremely loose monetary policy,
   The Oxford Coronavirus Government Response                                increased the scale of bond purchases and
   Tracker (OxCGRT) Government Stringency                                    extended the timeline. In addition, the EU
   Index shows that the outbreak preventive                                  passed a 1.8 trillion euros budget in December,
   measures in most European countries have                                  which included a 750 billion euros economic
   been strengthened, and stricter lockdown and                              recovery fund.

                             OxCGRT: Government Stringency Index
                      100

                       80

                       60

                       40

                       20

                         0
                         Jan-20       Mar-20        May-20             Jul-20            Sep-20     Nov-20
                                               France       Italy     Germany            Spain

★ The policy certainty in Europe is relatively                               600 Index's performance (red line) has lagged
   high, and expansionary monetary and fiscal                                behind S&P 500 Index (blue line) for long time,
   policies will continue in the next few years.                             valuation wise is also more attractive than U.S.
   In addition, the successful passage of the                                equities. We expect with mass vaccination in
   European Recovery Fund will help the euro                                 Europe, the European economy will return to
   zone to increase cohesion and integration,                                normal. We maintain a long-term positive view
   which will have a positive effect on the euro                             on European equities.
   and bloc's economy. Finally, the Stoxx Europe

                                  Stoxx 600 Index vs SP500 Index
                       1.9

                       1.6

                       1.3

                        1

                       0.7
                         Jan-17   Jul-17   Jan-18       Jul-18      Jan-19      Jul-19     Jan-20   Jul-20
                                                        SPX Index       SXXP Index

                                                                                                     ★ Data Source: Bloomberg, 2020/12/31

                                                                                                                                            6
Japan: Strong JPY, profit-taking pressure and spikes in infections may cast
             a pall on performance

★ The Japanese government on 21 Dec 2020                              growth. With regards to monetary policy, the
    passed a record US$1.03 trillion budget draft                     BOJ extended the duration of the Special
    for fiscal year 2021, less than a week after                      Programme that was aimed to ease corporate
    approving the third extra budget for this                         financing pressures to Sept 2021 and kept
    year's spending, to help the economy recover                      policy unchanged. Japan's key economic
    from the negative impact of the pandemic.                         indicators in the last few months had reflected
    In addition, the government raised its real                       the results of the unprecedented fiscal and
    GDP forecast to 4%, higher than the previous                      monetary policy, as well as global economic
    forecast of 3.4% growth in July, and higher                       improvement.
    than Bloomberg's median estimates of 2.7%

                                  Japan's Leading & Coincident Index
                         100

                          90

                          80

                          70

                          60
                                 Jan-20 Feb-20 Mar-20 Apr-20 May-20 Jun-20 Jul-20 Aug-20 Sep-20 Oct-20
                                                   Leading Index    Coincident Index

★ Despite the generous fiscal and monetary                            (2) The Nikkei 225 Index has rebounded 65.8%
    support, we remained neutral on the outlook                           from March's lows and we think the positive
    for Japanese equities, due to:                                        factors has largely been factored in.
    (1) Strong JPY. Currently, analysts' consensus                    (3) The resurgence of coronavirus infections in
        outlook for the JPY suggests that the yen                         Japan and globally meant that the recovery
        could possibly break the barrier of 100 per                       in Japan's service sector will be negatively
        dollar in 2021. This is worrying as the break-                    a f fe cte d , u n t i l va cc i n at i o n p ro g re s s
        even exchange rate (based on a survey                             achieved critical mass.
        done by the Cabinet Office) for listed export
        firms in fiscal 2019 was 100.20.
                          Nikkei 225's Performance Since March 2020
                          18.0

                          16.0

                          14.0                                                              +2SD: 14.3x

                                                                                            +1 SD: 12.3x
                          12.0
                                                                                            Average: 10.4x
                          10.0
                                                                                            -1SD: 8.4x
                           8.0
                                                                                            -2SD: 6.5x
                           6.0

                           4.0
                             Dec-10      Dec-12      Dec-14      Dec-16     Dec-18      Dec-20

                                                                                            ★ Data Source: Bloomberg, 2020/12/31

7
China: Upward trend remains intact due to attractive interest rate
            differentials + better corporate earnings

★ Chinese economic data released in November              leadership outlined the plans for 2021 – 2025
  suggest that the country's recovery remains             focused on boosting domestic spending and
  firmly on track. China's industrial production          propelling China into a global tech powerhouse.
  grew 7.0% year-on-year, while retail sales, an          Therefore, consumer discretionary sectors as
  indicator of domestic demand, grew 5.0%                 well as technology-related industries should
  year-on-year, the strongest growth this year.           continue to outperform in 1Q21. In a sign of
  Stimulating domestic growth remains the top             faith on China's continued recovery, China said
  agenda for the Chinese leaders for the next five        it will implement "reasonable" monetary policy
  years. End October, the Chinese Communist               as well as "sustainable" fiscal plans in 2021.

                                        China's Economic Data
       Economic Data                    Jun-20   Jul-20    Aug-20    Sep-20         Oct-20     Nov-20

       Caixin China Manufacturing PMI    51.2    52.8       53.1      53.0           53.6       54.9

       China PPI YoY                     -3.0     -2.4      -2.0      -2.1           -2.1       -1.5

       China Value Added of Industry     4.8      4.8        5.6       6.9           6.9        7.0

       China Retail Sales Value YoY      -1.8     -1.1       0.5       3.3           4.3        5.0

       China Export Trade USD YoY        0.5      7.2        9.5       9.9           11.4       21.1

       China Import Trade USD YoY        2.7      -1.4      -2.1      13.2           4.7        4.5

       Caixin China Composite PMI        55.7    54.5       55.1      54.5           55.7       57.5

       Caixin China Services PMI         58.4    54.1       54.0      54.8           56.8       57.8

★ Given the strong economic rebound, as well              upward trend in Chinese equities remains
  as attractive interest rate differentials (likely       intact due to:
  to remain so at least for 1Q21), investors              (1) Attractive interest rate differentials;
  had started to buy up Chinese equities. As a            (2) Compared to other G20 nations who are
  result, on a 10-year forward P/E basis, Chinese             battling surging infections, China kept
  equities are now trading above one standard                 the outbreak under strict control. Thus,
  deviation. While we acknowledge that Chinese                the economy and corporate earnings will
  equities are no longer priced attractively, we              improve comparatively faster.
  believe that in the next three months, the

   Shanghai Composite Index (SHCOMP) Forward P/E Now Trading Above +1SD

                                                                             ★ Data Source: Bloomberg, 2020/12/31

                                                                                                                    8
North Asia: Dollar liquidity a boost for equity markets' performance

★ The pandemic control in South Korea and                                            markets remained strong in 4Q20, rising by
    Taiwan is relatively better than in Europe and                                   23.44% and 17.71% respectively. Taiwan and
    in the U.S.. In addition, the semiconductor                                      South Korean equities will continue to benefit
    industry in the second half of last year saw                                     from the backdrop of global mass vaccination,
    a continued increase in demand, as a result                                      ample liquidity, as well as China's economic
    Taiwanese and South Korean exports (in                                           recovery. Still, investors should also be noted
    particular electronic goods) are still increasing.                               that the temporary demand boost in 2H20
    The Taiwanese economy still able to maintain                                     was partly attributable to the U.S. trade ban
    positive growth even as the global economy                                       on certain Chinese products, so exports may
    contracts. South Korea and Taiwan's equity                                       decline in the near term.

                     South Korea and Taiwan's Exports (Millions, in USD)
                          18,000                                                                                   10,000

                          16,000
                                                                                                                   9,000

                          14,000
                                                                                                                   8,000
                          12,000

                                                                                                                   7,000
                          10,000

                           8,000                                                                                   6,000
                                      Dec-19       Feb-20       Apr-20      Jun-20      Aug-20       Oct-20
                                               Taiwan Export- Electronics       Korea Export- Semiconductor

★ For the past two years, Hong Kong has been                                         brought under control in 1Q21. Easing border
    affected by social unrest and the pandemic,                                      control will bring Hong Kong's economy out of
    hence its economy has fallen into a trough. The                                  the woods. In addition, as the Chinese economy
    economic growth shrunk year-on-year for five                                     grows steadily, the RMB appreciates, cyclical
    consecutive quarters, and the unemployment                                       sectors recover, low valuations and sufficient
    rate has risen to a 15-year high. The Hong Kong                                  liquidity in markets, we are optimistic about the
    government has started to purchase vaccines                                      Hang Seng Index's performance in 1Q21.
    globally. We expect that the outbreak will be

                         Hong Kong's Economic Growth (GDP YoY) (%)
                           6

                           4

                           2

                           0

                           -2

                           -4

                           -6

                           -8

                          -10
                             Sep-16      Mar-17      Sep-17    Mar-18   Sep-18    Mar-19         Sep-19   Mar-20   Sep-20
                                                                   HK GDP YoY Growth

                                                                                                              ★ Data Source: Bloomberg, 2020/12/31

9
Southeast Asia: Regional Comprehensive Economic Partnership (RECP) is
good for regional economic development
★ As the ASEAN-5 (Indonesia, Malaysia, Purchasing Managers' Index (PMI) data has
P h i l i p p i n e s , S i n ga p o re , a n d T h a i l a n d ) also rebounded to near the 50 mark which
have varied outcome from controlling the separates expansionary from contractionary
pandemic as well as economic structures, territory, which indicated that their economies
their economies have also been affected to continued to improve. The International
varying degrees. After experiencing a rapid M o n eta r y Fu n d ' s ( I M F ) O cto b e r 2 0 2 0 ' s
decline in 2Q20, the recently published economic forecast showed that ASEAN-5's
3Q20 data showed that ASEAN-5's economic economic growth (GDP) in 2020 will be -3.4%,
growth all rebounded. In addition, ASEAN-5's but will rebound to 6.2% in 2021.
ASEAN-5 Economic Growth (GDP YoY) (%)
1000 105
850 100
700 95
550 90
400 85
Dec-15 Dec-16 Dec-17 Dec-18 Dec-19 Dec-20
MXSO Index
★ After eight years of negotiations, the Regional of the MSCI AC ASEAN Index is inversely
C o m p r e h e n s i v e E co n o m i c Pa r t n e r s h i p correlated with the U.S. Dollar Index. We expect
(RCEP) was formally signed in November. The the USD to remain weak in 1Q21, which will
agreement covers 15 countries including ASEAN facilitate the inflow of funds into ASEAN and
and China, accounting for nearly 30% of the benefits their currencies and assets. Finally, the
world's population and economy. The RCEP will MSCI ASEAN Index P/B ratio is currently below
benefit trade, investment and consumption in its 10-year historical average, implying current
Asia in the long run. In addition, the performance valuations is attractive.
MSCI AC ASEAN Index vs Dollar Index
10
5
0
-5
-10
-15
-20
Sep-18 Dec-18 Mar-19 Jun-19 Sep-19 Dec-19 Mar-20 Jun-20 Sep-20
Indonesia Malaysia The Phillippines Singapore Thailand
★ Data Source: Bloomberg, 2020/12/31
10Other Emerging Markets: To benefit from weak USD and yield-hunting
despite near-term challenges
★ With multiple positive news on vaccine infections, which include negative impact
development, receding U.S. political risk on demand for commodities (key drivers for
post-elections in November and weakening EM economies). Also, while mass vaccination
U.S. dollar, EM assets continued to receive against Covid-19 started to rollout in some
net inflows and EM equities outperformed countries, the headache of paying for the
DM equities for the second straight quarter. va cc i n e a n d c h a l l e n ge s i n sto ra ge a n d
Nonetheless, we see near-term headwinds distribution are key concerns EM countries
as a result of the global surge in coronavirus faced.
MSCI World Index vs MSCI Emerging Markets Index's quarterly return
MSCI World Index MSCI EM Index
18.8% 17.3% 19.3%
13.6%
7.5% 8.7%
-21.4%
-23.9%
1Q20 2Q20 3Q20 4Q20
★ Despite near-term challenges, we expect EM as expect investors to express greater interest in
a region to continue to enjoy net inflows into EM countries that ride on China's increased
1Q21, as record-breaking stimulus measures focus on domestic demand (e.g. infrastructure
as well as near zero, or even negative interest spend). In addition, investors are likely to
rates triggered the search for higher yield. be concerned with the record-high levels of
EM equities had outperformed DM stocks in debt EM countries have incurred in 2020, a
2H20 due to yield hunting and the rotation consequence of the need to spend to counter
into post-pandemic recovery play. Due to the impact of the pandemic.
the uneven recovery across the region, we
EM Market Debt to GDP (%) and Comparison
IMF Forecast
120%
Brazil
100% World
India
80% EM and Middle-
Income Economies
Mexico
60%
40%
20% Russia
0%
2012 2013 2014 2015 2016 2017 2018 2019 2020 2021 2022 2023 2024 2025
★ Data Source: Bloomberg, 2020/12/31
11Bond Markets: Expect high yield to outperform investment grade fixed
income
★ 2021 is expected to be a year of economic and (Bloomberg Barclays US Treasury Total Return
cyclical sectors recovery, with the progressive Index) fell 0.83% in the last quarter. Also,
vaccination against Covid-19. We expect major central banks (the Fed, ECB) pledged
further spread compression in fixed income. to maintain ultra loose and accommodative
Hence, returns for safe haven assets such as monetary policies. Given:
investment grade bonds and bonds issued by (1) capital markets are still flushed with cash,
DM governments will be less attractive. Option- yet...
adjusted spreads for U.S. investment grade and (2) number of coronavirus infections remained
high yields for example, has fallen to near pre- a concern, we expect yields to rise modestly
pandemic levels. Returns for U.S. Treasuries in investment grade and government bonds.
Bond Performance in Last 3 Months
1000
800
600
400
200
Sep-20 Oct-20 Nov-20 Dec-20
US Corporate HY EM HY (in USD)
★ High yield and EM fixed income outperformed are mindful of the fact that until the pandemic
investment grade and DM issuance in 4Q20, truly abates, default risks for riskier fixed
due to the return of risk-on sentiment in income remains elevated. Hence, we advocate
November. We expect this outperformance selective investments in issuers with resilient
to continue in 1Q21, primarily due to the cash flows. Key downside risks to our call
expected continuation of ultra loose monetary include slower-than-expected achievement in
policies, benign inflation, narrowing of herd immunity and economic recovery.
spreads and the hunt for yield. However, we
High Yield Bond Spreads(bps) Continued to Narrow
base = 100
110
105
100
95
Sep-20 Oct-20 Nov-20 Dec-20
Global Aggregate Global High Yield EM Aggregate (USD)
★ Data Source: Bloomberg, 2020/12/31
12Industry Trends and Outlook
Banking - The worst is probably over
★ The S&P 500 financials sector index recorded outperformed retail banks in 2020 due to
its best quarterly performance in this year sizeable trading revenue as volatility surged
(+18.46% until 16 Dec 2020). We think the while bond issuances were at record highs.
upward momentum should continue in Trading revenues should normalize in 2021
1Q21, partly supported by the resumption while consumer finance such as card fees
of share buybacks by industry leaders, a should recover. However, this outlook is highly
move recently allowed by the Fed. Also, bad dependent on when the pandemic can abate
debts should peak in 2H21 as the economy and herd immunity achieved after widespread
continues to recover. Investment banks had vaccination.
S&P 500 Financials Index
600
500
400
300
200
Dec-19 Feb-20 Apr-20 Jun-20 Aug-20 Oct-20 Dec-20
Consumer Discretionary - Shop selectively for quality
★ Components within the S&P 500 Consumer may take months to reach critical mass,
D i s c ret i o n a r y I n d ex d e l i v e re d a m i xe d thus share prices could have ran far ahead of
performance in 4Q20, mainly due to the fundamentals. Recently-released consumer-
rotation out of stay-at-home stocks (Amazon, related economic data points to the possibility
Home Depot) and into the down-beaten stocks of continued weakened consumer spending in
(Macy's INC, MGM Resorts). The sharp rally in the near term. While the sector is likely to still
the latter meant some of the positive factors rally due to rotation into cyclicals, we advocate
arising from the availability of a vaccine has selective stock-picking on companies with
been factored into the price. It's pertinent resilient cash flows.
to note that vaccination of the population
S&P 500 Consumer Discretionary Index
1400
1200
1000
800
600
Dec-19 Feb-20 Apr-20 Jun-20 Aug-20 Oct-20 Dec-20
★ Data Source: Bloomberg, 2020/12/31
13Technology - Rotation from "stay-at-home" stocks
★ Although the S&P 500 Information Technology positioned to deliver growth post-pandemic,
Index recorded another quarter of gains such as benefitting from the global shift to 5G
(9.70% up till 16 Dec 20), tech equities infrastructure, at more reasonable valuations.
underperformed cyclical names due to the In addition, regulatory pressure on index
rotation away from "stay-at-home" stocks. heavyweight stocks (Facebook , Google,
Also, frothy valuations were less and less Amazon) may dampen sentiment in the near
appealing as investors focused on economic term. We maintain our cautiously optimistic
recovery. We expect investors to focus on view on the sector for 1Q21.
companies whose business models are
S&P 500 Info Technology Sector Index
2400
2050
1700
1350
1000
Dec-19 Feb-20 Apr-20 Jun-20 Aug-20 Oct-20 Dec-20
Energy - Invests selectively in fundamentally strong corporates
★ The S&P 500 Energy Index recorded its largest resulting re-imposition of lockdown measures
quarterly rebound (31.14% up till 17 Dec 20) meant that crude oil demand will remain tepid
on hopes that the availability of a Covid-19 in the near term. Hence, we advocate selective
vaccine will finally result in normalized crude i n v e st m e n ts i n e n e rg y co m pa n i e s t h at
oil demand. Although oil prices recovered to improved operational efficiency, maintained
trade around US$50/bbl, the current global resilient cash flows and brought down capital
surge in coronavirus infections and the structure cost in 2020.
S&P 500 Energy Sector Index
550
450
350
250
150
Dec-19 Feb-20 Apr-20 Jun-20 Aug-20 Oct-20 Dec-20
★ Data Source: Bloomberg, 2020/12/31
14Commodity Trends and Outlook
Crude Oil - Disciplined production cuts to help prices hold around US$50/bbl
★ Crude oil rose sharply in 4Q20 on vaccine quotas in Jan 2021, but lower than the initially
optimism. However, the world's three major planned increase. As long production cuts
oil agencies slashed forecasts for 2021 crude remain disciplined and the new variant of
oil demand, due to the renewed lockdown Covid-19 does not render the currently-
measures in key economies and expected developed vaccines ineffective, Brent crude
persistently weak jet fuel demand. 2021 should be able to maintain near US$50/bbl,
crude oil demand is forecasted to be between as suggested by 1Q21 forward pricing of oil
4.5% to 5% below 2019 levels. OPEC+ in a futures.
recent meeting agreed to increase production
Brent Crude Futures (US$ / bbl)
80
60
40
20
0
Dec-19 Feb-20 Apr-20 Jun-20 Aug-20 Oct-20 Dec-20
Iron Ore - Upward trend remains intact for 1Q21
★ Iron ore had rallied in 4Q20, on the back of steel (in turn driven by Chinese infrastructure
strong Chinese demand. Iron ore also faced boom), and supply disruptions will remain a
supply disruptions and lower supply estimates concern. However, China's steel producers in
from Vale, the world's second largest iron ore December had pushed for a regulatory probe
producer, further raised fears. Vale recently into the sky-high steel prices, which may
curbed its 2020 production guidance and prompt government intervention in the steel
reduced its guidance for 2021. We expect the industry and may result in a more moderate
upward trend for iron ore prices to remain increase in prices.
intact in 1Q21, due to strong outlook for
Iron Ore Futures (CNY$ / MT)
1200
1050
900
750
600
Dec-19 Feb-20 Apr-20 Jun-20 Aug-20 Oct-20 Dec-20
★ Data Source: Bloomberg, 2020/12/31
15Copper - Prices expected to continue trend upwards
★ Copper prices continued to recovery in 4Q20, due to constrained supply factors, increasing
on the back on increased economic activities demand and a weak USD. Copper is the best
globally, and particularly from China, which non-precious metal conductor of electricity and
accounts for nearly half of global copper heat, which makes it an important component
consumption. The surge in prices was also in renewable energy systems. We expect copper
constrained by supply factors, as Chile and prices to trend higher in the mid-to-long term
Peru, the world's largest copper suppliers, faced due to the increased focus on renewable energy,
surging Covid-19 infections. Copper prices is particularly by China.
expected to trend upwards in the near term
Copper Futures (US$ / lb)
400
350
300
250
200
Dec-19 Feb-20 Apr-20 Jun-20 Aug-20 Oct-20 Dec-20
Agriculture - Constrained supply to keep soybean prices high in 1Q21
★ Prices of soybean rose strongly in 4Q20 due pig herds in China recovering after the 2018 –
to supply issues, such as the dry weather and 2019 African Swine Flu outbreak, and also to
strikes by crushers and grain inspectors in comply with the Phase One of U.S.-China trade
Argentina, a major shipper of soy products. deal. We expect soybean prices to remain
Also, the media reported that Russia planned elevated in 1Q21, as dry weather is forecast to
to introduce export duty on soybean continue until Jan 2021 in most parts of South
shipments to cool food-price inflation. On the America, especially in Argentina, which could
demand side, China, the largest importer of mean lower-than-expected soybean supply
soybeans, is set to increase its demand due to from South America in 2021.
Soybean Futures (US$ / bu)
1400
1250
1100
950
800
Dec-19 Feb-20 Apr-20 Jun-20 Aug-20 Oct-20 Dec-20
★ Data Source: Bloomberg, 2020/12/31
16Currency Trends and Outlook
EUR/USD:Resistance:1.30 / Support:1.195
★ The Fed's unlimited quantitative easing policy in its continued appreciation. However,
led to the continued weakness in the USD. more importantly, the USD has entered an
The U.S. Dollar Index once fell below the 90 environment in which the USD is depreciating
mark in 4Q20. EURUSD in 4Q20 rose 4.92% and due to structural factors and is expected
once reached 1.2298. Theoretically speaking, to continue to fall. We expect the euro to
a s t h e E C B a n d t h e E U s i m u l ta n e o u s l y continue to rise against the dollar in 1Q21,
introduced expansionary monetary and fiscal with resistance at 1.30 and support at 1.195.
policies, the euro should face some resistance
EUR/USD
1.40
1.30
1.20
1.10
1.00
Dec-19 Feb-20 Apr-20 Jun-20 Aug-20 Oct-20 Dec-20
GBP/USD:Resistance:1.44 / Support:1.325
★ GBP/USD rose 5.46% in 4Q20, and once reached pandemic, adapting to the new relationship with
a high of 1.3625 as the USD depreciates. The EU the EU, and the BOE may implement negative
and the UK reached a Brexit trade agreement on interest rates to stimulate the economy. We
December 24 last year. The UK avoided a hard expect that the pound will continue to oscillate
Brexit and this resulted in the appreciation of within the range formed since 2016 (the Brexit
the pound. Although this uncertain Brexit factor referendum), with resistance at 1.44 and support
has been resolved, the UK is still facing the at 1.325.
uncertainty of economic reconstruction post-
GBP/USD
1.42
1.34
1.26
1.18
1.10
Dec-19 Feb-20 Apr-20 Jun-20 Aug-20 Oct-20 Dec-20
★ Source: Bloomberg, 2020/12/31
17USD/JPY:Resistance:105 / Support:100
★ In 4Q20, USD depreciated, and JPY has the pressure on the yen to appreciate against
appreciated by 2.17% against the greenback. the USD. At the same time, a strong yen will
The Japanese government approved a record- have a negative impact on export companies.
breaking budget, and the BOJ also maintained Japan's Prime Minister said that he will
an extremely loose monetar y policy and defend the 100 level to avoid continued yen
negative interest rates. However, we believe appreciation which will lead to negative
there is little room for further deepening the economic impact. Therefore, we expect
expansionary policy in future. In addition, resistance level at 105 and support at 100 for
Japan's current account surplus will increase USD/JPY.
USD/JPY
115
110
105
100
95
Dec-19 Feb-20 Apr-20 Jun-20 Aug-20 Oct-20 Dec-20
BTC/USD:Resistance:40,000 / Support:20,000
★ USD depreciated and Bitcoin maintained its environment where global fiat currencies are
strong appreciation and it rose sharply by overprinted, as Bitcoin's recognition improves,
more than 150% in 4Q20. Due to the Fed's the cryptocurrency will continue to rise in
extremely loose monetary policy and U.S. fiscal future. However, investors also need to note
debt concerns, investors grew worried about that Bitcoin holdings and supply are relatively
inflation and USD depreciation have promoted concentrated, which means that price trends
capital inflows into Bitcoin, including many are easily affected or manipulated. In addition,
institutional investors, which also indicates future government regulatory requirements in
B i tco i n i s i n c rea s i n g l y ga i n i n g m a r ket various countries are issues that Bitcoin needs
recognition. We believe that in the current to face squarely.
BTC/USD
3300
2600
1900
1200
500
Dec-19 Feb-20 Apr-20 Jun-20 Aug-20 Oct-20 Dec-20
★ Source: Bloomberg, 2020/12/31
18Currency Trends and Outlook
AUD/USD:Resistance:0.81 / Support:0.73
★ As the USD continues to weaken, the AUD Although China-Australia relations continue
appreciated by 7.32% against the USD in 4Q20. to deteriorate, China's demand for Australian
The latest minutes of the RBA meeting showed i r o n o r e a n d o t h e r r e s o u r ce s r e m a i n s
that the central bank promised to maintain strong. We expect that the Asian economy
interest rates at 0.1% for at least three years including China, will recover steadily in 2021,
and is ready to do more to stimulate the and this will continue to drive Australia's
economy until inflation reach the target economic recovery. With the continued USD
range of 2-3%. For the past 30 years, Asia's depreciation, we expect the AUD to rise in
economic growth has been the main driver of 1Q21, with resistance at 0.81 and support at
Australia's economic growth, especially China. 0.73.
AUD/USD
0.9
0.8
0.7
0.6
0.5
Dec-19 Feb-20 Apr-20 Jun-20 Aug-20 Oct-20 Dec-20
NZD/USD:Resistance:0.75 / Support:0.69
★ Due to the continued weakness in the USD, the eliminated the possibility of negative interest
NZD appreciated by 8.86% against the USD in rates implementation in future, and at the
4Q20. The Fed will continue to maintain low same time reduced the expectations of further
interest rates and quantitative easing policies, easing of monetary policy in the near term. We
which will keep the USD weak. On the contrary, expect that the Bank of New Zealand's interest
due to the continuous rise in New Zealand rate cut cycle may have ended, and the NZD
property prices, the Bank of New Zealand has can continue to rise in 1Q21, with resistance at
listed house prices as one of the central bank's 0.75 and support at 0.69.
considerations. Therefore, the market has
NZD/USD
0.8
0.7
0.6
0.5
0.4
Dec-19 Feb-20 Apr-20 Jun-20 Aug-20 Oct-20 Dec-20
★ Source: Bloomberg, 2020/12/31
19USD/CNY:Resistance:6.60 / Support:6.30
★ China kept the outbreak under control only trade surplus with the U.S. continued
outstandingly and the economy has taken the to increase, overall surplus has also reached
global lead in recovery. The Fed's unlimited a record high. The IMF predicts that China's
quantitative easing policy has led to the economy will grow by 1.2% in 2020 and 8.2%
continued weakness in the USD. The yuan in 2021. In addition, due to the widening gap in
continued to strengthen against the USD in interest rates between China and the U.S., the
4Q20, rising by 3.94%. Although the Sino-US USD is expected to remain weak. We expect
trade war has lasted for more than two years, the RMB to rise steadily in 1Q21. USD/CNY has
China's foreign trade remained strong. Not its resistance at 6.60 and support at 6.30.
USD/CNY
7.6
7.2
6.8
6.4
6
Dec-19 Feb-20 Apr-20 Jun-20 Aug-20 Oct-20 Dec-20
USD/SGD:Resistance:1.345 / Support:1.28
★ T h e US D d e p re c i ate d a n d S G D ro s e b y appreciation of the SGD. Finally, Singapore will
3.08% in 4Q20. We expect the Monetar y also benefit from the Regional Comprehensive
Authority of Singapore (MAS) will maintain Economic Partnership (RECP)'s future regional
a n a cco m m o d at i v e m o n eta r y p o l i c y i n trade and economic activities. In the context
2021. In addition, the A sian region will of the depreciation of the USD, we expect
continue to recover with mass vaccination SGD to still rise in 1Q21 and USD/SGD has its
under way, especially China, which will resistance at 1.345 and support at 1.28.
benefit Singapore's exports and promote the
USD/SGD
1.50
1.45
1.40
1.35
1.30
Dec-19 Feb-20 Apr-20 Jun-20 Aug-20 Oct-20 Dec-20
★ Source: Bloomberg, 2020/12/31
200%
Aggressive Portfolio
30%
Growth
机会型
Income
收益型
70%
Growth
Mutual Fund
Investment Asset CUR Investment mandate Market ISIN
Invests in equity and equity-related securities of
JPMorgan Funds -
USD companies that have their office registered in Brazil LU0318934451
Brazil Equity Fund
Brazil
Invests at least 70% of its assets in shares of
First State China Growth Fund USD companies based in, or closely associated with, China IE0008368742
mainland China
Invests a minimum of 90% of its net assets in
HSBC Global Investment Funds -
USD equities and equity equivalent securities of India LU0066902890
Indian Equity
companies which are based in India
Invests principally in equity securities of
Franklin Templeton Investment Funds -
USD biotechnology companies and discovery Global LU0109394709
Franklin Biotechnology Discovery Fund
research firms mainly located in the US
Corporate Stock / Equity Linked Note (ELN)
Investment Asset CUR Company Description Exchange Ticker
A Singaporean multinational telecommunications
Singtel SGD conglomerate. Provides ISP, IPTV and mobile SGX Z74.SI
phone network and fixed line telephony services
The company's business is focused on online
JD Health HKD health-care services such as consultations with HKSE 06618.HK
doctors, as well as its online pharmacy
The company designs, manufactures, and sells
Micron Technology USD NASDAQ MU.US
memory and storage products worldwide
Income
Corporate Bond
Investment Asset CUR Investment Description Coupon ISIN
Agile Group Holdings Limited USD YTM: 10.649% / Maturity Date: Perpetual 7.875% XS2071413483
Lloyds Bank PLC USD YTM: 11.022% / Maturity Date: Perpetual 12.000% XS0474660676
Indicative YTM for reference only. Actual YTM is based on the quoted price at point of transaction.
Mutual Fund
Investment Asset CUR Investment Mandate Market Ticker
Invests in a combination of common stocks and
Allianz Global Investors Fund -
USD other equity securities, debt securities and USA/Canada LU0689472784
Allianz Income and Growth
convertible securities
Invests globally in the full spectrum of permitted
BlackRock Global Funds -
USD investments including equities, equity-related Global LU0784385840
Global Multi-Asset Fund
securities, fixed income transferable securities
21Balanced Portfolio
20% 机会型
40% Growth
收益型
Income
货币型
Money Market
40%
Growth
Mutual Fund
Investment Asset CUR Investment Mandate Market ISIN
Fidelity Funds - Invests in companies having their head office or exercising a
USD USA LU0077335932
American Growth Fund predominant part of their activity in the US
Mutual Fund
Invests primarily in equities and equity-related securities of
Investment Asset
Eastspring Investments - CUR Investment Mandate Market ISIN
USD companies, which are incorporated, listed in or have their area Asia LU1522347837
Asian Low Volatility
Fidelity Funds - Equity Fund Invests in companies having their head office or exercising a
USD of primary activity in the Asia Pacific ex-Japan Region USA LU0077335932
American Growth Fund predominant part of their activity in the US
Mutual Fund Invests at least two-thirds of its assets in equity securities of
Franklin Templeton Investment Funds Invests primarily in equities and equity-related securities of
Investment
Eastspring Asset
Investments - USD
CUR companies
Investmentexpected
Mandate to benefit from the development, Global
Market LU0109392836
ISIN
Franklin Technology Fund USD companies, which are incorporated, listed in or have their area Asia LU1522347837
Asian
FidelityLow Volatility
Funds - Equity Fund advancement and
Invests in companies usehaving
of technology
their head office or exercising a
USD of primary activity in the Asia Pacific ex-Japan Region USA LU0077335932
American Growth Fund predominant part of their activity in the US
Exchange Traded Fund
Invests at least two-thirds of its assets in equity securities of
Franklin Templeton
Investment Asset Investment Funds CUR Investment
Invests Mandate
primarily in equities and from
equity-related securities of Market Ticker
Eastspring Investments - USD companies expected to benefit the development, Global LU0109392836
Franklin Global
Technology
CleanFund USD companies, which are
iShares Energy ETF
Asian Low Volatility Equity Fund
Tracks the S&P
advancement and useincorporated,
Global Clean
of Energylisted
technology indexin or have their area Asia
Global LU1522347837
ICL N US
Global X Lithium & Battery Tech ETF of primary
USD Tracks the activity in the
Solactive AsiaLithium
Global Pacific Index
ex-Japan Region Global LIT US
Exchange Traded Fund
Corporate Bond
Franklin Templeton Investment Funds
Invests at least two-thirds of its assets in equity securities of
Investment Asset CUR Investment Mandate Market Ticker
Income
Investment Asset Fund USD
CUR companies expected
Investment to benefit from the development,
Description Global
Coupon LU0109392836
ISIN
Franklin Global
iShares Technology
Clean Energy ETF USD Tracks the S&P Global Clean Energy index Global ICL N US
advancement and use of technology
FWD Ltd USD YTM: 5.660% / Maturity Date: Perpetual 6.250% XS1520804250
Global X Lithium & Battery Tech ETF USD Tracks the Solactive Global Lithium Index Global LIT US
Vodafone
Exchange Group PLC Fund
Traded USD YTM: 5.497% / Maturity Date: 2078.10.03 6.250% XS1888180640
Corporate Bond Group, Inc.
American International USD YTM: 5.004% / Maturity Date: 2037.03.15 6.250% US026874BE68
Investment Asset CUR Investment Mandate Market Ticker
Investment AssetYTM for reference only.
Indicative CUR Investment
Actual Description
YTM is based on the quoted price at point of transaction. Coupon ISIN
iShares Global Clean Energy ETF USD Tracks the S&P Global Clean Energy index Global ICL N US
FWD Ltd USD YTM: 5.660% / Maturity Date: Perpetual 6.250% XS1520804250
Exchange
Global Traded
X Lithium Fund
& Battery Tech ETF USD Tracks the Solactive Global Lithium Index Global LIT US
Vodafone Group PLC USD YTM: 5.497% / Maturity Date: 2078.10.03 6.250% XS1888180640
Investment Asset
Corporate Bond Group, Inc. CUR Investment Type Market ISIN
American International USD YTM: 5.004% / Maturity Date: 2037.03.15 6.250% US026874BE68
SPDR Bloomberg Barclays High Yield Tracks the Bloomberg Barclays High Yield Very Liquid Bond
Indicative
Investment AssetYTM for reference only.
CUR
USDActual YTM is based
Investment on the quoted price at point of transaction.
Description Coupon
Global ISIN
JNK US
Bond ETF Index
FWD Ltd USD YTM: 5.660% / Maturity Date: Perpetual 6.250% XS1520804250
Exchange Traded
Invesco Emerging Fund
Markets Sovereign Tracks the DBIQ Emerging Markets USD Liquid Balanced
Global PCY US
Vodafone Group PLC USD YTM: 5.497% / Maturity Date: 2078.10.03 6.250% XS1888180640
Debt ETF Asset
Investment Index
CUR Investment Type Market ISIN
American International Group, Inc. USD YTM: 5.004% / Maturity Date: 2037.03.15 6.250% US026874BE68
SPDR Bloomberg
MutualIndicative Barclays High Yield
Fund YTM for reference only. Tracks the Bloomberg Barclays High Yield Very Liquid Bond
USDActual YTM is based on the quoted price at point of transaction. Global JNK US
Bond ETF Index
Investment Asset CUR Investment Type Market ISIN
Exchange Traded
Invesco Emerging Fund
Markets Sovereign Tracks the DBIQ Emerging Markets USD Liquid Balanced
USD Invests primarily in RMB denominated and settled fixed-rate Global PCY US
CSOP
Debt RMB Asset
ETF
Investment Money Market ETF CNY
CUR Index
Investment Type China
Market 3122.HK
ISIN
bonds
SPDR Bloomberg
Mutual Fund Barclays High Yield Tracks the Bloomberg Barclays High Yield Very Liquid Bond
USD Global JNK US
Bond ETF Index
Money Market
Investment Asset CUR Investment Type Market ISIN
Invesco Emerging Markets Sovereign Tracks the DBIQ Emerging Markets USD Liquid Balanced
USD Invests primarily in RMB denominated and settled fixed-rate Global PCY US
CSOPETF
Debt RMB Money Market ETF CNY Index China 3122.HK
bonds
Mutual Fund
Investment Asset CUR Investment Type Market ISIN
Invests primarily in RMB denominated and settled fixed-rate
CSOP RMB Money Market ETF CNY China 3122.HK
bonds
22Conservative Portfolio
30% 收益型
Income
Money
货币型 Market
70%
Income
Corporate Bond
Investment Asset CUR Investment Description Coupon ISIN
BNP Paribas SA USD YTM: 4.310% / Maturity Date: Perpetual 5.125% USF1R15XK771
China Water Affairs Group Ltd USD YTM: 4.216% / Maturity Date: 2022.02.07 5.250% XS1556165477
Indicative YTM for reference only. Actual YTM is based on the quoted price at point of transaction.
Mutual Fund
Investment Asset CUR Investment Mandate Market ISIN
Invests principally in a portfolio of fixed or floating rate
Franklin Templeton Investment Funds -
USD debt securities and debt obligations issued by Global LU0252652382
Templeton Global Bond Fund
government or government-related issuers worldwide
Invests mainly in higher yielding, lower-rated (below
Investment Grade) securities of issuers located
AB - Global High Yield Portfolio USD Global LU0081336892
throughout the world, including developed and
emerging market countries
Invests primarily in investment grade fixed income
Fidelity Funds -
USD securities of issuers that have their principal business Asia LU0605512432
Asian Bond Fund
activities in the Asian region
JPMorgan Funds -
Invests primarily in emerging market local currency
Emerging Markets Local Currency Debt USD EM LU0356473412
debt securities, using derivatives where appropriate
Fund
Exchange Traded Fund
Investment Asset CUR Investment Mandate Market ISIN
SPDR Bloomberg Barclays Convertible Tracks the Bloomberg Barclays U.S. Convertibles
USD USA CWB US
Securities ETF Liquid Bond Index
Invesco International Corporate Bond
USD Tracks the S&P International Corporate Bond Index Global PICB US
ETF
Vanguard Intermediate - Tracks the Bloomberg Barclays U.S. Treasury 3-10
USD USA VGIT US
Term Treasury ETF Year Index
Tracks the Bloomberg Barclays U.S. Treasury Inflation
iShares TIPS Bond ETF USD USA TIP US
Protected Securities (TIPS) Index (Series-L)
Money Market
Mutual Fund
Investment Asset CUR Investment Type Market ISIN
Invests in short-term liquid assets denominated in
Fullerton SGD Cash Fund SGD Singapore SG9999005961
SGD
Invests in principally in USD denominated debt United
Fidelity US Dollar Cash Fund USD LU0064963852
securities States
23Quarterly Discussion Theme
Hong Kong IPO: current situation vs opportunity
Many newly-listed stocks recorded attractive gains in the recent bull market. Hence, many investors regard
investing in initial public offering (IPO) as a great way to make some quick cash in a short period of time.
Hong Kong is the most active IPO market
The clash between China and the U.S. with regards to supervision and regulation of listed companies is a long-
running dispute. As relations between China and the U.S. grew tense, this dispute has further intensified. In May
2020, the U.S. Senate passed the "Foreign Companies Accountable Act" unanimously, which raised concerns
that Chinese companies may be "collectively delisted".
On the contrary, the Hong Kong Stock Exchange (HKEX) revised listing rules to allow "weighted voting rights",
thus successfully attracted Xiaomi and other companies to list in Hong Kong. At the same time, the newly
established and convenient secondary listing channel accepts Greater China as well as foreign companies to use
Hong Kong as a location for secondary listing. The HKEX even announced that companies who use Hong Kong
as a secondary listing is allowed to be included in the Hang Seng Index.
Through observation, we noticed that the option taken up by Chinese companies is: retaining its primary listing
in the U.S. while adding a secondary listing in Hong Kong. These companies include Alibaba, JD, NetEase, etc.
which had successfully listed for the second time in Hong Kong. In addition, there are 34 Chinese companies
qualified for secondary listing in Hong Kong, many of which have already kickstarted the process. After these
companies completed their secondary listing in Hong Kong, it is possible that they will gradually increase their
Hong Kong listing's transaction volumes and eventually delist from the U.S. market. As such, Hong Kong will
become the biggest beneficiary in the process. Currently, the level of IPO activities on the HKEX is comparable
with the New York Stock Exchange (NYSE). Should more than 30 Chinese companies re-list in Hong Kong, this
will bring more than US$500 billion worth of capital and will strengthen Hong Kong as an Asian financial hub.
Also, the Hang Seng Index announced that it will include companies with "weighted voting rights" and
companies with secondary listing as constituent stocks, and this was implemented as early as August 2020.
Therefore, Chinese technology giants such as Xiaomi and Alibaba will be allowed to be included in the index.
This reform reflects the increasingly important role technology companies have in markets and will encourage
more large technology companies to list on the HKEX.
The more popular the IPO, the greater the potential reward
Generally speaking, the lot winning rate for bidding Hong Kong-listed IPO is higher than that of Taiwan shares
and China A-shares. This is because Hong Kong implement a fair distribution mechanism that first try to ensure
that every bidder gets a lot, and the remaining shares are distributed on a decreasing basis. Should the IPO is
of higher quality, as more investors bid, the lot winning rate will also decrease as a result. If the subscription
multiple is higher (the lot winning rate is lower), this means investors are interested in the IPO, and the
probability that the share price will rise on the first day of trading will also be higher. The subscription multiple
can be used as a gauge on whether the IPO draws investors' attention.
% stocks with
Lot winning % stocks with % stocks that
gains on first Largest jump Largest drop No. of stocks
Rate > 10% gain fell < 10%
day of trading
100% 45.4% 12.1% 166.7% 29.1% -28.7% 141
75 - 100% 57.9% 26.3% 37.1% 26.3% -12.0% 19
50 - 75% 56.1% 24.4% 58.7% 14.6% -24.2% 41
25 - 50% 65.2% 52.2% 56.4% 17.4% -35.6% 23
≤ 25% 69.8% 46.5% 152.4% 14.0% -26.7% 43
Source: BBC News / Bloomberg
24Quarterly Discussion Theme
Hong Kong IPO: current situation vs opportunity
How to maximise returns on HK IPO
Source: Bloomberg
According to our observations on Hong Kong IPOs' performance in the past few years post-listing, we discovered
the following:
•The probability of locking-in profits on the first day of trading is usually high.
•The probability of making a profit on large caps is relatively stable.
•The potential gains on investing in small caps is higher.
Large caps are usually companies with larger revenues, higher transaction volumes and bigger market
capitalizations when listed. Such companies usually already have stable revenue and company's growth rates.
As capital usually flows into large caps, therefore, even if the shares of large caps are sold some time after listing,
there is still a higher chance of achieving positive returns. On the other hand, small caps, because they are
priced lower and have smaller market capitalization, their share prices can easily be manipulated by investors
who own sizeable capital (such as market makers). Although there is an opportunity to achieve eye-popping
returns, investors should avoid investing in such IPOs if they seek stable returns.
However, the most important thing is the timing of exit. Generally speaking, selling on the first day of listing will
ensure high liquidity while obtaining high returns, which can avoid possible future fluctuations in the secondary
market. In order to obtain the best return with limited risks, however, we should also observe the market
conditions and investment atmosphere at the time to determine the best timing to sell individual stock.
What are the other ways to further optimize returns on Hong Kong's IPOs?
Answer:
Look at the prospectus of Hong Kong listed companies, the sponsor and green shoe option to further select
stocks whose their share prices have a high probability of increasing, and at the same time eliminate poor
companies with questionable quality and who only wish to take money from investors.
The "green shoe mechanism" (also known as green shoe option) is a commonly-used term for over-allotment
option, which allows underwriters to sell more shares to investors than what the issuer originally planned. The
main purpose is to ensure the stability and liquidity of the offer price. Lead underwriters can stabilize prices by
increasing or decreasing the number of shares outstanding on the secondary market. If the share price rose after
listing: an increased number of shares outstanding can alleviate the supply shortage and stabilize the share
price. If the share price fall beyond a certain price level after listing: the underwriter can buy back the shares and
the buy order can play a role in supporting the share price.
25Quarterly Discussion Theme
Hong Kong IPO: current situation vs opportunity
The process of participating in a HK IPO and allotment ratio
Success Rate Participation Locked-in Period Remarks
Difficulty Level
Yes, usually six
Cornerstone months
investor High High Advance payment
or longer
PI* status / invest
Anchor investor Medium / Low Medium None at least HK$30
million
Margin trading
Public Offer Low Low None
allowed
*PI: Professional Investors
There are usually two types to a Hong Kong IPO: international placement and public offering. Under normal
circumstances, international placements account for 90% and public offerings account for 10%. Only institutional
investors and professional investors can participate in the international allotment, with certain thresholds.
Ordinary investors can participate in the public offering.
The international placement is then divided into cornerstone and anchor investors. The difference between the
two as well as retail investors participating in the public offering is explained in the table above.
Anchor investment, also known as anchor order, is one of the ways to participate in the IPO primary market.
This refers to the clear expression of intent to invest during the inquiry stage and to place the order after the
roadshow and bookkeeping process begin and before conclusion. The offer price anchor investors receive is the
same as the IPO price. The price of a high-quality IPO usually rises sharply on the first day of trading, and anchor
investors can sell post-listing, earning the price difference between the primary and secondary markets.
Anchor investors have the following advantages:
•Higher share of allotment: Institutional investors who are anchor investors place larger-sized orders. Hence,
their allocation is better than retail investors, and share allotment is much higher than that of retail investors.
•Earlier commencement of subscription process: Compared with retail investors, the process of anchor
investment usually commenced several months before the IPO, effectively avoiding problems such as laggard
information and investors can take advantage of the ideal opportunity to invest.
•Strict screening-process and reasonable risk-management: Anchor investors select high-quality targets
after rigorously screening and researching, thereby reducing the risk of investing in the secondary market.
In contrast, traditional retail investors often have very low odds of receiving the distributed shares, and
the probability for retail investors is much lower than that of anchored investors. Even if there is successful
allocation, retail investors will usually receive only one or two lots, which is far from meeting the expected
allocation ratio, and affects investment returns. Moreover, compared with anchor investors, retail investors will
not be able to grasp ideal investment opportunities in time due to market barriers, laggard information etc., and
only start investment preparations nearer to the IPO process, which may lead to an unsuccessful investment and
eventually missed the boat.
If there are few newly-issued shares, the chance of a successful allotment for retail investors will be even lower.
Hence, many retail investors will use margin financing offered by banks or brokerages, to increase the chance
of a successful allotment. When it comes to margin trading, the cost of IPO subscription for retail investors will
become more complicated, as margin trading incurs interest costs. Even if the final outcome is unsuccessful,
retail investors still must repay the interest on the loan.
IPO Funds – a simpler way to invest
Recently, more and more investors choose to invest in IPO funds. The advantage is that the funds can use the
advantage of scale to establish relationships with sponsors or IPO underwriters (investment banks or securities
companies), in order to participate in anchor investment prior to the start of enquiry or roadshow process, and
receive a larger share of the issuance. There are also some funds that can obtain financing at a lower cost to
increase leverage, and increase the allotment success rate during the public offering stage, and increase the
share of the allotment. In addition, the fund's investment research team can obtain the expected IPO issuance
schedule in advance, evaluate stock selection professionally and execute exit strategies, and can continue to
participate in IPOs with higher potential gains, increase the investment turnover ratio, thereby increasing the
rate of return.
26You can also read