HICL Infrastructure PLC - Interim Results Presentation: six months to 30 September 2019
←
→
Page content transcription
If your browser does not render page correctly, please read the page content below

HICL Infrastructure PLC
Interim Results Presentation: six months to 30 September 2019
20 November 2019

                                                                hicl.com |
Important information

For Investment Professionals (as defined under FSMA 2000). Individuals without professional experience in matters relating to investments
should not rely on this information
By attending the meeting where this presentation is made, or by reading the presentation slides, you agree to be bound by the following limitations:

This document contains information provided solely as an update on the financial condition, results of operations and business of HICL Infrastructure PLC and their respective operations. This
document has not been approved by a person authorised under the Financial Services and Markets Act 2000 ("FSMA") for the purposes of section 21 FSMA. The contents of this document are not a
financial promotion and none of the contents of this document constitute an invitation or inducement to engage in investment activity. If and to the extent that this document or any of its contents are
deemed to be a financial promotion, HICL (“HICL” meaning HICL Company Limited prior to 31 March 2019 and HICL Infrastructure PLC from 1 April 2019 onwards) is relying on the exemption provided
by Article 69 of the Financial Services and Markets Act 2000 (Financial Promotions) Order 2005/1529 in respect of section 21 FSMA. The recipients of this presentation should not engage in any
behaviour in relation to financial instruments which would or might amount to an offence under the Market Abuse Regulation (EU) No. 596/2014.
No representation or warranty, express or implied, is made as to, and no reliance should be placed on, the fairness, accuracy, completeness or correctness of the information, or opinions contained
herein. Neither HICL, nor any of HICL's advisers or representatives, including its investment manager, InfraRed Capital Partners Limited, shall have any responsibility or liability whatsoever (for
negligence or otherwise) for any loss howsoever arising from any use of this document or its contents or otherwise arising in connection with this document. The information set out herein may be
subject to updating, completion, revision, verification and amendment and such information may change materially. Neither HICL nor any other person is under an obligation to keep current the
information contained in this document.

This document has not been approved by the UK Financial Conduct Authority or any other regulator. This document does not constitute or form part of, and should not be construed as, an offer,
invitation or inducement to purchase or subscribe for any securities nor shall it or any part of it form the basis of, or be relied upon in connection with, any contract or commitment whatsoever. This
document does not constitute a recommendation regarding the securities of HICL.

The publication and distribution of this document may be restricted by law in certain jurisdictions and therefore persons into whose possession this document comes or who attend the presentation
should inform themselves about and observe any such restrictions. Any failure to comply with these restrictions could result in a violation of the laws of such jurisdiction. In particular, this document and
the information contained herein, are not for publication or distribution, directly or indirectly, to persons in the United States (within the meaning of Regulation S under the US Securities Act of 1933, as
amended (the "Securities Act")) or to entities in Canada, Australia or Japan. The securities of HICL have not been and will not be registered under the Securities Act and may not be offered or sold in
the United States except to certain persons in offshore jurisdictions in reliance on Regulation S. Neither these slides nor any copy of them may be taken or transmitted into or distributed in Canada,
Australia, Japan or any other jurisdiction which prohibits the same except in compliance with applicable securities laws. Any failure to comply with this restriction may constitute a violation of the United
States or other national securities laws. In EU member states, HICL’s shares will only be offered to the extent that HICL: (i) is permitted to be marketed into the relevant EEA jurisdiction; or (ii) can
otherwise be lawfully offered or sold (including on the basis of an unsolicited request from a professional investor).

An investment in HICL will involve certain risks. This presentation and subsequent discussion may contain certain forward looking statements with respect to the financial condition, results of operations
and business of HICL and its corporate subsidiaries. These forward-looking statements represent HICL’s expectations or beliefs concerning future events and involve known and unknown risks and
uncertainty that could cause actual results, performance or events to differ materially from those expressed or implied in such statements. HICL’s targeted returns are based on assumptions which
HICL considers reasonable. However, there is no assurance that all or any assumptions will be justified, and HICL’s returns may be correspondingly reduced. In particular, there is no assurance that
HICL will achieve its distribution and IRR targets (which for the avoidance of doubt are targets only and not profit forecasts). There can be no assurance that HICL will achieve comparable results to
those contained in this document, that any targets will be met or that HICL will be able to implement its investment strategy. Additional detailed information concerning important factors that could cause
actual results to differ materially is available in HICL Guernsey’s Annual Report for the year ended 31 March 2019 available from HICL's website. Unless otherwise stated, the facts contained herein are
accurate as at 30 September 2019.

Past performance is not a reliable indicator of future performance

                                                                                                                                                                                              hicl.com | 2
Agenda

Section                                                                                                                              Page
Investment Proposition                                                                                                                 4

Interim Results                                                                                                                        6

Valuation Overview and Sensitivities                                                                                                   9

Portfolio Performance and Asset Management                                                                                             14

Investment Activity                                                                                                                    21

Risk and Risk Management                                                                                                               23

Market, Outlook and Concluding Remarks                                                                                                 26

Appendices                                                                                                                             29

HICL’s entire investment business was transferred from HICL Infrastructure Company Limited (“HICL Guernsey”) to HICL Infrastructure PLC (the
“Company”) on 1 April 2019, by way of a scheme of arrangement as detailed in HICL Guernsey’s Prospectus dated 4 March 2019. To enable an
improved assessment of the Company’s investment business comparative data in the below section (for the six months to 30 September 2018, and
as at 31 March 2019) relates to HICL Guernsey, being the owner of HICL’s investment business until 1 April 2019. All financial information from 1
April 2019 relates to the Company. Throughout “HICL” means HICL Infrastructure Company Limited prior to 31 March 2019 and HICL Infrastructure
PLC from 1 April 2019.

                                                                                                                                     hicl.com | 3
Sustainable Business Model Delivers Long-term Income
HICL is differentiated, delivering core infrastructure investment characteristics

                      DELIVERING SUSTAINABLE INCOME FROM A DIVERSIFIED PORTFOLIO OF
                 CORE INFRASTRUCTURE INVESTMENTS AT THE LOWER END OF THE RISK SPECTRUM

                                                                                                        Outperformance
                                                                                                        Enhance communities’

       Low single asset
                                                                 46       %                             experience of infrastructure
                                                                                                        and improve financial
                                                    Ten largest assets as a                             performance                                                            Resilience
       concentration risk                           proportion of portfolio
                                                                                                                                                                               A sustainable
                                                  value at 30 September 2019
                                                                                                                                                                               portfolio of
                                                                                                                                                                               investments that
                                                                                                                                                                               benefits from a

       Strong inflation
                                                                 0.8                                                                                                           strong, long-term
                                                                                                                                                                               social purpose
                                                     Correlation of portfolio
       correlation                                    returns to inflation2
                                                     at 30 September 2019

       Good cashflow
                                                             28.5           yrs
                                                     Weighted avg asset life
       longevity                                     at 30 September 2019                                     Active management
                                                                                                              Deliver well-maintained
                                                                                                              infrastructure for end users and
                                                                                                              generate base case cash flows

1. If outturn inflation was 1% p.a. higher than the valuation assumption in each and every forecast period, the expected return from the portfolio (before Group expenses) would     hicl.com | 4
   increase by 0.8%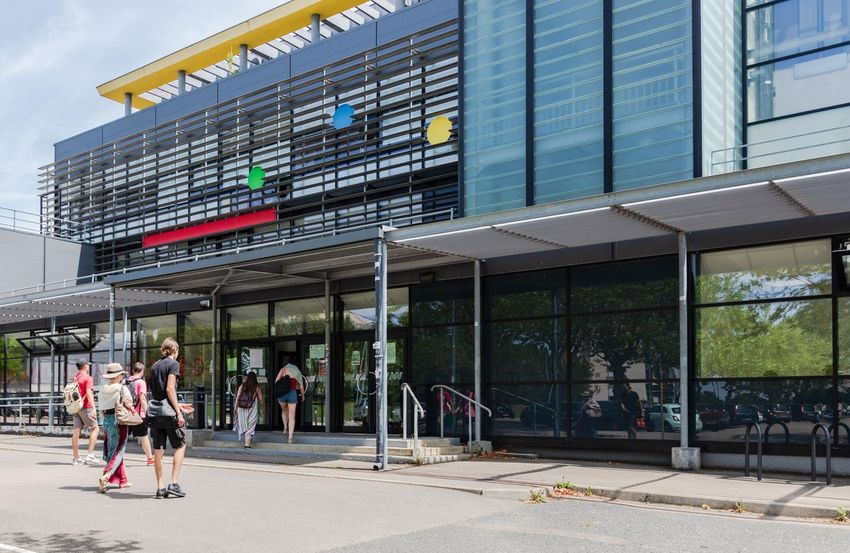
HICL’s Track Record1
 Consistent delivery over 13 years

                                          Dividend increased by 32% over 12 years                                              Total Return (NAV growth and dividends) of 9.3% p.a. since IPO
     9.0p
                                                                                                                 250p
     8.0p
     7.0p                                                                                                        200p
     6.0p
     5.0p                                                                                                        150p

     4.0p
                                                                                                                 100p
     3.0p
     2.0p                                                                                                             50p
     1.0p
     0.0p                                                                                                                      0p
                               IPO FYE FYE FYE FYE FYE FYE FYE FYE FYE FYE FYE FYE FYE FYE FYE FYE                                    IPO   FYE FYE FYE FYE FYE FYE FYE FYE FYE FYE FYE FYE FYE HYE
                                   Mar Mar Mar Mar Mar Mar Mar Mar Mar Mar Mar Mar Mar Mar Mar Mar                                          Mar Mar Mar Mar Mar Mar Mar Mar Mar Mar Mar Mar Mar Sep
                                    07 08 09 10 11 12 13 14 15 16 17 18 19 20 21 22                                                          07  08  09  10  11  12  13  14  15  16  17  18  19  19
                                      Dividends Paid   Dividends Declared   Dividend Target 2                                                     NAV per Share                Cumulative Dividends

                            HICL has outperformed FTSE All Share while offering a low beta                                                  Growing dividend has maintained a 4 - 6% yield

                            400p                                                                    3                           190p                                                                   12 p / %
                            350p                                                                                                170p                                                                   11 p / %
                                                                                                    2.5

                                                                                                                                                                                                                  Div per share / Div Yield
  Cumulative Total Return

                            300p                                                                                                                                                                       10 p / %
                                                                                                                                150p
                                                                                                    2                                                                                                  9p/%
                            250p

                                                                                                                 Share Price
                                                                                                                                130p
                                                                                                          Beta
                                                                                                                                                                                                       8p/%
                            200p                                                                    1.5
                                                                                                                                110p                                                                   7p/%
                            150p
                                                                                                    1                                                                                                  6p/%
                            100p                                                                                                    90p
                                                                                                                                                                                                       5p/%
                                                                                                    0.5                             70p
                             50p                                                                                                                                                                       4p/%
                              0p                                                                    0                               50p                                                                3p/%

                                                                                                3                                                                                                          4
                                   HICL TSR (LHS)      FTSE All Share TSR (LHS)         HICL Beta (RHS)                              HICL Share Price (LHS)       HICL Div p/share (RHS)      HICL Div Yield (RHS)
Source: InfraRed, Thomson Reuters Datastream.                                                              3. 250-day rolling beta                                                       hicl.com              | 5
1. HICL Infrastructure Company Limited prior to 31 March 2019, HICL Infrastructure PLC from 1 April 2019 4. Dividend yield calculated based on historic dividend paid (shown on the
2. This is a target only and not a profit forecast. There can be no assurance that this target will be met    graph in purple) divided by prevailing share price (shown on the graph in red)
                                                                      Past performance is not a reliable indicator of future performance
Interim Results

                  hicl.com |
Strategic Focus
Delivering sustainable income from a diverse portfolio of core infrastructure investments

 Performance                   ▲ Resilient portfolio performance underpinning continued NAV growth despite headwinds
                                       ▪   NAV growth of 0.3p per share to 157.8p for the six months to 30 September 2019 1
                                       ▪   Solid cash flow, with dividend cover of 1.05x (1.06x at September 2018)

 Portfolio                     ▲ Two accretive investments further increase portfolio diversification:
 optimisation                          ▪   Investment in the in-construction Blankenburg Connection PPP project (the Netherlands) was
                                           finalised in the period
                                       ▪   Race Bank OFTO, which supplies renewable energy from offshore windfarms to the UK grid,
                                           reached financial close following the period end

                               ▲ Two strategic disposals announced after the period end, which take advantage of favourable market
                                   conditions, to enhance portfolio metrics and deliver additional shareholder value

 Sustainable                   ▲ On track to target dividend of 8.25p for the year to 31 March 2020, with 4.12p in dividends
 dividend                          announced to date
                               ▲ Predictable, stable cashflows from HICL’s portfolio allow the Board to announce further dividend
                                   guidance2; 8.65p per share for the year to 31 March 2022

 Outlook                       ▲ The Investment Manager continues to progress a healthy pipeline of core infrastructure
                                   opportunities

1. Past performance is not a reliable indicator of future performance                                                          hicl.com | 7
2. This is a target only and not a profit forecast. There can be no assurance that this target will be met
Performance Highlights
Resilient performance for the six months to 30 September 2019

                                                                                                                           New Dividend Guidance2,4
                      157.8p                                                         5.7%                                8.65p for 2022
                      NAV per share                                    Annualised Shareholder Return1

      Up 0.3p from 157.5p at 31 March 2019                                  15.0% for the six months to                  Reaffirmed Dividend Guidance2,4
                                                                               30 September 2018                                 8.45p for 2021
                                                                                                                                 8.25p for 2020

                         7.1%                                                       1.09%                                           1.05x
         Weighted average discount rate                                       Ongoing charges ratio3                           Dividend cash cover

                 7.2% at 31 March 2019                                      1.09% for the six months to                    1.06x at 30 September 2018
                                                                               30 September 2018

1. Based on interim dividends paid plus uplift in NAV per share in the period      4. This is a target only and not a profit forecast. There can be   hicl.com | 8
2. Expressed in pence per ordinary share for financial years ending 31 March
3. Calculated in accordance with Association of Investment Companies’ guidelines      no assurance that this target will be met
                                                  Past performance is not a reliable indicator of future performance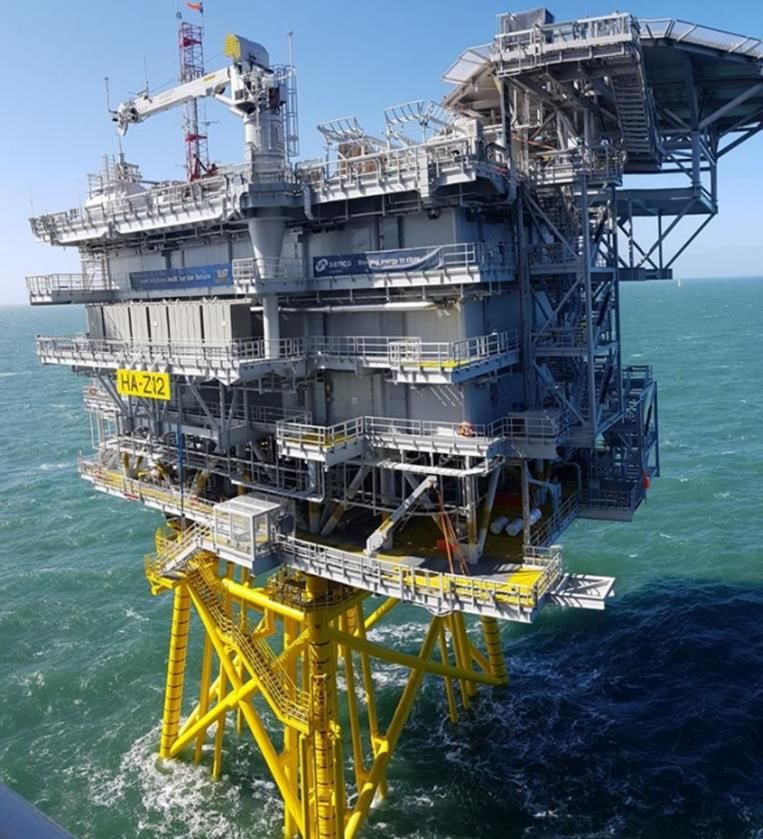
Valuation Overview and
Sensitivities

                         hicl.com |
Portfolio Overview – Cash Flow Profile1,2,3

          ▲                          Forecast shows steady long-term cash flows combined with a stable portfolio valuation in the medium term
          ▲                          Portfolio cash flows underpin two years of forward dividend guidance

                                   400                                                                                          The valuation of the Current Portfolio (RHS)         4,000
                                                                                                                                at any time is a function of the present value
                                                                                                                                of the expected future cash flows1,2,3
                                   350                                                                                                                                               3,500
 Annual project distributions £m

                                   300                                                                                                                                               3,000

                                                                                                                                                                                             Portfolio value £m
                                   250                                                                                                                                               2,500

                                   200                                                                                                                                               2,000

                                   150                                                                                                                                               1,500

                                   100                                                                                                                                               1,000

                                    50                                                                                                                                               500

                                     0                                                                                                                                               0
                                         2020   2022   2024   2026   2028   2030   2032   2034   2036      2038   2040   2042   2044     2046     2048     2050    2052     2054
                                                                                            HICL Year Ending 31 March

                                                       Forecast Portfolio Cashflows September 2019 (LHS)                  Portfolio Valuation September 2019 (RHS)

1. The illustration represents a target only at 30 September 2019 and is not a profit forecast. There can be no assurance                                                          hicl.com | 10
   that this target will be met
2. Valuation considers cash flows beyond 2054, for example for Northwest Parkway 87 years of cash flows are assumed
3. Subject to certain other assumptions, set out in detail in HICL’s Interim Report for the six months to 30 September 2019
Analysis of Change in Directors’ Valuation
Directors’ Valuation of £2,966.2m as at 30 September 2019
2,998.9 2.1 (51.8) 2
£3,000m (95.2) 2,966.2
113.2 (39.9) (2.0) 26.4
2,854.0 12.2
£2,800m
£2,600m
Value Enhancement
Accretive Investment Value Preservation
£2,400m
2,909.6
2,889.3
£2,200m 2,779.4
£2,000m
Future commitments
£1,800m
4.1% (1.4%) 0.4% (0.1%) 1.0%
£1,600m 1
31-Mar-19 Investments Divestments Cash Rebased Return Affinity Change in Change in Forex gain 3 30-Sep-19
Valuation distributions valuation Water discount rate economic Valuation
assumptions
▲ Valuation blocks (purple) have been split on an Investment Basis2 into investments at fair value (dark purple) and future
commitments (light purple)
▲ The percentage movements have been calculated on the Rebased Valuation as this reflects the returns on the capital employed
in the period
1. “Return” comprises the unwinding of the discount rate and portfolio outperformance, excluding the impact of changes in economic assumptions and discount rates, other than hicl.com | 11
project specific changes such as projects moving from construction to steady-state operations
2. £2,966.2m excludes Health & Safety Labs and Enniskillen Hospital PPP projects, which exchanged on 27 September 2019 and are due to complete by the end of the year, and reconciles, on an
Investment Basis, to £2,889.3m Investments at fair value through £76.9m of future commitments
3. FX movement net of hedging is a gain of £15.8mDiscount Rate Analysis
0.1% reduction in weighted average discount rates from 31 March 2019
▲ Discount rates for investments range between
Total Discount Rate3
6.2%1 and 9.3% Appropriate
Long-Term Risk
▲ UK discount rate up 0.1% compared to 31 Government Premium 30 31 30
March 2019 due to a rise in the discount rate Bond Yield2 September March September
2019 2019 2018
applied to Affinity Water’s valuation
UK 0.9% + 6.2% = 7.1% 7.0% 7.1%
▲ Eurozone discount rate down 0.2% due to
government bond yield decreases Eurozone 0.1% + 7.0% = 7.1% 7.3% 7.2%
▲ North American discount rate down 0.2% due N. America 1.8% + 6.0% = 7.8% 8.0% 8.0%
to observed transactional activity in Canada
that implies a reduction in risk premiums Portfolio 0.9% + 6.2% = 7.1% 7.2% 7.2%
10%
8%
6%
4%
2%
0%
Mar Sep Mar Sep Mar Sep Mar Sep Mar Sep Mar Sep Mar Sep Mar Sep Mar Sep Mar Sep Mar Sep Mar Sep Mar Sep Mar Sep
06 06 07 07 08 08 09 09 10 10 11 11 12 12 13 13 14 14 15 15 16 16 17 17 18 18 19 19
Average Long-Term Government Bond Yield Average Risk Premium
1. Excludes A13 Senior Bonds hicl.com | 12
2. The long-term government bond yield for a region is the weighted average for all of the countries in which the portfolio is invested in that region. Source: Bloomberg
3. Weighted-average discount rateKey Valuation Sensitivities
Sensitivity to key macroeconomic assumptions
▲ The FX rate and GDP sensitivities are based on
Discount Rate +/- 0.5% (8.2) 9.1 the relevant affected assets, and the discount
rate sensitivities are based on analysis of the
whole portfolio.
Inflation -/+ 0.5% (7.5) 8.3 ▲ Remaining sensitivities are based on the largest
35 investments by value and then extrapolated
across the whole portfolio
Tax Rate +/- 5% (6.1) 6.2
▲ If the rate of UK corporation tax was 5% higher
in each and every forecast period, NAV per
share would decrease by 4.6p.
GDP -/+ 0.5% (5.0) 5.1
▲ The GDP sensitivity shows the impact of a 0.5%
per annum change in GDP across the four
Interest Rate -/+ 0.5% (1.0) 1.2 assets2 where revenues are to some degree
correlated with economic activity
3 ▲ If outturn GDP growth were 0.5% p.a. lower in all
FX Rates -/+ 5% (0.9) 0.9
relevant geographies for all future periods than
the valuation assumption, expected return4 from
-10p -8p -6p -4p -2p 0p 2p 4p 6p 8p 10p the portfolio (before Group expenses) would
Change in NAV in pence per share1 decrease 0.2% from 7.1% to 6.9%
Negative correlation Positive correlation
1. NAV per share based on 1,791m ordinary shares in issue at 30 September 2019 4. Expected return is the expected gross internal rate of hicl.com | 13
2. Assets subject to GDP movements are High Speed 1 (UK), Northwest Parkway (USA),
A63 Motorway (France) and M1-A1 Link Road (UK) return from the portfolio before group expenses, there
3. Foreign exchange rate sensitivity is net of current Group hedging at 30 September 2019 is no assurance that returns will be metPortfolio Performance and
Asset Management
hicl.com |Portfolio Metrics
Ten largest assets accounted for c. 46% of the portfolio1,2
30 September 20191,2 31 March 2019 10 Largest Investments1,2
High Speed 1 7%
Number of
116 118
investments Remaining A63 7%
Investments
54%
Percentage of Northwest Parkway 6%
portfolio by value – 46% 45%
10 largest assets
Affinity Water 6%
Weighted average
28.5 years 29.5 years Southmead Hospital 4%
asset life3
Pinderfields & Pontefract
Average remaining Hospitals 4%
maturity of long- Home Office 4%
17.1 years 17.5 years
term debt Dutch High Speed Rail Link 3%
financing4 Queen Alexandra Hospital 3%
Allenby & Connaught 2%
Key
▲ The difference between asset life and debt maturity is
PPP Projects
predominantly due to two assets, Affinity Water and Northwest
Parkway, having asset lives that exceed available financing Demand-based Assets
options in their respective markets Regulated Assets
1. By value using Directors’ Valuation of £2,966.2m as at 30 September 2019 hicl.com | 15
2. Excludes Health & Safety Labs and Enniskillen Hospital PPP projects, which exchanged on 27 September 2019 and are due to complete by the end of the year; and excludes
Race Bank OTFO which completed after the period end
3. Assumes a 100-year asset life for Affinity Water. Excluding Affinity Water and Northwest Parkway, the weighted average asset life of the portfolio would be 19.3 years
4. Excludes investment in A13 Senior BondsPortfolio Performance I
PPP projects represent 71% of the portfolio, by value
Investment rationale
▲ Long-term contracts with strong public sector clients in developed economies
▲ Availability-based payment mechanisms produce revenues that are uncorrelated to the wider economy
▲ Long-term funding arrangements and maintenance contracts allocate risk to those parties that are best placed to manage it
Value Preservation and Enhancement
▲ PPPs remain at the heart of the Group’s investment portfolio, representing 71%
of the portfolio by value
▲ PPP contract variations enhance asset outcomes for clients, improve the
end-user experience and/or create value for HICL’s shareholders:
▪ A new forensics lab was opened at Royal Canadian Mounted Police HQ
during the period. Fully funded by the client, the construction and
maintenance is being delivered through the existing PPP structure
▪ Variations were completed at one of the portfolios UK hospital projects,
remodelling the Ambulatory Emergency Care department and adding
new retail facilities
▲ The delivery of construction PPP assets Paris-Sud University Accommodation
(France) and Blankenburg Connection (The Netherlands) represents
opportunity for future value enhancement in the portfolio
Royal Canadian Mounted Police HQ E Division, Canada
hicl.com | 16Portfolio Performance II
Demand-based assets represent 22% of the portfolio, by value
Investment rationale
▲ Operational assets are at the lower end of the risk spectrum when featuring strong usage history or limited uncertainty in
forecast demand
▲ Long-dated, good inflation correlation and returns at a premium to PPP projects
▲ Generally less sensitive to political and regulatory risks compared to PPP projects and regulated assets
Value Preservation and Enhancement
▲ Demand-based assets1, representing 22% of the portfolio by value,
performed well in the six months to 30 September 2019:
▪ On the A63 Motorway (France) traffic was ahead of expectations
▪ On Northwest Parkway (USA), traffic for the year was materially in
excess of levels assumed in the 31 March 2019 valuation assumption
▪ High Speed 1 (“HS1”) performed in line with forecasts for the period
▲ HS1 has also submitted its five-year business plan for Control Period 3. Costs
determined through the regulated mechanisms are passed down to the train
operating companies and there is little impact on HS1’s financial performance
1. High Speed 1 (UK); A63 Motorway (France); Northwest Parkway (USA); Sheffield University Student Accommodation (UK); Helicopter Training Facility (UK); M1-A1 Road (UK) hicl.com | 17Portfolio Performance III
Regulated assets represent 7% of the portfolio, by value
Investment rationale
▲ Essential assets that are regulated due to monopoly market positions
▲ Regulated assets have a complementary risk profile to PPP projects and demand-based assets
▲ Assets are subject to licence periods, where operational delivery risk is often retained by portfolio companies, reducing single
counterparty exposure
Value Preservation and Accretive Investment
▲ OFTO are regulated assets that form part of the transmission network of
renewable energy from offshore windfarms to the UK grid:
▪ Following period end, HICL completed a new investment in its second
OFTO, Race Bank
▪ HICL is preferred bidder in respect of two further OFTOs (Galloper and
Walney Extension) which are expected to reach financial close next year
▲ Ofwat published its draft determination on Affinity Water’s business plan during
the period:
▪ The regulator accepted a number of Affinity’s performance
commitments, however elements of the feedback represent significant
challenges for the company
▪ The final determination will be published by Ofwat in December 2019
Race Bank OFTO, UK
hicl.com | 18Portfolio Characteristics I1,2
A diversified investment proposition
MARKET SEGMENT GEOGRAPHIC LOCATION
Sep-19 Sep-19
Mar-19 Mar-19
Sep-19 Mar-19 Sep-19 Mar-19
▲ PPP Projects 71% 71% ▲ UK 75% 77%
▲ Demand-based Assets 22% 21% ▲ Europe (exc UK) 17% 15%
▲ Regulated Assets 7% 8% ▲ North America 8% 8%
INVESTMENT STATUS
Sep-19
Mar-19
Sep-19 Mar-19
▲ Fully operational 97% 97%
▲ Construction 3% 3%
1. By value using Directors’ Valuation of £2,966.2m as at 30 September 2019 hicl.com | 19
2. Excludes Health & Safety Labs and Enniskillen Hospital PPP projects, which exchanged on 27 September 2019 and is due to complete by the end of the year; and excludes
Race Bank OTFO which completed after the period endPortfolio Characteristics II1,2
A diversified investment proposition
OWNERSHIP STAKE SECTOR
Sep-19 Sep-19
Mar-19 Mar-19
Sep-19 Mar-19 Sep-19 Mar-19
▲ 100% ownership 26% 25% ▲ Accommodation 11% 11%
▲ 50% - 100% ownership 32% 32% ▲ Education 14% 15%
▲ Less than 50% ownership 42% 43% ▲ Electricity, Gas & Water 7% 8%
▲ Health 29% 28%
▲ Fire, Law & Order 7% 7%
▲ Transport 32% 31%
1. By value using Directors’ Valuation of £2,966.2m as at 30 September 2019 hicl.com | 20
2. Excludes Health & Safety Labs and Enniskillen Hospital PPP projects, which exchanged on 27 September 2019 and is due to complete by the end of the year; and excludes
Race Bank OTFO which completed after the period endInvestment Activity
hicl.com |Acquisition Activity
Market coverage filtered by focused acquisition strategy and investment discipline
Evaluation
21
new deals reviewed
in the period
Due 9
diligence transactions subject to
detailed due diligence
CompletedBid 2
investments completed1
for HICL
Acquisitions
Net Stake Overall
Type Stage Project Segment Sector Date
Amount Acquired Stake
£50m2 New Construction Blankenburg Connection PPP Transport 70% 70% Jul-19
£24m New Operational Race Bank OFTO Regulated Electricity Gas & Water 49% 49% Oct-19
1. Includes Race Bank OFTO which completed after the period end hicl.com | 22
2. Commitment to invest approximately £50m in the form of a deferred equity subscriptionRisk and Risk Management
hicl.com |Risk and Risk Management1
Political and ▲ A UK general election will be held in December 2019 and the outcome is uncertain
Regulatory Risk
▲ During the period, the Investment Manager submitted evidence to the National Infrastructure
Commission for its The Future of Regulation Study and a response to the Infrastructure Finance
Review Consultation launched by HM Treasury and the Infrastructure and Projects Authority
▲ The final determination on Affinity Water’s business plan for the 2019 Price Review (“PR19”) for
Asset Management Period 7 (April 2020 to March 2025) (“AMP7”) will be published in December
2019
Brexit ▲ The final outcome of the process of the UK leaving the EU (“Brexit”) remains unknown, and has
contributed to ongoing political uncertainty
▲ For HICL, the impact is most likely to be contained to deviations from macro-economic assumptions
used in the portfolio valuation and cash flow forecasts.
▲ Assets which may be directly impacted by a disorderly Brexit in the short term, such as HS1, have
contingency plans in place to alleviate potential impacts
▲ HICL’s investment proposition provides long-term investors with returns that have strong inflation
linkage and a low correlation to UK GDP, which provides a measure of mitigation
1. The key risks and the strategies employed by InfraRed to manage and mitigate those risks have not changed materially from those set out in detail in Section 3.5 of the 2019 hicl.com | 24
Annual Report for HICL Infrastructure Company Limited, which is available on the Company’s websiteCreating Sustainable Partnerships
HICL’s portfolio of investments is in infrastructure at the heart of communities
The Investment Manager creates sustainable partnerships for HICL that develop
innovative infrastructure and build resilient cities and communities, aligned to the
UN’s Sustainable Development Goals (“SDGs”)
Breadth of portfolio inherently supports a number of the SDGs: E.g. Stakeholders living in the North West of England benefit from:
24,000 pupil places
10 million 1.8 GW at 20 schools
Over 10 million Connecting
people with direct offshore wind
access to the generation with
healthcare enough capacity
facilities in the to power 1.7
portfolio million homes 16 police
stations
120,000 3.6 million
Over 120,000 Population served
student places by Affinity Water
across the school, over 2,000
college and beds across
university facilities five hospitals
in the portfolio
230,000 homes powered by
the offshore wind energy from
the Burbo Bank OFTO
https://www.un.org/sustainabledevelopment/ hicl.com | 25Market, Outlook and Concluding Remarks
hicl.com |Market and Outlook
Market ▲ Continued high levels of demand from unlisted investors for good quality core infrastructure assets
▲ HICL is a long-term, buy-and-hold investor, but may take advantage of current favourable market
conditions to undertake selective strategic disposals that improve portfolio metrics
▲ InfraRed remains focused on pricing discipline when assessing opportunities, to ensure that new
acquisitions meet the Company’s accretion tests
Outlook ▲ The pipeline is healthy with InfraRed progressing a number of opportunities including PPPs in
Northern Europe and North America, and regulated assets on a selective basis, including
additional OFTOs
▲ The Investment Manager also continues to consider assets with corporate offtake counterparties,
such as rolling stock or metering businesses, when structured appropriately
▲ The infrastructure asset class has unique attractions for yield investors, particularly in an ongoing
low interest rate environment
hicl.com | 27Concluding Remarks
Delivering Real Value.
▲ Resilient portfolio performance underpinning continued NAV growth
▪ Significant value enhancement initiatives at both asset and portfolio level
▪ Accretive investments and strategic disposals improved portfolio metrics while managing funding position
▲ A diversified portfolio positions the company well
▲ Predictable, stable cashflows from HICL’s portfolio have allowed the Board to announce further target
dividend guidance:
▪ Reaffirmation of dividend guidance1:
▪ 8.25p for the year ending 31 March 2020; and
▪ 8.45p per share for the year ending 31 March 2021
▪ Further guidance to 8.65p for the year ending 31 March 2022 1
▲ The Company has a current funding requirement of c. £90m
▲ HICL has market-leading, differentiated characteristics, a diversified portfolio and a pipeline of opportunities
for growth, meaning that the Company is well-positioned for the future
1. This is not a profit forecast; there can be no assurance that this target will be met hicl.com | 28Appendix I
The Investment Manager
hicl.com |Overview of InfraRed Capital Partners Ltd (“InfraRed”)
InfraRed is the Investment Manager and Operator
Strong, 25+ year track record of launching 19 infrastructure and real estate funds (including HICL and TRIG)
Currently over US$12bn of equity under management1
Independent manager owned by senior management team 2
London based, with offices in Hong Kong, Mexico City, New York, Seoul and Sydney, with over 150 partners and staff
InfraRed is a signatory of the Principles for Responsible Investment (PRI). These principles provide a voluntary framework to help
institutional investors incorporate ESG issues into investment analysis, decision-making and ownership practices.
In the annual assessment by PRI, InfraRed has achieved top ratings, standing well above industry standards for the last five
consecutive years, with an A+ rating for its infrastructure business in its 2019 assessment
Infrastructure funds Strategy Amount (m) Years Status
Fund I Unlisted, capital growth £125 2001-2006 Realised
Fund II Unlisted, capital growth £300 2004-2015 Realised
HICL Infrastructure PLC (“HICL”) Listed, income yield £3,0663 Since 2006 Evergreen
Environmental Fund Unlisted, capital growth €235 Since 2009 Divesting
Fund III Unlisted, capital growth US$1,200 Since 2011 Divesting
Yield Fund Unlisted, income yield £500 Since 2012 Invested
The Renewables Infrastructure Group (“TRIG”) Listed, income yield £2,1373 Since 2013 Evergreen
Fund V Unlisted, capital growth US$1,200 Since 2017 Investing
Source: InfraRed hicl.com | 30
1. As at 30 September 2019
2. InfraRed is an indirect subsidiary of InfraRed Partners LLP which is owned by its partners
3. Market capitalisation as at 31 October 2019. Source: Thomson Reuters DatastreamInfraRed – Infrastructure Team Skills and Experience
▲ Proven track record in target markets of UK, Europe, North
America, Latin America and Australia / New Zealand
▲ Focused teams including:
− Origination and Execution Team responsible for sourcing,
diligencing and acquiring new investment opportunities;
− Asset Management Team responsible for managing
the portfolio;
− Portfolio Management Team responsible for financial
reporting and management;
− With support from Finance, Compliance and Risk
▲ Strong sector and geographic experience with in-depth
technical, operational and investment knowledge
85+
infrastructure
5
continent
20+ spoken
professionals coverage languages
hicl.com | 31Investment Committee
Senior InfraRed team, experienced in making and managing infrastructure investments
Werner von Guionneau - Chief Executive Officer
Werner is the Chief Executive Officer of InfraRed and is one of InfraRed’s Managing Partners. He is focused on
developing strategy and driving the evolution and growth of the business.
Chris Gill - Deputy Chief Executive Officer
Chris joined InfraRed in 2008 as Deputy Chief Executive. Chris is one of InfraRed’s Managing Partners. Chris has
had extensive involvement with a variety of leverage, structured and cashflow based financings internationally.
Harry Seekings - Co-Head, Infrastructure
Harry joined InfraRed in 1998 and is one of InfraRed’s Managing Partners. Harry has day-to-day responsibility for
leading the team in relation to HICL.
Keith Pickard - Director, Infrastructure
Keith joined InfraRed in 2007 and is one of InfraRed’s Partners. Keith is currently responsible for managing the
financial activities carried out by InfraRed for HICL.
Stewart Orrell - Director, Asset Management
Stewart joined InfraRed in November 2015 and is one of InfraRed’s Partners. Stewart is responsible for managing
the activities of the asset management team.
Tony Roper - Senior Adviser
Tony joined InfraRed in 2006. Tony is a Senior Adviser to the infrastructure team and sits on a number of the
infrastructure investment committees.
hicl.com | 32Fund Management
InfraRed’s dedicated team with day-to-day responsibility for HICL
▲ The HICL Fund Management Team represents the interface between the Investment Manager and HICL’s stakeholders
▲ The team has day-to-day responsibility for the activities that support HICL, including strategy development, investor
relations and risk management of the portfolio
hicl.com | 33Appendix II
Company Information
hicl.com |HICL’s Characteristics
Objective ▲ To deliver long-term, stable income from a diversified portfolio of core infrastructure investments
▲ Focused on investments at the lower end of the risk spectrum, which generate inflation-correlated
long-term returns
History ▲ IPO in 2006, 12 successive years of dividend growth
▲ First infrastructure investment company to list on the main market of the London Stock Exchange
▲ Member of the FTSE 250 index
Portfolio ▲ 116 investments, as at 30 September 2019 (114 operational and two under construction)1
▲ Assets spread across six sectors and seven countries
Net Asset Value ▲ Directors’ Valuation of £2,966.2m at 30 September 2019 (31 March 2019: £2,998.9m) 2
▲ NAV/share of 157.8p at 30 September 2019 (31 March 2019: 157.5p)
▲ Directors’ Valuation based on a weighted average discount rate of 7.1% (31 March 2019: 7.2%)
Board and ▲ Board comprises seven independent non-executive Directors
Governance ▲ Investment Manager and Operator is InfraRed, a leading international investment manager focused
on infrastructure and real estate
Fees and ongoing ▲ Tapered annual management fee based on portfolio’s Adjusted Gross Asset Value (GAV) 3
charges ▲ Ongoing charges percentage (as defined by the Association of Investment Companies) of 1.09% at
30 September 2019 (30 September 2018: 1.09%)
Liquidity4 ▲ Good daily liquidity – average daily trading volume of over 3m shares
▲ Tight bid / offer spread
1. Excludes Health & Safety Labs and Enniskillen Hospital PPP projects, which exchanged on 3. Annually: 1.1% on GAV up to £750m, 1.0% thereafter up to GAV of £1.5bn, 0.9% hicl.com | 35
27 September 2019 and are due to complete by the end of the year; and excludes Race thereafter up to GAV of £2.25bn, 0.8% thereafter up to GAV of £3.0bn, and 0.65%
Bank OTFO which completed after the period end thereafter; plus a £0.1m investment advisory fee
2. Including £76.9m of future investment obligations (31 March 2019: £89.3m) 4. Source: Thomson Reuters Datastream, year to 30 September 2019Infrastructure Market Map
Schematic showing HICL’s Investment Policy1 Scope
Examples: hospitals, schools, government Examples: gas and electricity transmission
accommodation and availability transport and distribution; water utilities;
(e.g. road/rail) district heating
Examples: operational toll roads, tunnels,
Examples: rolling stock bridges; student accommodation
1. The Investment Policy can be found on the HICL website hicl.com | 36HICL Infrastructure PLC Group Structure Diagram
Equity
Independent Directors1 dividends
HICL’s Shareholders
interest
▪ Governance (predominantly UK)
▪ Oversight
▪ Strategy
HICL Infrastructure
Investment Manager PLC
EEA AIF2 subject to the full scope
▪ HICL's AIFM of the AIFMD3
▪ Management (UK Investment Trust
▪ Strategy
Company)
▪ Reporting
▪ Acquisition pipeline
▪ Asset Management LuxCos
▪ Risk and Portfolio Management
Company Secretary
Infrastructure Investments LP
(English limited partnership)
▪ Aztec Financial Services (UK) Limited
Advisers and Service Providers
▪ Legal HICL‘s
Portfolio Companies
▪ Corporate Broking
▪ Public Relations Portfolio of underlying
investments
1. Independent of the Investment Manager hicl.com | 37
2. Alternative Investment Fund, as defined by the EU’s Alternative Investment Fund Managers Directive
3. Alternative Investment Fund Managers DirectiveGovernance
Independent board of non-executive Directors
▲ Approves and monitors adherence to strategy
▲ Monitors risk through Risk Committee
▲ Additional committees in respect of Audit, Remuneration, Management
Engagement, Nomination and Market Disclosure
▲ Monitors compliance with, and implementation of actions to address,
regulation impacting HICL
▲ Sets Group’s policies
▲ Monitors performance against objectives
▲ Oversees capital raising (equity or debt) and deployment of cash
proceeds
▲ Appoints service providers and auditors
Investment Manager: InfraRed
▲ Fulfils HICL’s AIFM1 responsibilities under the European Commission’s Alternative Investment Fund Managers Directive
▲ All ongoing reporting
▲ Day-to-day management of portfolio within agreed parameters
▲ Utilisation of cash proceeds
▲ Full discretion within strategy determined by Board over acquisitions and disposals (through Investment Committee)
▲ Authorised and regulated by the Financial Conduct Authority
1. Alternative Investment Fund Manager hicl.com | 38Board of Directors I
Non-executive Directors with a broad range of relevant experience and qualifications
Ian Russell, CBE Frank Nelson Susie Farnon
Chairman Senior Independent Director Audit Committee Chair
Ian, HICL’s Chairman, is resident in the Frank, a UK resident, is a qualified Sally-Ann (known as Susie), a Guernsey
UK and is a qualified accountant. He accountant. He was Finance Director of resident, is a Fellow of the Institute of
worked for Scottish Power plc between the construction and house-building Chartered Accountants in England and
1994 and 2006, initially as Finance group Galliford Try plc from 2000 until Wales, and is a non-executive director of
Director and, from 2001, as its CEO. October 2012, having held the position at a number of property and investment
Prior to this, he spent eight years as Try Group plc from 1987. companies.
Finance Director at HSBC Asset
After Galliford Try, he took on the role of Susie was a Banking and Finance
Management, in Hong Kong and London.
interim CFO of Lamprell plc in the UAE. Partner with KPMG Channel Islands from
Ian is chair of Scottish Futures Trust and 1990 until 2001 and Head of Audit at
Following his retirement, Frank was
Herald Investment Trust. KPMG Channel Islands from 1999. She
appointed as the Senior Independent
has served as President of the Guernsey
Director of McCarthy and Stone and
Society of Chartered and Certified
Eurocell. He is also Chair of a privately
Accountants, as a member of The States
owned contracting and property
of Guernsey Audit Commission and as
development group.
Vice-Chairman of The Guernsey
Financial Services Commission, and is a
director of the Association of Investment
Companies.
hicl.com | 39Board of Directors II
Non-executive Directors with a broad range of relevant experience and qualifications
Frances Davies Simon Holden Kenneth D. Reid Mike Bane
Director Risk Committee Chair Director Director
Frances has more than 30 years of Simon, a Guernsey resident, brings Kenneth, a Singapore resident, has more Mike, a Guernsey resident, is a chartered
experience across various roles within Board experience from both private than 30 years international experience in accountant with over 35 years of audit
the banking and asset management equity and portfolio company operations infrastructure development, construction and advisory experience in the asset
industries. Since 2007, she has been a roles at Candover Investments then and investment. Initially with Kier Group, management industry including in
partner of Opus Corporate Finance, a Terra Firma Capital Partners. Since and then from 1990 with Bilfinger Berger relation to infrastructure investment
corporate finance advisory business. 2015, Simon has become an active AG, Ken served globally in various senior companies. He led EY's services to the
Prior to that she served as Head of independent director to listed investment management roles, including as a asset management industry in the
Global Institutional Business at Gartmore company, private equity fund and trading member of the Group Executive Board of Channel Islands and was a member of
Investment Management. Previously she company Boards. Bilfinger between 2007 and 2010. EY's EMEIA Wealth and Asset
held roles at Morgan Grenfell Asset Simon holds the DipIoD in Company Ken graduated in Civil Engineering from Management Board. Prior to EY, Mike
Management and SG Warburg. Direction from the Institute of Directors, Heriot-Watt University with First Class was at PwC. Mike was president of the
Frances currently serves as a non- graduated from the University of Honours and then Edinburgh Business Guernsey Society of Charted and
executive director of JPMorgan Smaller Cambridge with an MEng and MA in School with an MBA. He is a Chartered Certified Accountants from 2015 – 2017.
Companies Investment Trust plc and Manufacturing Engineering and is an Engineer, a non-executive director of Mike graduated with a BA in
Aegon Investments Ltd; an independent active member of Guernsey's GIFA, NED Sicon Limited, and a member of the Mathematics from the University of
member of the Aviva With-Profits Forum and IP Commercial Group. Singapore Institute of Directors. Oxford and is a long-standing member of
Committee; and is a member of the the Institute of Chartered Accountants in
Hermes Property Unit Trust committee. England and Wales.
hicl.com | 40Key Performance Indicators (“KPIs”)
KPI Measure1 30 September 2019 30 September 2018 Objective Commentary
Aggregate interim An annual distribution of at
Dividends2 dividends declared per 4.12p 4.02p least that achieved in the Achieved
share in the period prior year
NAV growth and
A long-term IRR target of 7%
Total Return2 dividends paid per share 9.3% p.a. 9.5% p.a. Achieved
to 8% as set out at IPO1
(since IPO)
Operational cash flow /
Cash-covered
dividends paid to 1.05x 1.06x Cash covered dividends Achieved
Dividends
shareholders
Changes in expected
Positive Inflation
portfolio return for 1% p.a. 0.8% 0.8% Maintain positive correlation Achieved
Correlation
inflation change
Efficient gross (portfolio) to
Annualised ongoing net (investor) returns, with
Competitive Cost Market competitive cost
charges / average 1.09% 1.09% the intention to reduce
Proposition proposition
undiluted NAV3 ongoing charges where
possible
1. Set by reference to the issue price of 100p per share, at the time of HICL’s IPO in March 2006 hicl.com | 41
2. Past performance is no indication of future returns. There can be no assurance than future targets will be met
3. Calculated in accordance with Association of Investment Companies guidelines; ongoing charges exclude non-recurring items such as acquisition costAnalysis of Change in NAV per Share1
Six months to 30 September 2019
165.0 p
Value Enhancement 0.6 2.2
Accretive Investment
2.1
160.0 p
2.0 4.6
0.9 0.1
0.6
155.0 p
150.0 p Value Preservation
145.0 p
140.0 p
157.5 157.8
155.5
135.0 p
130.0 p
125.0 p
120.0 p
31 March 2019 Dividend paid 31 March 2019 Change in Forex gain Change in Performance Affinity Water Dividend paid 30 September
NAV per Share in June 2019 NAV per Share discount rates economic in September 2019 NAV per
ex-div assumptions 2019 share
1. The sum of the movements (grey and light purple) may not equate to the overall change (dark purple bars), due to rounding hicl.com | 42Summary Financials I
Figures presented on an Investment Basis1
Six months to Six months to
Income Statement
30 September 2019 30 September 2018
Total income £97.9m £211.0m
Fund expenses & finance costs (£18.4m) (£18.2m)
Profit before tax £79.5m £192.8m
Earnings per share2 4.4p 10.8p
Ongoing charges3 1.09% 1.09%
Balance Sheet (as at) 30 September 2019 31 March 2019
Investments at fair value4 £2,889.3m £2,909.6m
NAV per share2 (before final dividend) 157.8p 157.5p
Interim dividend (2.06p) (2.01p)
NAV per share (after interim dividend) 155.8p 155.5p
Comparative data in the tables above (for the six months to 30 September 2018, and as at 31 March 2019) relates to HICL Guernsey, being the owner
of HICL’s investment business until 1 April 2019
1. Investment Basis is the same basis as was applied in prior years. See the 2019 HICL Annual Report for further details hicl.com | 43
2. Earnings per share and NAV per share are the same under IFRS and Investment Basis
3. Calculated in accordance with Association of Investment Companies’ guidelines
4. Directors’ Valuation at 30 September 2019 of £2,966.2m net of £76.9m of future investment obligations (31 March 2019: £2,998.9m net of £89.3m)Summary Financials II
Figures presented on an Investment Basis1
Six months to Six months to
Cash Flow
30 September 2019 30 September 2018
Opening net cash (£84.3m) (£115.2m)
Net operating cash flow £76.5m £93.6m
Investments (net of disposals) (£18.0m) (£60.5m)
Equity raised (net of costs) (£0.7m) (£0.2m)
Forex movements and debt issue costs (£1.6m) (£1.6m)
Dividends paid (£73.1m) (£70.3m)
Net (debt) / cash (£101.2m) (£154.2m)
Dividend cash cover 1.05x 1.06x2
Comparative data in the table above (for the six months to 30 September 2018) relates to HICL Guernsey, being the owner of HICL’s investment
business until 1 April 2019
1. Investment Basis is the same basis as was applied in prior years hicl.com | 44
2. Excluding profit on disposals in the period of £18.9m. Including this, dividend cash cover would have been 1.33xInvestment and Capital Raising
▲ Acquisitions are identified which fit the Acquisition Strategy; facilitated by demand for HICL shares
▲ Acquisitions are initially debt-funded (using £400m committed Revolving Credit Facility at Group level), to avoid cash drag and
to give shareholders visibility over the new investments, and then refinanced through equity issuance (subject to market
conditions)
▲ HICL raised £250m at initial IPO and c.£2.0bn through subsequent share issues
194 Acquisitions1 since IPO to 30 September 2019 totaling £2.78bn Over £2.2bn of Equity Issuance from IPO to 30 September 20192
£2,800m 2 £2,800m
167
£2,600m £2,600m
£2,400m 488 £2,400m 2
£2,200m £2,200m 274
£2,000m 267 £2,000m
£1,800m £1,800m 381
242
£1,600m £1,600m 184
221
£1,400m 2763 £1,400m 85
239 2596 118
£1,200m £1,200m
278
£1,000m 278 £1,000m
£800m
237
£800m 331
£600m 68 151 £600m 159
81 31
£400m 43 £400m 129
110
£200m £200m
250 250
250
£0m £0m
FYE FYE FYE FYE FYE FYE FYE FYE FYE FYE FYE FYE FYE HYE FYE FYE FYE FYE FYE FYE FYE FYE FYE FYE FYE FYE FYE FYE
Mar Mar Mar Mar Mar Mar Mar Mar Mar Mar Mar Mar Mar Sep Mar Mar Mar Mar Mar Mar Mar Mar Mar Mar Mar Mar Mar Sep
07 08 09 10 11 12 13 14 15 16 17 18 19 19 07 08 09 10 11 12 13 14 15 16 17 18 19 19
1. Split into 116 investments, as at 30 September 2019. Excludes disposals, the proceeds of which have been reinvested hicl.com | 45
2. Includes primary and secondary issuance by way of tap and scrip issuesAcquisition Strategy
Investment Policy unchanged since IPO in 2006
▲ Origination activity continued across all core market segments during the year
▲ Market dynamics continue (principally, strong competition for assets) - pricing discipline remains crucial
▲ Will consider opportunities to enhance shareholder value through strategic disposals facilitating pursuit of opportunities to redeploy
capital into more accretive acquisitions or managing funding
GEOGRAPHY MARKET SEGMENT ASSET QUALITY OPPORTUNITY TO ADD
VALUE
Located in target markets Generates long-term At the lower end of the risk Enhances existing portfolio
revenues spectrum
▲ Europe / UK ▲ Principal focus: ▲ Monopoly or essential asset / ▲ Accretive on one or more metric:
concession − Total return
▲ North America − PPP projects, e.g.
availability payments ▲ Long-term, stable cashflows − Yield
▲ Australia / NZ −
− Regulated assets built on: Inflation-linkage
supported by clear robust − Asset life
regulatory framework − Revenues with good
− Demand-based assets with
visibility ▲ Pricing discipline
a track record of usage, − Where relevant, good
downside protection or quality counterparties ▲ Potential for upside
other mitigation of cashflow − Where possible, long-term
volatility debt financing at asset ▲ Sustains prudent portfolio
level construction and diversification
− Corporate assets with
contracted revenues and
acceptable covenant
hicl.com | 46Appendix III
The Investment Portfolio
hicl.com |Portfolio I
Portfolio of 116 assets1
Education 14% of Directors’ Valuation2
Bangor & Nendrum Schools Ealing Schools Manchester School Rhondda Schools
Barking & Dagenham Schools East Ayrshire Schools Newham BSF Schools Salford & Wigan BSF Phase 1
Belfast Metropolitan College Ecole Centrale Supelec (France) Newport Schools Salford & Wigan BSF Phase 2
Boldon School Edinburgh Schools North Ayrshire Schools Salford Schools
Bradford Schools 1 Falkirk Schools NPD North Tyneside Schools Sheffield Schools
Bradford Schools 2 Fife Schools 2 Norwich Schools Sheffield BSF Schools
Conwy Schools Haverstock School Oldham Schools South Ayrshire Schools
Cork School of Music (Ireland) Health & Safety Labs Paris-Sud University (France) University of Bourgogne (France)
Croydon School Helicopter Training Facility Perth & Kinross Schools West Lothian Schools
Darlington Schools Irish Grouped Schools (Ireland) PSBP NE Batch Wooldale Centre for Learning
Defence Sixth Form College Kent Schools Renfrewshire Schools
Derby Schools
Fire, Law & Order 7%
Addiewell Prison Exeter Crown and County Court Metropolitan Police Training Centre Sussex Custodial Centre
Breda Court (the Netherlands) Gloucestershire Fire & Rescue Royal Canadian Mounted Police HQ Tyne & Wear Fire Stations
Dorset Fire & Rescue Greater Manchester Police Stations South East London Police Stations Zaanstad Prison (the Netherlands)
D&C Firearms Training Centre Medway Police
Transport 32%
A9 Road (Netherlands) A249 Road High Speed 1 N17/N18 Road (Ireland)
Blankenburg Connection
A13 Road Kicking Horse Canyon (Canada) Northwest Parkway (USA)
(the Netherlands)
A63 Motorway (France) Connect PFI M1-A1 Link Road NW Anthony Henday (Canada)
A92 Road Dutch High Speed Rail Link M80 Motorway RD901 Road (France)
1. Excludes Health & Safety Labs and Enniskillen Hospital PPP projects, which exchanged on 27 September 2019 and is due to complete by the end of the year; and excludes hicl.com | 48
Race Bank OTFO which exchanged after the period end
2. By value, at 30 September 2019, using the Directors’ Valuation of £2,966.2m excluding Health & Safety Labs and Enniskillen Hospital PPP projects, which exchanged on 27
September 2019 and is due to complete by the end of the year; and excludes Race Bank OTFO which completed after the period endPortfolio II Portfolio of 116 assets1 Health 29% of Directors’ Valuation2 Barnet Hospital Doncaster Mental Health Hospital Oxford John Radcliffe Hospital South West Hospital Enniskillen Birmingham Hospitals Ealing Care Homes Oxford Nuffield Hospital Staffordshire LIFT Birmingham & Solihull LIFT Glasgow Hospital Pinderfields & Pontefract Hospitals Stoke Mandeville Hospital Bishop Auckland Hospital Hinchingbrooke Hospital Queen Alexandra Hospital Tameside General Hospital Blackburn Hospital Irish Primary Care Centres (Ireland) Redbridge & Waltham Forest LIFT West Middlesex Hospital Blackpool Primary Care Facility Lewisham Hospital Romford Hospital Willesden Hospital Brentwood Community Hospital Medway LIFT Salford Hospital Brighton Hospital Newton Abbot Hospital Sheffield Hospital Central Middlesex Hospital Oxford Churchill Oncology Southmead Hospital Accommodation 11% Allenby & Connaught Miles Platting Social Housing Northwood MoD HQ Royal School of Military Engineering Health & Safety Headquarters Newcastle Libraries Oldham Library University of Sheffield Accommodation Home Office Electricity Gas & Water 7% Affinity Water Burbo Bank OFTO Race Bank OFTO Key ▲ New investment since 31 March 2019 ▲ Disposal announced after period end 30 September 2019 ▲ New investment after period end 30 September 2019 1. Excludes Health & Safety Labs and Enniskillen Hospital PPP projects, which exchanged on 27 September 2019 and is due to complete by the end of the year; and excludes hicl.com | 49 Race Bank OTFO which exchanged after the period end 2. By value, at 30 September 2019, using the Directors’ Valuation of £2,966.2m excluding Health & Safety Labs and Enniskillen Hospital PPP projects, which exchanged on 27 September 2019 and is due to complete by the end of the year; and excludes Race Bank OTFO which exchanged after the period end
Portfolio – Key Attributes
Evolution of the Group’s portfolio

 Geographically Diverse Portfolio                                                        Diverse Sector Spread
 100%                                                                                    100%

   80%                                                                                   80%

   60%                                                                                   60%

   40%                                                                                   40%

   20%                                                                                   20%

    0%                                                                                    0%
            FYE      FYE     FYE        FYE      FYE        FYE      FYE    FYE    HY             FYE        FYE     FYE     FYE      FYE      FYE    FYE    FYE      HY
           2012     2013    2014       2015     2016       2017     2018   2019   2020           2012       2013    2014    2015     2016     2017   2018   2019     2020
                    North America             Australia           Europe       UK               Electricity, Gas & Water    Fire, Law & Order          Accommodation
                                                                                                Education                   Transport                 Health

 Predominantly Operational Assets                                                        Opportunities to Increase Ownership Stakes
 100%                                                                                    100%

   80%                                                                                    80%

   60%                                                                                    60%

   40%                                                                                    40%

   20%                                                                                    20%

    0%                                                                                     0%
            FYE      FYE      FYE     FYE        FYE        FYE      FYE    FYE    HY             FYE    FYE        FYE      FYE    FYE      FYE      FYE    FYE      HY
           2012     2013     2014    2015        2016      2017     2018   2019   2020           2012   2013       2014     2015    2016    2017     2018   2019     2020
                             Construction                 Operational
Facilities Management and Operations Counterparty Exposure
10 Largest Facilities Management
and Operations Counterparty Exposures1
▲ Exposure is reviewed quarterly and reported to the
Risk Committee by InfraRed
Bouygues
15%
▲ Contingency plans are in place to address scenarios Other
where material issues lead to a failure of service 29%
provision by a subcontractor
▲ “In House” represents Affinity Water(UK) and
Engie
Northwest Parkway (USA) 13%
▲ Bouygues, Engie, Skanska and Integral sourced by
InfraRed's Asset Management team to replace KBR
2%
Carillion on nine projects Integral
3% In House
Siemens 12%
3%
Sodexo
4% Mitie Network Rail
EGIS 7%
5% 7%
1. By value, at 30 September 2019. Where a project has more than one operations contractor in a joint and several contract, the better credit counterparty has been selected (based hicl.com | 51
on analysis by InfraRed). Where a project has more than one operations contractor, not in a joint and several contract, the exposure is split equally among the contractors, so the
sum of the pie segments equals the Directors’ Valuation. Projects where Kier or Interserve are the facilities management contractor represent less than 2% and 1% of the portfolio,
by value, respectivelyYou can also read