Company Presentation September 2018 - September 2018 GS/Berenberg ...

Page created by Alfredo Simpson
 
CONTINUE READING
Company Presentation September 2018 - September 2018 GS/Berenberg ...
Company Presentation
September 2018
Company Presentation September 2018 - September 2018 GS/Berenberg ...
Agenda

                         Vonovia at a Glance                3

                         Business Update                    6

                         Residential Market Data            20

                         Appendix                           25

Company Presentation – September 2018              page 2
Company Presentation September 2018 - September 2018 GS/Berenberg ...
Vonovia at a Glance

       Largest listed European residential company with more than 400k                                                      Sweden
                                                                                                                          (Stockholm,
       apartments.                                                                                              Austria   Gothenburg,
                                                                                                                (mostly     Malmö)
       Bread-and-butter business in German residential market with strong track record of                       Vienna)       4%
                                                                                                                  6%
       optimization, standardization and industrialization via organic and acquisition
       growth.
       Industrialized approach leverages economies of scale in a highly homogeneous
       asset class.
       B-to-C business with ca. 13 years average tenant tenure.
       Strong internal growth profile via sustainable market rent growth, additional
                                                                                                                             Germany
       rent growth from portfolio investments and dynamic value-add business.                                                  90%

       Robust business model delivers highly stable and growing cash flows (Funds
       from Operations, “FFO 1”).
       Predictable top and bottom line with downside protection and upside potential.

      FFO 1 per share and Dividend Track Record
                                                                                             2.051
                                                                               1.90
                                                                 1.63
                                                                                                     ca. 70%
                                                 1.30                                 1.32           of FFO 1
                                                                        1.12
              0.95                 1.00                 0.94
                     0.67                 0.74

                 2013                2014          2015            2016          2017         2018(E)

                                                         FFO 1          DPS
1   Guidance mid-point for 2018.
    Company Presentation – September 2018                                      page 3
Company Presentation September 2018 - September 2018 GS/Berenberg ...
Strategy

                                                           Reputation & Customer Satisfaction

                    Property            79.6%          82.2%             84.8%          87.0%             88.6%

                   Management                                                                                                        Mergers &
 Traditional

                                                                                                                    5
                                                                                                                                    Acquisitions
                                         830
               1      Efficient                          754
                                                                          645            570               526
                    operations of
                                        2013            2014            2015             2016           2017
                      scalable                                                                                      `000 units                          404
                                                EBITDA margin (excl. maintenance)            Cost per unit (€)
                      business

                                                                                                           4.6                               292
                                                                          3.0
                                                                                          3.7                           180
                     Financing          2.2
                                                           2.7
                                                                                                                                    68
               2                        49%             50%              47%
                    Solid capital                                                        42%              40%
                     structure          2013            2014            2015             2016             2017
                                                                 LTV (%)          Global ICR                            IPO        Sales     Acq.      H1 ’18

                    Portfolio                                     767            665            577        ~400
                   Management
                                                                                                779
                                                                                                          ~1,000
                                                                                                                    6            European Activities
                                                                  356            472
               3        Value-           71          172
                     investments
                     supplement         2013         2014         2015           2016        2017         2018(E)
                   internal growth               Investment Volume (€m)             Number of locations                   European activities enhance
                                                                                                                          accretive acquisition
                                                                                                          ~120            opportunities
                    Value-add                                                            102.1
                    Business                                                                                              Similar to Germany, we closely
 Innovative

                                                                         57.0
                                        23.6
                                                        37.6                                                              monitor clearly defined
               4                                                                                                          geographies for opportunities,
                   Leveraging B-
                   to-C nature of       2014            2015           2016            2017               2018(E)         applying the same acquisition
                    the business                         Adj. EBITDA Value-add Business (€m)                              criteria

                                          Core Strategies                                                                 Opportunistic Strategies

Company Presentation – September 2018                                              page 4
Company Presentation September 2018 - September 2018 GS/Berenberg ...
Agenda

                         Vonovia at a Glance                3

                         Business Update                    6

                         Residential Market Data            20

                         Appendix                           25

Company Presentation – September 2018              page 5
Company Presentation September 2018 - September 2018 GS/Berenberg ...
Highlights

                                                Organic rent growth of 4.1% y-o-y.
                                                Operating expenses reduced by 16.8% to €110.2m as a result of eliminating the double
                                   Operations   cost structure from conwert included in H1 2017 as well as continued efficiency gains.
                                                Adj. EBITDA Operations margin (ex. maintenance) of 90.9% (+290bps y-o-y).
Excl. Buwog, Victoria Park

                                                Vonovia received the EPRA Gold Award for the 2017 Sustainability Report
  Vonovia stand-alone

                                                FFO 1 increased by 11.5% y-o-y to €510.3m in H1 2018 as a result of better EBITDA
                                     FFO 1      Operations and lower interest expenses and income taxes.

                                                H1 valuation comprised ca. 2/3 of portfolio (20 largest German locations plus six additional
                                                German locations and Vienna).
                                   Valuation    6.9% l-f-l value growth on revalued portfolio, of which 5.7% l-f-l valuation uplift
                                                (performance + yield compression). Total value growth of €1,765m represents 5.3% on the
                                                overall portfolio.
      Incl. Buwog, Victoria Park

                                                Adj. NAV grew by 10.5% to €20,634.4m in H1 2018.
                                   Adj. NAV
                                                On a per-share basis, Adj. NAV was €39.83, up 3.5% ytd (6.8% higher NOSH).

                                                2018 Guidance now includes Buwog and Victoria Park.
                                                FFO 1 guidance of €1,050m - €1,070m or €2.03 – €2.07 p.s. on the new number of
                                   Guidance     518.1m issued shares.
                                                Back-of-an-envelope calculation: Assuming Buwog and Victoria Park had fully contributed for
                                                the first six months, the pro FFO 1 per share guidance would have been €2.08 – €2.12.

Company Presentation – September 2018                                    page 6
Company Presentation September 2018 - September 2018 GS/Berenberg ...
All numbers stand-alone
    Vonovia, excluding Buwog
         and Victoria Park

KPI Growth in spite of Smaller Portfolio and Higher NOSH

        Rental income slightly up 0.7% on a 3% smaller but higher quality portfolio.

        Adjusted EBITDA Operations up 4.1% because of substantially lower operating expenses and higher contribution from the Value-add Business.

        As a result, and supported by lower interest expenses, FFO grew by 11.5% (2.5% per share due to the 8.7% increase in NOSH from the May
        ABB and scrip dividend).

                                                                           H1 2018          H1 2017      Delta

Average number of residential sqm                   `000                    21,557           22,226     -3.0%              Portfolio reduction mainly
                                                                                                                            driven by clean-up sales
Average number of residential units                  #                     344,685          355,570     -3.1%

Organic rent growth (y-o-y)                          %                         4.1              3.7    +40 bps

In-place rent (eop)                              €/month/sqm                  6.41             6.12     +4.7%

Vacancy rate (eop)                                   %                         2.8              2.9    -10 bps

Rental income                                        €m                      838.8            833.2     +0.7%    +€5.6m
Maintenance expenses                                 €m                     -131.6           -127.3     +3.4%
                                                                                                                                conwert synergies and
Operating expenses                                   €m                     -110.2           -132.4    -16.8%
                                                                                                                               efficiency improvements

Adj. EBITDA Rental                                   €m                      597.0            573.5     +4.1%    +€23.5m
Adj. EBITDA Value-add Business                       €m                       51.7             45.6    +13.4%

Adj. EBITDA Operations                               €m                      632.6            607.6     +4.1%    +€25.0m

                                                                                                                           •     8.7% higher NOSH
Interest expense FFO 1                               €m                     -114.3           -138.0    -17.2%                    y-o-y
                                                                                                                           •     Back-of-an-envelope
Current income taxes FFO 1                           €m                       -8.0            -11.9    -32.8%                    calculation: pro forma
                                                                                                                                 FFO 1 including full
                                                                                                                                 contribution from
FFO 1                                                €m                      510.3            457.7    +11.5%    +€52.6m         Buwog and Victoria
                                                                                                                                 Park in H1 would be
FFO 1 per share (eop NOSH)                            €                       0.98             0.96     +2.5%                    ~€36m or
FFO 1 per share (avg. NOSH)                           €                       1.03             0.98     +5.8%                    ~7 cents higher

Company Presentation – September 2018                                     page 7
Company Presentation September 2018 - September 2018 GS/Berenberg ...
All numbers stand-alone
    Vonovia, excluding Buwog
         and Victoria Park

Rent Growth Acceleration Set to Continue

                                                            Positive rent growth trajectory
Rent growth drivers
(last 12M)
                               H1 2018   H1 2017   Delta
                                                                                    2013     2014   2015   2016   2017   2018(E)   2019(E)

                                                            Market driven          1.6%      1.6%   1.7%   1.5%   1.6%       ≈       ≈

                                                            Modernization          0.4%      0.9%   1.2%   1.8%   2.5%
Sitting tenants (incl.         1.1%        1.2%    -10bps
subsidized rents)

                                                            Space creation          ---       ---    ---    ---   0.1%

New lettings (with no          0.4%        0.5%    -10bps
material investment)
                                                            Organic rent
                                                                                   1.9%      2.5%   2.9%   3.3%   4.2%   ~4.4%
                                                            growth

Subtotal market-
                               1.5%        1.7%    -20bps
driven rent growth

Modernization
(including new lettings
                               2.5%        1.9% +60bps
with investments 
Optimize Apartments)
                                                            Investment track record (€m; includes modernization and space
                                                            creation)
                                                                                                            ~1,000 ~1,000
Subtotal l-f-l rent
                               4.0%        3.6% +40bps
growth                                                                                                      779

                                                                                                    472
Space creation                 0.1%        0.1%       ---
                                                                                           356
                                                                             172
                                                                 71
Subtotal organic
                               4.1%        3.7% +40bps
rent growth
                                                               2013          2014          2015     2016   2017    2018(E)   2019+(E)

Company Presentation – September 2018                        page 8
Company Presentation September 2018 - September 2018 GS/Berenberg ...
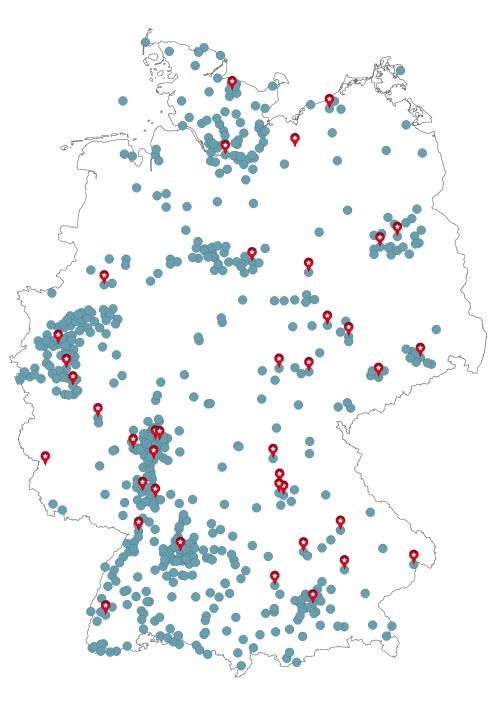
Smooth Maturity Profile with Diverse Funding Mix

     Debt maturity profile (€ m)1

         3,000                                                                                                                                                                                                                 3.5%
         2,500                                                                                                                                         Current unsecured reoffer yield (8 years)                               3.0%
                                                                                                                                                                                                                               2.5%
         2,000
                                                                                                                                                                                                                               2.0%
         1,500
                                                                                                                                                                                                                               1.5%
         1,000
                                                                                                                                                                                                                               1.0%
            500                                                                                                                                                                                                                0.5%
                  0                                                                                                                                                                                                            0.0%
                      2018        2019              2020      2021      2022     2023                          2024       2025                     2026           2027       2028              2029      from 2030
                  Mortgages incl. EIB           Structured Loans   Bond    Debt Hybrid                       Equity Hybrid    WCF                    Buwog         Victoria Park            avg. financing cost
     Weighted
     avg.
     financing         0.5%           2.7%         1.8%          2.9%3            1.2%          2.1%           1.2%                1.3%            1.8%           1.6%            1.6%           1.9%            2.0%
     cost p.a.2
     % of debt
     maturing          3.4%          10.1%        11.2%          10.1%          11.1%           9.9%           10.5%               7.4%            5.5%           3.4%            5.2%           0.2%           11.9%

     Debt structure1
                                                                                                             KPIs                                                     June 30, 2018                              Target
                                                              5-6 years
                                                                18%                                          LTV5                                                                          43.9%         Mid-to low forties
                                    3-4 years
                                      11%                             7-8 years
                                                                        12%                                  Unencumbered assets in %                                                      56.2%         ≥50%
                              1-2 years
                                 8%                                      9-10 years                          Fixed/hedged debt ratio4                                                         96%
                                                                                                                                                                                                              Ongoing
                                                                            7%
                        Subsidized                                                                                                                                                                            optimization
                       Modernization                                                                         Global ICR (YTD)6                                                                 6.0x
                        Debt + EIB
                                                                       > 10 years                                                                                                                             with most
                                                                          7%                                                                                                                                  economic
                           9%                                                                                Average cost of debt4                                                           1.8%
                                  Mortgages                    Debt Hybrid                                                                                                                                    funding
                                     15%                                          Equity Hybrid
                                                Structured        3%                                         Weighted avg. maturity4                                                   8.1 years
                                                  Loans                                5%
                                                           WCF
                                                   5%
        Bonds (years indicate maturity)                    0%                                                Corporate Rating (S&P)                                                          BBB+
1incl. July 2018 Bond, which is not included in KPIs. Average financing cost of debt maturing in the relevant year.
                                                    2                                                                 3   Weighted avg. financing costs excl. Equity Hybrid. Including Equity Hybrid, avg. interest rate of debt
maturing in 2021 is 3.4%.4 excl. Equity Hybrid. 5 excl. 2nd offer period of Buwog. 6 excl. Buwog and Victoria Park.

    Company Presentation – September 2018                                                                  page 9
Company Presentation September 2018 - September 2018 GS/Berenberg ...
LTV Remains in Comfort Zone

      LTV as of June 30, 2018 was 43.9%.

      Current pro forma LTV, including 2nd offer period for Buwog and €500m bond issued in July, is ~45%.

      Against the background of the stable cash flows and the strong fundamentals in our portfolio locations we see continued upside
      potential for our property values, and we do not see material long-term downside risks.

      We therefore continue to believe that the LTV target range of 40% - 45% is adequate for our low risk portfolio, and we feel
      comfortable with this range.

      Based on our internal LTV projections, an extremely bearish scenario with no yield compression in H2 2018 would result in an
      LTV of ~45%, so any yield compression will bring the LTV even deeper into our comfort zone (€500m of yield compression
      reduce the LTV level by ca. 50 bps).

€m                                                                        Jun 30, 2018          Mar 31, 2018            Dec 31, 2017
(unless indicated otherwise)

Non-derivative financial liabilities                                         19,774.6                18,887.0               14,060.5
Foreign exchange rate effects                                                    -29.6                   -17.8                      -23.5
Cash and cash equivalents                                                       -865.8                  -829.3                 -266.2
Net debt                                                                     18,879.2                18,039.9               13,770.8
Sales receivables                                                               -239.8                  -232.4                 -201.2
Adj. net debt                                                                18,639.4                17,807.5               13,569.6

Fair value of real estate portfolio                                          41,732.3                38,485.6               33,436.3
Shares in other real estate companies                                            734.5                   666.6                  642.2
Adj. fair value of real estate portfolio                                     42,466.8                39,152.2               34,078.5

LTV                                                                            43.9%                   45.5%                   39.8%

Company Presentation – September 2018                           page 10
Invest Cluster Offers Long-Term Organic Growth Potential

                                                                                                                                                                        Austria         Sweden
                                                                                                                                                                 Sell
       53% of portfolio in Invest Cluster and earmarked for
                                                                                                                                                Privatize
       value-enhancing investments in the next years
                                                                                                                                                                                          Operate
       Non-core sales almost completed

       10% of portfolio outside of Germany                                                                                                                              Invest

                                                                                  Residential                        In-place rent                   Vacancy rate                            Fair value1
                  June 30, 2018
                                                                                          units                   (€/sqm/month)                                  (%)                       (€bn)                  % of total
Operate                                                                              126,039                                     6.54                             2.6                        13.0                           32%

Invest                                                                               217,270                                     6.35                             2.6                        21.4                           53%

Subtotal Strategic Clusters                                                         343,309                                     6.42                              2.6                       34.4                        85%

Privatize                                                                              13,183                                    6.22                             4.1                         1.5                           4%

Sell                                                                                   10,167                                    5.34                             5.1                         0.6                           1%

Total Germany                                                                       366,659                                     6.38                              2.7                       36.5                        90%

Austria                                                                                23,215                                    4.56                             4.2                         2.5                           6%

Sweden                                                                                 14,052                                    8.83                             1.4                         1.6                           4%

Note: In-place rents in Austria and Sweden are not fully comparable to Germany, as Sweden, for example, includes certain ancillary costs. The table above shows the rental level unadjusted to the German definition.
1 Fair value of the developed land excluding € 1,205.4 million, of which € 344.5 million for undeveloped land and inheritable building rights granted, € 251.9 million for assets under construction, € 461.7 million for

development and € 147.3 million for other.

Company Presentation – September 2018                                                                     page 11
All numbers stand-alone
    Vonovia, excluding Buwog
         and Victoria Park

€1bn Investment Program on Track

    2018 investment program well underway.
    All investment projects kicked-off or already completed.

 Investment program for calendar year 2018 (€m)                                Distribution of investment funds for 2018 program year
                                                                ~1,000
                                                        0

                                                                                                     Space Creation

                                     639

                                                                                          Optimize
                                                                                         Apartment
                                                                                                                            Upgrade
                                                                                                                            Building

           361

                                                                               Including €60m investments into Neighborhood Development which have
       H1 2018                  Kicked off           Pipeline   Total          been allocated to the respective categories.

Note: Numbers include projects kicked off in 2017.

Company Presentation – September 2018                                    page 12
All numbers stand-alone
  Vonovia, excluding Buwog
       and Victoria Park

L-f-l Value Uplift of 5.7%

  Valuation portfolio comprised the 20 largest cities of our German
                                                                                                    H1 2018 fair value uplift (l-f-l)
  portfolio, plus six additional German locations and Vienna, representing
                                                                                               0%      2%      4%      6%          8%   10%   12%
  ca. 2/3 of the entire portfolio. All other locations and values were left
                                                                                    Augsburg
  unchanged and adjusted only for capitalization.
                                                                                   Dortmund

  6.9% l-f-l value growth on revalued portfolio, of which 5.7% l-f-l                 Bremen

  valuation uplift (performance + yield compression).                               Stuttgart

                                                                                   Mannheim
  Total value growth of €1,765m represents 5.3% on the overall portfolio.
                                                                                  Leverkusen
  German portfolio as of June 30, 2018, valued at €1,561/sqm, 20.5x in-                Essen

  place rent multiple and 4.9% gross yield                                           Bielefeld

                                                                                   Osnabruck
  (Dec. 31, 2017: €1,475/sqm, 19.7x in-place rent and 5.1% yield).
                                                                                       Berlin

                                                                                     Hanover

                                                                                      Leipzig
 Value drivers H1 (€m)
                                                                                    Hamburg

                                                                                   Dusseldorf
   Performance                                                  268
                                                                                          Kiel

         Rental development                                     228                 Karlsruhe

                                                                                     Bochum
         Investments                                             40                 Frankfurt

                                                                                      Munich
   Investments                                                  347
                                                                                Braunschweig
         Investments (within valuation                                                  Bonn
                                                                240
         portfolio)                                                                  Cologne
         Investments (outside of valuation
                                                                107                  Dresden
         portfolio)
                                                                                     Potsdam
   Yield compression                                          1,150                Wiesbaden

                                                                                     Freiburg
   Total value uplift                                         1,765
                                                                                                                         average

Company Presentation – September 2018                                 page 13
Continued NAV Growth

         Adj. NAV is up 10.5% ytd or 3.5% per share in spite of 6.8% more issued shares.

€m                                                        Jun 30, 2018   Dec 31, 2017     Is Adj. NAV a good proxy for the value of a
(unless indicated otherwise)

                                                                                          diverse operating business?

                                                                                          By definition, the Adj. NAV
Equity attributable to Vonovia's shareholders                16,916.2        15,080.8
                                                                                              reflects the brick and mortar value of the
Deferred taxes on investment properties and assets held
for sale
                                                               7,253.8        6,185.7         buildings

Fair value of derivative financial instruments1                  93.4              26.9       applies market terms and assumes the

Deferred taxes on derivative financial instruments               -25.1             -8.8
                                                                                              properties are owned by “anyone”

EPRA NAV                                                     24,238.3        21,284.6
                                                                                          This approach ignores

Goodwill                                                      -3,603.9        -2,613.5
                                                                                              the Value-add Business

Adj. NAV                                                     20,634.4        18,671.1
                                                                                              the cost advantage and operating platform

                                                                                              of a professional owner

                                                                                              the development business
EPRA NAV €/share                                               46.79           43.88

                                                                                              the cash flow from privatization
Adj. NAV €/share                                               39.83           38.49

1   Adjusted for effects from cross currency swaps.

Company Presentation – September 2018                                    page 14
All numbers stand-alone
  Vonovia, excluding Buwog
       and Victoria Park

Growing Contribution from Value-add Business

 Concept                                                                  Economics
   Expansion of core business to extend the value chain by                   NAV does not account for Vonovia’s Value-add Business.
   offering additional services and products that are directly
                                                                             Applying the impairment test WACC1 to the 2018E Adj.
   linked to our customers and/or the properties and offer the
                                                                             EBITDA Value-add Business translates into an additional
   same cash flow stability as the rental business.
                                                                             value of ~€5.0 per share (~12% on top of H1 Adj. NAV).
   Insourcing of services to ensure maximum process
   management and cost control.                                                                                 Penetration
   Two types of Value-add Business                                             Multimedia                                        ca. 80%
        1. External income (e.g. multimedia, smart metering)                   Smart metering                                    ca. 23%
        2. Internal savings (e.g. craftsmen, resi environment)                 Residential environment2                          ca. 30%
   New initiatives always follow same low risk pattern of                      Energy                                            ~1%
            Prototype development                                              Craftsmen VTS                                     ca. 70% (maintenance)
            Proof of concept in pilot phase                                                                                      ca. 40% (modernization)
                                                                                                                                 target is around 70% to allow for
            Roll-out across portfolio                                                                                            enough flexibility in the volumes
                                                                                                                                 and to enable continuous
                                                                                                                                 benchmarking to market prices

                                                                             Adj. EBITDA Value-add Business (€m)
                                                                                                                                                              ~120
                              Energy
                                                                                                                                              102.1

                                              Craftsmen
            Multimedia
                                                (VTS)
                                                                                                                            57.0
                              Rental
                             contract                                                              37.6
               Smart                           Residential                      23.6
              Metering                        Environment

                               …
                                                                               2014                2015                     2016              2017           2018(E)
                                                                      1   Pre-tax WACC of 4.68% as per Dec. 31, 2017.   2   Gardening and landscaping work

Company Presentation – September 2018                            page 15
All numbers stand-alone
     Vonovia, excluding Buwog
          and Victoria Park

Sales – Steady Cash Flow at Attractive Margins

      Total sales volume in H1 2018 was 6,115 residential units (prior-year period: 4,484), of which 1,030 from Privatization

      portfolio (prior-year period: 1,160) and 5,085 from Sell portfolio (prior-year period: 3,324).

      In spite of value growth of the portfolio, privatization fair value step-ups still came out to 30.5% for H1 2018.

      The sell portfolio disposals saw a record fair value step-up of 15.4% in H1 2018, driven largely by two block sales, as we are

      utilizing the high market liquidity to profitably dispose of our Sell Portfolio.

      The income and fair value figures of the Sell Portfolio for the prior-year period include a substantial amount of commercial

      property sales.

                                                      PRIVATIZATION                      SELL PORTFOLIO                    TOTAL

€m                                                   H1 2018         H1 2017             H1 2018     H1 2017        H1 2018        H1 2017
(unless indicated otherwise)

Income from disposal                                   124.2            142.7             230.0           559.2       354.2          701.9

Fair value of disposal                                  -95.2          -108.7             -199.3      -536.1         -294.5          -644.8

Adj. profit from disposal                                 29.0           34.0               30.7           23.1           59.7         57.1

Fair value step-up (%)                                 30.5%           31.3%              15.4%           4.3%

Selling costs                                                                                                             11.4         -12.8

Adj. EBITDA Sales                                                                                                         48.3         44.3

Company Presentation – September 2018                                 page 16
Update on BUWOG & Victoria Park; European Activities

                                                                         Comments
                         BUWOG              Victoria Park
                                                                             European activities enhance accretive acquisition
   Current                                 93.45% voting                     opportunities.
   Vonovia           90.7% voting rights   rights (including call
    stake                                  options)                          Similar to Germany, we closely monitor these clearly
                                                                             defined geographies for opportunities, applying the same
  Impact in
                     Starting with Q2      Starting with Q3                  acquisition criteria:
    2018
                                                                                    Austria – run combined Buwog and conwert
                                                                                    portfolio as scalable business. Disposals more
                     Operational
                                                                                    prominent in Austrian business model because of
                     integration of
                     German operating      Victoria Park
                                                                                    low exit yields
                     business fully on     management and
                     track and expected    staff remain largely                     Sweden – build on Victoria Park platform and
 Integration         to be completed by    in place, as Victoria
                     the end of 2018.      Park continues to                        consolidate Swedish residential market
                                           run its business
                     Synergy realization                                            France – largest long-term opportunity. Not
                                           broadly unchanged.
                     expected from 2019
                     onwards.              Feasibility of joint                     material at this point and only a viable long-term
                                           purchasing,
                                           modernization work                       option to the extent legislation changes and allows
                                           and refinancing
                                           opportunities being                      the payout of economic dividends from social
                     Buwog EGM to
                     resolve on the        reviewed.                                housing
                     Squeeze-out           No integration
                     scheduled for Oct.    planned as Victoria                      Netherlands – attractive market but no
  Next steps         2.                    Park serves as the
                                           platform for                             opportunities or viable partner at this point
                     Cash compensation
                                           Vonovia’s potential
                     for minority                                            Other countries are not in our focus due to fundamentals,
                     shareholders of       growth in Sweden.
                     €29.05 per share.                                       (lack of) regulation or similar related issues.

Company Presentation – September 2018                              page 17
Increased Guidance Suggests ca. 8% FFO per share Growth

                                                                                2017 Actuals                                                                 2018 Guidance
                                                                                                                  Initial (Nov. 2017)                    Update (May 2018)                      Update (Aug. 2018)
                                                                                                                         Excl. Buwog &                          Excl. Buwog &                         Incl. Buwog &
                                                                                                                          Victoria Park                          Victoria Park                        Victoria Park1

         Organic rent growth (eop)                                                     4.2%                              4.6% - 4.8%                            4.6% - 4.8%                               ~4.4%2
                                                                                                                                                                                                    (VNA stand-alone)

         Vacancy (eop)                                                                 2.5%
Agenda

                         Vonovia at a Glance                 3

                         Business Update                     6

                         Residential Market Data             20

                         Appendix                            25

Company Presentation – September 2018              page 19
German Residential – Safe Harbor and Low Risk

 Rental regulation safeguards high degree of stability
        Contrary to most other jurisdictions such as the USA, rental growth in Germany is regulated and not directly linked
        to CPI, GDP development etc.
        Rents are regulated via “Mietspiegel“ (city-specific rent indices), which look at the asking rents of the previous four
        years to determine a rent growth level for existing tenants for the next two years.

 Germany: regulated market ensures sustainable rent growth                                                                         USA: rent growth is highly volatile
 %                                                                                                                                 %

  6                                                                                                                                6

  4                                                                                                                                4

  2                                                                                                                                2

  0                                                                                                                                0
                                                                                   2012

                                                                                                                                                                                                                                          2015
      2001
             2002
                    2003
                           2004
                                  2005
                                         2006
                                                2007
                                                       2008
                                                              2009
                                                                     2010
                                                                            2011

                                                                                          2013
                                                                                                 2014
                                                                                                        2015
                                                                                                               2016
                                                                                                                      2017

                                                                                                                                        2001
                                                                                                                                               2002
                                                                                                                                                      2003
                                                                                                                                                             2004
                                                                                                                                                                    2005
                                                                                                                                                                           2006
                                                                                                                                                                                  2007
                                                                                                                                                                                         2008
                                                                                                                                                                                                2009
                                                                                                                                                                                                       2010
                                                                                                                                                                                                              2011
                                                                                                                                                                                                                     2012
                                                                                                                                                                                                                            2013
                                                                                                                                                                                                                                   2014

                                                                                                                                                                                                                                                 2016
                                                                                                                                                                                                                                                        2017
 -2                                                                                                                                -2

 -4                                                                                                                                -4

 -6                                                                                                                                -6

                            GDP German quarterly development y-o-y                                                                                                  GDP US quarterly development y-o-y
                            Rent growth German quarterly development y-o-y                                                                                          Rent growth US quarterly development y-o-y

Sources: Federal Statistics Office, GdW (German Association of Professional Homeowners), REIS, BofA Merrill Lynch Global Research, OECD.
Note: Due to lack of q-o-q US rent growth data, the annual rent growth for a year is assumed to also be the q-o-q rent growth of that year.

Company Presentation – September 2018                                                                                        page 20
German Residential – Landlords Benefit from Structural Imbalance
between Supply and Demand

New supply falls short of demand

         Consensus estimates see a current shortage of around 1 million apartments in urban areas. Three main constraints
         stand in the way of material changes in the short and even medium term:
                  Building permits often take several years because city administrations lack qualified personnel.
                  Severe shortage of building capacity after years of downsizing.
                  Substantial gap between in-place values and market replacement cost render construction in affordable
                  segment economically unfeasible.

Residential building permits and new construction volume (‘000 units)
 800

 700

 600                                                                                                                                                                                                     Required volume
                                                                                                                                                                                                         exceeds average
                                                                                                                                                                                                        annual completions
 500
                                                                                                                                                Completions on average 18%                              of past 15 years by
                                                                                                                                                      below permits                                           >170k
 400

 300

 200

 100

     0
           1991

                  1992

                         1993

                                1994

                                       1995

                                              1996

                                                     1997

                                                            1998

                                                                   1999

                                                                          2000

                                                                                 2001

                                                                                        2002

                                                                                               2003

                                                                                                      2004

                                                                                                             2005

                                                                                                                    2006

                                                                                                                           2007

                                                                                                                                  2008

                                                                                                                                         2009

                                                                                                                                                2010

                                                                                                                                                       2011

                                                                                                                                                              2012

                                                                                                                                                                     2013

                                                                                                                                                                            2014

                                                                                                                                                                                   2015

                                                                                                                                                                                          2016

                                                                                                                                                                                                 2017

                                                                                                                                                                                                        2018

                                                                                                                                                                                                               2019

                                                                                                                                                                                                                      2020

                                                                                                                                                                                                                             2021
                                                            Completions                          Estimated required volume                                     Permits
 Sources: Federal Statistics Office, IW Köln, GdW (German Association of Professional Homeowners)

Company Presentation – September 2018                                                                        page 21
German Residential – Favorable Fundamentals

Growing number of smaller households                                                                          Fragmented ownership structure

       While the overall population in Germany is expected to                                                        Germany is the largest housing market in Europe with
       slightly decline, the number of households is forecast to                                                     ~42m housing units, of which ~23m are rental units.
       grow until at least 2035 with a clear trend towards                                                           Ownership structure is highly fragmented and majority of
       smaller households.                                                                                           owners are non-professional landlords.
       The household growth is driven by various demographic                                                         Listed sector represents ~4% of total rental market.
       and social trends including divorce rates, employment
       mobility etc.

                      Distribution of household sizes (million)                                                                         Ownership structure (million units)

                                                  Σ 43.2
       Σ 40.1               Σ 40.9                   1.1                                                                   Amateur landlords                                                      15.0
          1.4                   1.4                  3.3
          3.8                   3.8                  4.4
                                                                                                                     Professional, not listed                     2.3
          5.0                   5.0
                                                                          5 or more persons
                                                                          4 persons                                       Government owned                        2.3
                                                     15.4
         13.8                  13.9                                       3 persons
                                                                                                                                   Cooperatives                  2.1
                                                                          2 persons
                                                                          1 person
                                                                                                                Listed property companies                    0.9

                                                     19.0
         16.1                  16.8
                                                                                                                         Churches and other                 0.6

         2010                 2016                2035(E)

 Sources: German Federal Statistics Office, GdW (German Association of Professional Homeowners). 2035(E) household numbers are based on trend scenario of the German Federal Statistics Office.

Company Presentation – September 2018                                                                page 22
German Residential – Favorable Fundamentals

Urbanization trend across Europe                                                                           Increasing affordability in Germany

        Cities across Europe are on the rise and the population                                                   Affordability in Germany is higher than France, UK, Spain
        living in cities is expected to grow substantially by 2030                                                and the Netherlands.
        and 2050, respectively.                                                                                   Whereas most other European countries saw an increase,
                                                                                                                  the share of rent-related payments in relation to
                                                                                                                  disposable income declined in Germany between 2007
                                                                                                                  and 2016.

                          % of population living in urban areas                                                               Rent as % of disposable household income*

                                                                                 93          95 97                                                                                                   27.0
                                                                            90                                                                           26.2 26.0                  26.2
                                                                88                      90                                                                                                    25.6
                               84               84                     87                                                            24.2 23.9                               24.1
                                                           84                                                          23.5
                          78               79         77
                                      77
             71      74
                                                                                                                20.0

        62
   58

     Austria          Europe          Germany           France          Sweden        Netherlands              Netherlands          Germany              Sweden                France           UK

                                    2015        2030(E)         2050(E)                                                                               2007         2016
                                                                                                           *Share of disposable household income spent on rent, water, electricity and fuel

 Sources: United Nations, JLL Research, European Commission, Federal Statistics Office, Eurostat

Company Presentation – September 2018                                                                page 23
IR Contact & Financial Calendar

                         Contact                                          Financial Calendar
                                            Sep 24             GS/Berenberg German Corporate Conference, Munich
         Rene Hoffmann                      Sep 25             Baader Investment Conference, Munich1
         Head of Investor Relations         Sep 26             BofAML Global Real Estate Conference, New York
         Vonovia SE                         Sep 28             Societe Generale Pan-European Real Estate Conference, London
         Universitätsstraße 133             Oct 10-11          Roadshow Scandinavia, Copenhagen & Stockholm1
         44803 Bochum
                                            Nov 12-16          Roadshow Asia (Tokyo, Seoul, HK, Kuala Lumpur, Singapore)
         Germany
                                            Dec 6              Interim results 9M 2018

                                            Dec 7-13           Roadshow Europe (Zurich, Paris, London, Amsterdam)
         +49 234 314 1629
         rene.hoffmann@vonovia.de           Dec 12             EPRA Corporate Access Day, London

         investorrelations@vonovia.de       Mar 7, 2019        FY2018 Results

         www.vonovia.de                     May 7, 2019        Interim results 3M 2019

                                            May 16, 2019       Annual General Meeting

                                            Jun 4-5, 2019      Capital Markets Day

                                            Aug 2, 2019        Interim results 6M 2019

                                            Nov 5, 2019        Interim results 9M 2019

1   IR only
    Company Presentation – September 2018            page 24
Appendix

   Pages        Content

   26-38        H1 Results – Additional Data

   39-40        Maintenance ≠ Capex ≠ Modernization Investments

   41-45        Financing

   46-47        Acquisitions

     48         Dividend Track Record

     49         Fair Value per sqm Evolution

     50         Portfolio Evolution

   51-53        Vonovia Shares

   54-59        Sustainability

     60         No Correlation between German Residential Yields and Interest Rates

     61         Three Layers of Perception

   62-64        Management Compensation

   65-69        Pictures

     70         Disclaimer

Company Presentation – September 2018                       page 25
All numbers stand-alone
       Vonovia, excluding Buwog
            and Victoria Park

Continued EBITDA Margin Expansion

         Adj. EBITDA Operations is up 4.1% to €632.6m.

         EBITDA Operations margin (excl. maintenance) expanded to 90.9%.

    Adj. EBITDA Operations margin and cost per unit
                                                                                                                        €m                               H1 2018    H1 2017     Delta

                                                                                                                        Rental income                      838.8      833.2    +0.7%

                                                                                                                90.9%
                                                                                                88.6%

                                                                                                                        Maintenance expenses               -131.6     -127.3   +3.4%
                                                                                87.0%
                                                                84.8%
                                                82.2%
                                79.6%

                                                                                                                        Operating expenses                 -110.2     -132.4   -16.8%
                77.4%

                                                                                                        75.3%
                                                                                        73.2%
                                                                        70.9%
                                                        67.7%

                                                                                                                        Adj. EBITDA Rental                 597.0      573.5    +4.1%
                                        63.8%
                        60.8%
        60.0%

          850             830

                                          754                                                                           Income                             610.4      483.8    +26.2%
                                                          645
                                                                          570
                                                                                          526                            of which external                  88.3       80.1    +10.2%

                                                                                                                         of which internal                 522.1      403.7    +29.3%

                                                                                                                        Operating expenses                 -558.7     -438.2   +27.5%

                                                                                                                        Adj. EBITDA Value-add Business      51.7       45.6    +13.4%

         IPO            2013            2014            2015            2016            2017             H1
                                                                                                        2018
                                                                                                                        Adj. EBITDA Other1                  -16.1      -11.5   +40.0%
                        EBITDA Operations margin

                        EBITDA Operations margin (excl. maintenance)
                        Cost per unit                                                                                   Adj. EBITDA Operations             632.6      607.6    +4.1%

1   Mainly consolidation

Company Presentation – September 2018                                                                                     page 26
All numbers stand-alone
     Vonovia, excluding Buwog
          and Victoria Park

Continued FFO Growth

      Driven by better operational performance and lower interest expenses, FFO1 was up 11.5% y-o-y or 2.5%
      per share (eop) in spite of 8.7% more issued shares.

€m                                                                         H1 2018    H1 2017    Delta
(unless indicated otherwise)

Adj. EBITDA Operations                                                        632.6      607.6    4.1%

Interest expense FFO 1                                                       -114.3     -138.0   -17.2%

Current income taxes FFO 1                                                     -8.0      -11.9   -32.8%

FFO 1                                                                         510.3      457.7   11.5%

  of which attributable to Vonovia’s shareholders                             484.7      431.1   12.4%

  of which attributable to Vonovia’s hybrid capital investors                  20.0       20.0    0.0%

  of which attributable to non-controlling interests                            5.6        6.6   -15.2%

Capitalized maintenance                                                       -49.1      -30.5   61.0%

AFFO                                                                          461.2      427.2    8.0%

Adjusted EBITDA Sales                                                          48.3       44.3    9.0%

Current income taxes FFO 2                                                    -13.8      -20.1   -31.3%
                                                                                                          •   8.7% higher NOSH
                                                                                                              y-o-y
FFO 2                                                                         544.8      481.9   13.1%    •   Back-of-an-envelope
                                                                                                              calculation: pro forma
                                                                                                              FFO 1 including full
                                                                                                              contribution from
FFO 1 € / share (eop NOSH) (H1 2018: 518.1m; H1 2017: 476.5m)                  0.98       0.96    2.5%        Buwog and Victoria
                                                                                                              Park in H1 would be
FFO 1 € / share (avg. NOSH) (H1 2018: 493.2m; H1 2017: 468.2m)                 1.03       0.98    5.8%        ~€36m or
                                                                                                              ~7 cents higher

Company Presentation – September 2018                            page 27
In-place Valuation vs. Fair Value Uplift

                     In-place multiple                                Fair value (€/sqm)                            H1 2018 fair value uplift (l-f-l)
                 0       10     20        30   40                 0      1,000      2,000   3,000   4,000                  0%     5%          10%       15%

      Munich                                           Munich                                                   Augsburg

       Berlin                                         Stuttgart                                                Dortmund

     Potsdam                                         Frankfurt                                                   Bremen

    Stuttgart                                         Potsdam                                                   Stuttgart

    Hamburg                                              Berlin                                                Mannheim

     Freiburg                                         Freiburg                                                Leverkusen

    Frankfurt                                        Hamburg                                                       Essen

     Cologne                                           Cologne                                                   Bielefeld

   Dusseldorf                                       Dusseldorf                                                 Osnabruck

        Bonn                                        Wiesbaden                                                      Berlin

    Karlsruhe                                        Augsburg                                                    Hanover

    Augsburg                                         Karlsruhe                                                    Leipzig

     Bremen                                              Bonn                                                   Hamburg

     Hanover                                        Mannheim                                                   Dusseldorf

      Leipzig                                         Hanover                                                         Kiel

   Wiesbaden                                        Leverkusen                                                  Karlsruhe

   Mannheim                                            Bremen                                                    Bochum

     Dresden                                            Leipzig                                                 Frankfurt

          Kiel                                             Kiel                                                   Munich

Braunschweig                                    Braunschweig                                                Braunschweig

  Leverkusen                                          Dresden                                                       Bonn

   Dortmund                                         Osnabruck                                                    Cologne

   Osnabruck                                         Dortmund                                                    Dresden

       Essen                                             Essen                                                   Potsdam

     Bielefeld                                        Bochum                                                   Wiesbaden

     Bochum                                           Bielefeld                                                  Freiburg

                                average                                          average                                            average

Company Presentation – September 2018                                       page 28
New Construction Update

 Commentary                                                       Evolution of completions

    The obstacle to higher construction volumes remains                                                                  ~2,800

    building permits, which continue to take very long in

    most cities.

                                                                                                           500
    In aggregate, the Vonovia Space Creation plus the                                    250                              1,000
                                                                        40

    Buwog Development Business are expected to deliver                  2016             2017         2018(E)            2019(E)

    ca. 2,800 completions next year.                                           Vonovia   Buwog (to hold)      Buwog (to sell)

 Geographic split of Vonovia completions since 2016
                                                                                                           Sample floor plan

                                                                                                                                2 rooms
                                                                                                                                3 rooms
                                                                                                                                4 rooms

Company Presentation – September 2018                       page 29
Buwog Development Projects Approved since Takeover

 Location                               Project                                  Completion   Investment   Hold vs. sell
                                                                                 (est.)       volume       (est.)

 Berlin                                 “Kompasshäuser” (50 resi units)          05/2020      ca. €30m
                                        “Haus an der Dahme” (33 resi units)
                                        (Part of 52° Nord Project with a total
                                        of 1,019 residential units of which
                                        216 have been completed)

                                                                                                               Hold   Sell

 Vienna                                 Marina Tower (486 resi units,            3/2021       ca. €114m
                                        7 commercial units)

                                        Marina Plaza (409 resi units,            10/2023      ca. €140m
                                        Rezoning required)

                                                                                                               Hold   Sell

 Vienna                                 ERnteLAA (191 resi units,                05/2020      Ca. €36m
                                        3 commercial units)

                                                                                                               Hold   Sell

Company Presentation – September 2018                             page 30
Reconciliation IFRS Profit to FFO

€m (unless indicated otherwise)                                                                                            H1 2018    H1 2017      Delta

IFRS PROFIT FOR THE PERIOD                                                                                                 1,200.0    1,064.6    +12.7%
                    1
Financial result                                                                                                             195.7      148.6    +31.7%
Income taxes                                                                                                                 646.7      588.0    +10.0%
Depreciation and amortization                                                                                                 23.3       14.9    +56.4%
Net income from fair value adjustments of investment properties                                                            -1,372.9   -1,164.7   +17.9%
= EBITDA IFRS                                                                                                                692.8      651.4    +6.4%
EBITDA IFRS BUWOG                                                                                                             -40.7          -         -
Non-recurring items                                                                                                           50.5       46.3    +9.1%

Total period adjustments from assets held for sale                                                                             -7.8      -32.9   -76.3%

Financial income from investments in other real estate companies                                                              -13.9      -12.9   +7.8%

= ADJUSTED EBITDA                                                                                                            680.9      651.9    +4.4%
Adjusted EBITDA Sales                                                                                                         -48.3      -44.3   +9.0%
= ADJUSTED EBITDA OPERATIONS                                                                                                 632.6      607.6    +4.1%
FFO interest expense2                                                                                                       -114.3     -138.0    -17.2%
Current income taxes FFO1                                                                                                      -8.0      -11.9   -32.8%
= FFO1                                                                                                                       510.3      457.7    +11.5%
Capitalized maintenance                                                                                                       -49.1      -30.5   +61.0%
= AFFO                                                                                                                       461.2      427.2    +8.0%
Current income taxes Sales                                                                                                    -13.8      -20.1   -31.3%
FFO2 (FFO1 incl. Adjusted EBITDA Sales / Current income taxes
                                                                                                                             544.8      481.9    +13.1%
Sales)

FFO1 per share in € (eop NOSH)                                                                                                0.98       0.96    +2.5%
AFFO per share in € (eop NOSH)                                                                                                0.89       0.90     -0.8%

Number of shares (million) eop                                                                                               518.1      476.5

1   Excluding income from investments.   2   Including financial income from investments in other real estate companies.

Company Presentation – September 2018                                                                         page 31
IFRS P&L

€m (unless indicated otherwise)                                             H1 2018   H1 2017     Delta

Income from property letting                                                1,258.6   1,171.6   +7.4%
Other income from property management                                          24.3      20.8   +16.7%
Income from property management                                             1,282.9   1,192.4   +7.6%

Income from disposal of properties                                            386.4     701.9   -44.9%
Carrying amount of properties sold                                           -340.5    -664.9   -48.8%
Revaluation of assets held for sale                                            34.6      53.1   -34.8%
Profit on disposal of properties                                              80.5       90.1   -10.7%
Income from the disposal of properties (Development)                           73.5         -         -
Cost of sold properties                                                       -60.6         -         -
Profit on the disposal of properties (Development)                             12.9         -         -
Net income from fair value adjustments of investment properties             1,372.9   1,164.7   +17.9%
Capitalized internal expenses                                                 255.7     199.5   +28.2%
Cost of materials                                                            -627.3    -569.5   +10.1%
Personnel expenses                                                           -236.9    -207.6   +14.1%
Depreciation and amortization                                                 -23.3     -14.9   +56.4%
Other operating income                                                         50.4      51.5    -2.1%
Other operating expenses                                                     -146.8    -124.4   +18.0%
Financial income                                                               26.6      43.7   -39.1%
Financial expenses                                                           -200.9    -172.9   +16.2%
Earnings before taxes                                                       1,846.7   1,652.6   +11.8%

Income taxes                                                                 -646.7    -588.0   +10.0%
Profit for the period                                                       1,200.0   1,064.6   +12.7%

Attributable to:
 Vonovia’s shareholders                                                     1,143.4     993.2   +15.1%
 Vonovia’s hybrid capital investors                                            14.8      14.8      0%
 Non-controlling interests                                                     41.8      56.6   -26.1%

Earnings per share (basic and diluted) in €                                   2.30      2.12    +8.5%

Company Presentation – September 2018                             page 32
IFRS Balance Sheet (1/2 – Total Assets)

€m (unless indicated otherwise)                     Jun. 30, 2018   Dec. 31, 2017    Delta

Assets

Intangible assets                                        3,705.7          2,637.1   40.5%

Property, plant and equipment                              222.1           177.6    25.1%

Investment properties                                   40,992.2        33,182.8    23.5%

Financial assets                                           808.4           698.0    15.8%

Other assets                                                18.9             13.8   37.0%

Deferred tax assets                                         10.5             10.3    1.9%

Total non-current assets                               45,757.8         36,719.6    24.6%

Inventories                                                   6.6             6.2    6.5%

Trade receivables                                          441.0           234.9    87.7%

Financial assets                                            14.2              0.5   >100%

Other assets                                               193.3             98.4   96.4%

Income tax receivables                                      44.2             47.9   -7.7%

Cash and cash equivalents                                  865.8           266.2    >100%

Real estate inventories                                    309.7                -        -

Assets held for sale                                       155.0           142.6     8.7%

Total current assets                                     2,029.8           796.7    >100%

Total assets                                           47,787.6         37,516.3    27.4%

Company Presentation – September 2018     page 33
IFRS Balance Sheet (2/2 – Total Equity and Liabilities)

€m (unless indicated otherwise)                                                    Jun. 30, 2018   Dec. 31, 2017     Delta
Equity and liabilities
Subscribed capital                                                                        518.1         485.1      +6.8%
Capital reserves                                                                        7,182.2       5,966.3      +20.4%
Retained earnings                                                                       8,978.8       8,471.6      +6.0%
Other reserves                                                                            237.1         157.8      +50.3%
Total equity attributable to Vonovia's shareholders                                   16,916.2      15,080.8       +12.2%
Equity attributable to hybrid capital investors                                         1,021.4       1,001.6      +2.0%
Total equity attributable to Vonovia's shareholders and hybrid capital investors      17,937.6      16,082.4       +11.5%
Non-controlling interests                                                                 937.7         608.8      +54.0%
Total equity                                                                          18,875.3      16,691.2       +13.1%
Provisions                                                                                603.5         607.2       -0.6%
Trade payables                                                                              1.0            2.4     -58.3%
Non derivative financial liabilities                                                   17,848.6      12,459.4      +43.3%
Derivatives                                                                                68.8            8.7     >100%
Liabilities from finance leases                                                            94.5          94.7       -0.2%
Liabilities to non-controlling interests                                                   31.7          24.9      +27.3%
Financial liabilities from tenant financing                                                54.7              -           -
Other liabilities                                                                          49.9          65.3      -23.6%
Deferred tax liabilities                                                                6,388.4       5,322.6      +20.0%
Total non-current liabilities                                                         25,141.1      18,585.2       +35.3%
Provisions                                                                                405.1         376.5      +7.6%
Trade payables                                                                            207.4         130.7      +58.7%
Non derivative financial liabilities                                                    1,926.0       1,601.1      +20.3%
Derivatives                                                                               362.2            4.4     >100%
Liabilities from finance leases                                                             4.8            4.6     +4.3%
Liabilities to non-controlling interests                                                    6.7            9.0     -25.6%
Financial liabilities from tenant financing                                               100.2            7.7     >100%
Other liabilities                                                                         758.8         105.9      >100%
Total current liabilities                                                               3,771.2       2,239.9      +68.4%
Total liabilities                                                                     28,912.3      20,825.1       +38.8%
Total equity and liabilities                                                          47,787.6      37,516.3       +27.4%

Company Presentation – September 2018                                   page 34
IFRS Cash Flow

€m (unless indicated otherwise)                                      H1 2018      H1 2017      Delta

Cash flow from operating activities                                      513.5        475.4     8.0%

Cash flow from investing activities                                    -3,158.7     -1,179.0   >100%

Cash flow from financing activities                                    3,244.8       -459.1        ---

Net changes in cash and cash equivalents                                 599.6      -1,162.7       ---

Cash and cash equivalents at the beginning of the period                 266.2      1,540.8    -82.7%

Cash and cash equivalents at the end of the period                       865.8        378.1    >100%

Company Presentation – September 2018                      page 35
Cost of Materials

€m
                                                       H1 2018   H1 2017   Delta
(unless indicated otherwise)

Expenses for ancillary costs                             334.1     317.5   5.2%

Expenses for maintenance                                 247.4     204.0   21.3%

Other cost of purchased goods and services                45.8      48.0   -4.6%

Total cost of materials                                  627.3     569.5   10.1%

Company Presentation – September 2018        page 36
All Strategic Markets Show Upward Potential

                                                       Fair value1                                                                                                         In-place rent
                                                                                                                                                                                                                                        Average rent             Reversionary
                                                                                                                                                                                             Organic rent
        Regional Market                              (€m)            (€/sqm)
                                                                                    Residential       Living area        Vacancy            Total       Residential     Residential
                                                                                                                                                                                                  growth
                                                                                                                                                                                                                        Multiple      growth forecast          potential2 (%)
                                                                                          units       ('000 sqm)             (%)      (p.a., €m)         (p.a., €m) (€/sqm/month)                                (in-place rent)        CBRE (5 yrs)           from Optimize
                                                                                                                                                                                                     (%)
                                                                                                                                                                                                                                                 (%)              Apartments

 Berlin                                             6,328              2,183             44,010             2,806              1.9            225                214               6.46                  3.9                 28.2                     4.3               47.7

 Rhine Main Area (Frankfurt,
                                                    3,650              2,022             27,821             1,775              2.4            170                164               7.83                  3.9                 21.5                     3.5               41.7
 Darmstadt, Wiesbaden)

 Rhineland (Cologne, Düsseldorf,
                                                    3,376              1,650             29,699             1,989              3.0            168                160               6.91                  3.3                 20.1                     3.1               27.1
 Bonn)

 Southern Ruhr Area (Dortmund,
                                                    3,124              1,140             43,836             2,680              3.4            185                179               5.76                  4.5                 16.9                     2.9               30.4
 Essen, Bochum)

 Dresden                                            2,980              1,275             38,576             2,194              2.8            161                151               5.88                  3.8                 18.5                     3.7               33.2

 Hamburg                                            2,348              1,796             20,095             1,274              1.7            107                102               6.80                  4.6                 22.0                     3.3               43.7

 Munich                                             1,902              2,900              9,695                637             0.9              64                60               7.88                  3.7                 29.9                     4.8               55.1

 Stuttgart                                          1,826              1,989             14,116                889             1.9              84                80               7.65                  3.1                 21.8                     3.1               40.3

 Kiel                                               1,816              1,289             23,475             1,351              2.0            101                 95               6.00                  5.6                 18.0                     3.2               39.9

 Hanover                                            1,511              1,448             16,261             1,023              2.8              78                75               6.31                  5.1                 19.3                     2.9               40.6

 Northern Ruhr Area (Duisburg,
                                                    1,442                873             26,394             1,631              3.6            107                103               5.49                  4.5                 13.5                     2.4               25.8
 Gelsenkirchen)

 Bremen                                             1,036              1,365             12,090                733             3.5              50                47               5.54                  3.1                 20.9                     3.6               29.7

 Leipzig                                              809              1,303              9,166                587             5.1              42                39               5.85                  3.0                 19.4                     2.9               25.5

 Westphalia (Münster, Osnabrück)                      723              1,164              9,475                614             2.5              42                41               5.77                  5.1                 17.0                     3.0               40.0

 Freiburg                                             554              1,984              4,044                276             1.7              24                23               7.12                  4.3                 23.2                     4.1               44.6

 Other Strategic Locations                          2,348              1,359             26,648             1,690              2.8            131                126               6.40                  4.8                 17.9                     3.3               40.2

 Total Strategic Locations
                                                 35,772               1,567           355,401             22,149               2.7         1,738             1,659                6.41                  4.1                  20.6                    3.4                36.4
 Germany

 Austria                                            2,468              1,299             23,215             1,733              4.2            108                 91               4.56                 n/a                  22.8                     n/a                n/a

 Sweden                                             1,599              1,462             14,052                997             1.4            115                104               8.83                 n/a                  14.0                     n/a                n/a

Note: In-place rents in Austria and Sweden are not fully comparable to Germany, as Sweden, for example, includes certain ancillary costs. The table above shows the rental level unadjusted to the German definition.
1 Fair value of the developed land excluding € 1,205.4 million, of which € 344.5 million for undeveloped land and inheritable building rights granted, € 251.9 million for assets under construction, € 461.7 million for development and € 147.3 million for other.
2 Average spread between new rents and old rents for all relettings under Optimize Apartment investment strategy.

 Company Presentation – September 2018                                                                                            page 37
Maintenance

€m                                                 H1 2018                H1 2017   Delta
(unless indicated otherwise)

                                                                                                      €8.4/sqm1

                                                                                                                                  €7.2/sqm1
                                                                                                          2.3
Expenses for maintenance                                  131.6             127.3   3.4%                                              1.4

Capitalized maintenance                                     50.5             31.5   60.3%

                                                                                                          6.1                         5.7
Total                                                     182.1             158.8   14.7%

Maintenance capitalization                                                                             H1 2018                       H1 2017
                                                            28%              20%    4,0%
ratio
                                                                                                  Expenses for maintenance   Capitalized maintenance

1   All numbers stand-alone Vonovia, excluding Buwog and Victoria Park.

Company Presentation – September 2018                                                   page 38
German Resi: Capitalized Expenses ≠ Modernization Investments

                                        Capex is a maintenance expense that is capitalized on the balance sheet
                                        because it has a value-enhancing element.
     Modernization is not
                                        In contrast to modernization investments, capex does not result in rent
               capex
                                        growth.

                                        Capex is not discretionary.

                                        Our annual €1bn modernization program does not require new equity.

                                        The equity portion comes from the FFO 1 funds that are not paid out as
                                        dividends.

                                        The remainder is funded with debt (often specific debt facilities dedicated to
     Modernization is NAV
                                        modernization work and at very favorable terms).
             accretive
                                        The value rerating following the modernization work renders the investment
                                        program LTV neutral.

                                        Modernization investment leads to rent growth and increases performance
                                        (and dividend potential).

       In terms of cash,                Equity or organic cash flow is invested (usually supplemented with debt) for a

   modernization is similar             return.

        to an acquisition               The yield on that investment contributes to future rent growth / cash flows.
Company Presentation – September 2018                        page 39
Maintenance ≠ Capitalized Expenses ≠ Modernization Investments

                                                                                                                                      Comes with    Capitalized
                                                                                                                                                                  German Civil
                                                                                Relevant for       Relevant for     Relevant for      a yield and     on the
                                                            Description                                                                                              Code
                                                                                FFO and P&L           AFFO           cash flow         generates     balance
                                                                                                                                                                   Regulation
                                                                                                                                      rent growth     sheet

                                    Maintenance          • Required to
  Three clearly distinguishable

                                                           broadly maintain
                                     expenses
   categories in German Resi

                                                           the property
                                                           value
                                                         • Protect future                                                                                           §558
                                                           EBITDAs
                                     Capitalized         • Reactive, non-
                                      expenses             discretionary

                                                         • Changes
                                                           character of a
                                                           building or flat
                                    Modernization
                                     investments
                                                         • Enhance future                                                                                           §559
                                                           EBITDAs
                                                         • Pro-active,
                                                           discretionary

  Evolution                                                                                                    Disclosure differs within German Resi Sector, as capitalized
                                                                                                               expenses and modernization investments are often disclosed
                                                                                                               as one even though German Civil Code Regulation allows for
                                                                                                               and even requires separate treatment of capitalized expenses
                                                                                                               and modernization investments.
                                                                                                               Subtracting modernization investment in Vonovia’s AFFO is
                                                                                                               questionable, as modernization investments are, similar to an
                                                                                                               acquisition,
                                                                                                                      partly debt-financed
                                                                                                                      discretionary
                        2013                2014            2015              2016         2017
                                                                                                               Impact of modernization investments on rent growth is similar
                                  Maintenance expenses      Capitalized expenses     Investments
                                                                                                               to an acquisition, hence the inclusion in organic rent growth.
Note: “Modernization investments” on this page also includes space creation investments.

Company Presentation – September 2018                                                                page 40
Cyclicality of Debt Instruments Requires Diversification

    Debt-Issuances in the European Real Estate Sector 2005 – 2018 YTD (€bn)

              3,000

              2,500                                      37
                                                                                                                                                                     GRF-1
                                                    33          33                                                                                                   Q2/13
                                                                                                30
              2,000                                                                                                                                                             GRF-2
                                                                                                                                                                 Taurus         Q4/13
                                                                                                                                                                 Q1/13
                                     24
                                                                                                          22
              1,500                                                       21

                                                                                                                                                                                                                                                                             Volume (€bn)
                                20                                                                                                                                                                                                                                 20
 EPRA index

                                               19
                           18             18                                        18 18                                                                                                                             18
                                                           17        18                      15      17                                                                                                                                        17
                      16                                                                                                                                                  18                                  16 16                  16             16
                                                                               15                                                                           15                                           14                15
                                                                                                               15 13 14        14 13 13             13 12                                        13 13                          14                            13
              1,000                                                                                                                                              13 13              12
                                                                                                                          12                   12                              12        11 10                                            11             12              3
                                                                                                                                          10                                                                                                                            10

               500

                 0
                      1Q05
                      2Q05
                      3Q05
                      4Q05
                      1Q06
                      2Q06
                      3Q06
                      4Q06
                      1Q07
                      2Q07
                      3Q07
                      4Q07
                      1Q08
                      2Q08
                      3Q08
                      4Q08
                      1Q09
                      2Q09
                      3Q09
                      4Q09
                      1Q10
                      2Q10
                      3Q10
                      4Q10
                      1Q11
                      2Q11
                      3Q11
                      4Q11
                      1Q12
                      2Q12
                      3Q12
                      4Q12
                      1Q13
                      2Q13
                      3Q13
                      4Q13
                      1Q14
                      2Q14
                      3Q14
                      4Q14
                      1Q15
                      2Q15
                      3Q15
                      4Q15
                      1Q16
                      2Q16
                      3Q16
                      4Q16
                      1Q17
                      2Q17
                      3Q17
                      4Q17
                      1Q18
                      2Q18
                           2005                2006             2007                2008             2009            2010               2011           2012                2013              2014             2015              2016                2017           2018

                                                      EPRA Developed                       Mortgage Pfandbriefe1                 CMBS                                     Corporate bonds2                       Convertible bonds

Source: Dealogic, Bloomberg, Broker research, Deutsche Bundesbank, Verband deutscher Pfandbriefbanken (VdP), FactSet.
1 Quarterly Mortgage Pfandbrief issuances for 2005-2012 based on equal distribution of annual issuances based on VdP data; 2013 -3Q2017 figures based on Deutsche Bundesbank
2 Corporate bond issuance volume includes senior unsecured and hybrid bonds ≥ €50m, issued in EUR in Western Europe
3 Excludes Mortgage Pfandbriefe in Q2 2018 as data not yet available.

Company Presentation – September 2018                                                                                             page 41
Vonovia‘s House of Debt Financing

                                                                    Asset
                                                Specials            Backed Securities

                       Commercial                                       Structured           Mortgage-
                                                 EMTN                   Bank Loans            Loans
                         Papers

                                         Unsecured                              Secured
                                        Instruments                           Instruments

                                                       Development Debt

                                          Liquidity and Working Capital Facilities (WCF)

                                                             Rating

                                    Business Model, Cash Flow, Organization and Reputation

           Currently used by Vonovia

Company Presentation – September 2018                         page 42
Decision Tree Financing Sources

Volume
   &                                             Financing sources
Liquidity

   LTV                                          Debt                                              Equity

Unencum-
 berance
                            Secured                              Unsecured

              Structured       Senior
                                                             Syndicated   Convertible                  Rights
              Mortgage        Mortgage   CMBS   Bond                                    Hybrid   ABB
                                                                Loan        Bond                        Issue
                 Loans         Loans

Company Presentation – September 2018                  page 43
Covenants and KPIs                   (June 30, 2018)

              Bond KPIs                 Covenant                                      Level      Jun 30, 2018

                                        LTV
                                                                                      125%         215%
                                        Unencumbered Assets / Unsecured Debt

              Rating KPIs               Covenant                                               Level (BBB+)

                                        Debt to Capital
                                                                                                  1.80x
                                        Last 12M EBITDA / Last 12M Interest Expense

1   excl. Buwog and Victoria Park.

Company Presentation – September 2018                               page 44
Bonds / Rating

Corporate Investment grade rating                                                      as of 2018-08-02

Rating agency                           Rating                 Outlook      Last Update
Standard & Poor’s                        BBB+                   Stable      02 Aug 2018

Bond ratings                                                                           as of 2018-08-02

                  Name              Tenor & Coupon               ISIN        Amount                       Issue price        Coupon         Final Maturity Date   Rating

        Bond 002 (EUR-Bond)          6 years 3.125%          DE000A1HNW52     € 600m                       99.935%           3.125%            25 July 2019       BBB+
        Bond 004 (USD-Bond)         10 years 5.000%          US25155FAB22    USD 250m                      98.993%           4.580%1           02 Oct 2023        BBB+
           Bond 005 (EMTN)           8 years 3.625%          DE000A1HRVD5     € 500m                       99.843%           3.625%            08 Oct 2021        BBB+
          Bond 006 (Hybrid)         60 years 4.625%          XS1028959671     € 700m                       99.782%           4.625%            08 Apr 2074        BBB-
           Bond 007 (EMTN)           8 years 2.125%          DE000A1ZLUN1     € 500m                       99.412%           2.125%            09 July 2022       BBB+
          Bond 008 (Hybrid)         perpetual 4.000%         XS1117300837    € 1,000m                     100.000%           4.000%              perpetual        BBB-
          Bond 009A (EMTN)           5 years 0.875%          DE000A1ZY971     € 500m                       99.263%           0.875%            30 Mar 2020        BBB+
          Bond 009B (EMTN)          10 years 1.500%          DE000A1ZY989     € 500m                       98.455%           1.5000%           31 Mar 2025        BBB+
          Bond 010B (EMTN)           5 years 1.625%          DE000A18V138    € 1,250m                      99.852%           1.625%            15 Dec 2020        BBB+
          Bond 010C (EMTN)           8 years 2.250%          DE000A18V146    € 1,000m                      99.085%           2.2500%           15 Dec 2023        BBB+
          Bond 011A (EMTN)           6 years 0.875%          DE000A182VS4     € 500m                       99.530%           0.875%            10 Jun 2022        BBB+
          Bond 011B (EMTN)          10 years 1.500%          DE000A182VT2     € 500m                       99.165%           1.5000%           10 Jun 2026        BBB+
           Bond 012 (EMTN)     2 years 3M EURIBOR+0.380%     DE000A185WC9     € 500m                      100.000%        0.140% hedged         13 Sep 2018       BBB+
           Bond 013 (EMTN)           8 years 1.250%          DE000A189ZX0    € 1,000m                      99.037%           1.250%             06 Dec 2024       BBB+
          Bond 014A (EMTN)           5 years 0.750%          DE000A19B8D4     € 500m                       99.863%           0.750%            25 Jan 2022        BBB+
          Bond 014B (EMTN)          10 years 1.750%          DE000A19B8E2     € 500m                       99.266%           1.750%            25 Jan 2027        BBB+
           Bond 015 (EMTN)           8 years 1.125%          DE000A19NS93     € 500m                       99.386%           1.125%            08 Sep 2025        BBB+
           Bond 016 (EMTN)     2 years 3M EURIBOR+0.350%     DE000A19SE11     € 500m                      100.448%      3M EURIBOR+0.350%      20 Nov 2019        BBB+
          Bond 017A (EMTN)           6 years 0.750%          DE000A19UR61     € 500m                       99.330%           0.750%            15 Jan 2024        BBB+
          Bond 017B (EMTN)          10 years 1.500%          DE000A19UR79     € 500m                      100.805%           1.500%            14 Jan 2028        BBB+

          Bond 018A (EMTN)    4.75 years 3M EURIBOR+0.450%   DE000A19X793     € 600m                      100.000%        0.793% hedged        22 Dec 2022        BBB+

          Bond 018B (EMTN)           8 years 1.500%          DE000A19X8A4     € 500m                       99.188%           1.500%            22 Mar 2026        BBB+
          Bond 018C (EMTN)          12 years 2.125%          DE000A19X8B2     € 500m                       98.967%           2.125%            22 Mar 2030        BBB+
          Bond 018D (EMTN)          20 years 2.750%          DE000A19X8C0     € 500m                       97.896%           2.750%            22 Mar 2038        BBB+
           Bond 019 (EMTN)           5 years 0.875%          DE000A192ZH7     € 500m                       99.437%           0.875%             03 Jul 2023       BBB+
1
    EUR-equivalent Coupon

Company Presentation – September 2018                                       page 45
Acquisitions – Opportunistic but Disciplined

                                             Acquisition pipeline (‘000 units)                                                                   Acquisition criteria
        340
                                                                                    2013: Dewag+ Vitus (~41 k)*                                        No quantitative acquisition target.
                                                                                    2015: Gagfah (~140 k)*
                                                                                                                                                       No management incentive for external
                                                                                    2015: Südewo (~20 k)*
                                                                                    2016: conwert (~24 k)*
                                                                                                                                                       growth.

                                                                                    2017: Buwog (~50 k)*                                               Any potential acquisition must meet all
                                         252
                      240
                                                                                    H1 2018: Victoria Park (~14 k)*                                    four stringent acquisition criteria
                                                                                                                                                       assuming a 50/50 equity/debt
                                                                    219
                                                                                               206
                                                                                                                                                       financing.

          175
                                                                                                                               163

      140
                   136                                                                                                                                                  Strategic fit
                                 121

                                                105
                            98                                97
                                        87

                                                                                                                                                                        
                                                                               77
                                               71                                                                                                 FFO/share                             NAV/share
                                                                          69             66               67
                                                                                                                                                   accretive                            non-dilutive
                                                                                                                                       52
                                                                   44                                               41.5
                                                                                                     37
                                                      33                            30
                                                                                              26               26                 25
                                                                                                                                            14
                                                                                                                           5                                            BBB+ Rating
                                                                                                                                                                          (stable)
            Examined             Analyzed in more             Due Diligence,                       Bids                        Signed
                                      detail                  partly ongoing
     2013     2014     2015      2016    2017       H1 2018
   *Inclusion of acquisitions in the year the acquisition process started.

Company Presentation – September 2018                                                                           page 46
Acquisition Track Record

                              Larger acquisitions                                                 Fair Value                      In-place rent
                            (>1,000 units deal size)                                             in EUR/sqm                        in EUR/sqm
 Year

                                     Residential units
                 Deal                                        TOP Locations         @ Acquisition 30.06.2018    ∆     @ Acquisition 30.06.2018     ∆
                                            #

                                                            Berlin, Hamburg,
               DEWAG                              11,300        Cologne,                1,344         2,014    50%         6.76          7.61     13%
 2014

                                                             Frankfurt/Main

                VITUS                             20,500       Bremen, Kiel               807         1,334    65%         5.06          5.66     12%
                                                             Dresden, Berlin,
               GAGFAH                            144,600                                  889         1,493    68%         5.40          6.17     14%
                                                                Hamburg
            FRANCONIA                              4,100     Berlin, Dresden            1,044         1,727    65%         5.82          6.44     11%
 2015

                                                           Stuttgart, Karlsruhe,
              SÜDEWO                              19,400                                1,380         1,836    33%         6.83          7.34         8%
                                                             Mannheim, Ulm
 2016

        GRAINGER/Heitman                           2,400   Munich, Mannheim             1,501         2,020    35%         7.09          7.74         9%

             conwert                                         Berlin, Leipzig,
                                                  23,400                                1,353         1,694    25%         5.88          6.25         6%
        (Germany & Austria)                                  Potsdam, Wien
 2017

                                                             Berlin, Leipzig,
           thereof Germany                        21,200                                1,218         1,586    30%         5.86          6.15         5%
                                                                Potsdam
            thereof Austria                        2,200          Vienna                1,986         2,243    13%         6.11          7.16     17%

Note: Without most recent acquisitions in 2018

Company Presentation – September 2018                                                  page 47
Sustainable FFO 1 Growth and an Attractive Dividend Policy

    Months per year until costs are earned by recurring income1 and months exclusively worked for dividend
                            12
                            11               2.5
                            10                                             3.0                                       3.5                           4.0                         4.4
         Number of months

                             9
                             8
                             7
                             6
                             5
                             4
                             3
                             2
                             1
                             0
                                            2013                           2014                                      2015                         2016                        2017

                                   Maintenance Expenses      Operating Expenses             Interest         Taxes     FFO 1 part not paid out as dividend (ca. 30%)   Dividend (ca. 70%)

    Sustainable and growing cash flow with attractive pay-out ratio

                                                                                                                                                                          2.052
                                                                                                                                                  1.90
                                                                                                                                                                                       ca.
                                                                                                                        1.63                                                         70% of
                                                                                                                                                                                      FFO 1
                                                                                         1.30                                                                   1.32
                                                                                                                                   1.12
                                 0.95                     1.00                                          0.94
                                           0.67                     0.74

                                    2013                     2014                              2015                         2016                         2017                2018(E)
                                                                           FFO1 per share (€)                                         Dividend per share (€)
1   Rental income + EBITDA Value-add Business and Other; excluding sales effects.   2   Midpoint guidance.

Company Presentation – September 2018                                                                        page 48
Conservative Valuation Levels

         In-place values are still way below replacement values, in spite of accelerating valuation growth in recent
         years.

  Vonovia (German portfolio) – fair value per sqm (€; total lettable area) vs. modular and traditional construction costs

                                                                                                                                                                                            ~2,500

                                                                                                                                                                              ~1,800

                                                                                                                                             1,561
                                                                                                                             1,475
                                                                                                            1,264
                                                                                           1,054
                                                           901              964
         792              812             839

         2010            2011             2012             2013             2014             2015            2016             2017           H1 2018                         VNA modular    Market costs
                                                                                                                                                                             construction     for new
                                                                                                                                                                                costs       constructions
                                                                                                     land          building

Note: VNA 2010 – 2014 refers to Deutsche Annington Portfolio at the time; construction costs excluding land. The land value refers to share of total fair value allocated to land.
Source for market costs: Arbeitsgemeinschaft für zeitgemäßes Bauen e.V.

Company Presentation – September 2018                                                                      page 49
Substantial Reduction of Portfolio Locations

  03/2015 (incl. Südewo)                              12/2016                                    12/2017                              Strategic Portfolio
        818 locations                              665 locations                              577 locations                              ~400 locations

      Vonovia location
      High-influx cities (“Schwarmstädte”). For more information: http://investoren.vonovia.de/websites/vonovia/English/4050/financial-reports-_-presentations.html

Company Presentation – September 2018                                       page 50
Liquid Large-cap Stock

 Shareholder Structure (June 30, 2018)                                                                           Share Information

                                                                                                                 First day of trading                                               July 11, 2013
                                          7.9%
                                                                                                                 Number of shares outstanding                                       518.1 million
                                                          6.9%
                                                                                                                 Free float based on Deutsche Börse                                       93.1%
                                                                                                                 definition
                                                                   4.6%                  Blackrock
                                                                                                                 ISIN                                                            DE000A1ML7J1
                                                                   2.8%                  Norges
                                                                                                                 Ticker symbol                                                              VNA
                                                                                         Lansdowne
                                                                                                                 Share class                                 Registered shares with no par value
                                                                                         MFS
                                                                                                                 Main listing                                         Frankfurt Stock Exchange
                        77.8%                                                            Other                   Market segment                                               Regulated Market,
                                                                                                                                                                                Prime Standard

                                                                                                                 Major indices and weight                                    DAX           1.8%
                                                                                                                 (as of June 30, 2018)                           Stoxx Europe 600          0.2%
                                                                                                                                                                    MSCI Germany           1.7%
                                                                                                                                                                   GPR 250 World           1.7%
 Free-float factor according to Deutsche Börse definition: 93.1%
                                                                                                                                                         FTSE EPRA/NAREIT Europe           9.0%
 According to German law the lowest threshold for voting rights notifications is at 3%

 VNA share price performance since IPO vs. DAX and EPRA Europe Index

  240
                                                                                                 DAX
                                                                                               inclusion
  220
                                                                MSCI
  200                                                         inclusion                                                                                                             + 144%
  180                                                                                                                                                                                + 51%
  160                                                    MDAX
                                                       inclusion
              SDAX
  140       inclusion
                                                                                                                                                                                     + 45%
  120

  100
    Jul-13                Jan-14                Jul-14               Jan-15              Jul-15            Jan-16                Jul-16         Jan-17     Jul-17          Jan-18         Jun-18

                                                                           Vonovia             DAX           FTSE EPRA/NAREIT Dev. Europe

Source: Factset

Company Presentation – September 2018                                                                  page 51
Vonovia History

                       Seed portfolios of today‘s Vonovia have origin in public housing
                       provided by government, large employers and similar landlords
                       with a view towards offering affordable housing.

                       At beginning of last decade, private equity invested in German
                       residential on a large scale including into what is Vonovia today
                       (mainly Deutsche Annington and Gagfah then).

                       IPO in 2013.

                       Final exit of private equity in 2014.

 Share price and market capitalization
                                                                                                                                                                     Announcement   Takeover Offer
                                                                                                                                                    Announcement
                                                                                 Stoxx 600                                                                            Buwog (49k     Victoria Park
                       45                                                         inclusion
                                                                                                                          DAX        conwert acq.     cooperation
                                                                                                                                                                         units)       (14k units)
                                                                                                                        inclusion     (27k units)     with French
                                                                                                                                                     CDC Habitat
                                                                                                       Südewo acq.
                                                                                                                                                    (former “SNI”)
                                                                                                                                                                                                     20
                                                                                        Gagfah acq.     (20k units)

                                                                                                                                                                                                          Average market cap (Euro bn)
                       40                                                               (140k units)
                                                                       MSCI
                                                                     inclusion
   VWAP (Euro/share)

                       35                                                                                                                                                                            15
                                            DeWAG &        MDAX
                                            Vitus acq.   inclusion
                                           (41k units)
                       30
                                S-DAX                                                                                                                                                                10
                               inclusion

                       25

                                                                                                                                                                                                     5
                       20

                       15                                                                                                                                                                            0
                            Q3 '13 Q4 '13 Q1 '14 Q2 '14 Q3 '14 Q4 '14 Q1 '15 Q2 '15 Q3 '15 Q4 '15 Q1 '16 Q2 '16 Q3 '16 Q4 '16 Q1 '17 Q2 '17 Q3 '17 Q4 '17 Q1 '18 Q2 '18

                                                           Average market cap (Euro bn)                               VWAP (Euro/share)

 Source: Factset, company data

Company Presentation – September 2018                                                                           page 52
Reconciliation of Shares Outstanding

Date                                       NOSH          Comment
                                          (million)

December 31, 2016                          466.0

March 31, 2017                             468.8         conwert acquisition

June 30, 2017                              476.5         Scrip dividend

September 30, 2017                         485.1         Gagfah cross-border merger

December 31, 2017                          485.1

March 31, 2018                             485.1

June 30, 2018                              518.1         €1bn ABB in 05/2018; scrip dividend

 The number of outstanding shares is always available at
 http://investoren.vonovia.de/websites/vonovia/English/2010/key-share-information.html
Company Presentation – September 2018                  page 53
Sustainability at a Glance

 Integrated element of Vonovia’s business model
     With almost 400,000 apartments throughout Germany, Vonovia is the country’s leading residential real estate
     company. This role in the housing landscape imposes on us a particular responsibility to actively shape the
     development of the housing industry.
     We aim to live up to the responsibility by pursuing a continuous dialogue with our stakeholder groups, and by
     considering social and ecological issues in our core activities. A key priority for us is to use our business model and
     our holistic approach to help resolve the most urgent challenges in the housing industry and make a positive
     contribution to social development.

 Sustainability reporting at Vonovia

      Separate Sustainability Reporting Unit at Vonovia.

      Started Sustainability Reporting in 2015 with our first sustainability report published in 2016, based on GRI G4
      guidelines.

      Publication of third Sustainability Report in 2018, in accordance with the core option of the GRI standards,
      including the voluntary sector-specific disclosures for “Constriction and Real Estate”. The report is available at:
      http://reports.vonovia.de/2017/sustainability-report/

      Vonovia received the EPRA Gold Award for the 2017 Sustainability Report.

      Sustainability Report for 2018 to be published in April 2019.

Company Presentation – September 2018                       page 54
Sustainability Report 2017

 Achievements since last report

       Expansion of the key figures base

       Clearer definition of boundaries for CO2 calculation

       Adaptation of the structure to the requirements of the CSR guidelines implementation law

       Online only: Sustainability Report only available online

 Highlights

       Vonovia achieves renovation ratio of 5%

       Achieved energy savings of more than 45% for refurbished buildings

       Annual CO2 savings of approx. 50,000 tons

       Quarters development supports good neighborhood

       Company strengthens diversity

       Trainee rate of 5.5% emphasizes high significance

Company Presentation – September 2018                   page 55
Facing Climate Change / Vonovia achieves renovation ratio of 5%

     “The most important thing we can do as the housing sector to tackle climate change is to upgrade our portfolio,"
                                               Rolf Buch, CEO Vonovia.

                           In 2017, Vonovia invested >€1 bn in its properties, including maintenance. Volume of

                            modernization ~€779 m, almost 65% above 2016.

                           Vonovia exceeded the German government's targets for the energy efficient

                            renovation of housing stock: 3 % of apartments are to be modernized p.a., Vonovia

                            has hit 5 %. Nationwide, this rate is around 1 %.

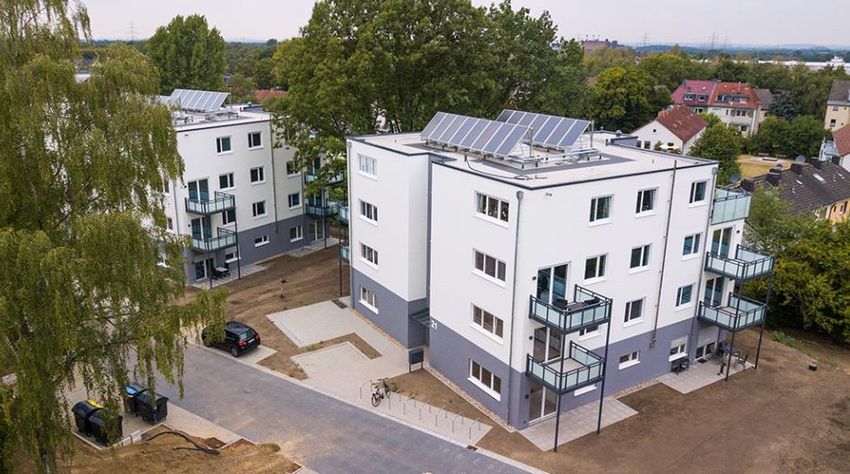
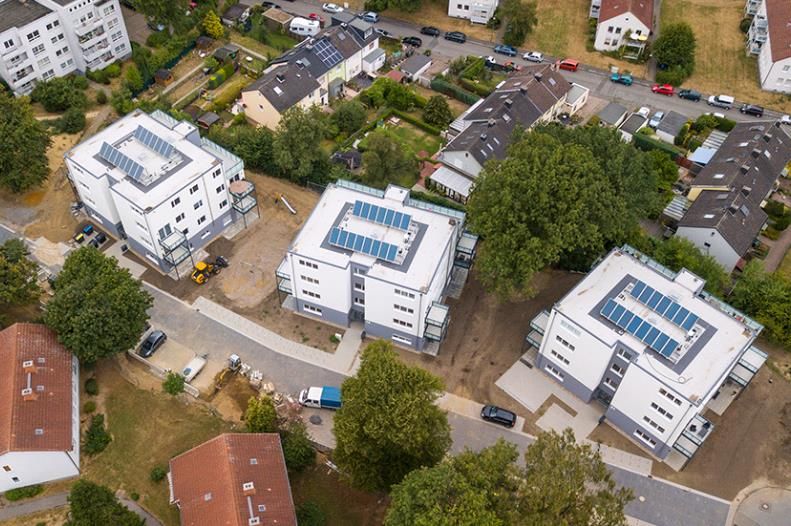
                           For new constructions, Vonovia considers feasibility of photovoltaics; within 2 years,

                            volume of electricity generated by our own photovoltaic systems has grown from 0 to a

                            total of 5,510 MWh, resulting in an annual saving of 2,900 metric tons of carbon dioxide.

                           We are currently working on equipping existing units with photovoltaic systems and

                            explore further possibilities: e.g. additional use of battery storage systems, cogeneration

                            units and corresponding e-mobility concepts for tenants. The first charging stations for

                            e-cars are to be built on Vonovia premises before the end of 2018.

Company Presentation – September 2018                       page 56
You can also read