Successfully Executing Strategy to Drive Long-Term Value for All Stockholders - August 12, 2021
←
→
Page content transcription
If your browser does not render page correctly, please read the page content below
Successfully Executing Strategy to Drive
Long-Term Value for All Stockholders

August 12, 2021

                                           Confidential l
Forward-looking Statements & Non-GAAP Financial Measures
This presentation contains forward-looking statements that involve risks, uncertainties, and assumptions, including statements regarding Box’s expectations regarding the size
of its market opportunity, sales productivity, its leadership position in the cloud content management market, the demand for its products, the impact of its acquisitions on
future Box product offerings, the benefits to its customers from completing acquisitions, the time needed to integrate acquired businesses into Box, the impact of the COVID-
19 pandemic on its business, its ability to grow and scale its business and drive operating efficiencies, its ability to achieve revenue targets and billings expectations, its ability
to achieve profitability on a quarterly or ongoing basis, its free cash flow, its ability to continue to grow unrecognized revenue and remaining performance obligations, the
timing of recent and planned product introductions, enhancements and integrations, the short- and long-term success, market adoption and retention, capabilities, and benefits
of such product introductions and enhancements, the success of strategic partnerships, its revenue, billings, gross margin, GAAP and non-GAAP net income (loss) per share,
non-GAAP operating margins for future periods, the related components of GAAP and non-GAAP net income (loss) per share, net retention date, weighted-average
outstanding share count expectations for Box’s fiscal second quarter and full fiscal year 2022, equity burn rate, the KKR-led investment and achievement of its potential
benefits, any potential repurchase of its common stock, whether, when, in what amount and by what method (whether by tender offer or otherwise) any such repurchase
would be consummated, and the share price of any such repurchase. In addition, this presentation contains preliminary financial results that have been prepared on a consistent
basis with prior periods based solely upon information available to management as of the date of this press release. Box is completing its financial closing procedures for the
three months ended July 31, 2021, and the preliminary financial results set forth in this press release could differ materially from the amounts that Box ultimately reports on
August 25, 2021 and in its Quarterly Report on Form 10-Q for the fiscal quarter ended July 31, 2021.
There are a significant number of factors that could cause actual results to differ materially from statements made in this presentation, including: (1) adverse changes in
general economic or market conditions, including those caused by the COVID-19 pandemic; (2) delays or reductions in information technology spending; (3) factors related to
Box’s highly competitive market, including but not limited to pricing pressures, industry consolidation, entry of new competitors and new applications and marketing initiatives
by Box’s current or future competitors; (4) the development of the cloud content management market; (5) the risk that Box’s customers do not renew their subscriptions,
expand their use of Box’s services, or adopt new products offered by Box on a timely basis, or at all; (6) Box’s ability to provide timely and successful enhancements and
integrations, new features, integrations and modifications to its platform and services; (7) actual or perceived security vulnerabilities in Box’s services or any breaches of Box’s
security controls; (8) Box’s ability to realize the expected benefits of its third-party partnerships; (9) the potential impact of shareholder activism on Box’s business and
operations; and (10) Box’s ability to successfully integrate acquired businesses and achieve the expected benefits from those acquisitions. Further information on these and
other factors that could affect the forward-looking statements we make in this presentation can be found in the documents that we file with or furnish to the US Securities and
Exchange Commission, including Box's most recent Quarterly Report on Form 10-Q filed for the fiscal quarter ended April 30, 2021.
You should not rely on any forward-looking statements, and we assume no obligation, nor do we intend, to update them. All information in this presentation is as of August 12,
2021.
This presentation contains non-GAAP financial measures and key metrics relating to the Company's past and expected future performance. You can find the reconciliation of
these measures to the nearest comparable GAAP financial measures in the appendix at the end of this presentation.

                                                                                                                                                                         Confidential l 2
Table of Contents

Executive Summary                                                                                                                        4

An Introduction to Box                                                                                                                   7

Successfully Evolving Our Business and Delivering Strong Operational Improvements and Results                                           10

KKR-Led Investment and Subsequent “Dutch Auction” Self-Tender in the Best Interest of All Stockholders                                  29

Strong, Independent and Qualified Board to Oversee Strategy
Taking Proactive Steps to Enhance Best-in-Class Corporate Governance                                                                    35

Starboard’s Demands are Not in the Interest of All Stockholders; Election of its Nominees Would be Destructive to Stockholder Value     43

Conclusion                                                                                                                              56

Appendix                                                                                                                                60

                                                                                                                                      Confidential l 3
Executive Summary
World-Class Board and Leadership Team with the Right Strategy to
Drive Value for Stockholders
Successfully We’ve built a stronger foundation across products, customers, and go-to-market (GTM) to drive sustainable operational improvements
Evolving Our Our investments in our platform have enabled multi-product, solution selling effort that is paying off and laying groundwork for
Business to Drive continued growth
Operational Results We’ve made significant operational changes to improve our margin profile, while investing to enhance efficiency and productivity
Re-acceleration of growth in recent quarters and continued improvements in profitability validate that our strategy and execution are
working
Accelerating
Growth and Driving Exceeded our Revenue growth + FCF margin target in FY 2021: 26.3% vs. target of 25%; also on pace to exceed FY 2022 target of 30%(1)
Margin Strong Billings and RPO(2) growth support our re-acceleration story and are leading indicators for future growth
Improvement Raised guidance for FY 2022 Revenue by $14 million since FQ4 2021; FY 2022 Non-GAAP Operating Margin expected to be approximately
19.5%, an increase over previous guidance of 18% to 18.5%
Committed to achieving 12-16% Revenue Growth and Revenue Growth + FCF Margin of 40%+ in FY 2024, ending January 31, 2024
Added seven new independent directors since 2018, including three appointed pursuant to Starboard settlement
Formed Operating Committee to identify and recommend opportunities for growth and margin enhancement (includes two
Board Has Starboard-approved directors), and Strategy Committee to conduct a comprehensive review of strategic options (includes all three
Implemented directors appointed pursuant to the settlement with Starboard)
Significant Board
Separated Chair and CEO roles and appointed Starboard-approved director as independent Chair; adopted majority vote standard for
and Governance
election of directors (with proxy contest carve-out); and eliminated certain supermajority voting requirements, subject to stockholder
Changes approval
Keenly focused on reducing equity burn rate and continue to evolve compensation program incorporating stockholder feedback
Notes: Free Cash Flow Margin is a non-GAAP financial measure. A reconciliation to its nearest GAAP financial measure can be found in the Appendix of this presentation.
1. Based on FY22E Revenue Growth + Free Cash Flow Margin guidance of at least 32% in preliminary results released on August 12, 2021.
2. Remaining performance obligations (RPO) represent, at a point in time, contracted revenue that has not yet been recognized. RPO consists of deferred revenue and
backlog, offset by contract assets. Box does not consider RPO to be a non-GAAP financial measure because it is calculated in accordance with GAAP. Confidential l 5World-Class Board and Leadership Team with the Right Strategy to
Drive Value for Stockholders (Cont.)
Board Is Maximizing KKR brings substantial financial, operational, and strategic experience in enterprise software to the Box Board
Stockholder Value
Unanimously approved KKR-led investment is validation of Box’s strategy and the potential to create future value for all stockholders
Through KKR-Led
Investment Subsequent “Dutch auction” self-tender provided the opportunity for stockholders to sell at a materially higher price than the low
twenties per share that Starboard indicated would be acceptable for a sale of the company
Diverse skillsets and proven track records of helping public companies drive disciplined growth, profitability, and stockholder value
Strong, Independent Global go-to-market strategy and business operations experience through all business cycles
and Qualified Board
Significant SaaS and enterprise software industry expertise as both operators and board members
to Oversee Strategy
Proven ability and willingness to pursue a sale of a company when it maximizes value for stockholders
Our nominees include a former public company CFO and 2019 Director of the Year of the National Association of Corporate Directors,
a sitting public company CEO who has successfully scaled and led multiple multi-billion dollar SaaS and enterprise software businesses,
Vastly Superior and Box’s Co-founder & CEO who is a pioneer of cloud content management
Nominees Our nominees have nearly seven decades of SaaS and enterprise software experience, either as operators or board members and have
Compared to helped create tens of billions of dollars in stockholder value through multiple company sale transactions
Starboard’s Slate None of Starboard’s nominees have any SaaS or enterprise software experience as an executive or director
Starboard’s independent nominees have a dearth of public company experience
Starboard is behaving like an investor whose interests are not aligned with our other stockholders
Starboard is Close- Starboard has been myopic in its persistent demands over the past eight months – sell the Company or fire the CEO – and continues to
Minded to be close-minded
Alternative Paths to Starboard abruptly withdrew its support for the Company’s path after a single quarter where Box provided revenue guidance that was
Create Value 1.1% below consensus estimates but beat on all other guided metrics
We believe Peter Feld wants to be on the Board because our Board (including the two Starboard-approved directors) exercised
independent judgment to act in the best interests of all stockholders rather than capitulate to Starboard’s demands Confidential l 6An Introduction to Box
Box Overview
•    Founded in 2005; Headquartered in Redwood City, CA

•    Leading Cloud Content Management platform that enables organizations
     to manage and share content from anywhere or any device

•    Addressing one of the largest markets in software – $55Bn market for                                                                                                  Scan
     content storage, collaboration, management, security – with a
                                                                                                                                                                                  Classify
     differentiated and expanding product portfolio
                                                                                                                                                                 Ingest

•    Diversified, global customer base serving the world’s largest enterprises to
     small-and-medium sized businesses
                                                                                                                                                        Extend                                 Share

        $771MM                                              96%                                      $120MM                                             Retain                               Collaborate
          FY21 Revenue                             Subscription Revenue                         FY21 Free Cash Flow (1)

           100K+                                            67%                                         1,200+                                                   Publish          Automate

                                                          Fortune 500                                 Customers with
            Customers                                                                                                                                                      Sign
                                                           Customers                                  >$100K in TAV

Notes:
1. Free Cash Flow is a non-GAAP financial measure. A reconciliation to its nearest GAAP financial measure can be found in the Appendix of this presentation.                            Confidential l 8
Category-Leading Cloud Content Management Platform
Differentiated Offering Competes Favorably Against Both Legacy and Cloud Vendors
Note: Permission to use charts neither sought nor obtained. Emphasis added to identify Box.
Confidential l 9Successfully Evolving Our Business and Delivering Strong Operational Improvements and Results
The Box of Today is Not the Box of 2019
Box has made extensive changes to its business, Board, governance, and compensation practices since early
2020
• The majority of Starboard’s critiques of Box’s performance relates to periods prior to the March 2020 settlement agreement – Box’s
Board and management team agreed that prior performance needed to be improved
• This is why the Board entered into a settlement agreement with Starboard, which resulted in the appointment of three new directors,
including Starboard-approved directors Bethany Mayer and Jack Lazar, and formed the Operating Committee, which included Ms.
Mayer and Mr. Lazar, to work with the Company’s CEO and management to identify and recommend opportunities for
improvement in growth and margin performance
• Despite two years of engagement, Starboard had not previously provided its detailed operating suggestions until now, and Box is
already executing a comprehensive strategy focused on growth and profitability that goes well beyond the suggestions in Starboard’s
presentation
• Starboard has repeatedly demonstrated that it is close-minded to the demonstrable progress already underway, and is attempting to
obfuscate its value-destructive demands to sell the Company – indicating a price in the low twenties per share would be
acceptable for a sale of the company – or to fire the CEO
Since early 2020, the reconstituted Board, Operating Committee and management team have taken extensive and concrete
actions to drive stockholder value
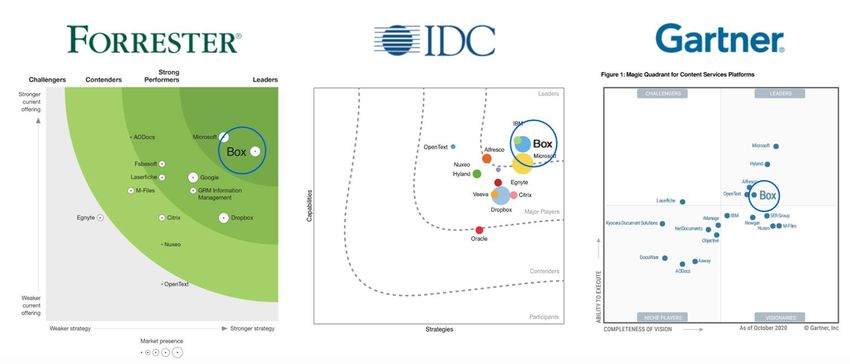
Confidential l 11While We are Not Satisfied with Our Long-Term Performance, Recent
Total Stockholder Returns Reflect Support for Our Strategy
Total Stockholder Return – Year to Date (1)(5) Total Stockholder Return – 1-Year (1)(5)
12/31/2020 - Current 8/11/2020 - Current
(%) 46% (%)
64%
40%
49%
17% 38%
22%
(12%)
(3) (4) (4)
(3) (4) (4)
Box SaaS Peer Set Dropbox OpenText Box SaaS Peer Set Dropbox OpenText
Total Stockholder Return – Since 03/2020 Starboard Settlement (1)(5) Total Stockholder Return – Since Box IPO (1)(5)
3/23/2020 - Current 1/22/2015 (2) - Current
(%) (%)
110% 124%
90% 89% 84% 100%
80%
54%
(3) (4) (4) (3) (4) (4)
Box SaaS Peer Set Dropbox OpenText Box SaaS Peer Set Dropbox OpenText
Notes:
1. Data as of August 11, 2021.
2. Box Total Stockholder Return (TSR) based on IPO price of $14.00 per share. Dropbox TSR based on IPO price of $21.00 and IPO date of 3/22/2018. TSR for comparable companies included in the SaaS Peer Set that completed their respective IPO
after 1/22/2015, including Momentive, Nutanix, Solar Winds, and Zuora calculated as return based on IPO price per share.
3. SaaS Peer Set reflects companies identified in our proxy statement on page 12 of Box's Amended Form 10-K for FY 2021 with regard to compensation benchmarking and are comparable with respect to industry, market capitalization, and growth
trajectory. SaaS Peer Set includes 8x8, FireEye, Guidewire, HubSpot, New Relic, Nutanix, Qualys, Momentive, Solar Winds, Zendesk, and Zuora; excludes Cloudera, Cornerstone OnDemand, Five9, Forescout, Proofpoint, and RealPage, which have
entered into definitive agreements to be acquired and have or will cease trading upon closing. TSR calculated as median of comparable companies listed for the respective periods. Had the SaaS Peers excluded companies been included in the
calculations, it would have resulted in YTD, 1YR, Since 3/2020, and Since IPO TSR of 13%, 46%, 95%, and 124%, respectively.
4. Comparisons to Dropbox and OpenText reflect publicly-traded companies with a substantial portion of their revenues generated by content management businesses that operate in similar markets and have business models and competitive
dynamics similar to Box.
5. Comparisons to broad market indices or technology-specific indices are less appropriate given they either represent wide cross-sections of publicly traded companies, often with varying end markets, size profiles, and growth and profitability
characteristics that may be less appropriate comparisons to Box or are dominated by a few large technology companies, rendering them a less appropriate TSR comparison for Box.
Confidential l 12Box’s Recent Track Record of Consistently Beating Market Expectations
Revenue Performance EPS Performance
vs. Consensus (%) (1) vs. Consensus (Cents) (1)
Forward Forward
Quarter In-Quarter In-Quarter
Quarter Guide Quarter Guide
Q3 FY20 1.4% Beat 0.4% Beat In-Line In-Line
Q4 FY20 1.1% Beat 0.9% Beat $0.03 Beat $0.02 Beat
Q1 FY21 0.9% Beat 0.7% Beat $0.05 Beat $0.05 Beat
Q2 FY21 1.4% Beat 0.6% Beat $0.06 Beat $0.02 Beat
Q3 FY21 0.9% Beat 1.1% Below $0.06 Beat $0.02 Beat
Q4 FY21 1.2% Beat 0.7% Beat $0.05 Beat $0.01 Beat
Q1 FY22 1.0% Beat 0.9% Beat $0.01 Beat N.A.(2)
(3)
Q2 FY22 1.2% Beat 1.4% Beat Not Yet Disclosed
Notes:
1. In-Quarter Beat defined as actual revenue or EPS greater than Refinitiv consensus estimate by >0.1% or >$0.01 respectively; In-Line defined as within 0.1% or $0.01; Miss defined as actual revenue or EPS less than consensus by at least 0.1%
or $0.01, respectively. Forward Quarter Guide beat defined as midpoint of guidance greater than Refinitiv consensus estimate by >0.1% or >$0.01 respectively; In-Line defined as within 0.1% or $0.01 of midpoint; Miss defined as guidance
less than consensus by at least 0.1% or $0.01. EPS figures are Non-GAAP measurements.
2. Comparison of FQ1 2022 Forward Quarter Guide to consensus estimates is Not Applicable due to effects of KKR transaction not reflected in consensus estimates at the time of earnings announcement.
3. Non-GAAP EPS actuals for Q2 FY22 or forward guide for Q3 FY22 not yet disclosed in preliminary results released August 12, 2021.
Confidential l 13Expansion of Valuation Multiple Since the Starboard Settlement
Enterprise Value / NTM Revenue
5.2x
4.4x
2.8x
(1)
Starboard Settlement (3/24/2020) Post-KKR Transaction Announcement Current
(2) (3)
(4/9/2021) (8/11/2021)
Notes: NTM revenue as reported by Refinitiv; Capitalization taken from public company filings.
1. As of Box announcing Starboard Settlement on March 23, 2020 (data as of March 24, 2020); based on 174.5MM fully diluted shares (including outstanding RSUs and options) at a stock price of $12.29, $178MM
of gross debt, no preferred stock, and cash of $196MM; NTM revenue of $773MM.
2. As of announcement of KKR-led investment in Box on April 9, 2021 (data as of April 9, 2021); based on 177.5MM fully diluted shares (including outstanding RSUs and options) at a stock price of $21.70, $455MM
of gross debt, $500MM of preferred stock and cash of $1,082MM; NTM revenue of $845MM.
3. As of August 11, 2021; based on 172.9MM fully diluted shares (pro forma for tender offer and 2.5MM shares repurchased in the open market and including outstanding RSUs and options) at a stock price of
$25.26, $442MM of gross debt, $500MM of preferred stock and cash of $802MM; NTM revenue of $870MM.
Confidential l 14Analysts Overwhelmingly Agree Our Strategy and Execution are Producing Results
Strong Strategy and Management has Executing Well, Striking a Healthy Balance …Leading to a Strong Outlook with
Delivered on Objectives… Between Growth and Profitability… Opportunities for Accelerating Growth
May 27, 2021 May 28, 2021 June 16, 2021
“Box saw success with large deals, closing a F1Q “Starboard has baulked at the company’s lagging “Box Stand-alone Narrative: Our view remains that
record 59 +$100k deals (+48% y/y) vs. 40 a year growth but yesterday’s modest revenue upside Box is still scratching the surface of its enterprise
ago as Suites remains a driving force with a record backed by nice billings and RPO growth suggests Box content management (ECM) opportunity, having
49% attach rate on +$100k deals. More broadly Box is executing on plans to accelerate growth. Box’s created a broad and differentiated solution set
is committed to the multi-product/upsell strategy, robust billings growth of 24% Y/Y… represented the (particularly with the addition of Shield, Relay, and
generating 59% of recurring revenue from highest growth in more than 3 years. Growth will most recently Sign) and a refined solution-selling
customers with add-ons, which we see expanding as continue to benefit from improved retention, multi- motion, which has led to growing attach rates for its
Box pursues an add-on focused go-to-market model product sales and an expanding number of >$100K Suites bundles.”
and net retention rate expansion.” deals.”
May 28, 2021 May 27, 2021 June 2, 2021
“Overall, we come away positive on Box’s progress in “… we think investors should take notice on BOX's “Leading growth indicators suggest that billings and
both product and sales execution and are comfortable execution against targets in recent quarters, which RPO accelerated in the quarter, giving management
incremental leverage can be gained (and progress reference both improved growth AND margin greater confidence in its ability to accelerate revenue
made towards FY24 targets of 12-16% revenue expansion. With the suite approach resonating, growth by FY2024. Despite the YTD
growth/mid-20% OM) as Box adds quota carrying improving productivity from its sales team, and a outperformance, we still believe Box remains
sales people, more focus is put on Suites traction…, broadened product suite, we would argue that undervalued given its superior platform, enterprise
and as new features strengthen the product portfolio visibility into the growth/margin profile is at an all- exposure, cash generation profile, and
(especially Shield and Sign).” time high.” underappreciated opportunity to pursue strategic
M&A.”
Note: Permission to use quotes neither sought nor obtained. Emphasis added to research report excerpts.
Starboard’s presentation largely relies on analyst quotes from 2019
Confidential l 15Box is Successfully Evolving its Business
Building a stronger foundation across product, customer, and GTM to deliver against stated targets
1
Reaping the Benefits of Multi-year investments in product innovation, including Shield and Relay, resulting in award-winning, multi-product platform
Investments in Solution selling success reflected in strong attach rates for Suites in $100K+ Total Account Value deals, demonstrating strong
Innovation customer uptake and meeting growing enterprise platform requirements
2
Extending Platform Disciplined approach to M&A to accelerate innovation and expand into additional high-value use cases
Through Disciplined Expanded our product portfolio with Box Sign, a native e-signature product offering, which is highly synergistic with existing
M&A product portfolio and customer workflows
3
Driving greater platform adoption across large customers, which demonstrate superior economics across deal values,
Greater Adoption and retention, expansion, and margins
Customer Expansion
Re-acceleration supported by recent improvements in net retention rates and strong growth among large customers
4
Significant Progress in Go-to-market initiatives have improved productivity and efficiency, with a 13% improvement YoY in FY 2021
Improving Go-to-
Market Efficiencies Sales and Marketing as percentage of Revenue declined 10 percentage points from FY 2020 to FY 2021
5
Driving Significant Focused on delivering significant cost reduction across all operating expense categories in FY 2021 and beyond
Improvement in As of Q2 FY22E, Non-GAAP Operating Margins were 18.3% on a trailing 12 months basis, improving 10 percentage points YoY (1)
Margins
FY22E guidance for Non-GAAP Operating Margins is approximately 19.5% YoY (1)
6
Box now has the product portfolio, Board and management, and revamped go-to-market engine to support re-acceleration
Clear Strategy to Re-
Accelerate Growth
Strong Billings and RPO growth, which are leading indicators of revenue growth, highlight fundamental strength of the business
Re-accelerating revenue growth is top management priority with a commitment to achieve 12-16% growth in FY 2024
Notes:
1. Based on FQ2 2022E preliminary results released on August 12, 2021. Confidential l 161 Reaping the Benefits of Investment in Product Innovation
Executing on product roadmap to drive differentiation, adoption, expansion, and lifetime value
Box Shuttle
Box Sign
Box Shield
Box Relay
Box GxP Validation
Box Platform
Box Zones
Box Governance
Box KeySafe
Box Core
FY05 FY16 FY17 FY18 FY19 FY20 FY21 FY22
Enterprise File Sync and Share Cloud Content Management
Confidential l 171 Shift to Multi-Product Solution Selling is Paying Off
Consistent improvement in attach rates demonstrates platform’s enhanced strategic value
Attach Rates for Box Suites (Multi-Product Pricing Plans) for $100K+ Deals (1)
70%+
10%
Q2 FY20 Q3 FY20 Q4 FY20 Q1 FY21 Q2 FY21 Q3 FY21 Q4 FY21 Q1 FY22 Q2 FY22E
Notes:
1. Q2 FY22E based on preliminary results released on August 12, 2021.
Confidential l 182 Prudent, Strategic M&A to Extend Platform Functionality
New high-value use cases increase customer engagement and stickiness
Disciplined Approach to Tactical M&A
Box Sign
Simple, secure e-
✓ Accelerate innovation and product roadmap signatures where
content lives
✓ Deliver new high-value workflows to customers
February 3, 2021
✓ Enhance existing platform capabilities “We see this acquisition as strategic as it represents an incremental improvement in Box's positioning for the
Future of Work, bolsters the platform's native content and workflow automation features, and has the potential
to drive adoption of Box's higher priced Business and Enterprise plans, aligning to its emphasis on the upsell
motion to existing customers.”
✓ Accretive / neutral to overall growth and March 12, 2021
margin
“Furthermore, the addition of Box Sign (stemming from the recent SignRequestacquisition) should not only
Note: Permission to use quotes neither sought nor obtained. Emphasis added research report provide improved functionality to the core platform, but also create monetization opportunities for higher tier
excerpts. use-casesthat require native e-signature capabilities.”
Confidential l 193 Strong Customer Economics and Upsell
Customers adopting one or more add-on products exhibit ~20 point higher net retention, ~10 point higher
gross margin, and ~7X higher average Annual Recurring Revenue than Core-only customers
Total Account Value & % of Total
24% 36%
17%
28% 28% 22%
55% 48% 41%
FY19 FY20 FY21
Core Only Core with 1 add-on Core with 2+ add-ons
(matured from Core Only or Core w/ 1 add-on)
Core with 2+ add-ons
Note: Box fiscal year ends January.
Confidential l 203 Re-Accelerating Customer Momentum and Expansion
COVID’s impact on customer metrics only transitory as strength of underlying execution drives
recent results
Quarterly Net Retention Rate Growth of $100K+ Deals
Despite COVID-related challenges in FY’21, recent results show
the our strategy to revamp our GTM engine producing results
Strong momentum
in FY 2021 driving
net retention rates YOY Growth 26% (3%) 28%
to relative highs Rate
107%
133(1)
106% 106%(1)
105% 107 104
104% 104% 85
103% 103%
102%
Q2 FY20 Q3 FY20 Q4 FY20 Q1 FY21 Q2 FY21 Q3 FY21 Q4 FY21 Q1 FY22 Q2 FY22E 1H FY19 1H FY20 1H FY21 1H FY22
COVID Period: CY 2020 COVID Period: CY 2020
Notes: Box fiscal year ends January.
1. As reported in preliminary results released on August 12, 2021. Confidential l 214 Increased Efficiency and Productivity in GTM Efforts
Intense management focus to improve GTM engine resulting in significant S&M leverage
S&M Spend as a % of Revenue
Sales productivity
54% • Double digit improvement in Enterprise bookings per AE YoY
• Increased account executive tenures drives higher productivity
45%
• Simplifying sales motion via Suites and repeatable use cases
40%
• Targeting investments in our most productive geographies and
segments
30%
Sales & marketing leverage
• Reduced sales overlays and reallocated resources
• Digital sales and marketing investments improve efficiency
• Customer expansion and renewals drive greater profitability
FY18 FY19 FY20 FY21
Note: Box fiscal year ends January. Sales and marketing expenses as a percentage of revenue are presented on a Non-GAAP basis. A reconciliation to the nearest GAAP financial measures can be found in the Appendix of this presentation.
Confidential l 224 Continued Strong Gains in Salesforce Productivity
Board and management have made significant investments to improve productivity and efficiency
Average Productivity by Rep by Segments
1H FY20 1H FY21 1H FY22 1H FY20 1H FY21 1H FY22 1H FY20 1H FY21 1H FY22
Enterprise Commercial Total
1H FY20 1H FY21 1H FY22
Notes: Box fiscal year ends January.
1. Percent improvement based on 2 year period from 1H FY20 to 1H FY22E.
Confidential l 235 Delivering Scaled Growth and Enhanced Profitability
Significant progress on our balanced approach to growing the business profitably
Quarterly Revenue ($MM) (1) TTM Non-GAAP Operating Margin ($MM) (2)
Q2 FY22E ~18.3%
margin of
~$214 20%
$148
(7.3%)
Q2 FY19 Q2 FY22E ($40)
Notes: Box fiscal year ends January. Q2 FY19 Q2 FY22E
1. Based on Q2 FY22E revenue of approximately $214M in preliminary results released on August 12, 2021.
2. Based on Q2 FY22E operating margin of approximately 20% in preliminary results released on August 12, 2021. A reconciliation of Non-GAAP Operating Profit to its nearest GAAP financial measure can be found in the Appendix of this
presentation.
3. CAGR based on period from Q2 FY19 to Q2 FY22E.
Confidential l 245 Optimizing Costs to Accelerate Margin Expansion
Disciplined efforts across the business to reduce underlying cost structure
Non-GAAP Operating Margin
(% of Revenue) Workforce Strategy
• Disciplined in headcount expenses
~19.5%(1) • Leveraging lower cost regions to drive savings
15%
Gross Margin Improvements
• Completed data center migration mid-FY21 to eliminate dual costs
• Driving higher margins via add-on product sales
• Optimizing infrastructure (e.g. public cloud, search, cold storage)
1%
(2%) Operational Rigor Drives Cost Reductions
• Reducing spend in areas not supporting growth
• Benefitting from investments in system automation
(11%) • Focusing on ROI and customer needs for new product development
(18%)
FY17 FY18 FY19 FY20 FY21 FY22E
Notes: Box fiscal year ends January.
1. Based on FY22E Non-GAAP operating margin guidance of approximately 19.5% from preliminary results released on August 12, 2021.
Confidential l 256 Business Well Positioned to Support Growth Acceleration
Success in rolling out multi-product strategy and streamlined GTM driving sustainable growth
YoY% Quarterly Revenue Growth
13.6% Guidance Midpoint (2)
12.6% Starboard demands ~11.5% ~12.1%
12.1% sale of the company at
the trough
11.4% 11.3%(1)
10.6%
10.3%
8.3%
Q3 FY20 Q4 FY20 Q1 FY21 Q2 FY21 Q3 FY21 Q4 FY21 Q1 FY22 Q2 FY22E Q3 FY22E Q4 FY22E
Notes: Box fiscal year ends January.
1. Based on Q2 FY22E revenue of approximately $214MM in preliminary results released on August 12, 2021.
2. Q3 FY22E Guidance Midpoint calculated on the midpoint of the revenue guidance of $218MM-$219MM; Q4 FY22E Guidance Midpoint calculated on the midpoint of Q3 FY22E revenue guidance of
$218MM-$219MM and FY 2022 revenue guidance of $856MM-860MM in the preliminary results released August 12, 2021. Confidential l 266 Strong Billings and RPO Growth Validate Strategy
Forward metrics signify increased revenue visibility and growth re-acceleration
YoY Billings Growth % (1) YoY RPO Growth % (2)
Q1 FY22 billings growth
exceeded prior Strong RPO increases revenue visibility and
expectations of high confidence in stated financial targets
teens 24.5%
Q2 FY22E billings
growth exceeded 19.7%
expectations of mid- 18.9%
single digits
18.6% 16.8%
13.4% 13.5%
~12.8% (3) 11.9%
10.5% 10.1%
9.2%
8.2% 7.9%
4.7%
Q3 FY20 Q4 FY20 Q1 FY21 Q2 FY21 Q3 FY21 Q4 FY21 Q1 FY22 Q2 FY22E Q3 FY20 Q4 FY20 Q1 FY21 Q2 FY21 Q3 FY21 Q4 FY21 Q1 FY22
Notes: Box fiscal year ends January.
1. Reconciliations of billings to revenue, deferred revenue, and contract assets calculated in accordance with GAAP can be found in the Appendix of this presentation.
2. Remaining performance obligations (RPO) represent, at a point in time, contracted revenue that has not yet been recognized. RPO consists of deferred revenue and backlog, offset by contract assets. Box does
not consider RPO to be a non-GAAP financial measure because it is calculated in accordance with GAAP.
3. Based on Q2 FY22E billings of approximately $213MM in preliminary results released on August 12, 2021. Confidential l 276 Committed to Exceeding Growth and Profitability Targets
Executing a clear and compelling strategy to drive financial results
Revenue Growth + Free Cash Flow Margin (1)
Revised FY22E guidance puts Box
on pace to exceed stated target for
second consecutive year
40%+
35%+
32%+
30%+
~25% 26.3%
(2)
FY21 FY22 FY23 FY24
Stated Target Actual Guidance
Notes: Box fiscal year ends January.
1. Free Cash Flow Margin is a Non-GAAP financial measure. A reconciliation to its nearest GAAP financial measure can be found in the Appendix of this presentation.
2. Based on FY22E Revenue Growth + Free Cash Flow Margin guidance of at least 32% from preliminary results released on August 12, 2021.
Confidential l 28KKR-Led Investment and Subsequent “Dutch Auction” Self-Tender in the Best Interest of All Stockholders
KKR Investment Brings Significant Strategic Value to Box
KKR investment is about supporting and Substantial experience advising and supporting software
accelerating Box’s strategy and growth and SaaS companies
KKR is motivated to see stockholder returns exceed $27
John Park brings valuable experience as a seasoned board
member of numerous leading enterprise software and
SaaS companies
John Park will serve as a director on the Board and on the
Audit and Compensation Committees
KKR has proven track record of partnering successfully
with companies to drive growth and create value over
long horizons
KKR investment brings potential to access KKR’s network
to help scale Box’s operations, M&A and growth
Note: Box does not have rights to the logos shown above; rights to these logos belong to their respective companies and not KKR or Box.
Confidential l 30Positive Analyst Reaction to KKR-Led Investment; Stock Price Increase
Since Announcement
Analysts cite 1-day stock price drop driven by removal of M&A speculation
March 22, 2021 June 30, 2021
$29.00
Reuters article Tender Offer executed
speculating M&A at $25.75 - April 8, 2021
transaction
“We understand Box has largely been a “show me” story over the last several
$27.00
May 27, 2021 years, although the FY21 execution has been ahead of Street estimates with a
February 23, 2021
Reuters releases article Announces Q1 consistent improvement in margin profile. With Box further endorsing it’s FY24
that Starboard is Earnings
$25.26 targets, we see little to disrupt that momentum, although the path to multiple
$25.00 preparing board expansion may take a bump in the road as the recent takeout speculation
challenge and wants abates”
Box to explore potential
sale
$23.00 - April 14, 2021
“Box saw [the KKR investment] as a unique opportunity to add a key strategic
January 15, 2021 partner with a LT investment horizon without diluting the existing shareholder
$21.00 Strategic review +$3.26 / 15% base-we see the negative market reaction today as a result of the reduced M&A
process begins Since KKR
Investment
outlook following this investment.”
April 8, 2021 Announcement
$19.00 Announces KKR-led
investment and
expected self-tender - April 8, 2021
offer
$17.00 March 2, 2021 “Clearly KKR did its due diligence and has come away bullish on Box’s future
Announces Q4 stock upside potential, suggesting the recent strong underlying demand patterns
Earnings are likely to persist…we see the news as incrementally positive for Box and
pointing to solid fundamentals.”
$15.00
Jan-21 Feb-21 Mar-21 Apr-21 May-21 Jun-21 Jul-21 Aug-21
Note: Market data as of August 11, 2021. Emphasis added to research report excerpts. Confidential l 31KKR-Led Investment Was Result of Robust Process Focused on
Maximizing Value for Stockholders
We believe the KKR-led investment is a meaningful factor in our stock price performance since
the announcement of the transaction
Multi-month The 4-member Strategy Committee of our Board – which included all three directors appointed to the Board pursuant to the
Comprehensive March 2020 settlement agreement with Starboard – led a multi-month comprehensive review of strategic options to drive
Review stockholder value, which included exploring a potential sale of the entire Company
Range of Strategic The range of strategic options reviewed was a result of outreach to a number of potential counterparties, including both
Options strategic acquirors and financial sponsors, contacted by our financial advisor
After the conclusion of the strategic review, the Strategy Committee unanimously recommended, and the full Board
Unanimously
Recommended and unanimously agreed, to approve the KKR-led investment and subsequent “Dutch auction” self-tender because, coupled with
Approved continuing to execute the Company’s strategic plan, it was in the best interest of all stockholders and the path that the Board
believed would maximize value for all stockholders
The investment at a $27 per share conversion price by KKR, one of the world’s leading technology investors, is validation to
Validation of Future the market of Box’s strategy and the potential to create future value for all stockholders as we build upon the progress made
Value Creation
over the past year, and we believe is a meaningful factor in Box’s stock price performance (+$3.26 / 15%) since the
announcement of the transaction
Note: Market data as of August 11, 2021. Confidential l 32Investment Provided Stockholder-Friendly Optionality
Intensely Negotiated for Benefit of All Stockholders Tender Price Was at Attractive Level vs. Last 2 Years
• Terms of KKR-led investment in line with precedent Final Tender Results
$28.00 on 6/30/2021
Investment Made on investments and fair for both parties
Fair Terms • Conversion price of $27 equates to 47% premium to 1-
year average stock price; financing done in position of
$25.00 Tender Price: $25.75
strength
• Provided the opportunity for stockholders to sell their
Satisfies Buyback stock at a materially higher price than the low twenties
Requested by per share that Starboard indicated would be acceptable
$22.00
Stockholders for a sale of the company
$19.00
• Opportunity for stockholders to monetize position at an
Equitable Treatment attractive price vs. recent trading history
for All Stockholders • Those with conviction in strategy can benefit in any
upside potential alongside committed investor in KKR $16.00
• Subscription rate of 48% on the tender reflects price
Tender Executed in $13.00
discipline on the part of the Board to conduct buyback in
Prudent Manner manner that benefits all stockholders
$10.00
• Remaining proceeds are being used to repurchase stock Jul-19 Jul-21
Disciplined Use of in a disciplined manner
Proceeds • Company has repurchased 2.5MM shares at an average Stock Price (Weekly) KKR-Led Investment
price of $23.68 subsequent to the tender offer
Confidential l 33KKR-Led Investment and Subsequent Repurchases Designed to Be
Dilution Neutral to Stockholders
1 Box continues to repurchase shares with the proceeds from the KKR-led
investment
• Repurchases occurring below preferred conversion price of $27
̶ 9.25MM shares repurchased at $25.75 per share via tender offer
̶ An additional 2.5MM shares already repurchased subsequently as part of
open market purchases at an average price of $23.68 per share $27.00 Preferred stock conversion price
2 Intention remains for combination of transactions to be dilution-neutral
to stockholders
• Board immediately authorized remaining unused portion allocated to tender
for opportunistic buyback
$25.75 Tender offer price
• Remainder of the authorized buyback would need to be completed at an
average price of $29.94 to result in average price of $27 for the entire $500
million of proceeds (1)
3 Stockholders “voted” in the tender; dilution isn’t primary concern
$23.68 Post-tender offer repurchase price of 2.5MM shares
through 8/11/21
• KKR-led investment conversion price of $27 signifies KKR’s conviction in upside
• ~95% of stockholders eligible to participate in tender offer chose not to; implies
a substantial portion of Box stockholders have conviction that Box’s stock price
will exceed tender price of $25.75
Notes:
1. Calculation based on 18.5MM underlying shares being issued as part of the KKR-led investment at a $27 conversion price, 9.25MM shares successfully tendered at $25.75, and 2.5MM shares repurchased as part of
the authorized open market repurchase at an average price of $23.68.
Confidential l 34Strong, Independent and Qualified Board to Oversee Strategy Taking Proactive Steps to Enhance Best-in- Class Corporate Governance
Significantly Refreshed and Diverse Board Valuing Stockholder Views
                   7 of 9                                                    5/3                                                      40%                                                           3 of 4
         Independent Directors Have                            Year Average / Median Director                                     Of Our Directors                                           Standing Board Committees
              Joined Since 2018                                           Tenure                                                    Are Women                                                    Chaired by Women

                                                                                                                                                                     10-member Board
                                                                                                                                                                    with appointment of
                                                                                                                                                                         John Park

                                                                  2017                       2018                      2019                       2020                         2021

                         Average Tenure (Years) (1)                8.0                        7.9                       8.2                        4.9                           5.1

                         % Gender Diversity (1)                   11.1%                      33.3%                    33.3%                      44.4%                         40.0%

                                                                                     2 director additions       1 director addition       3 director additions           1 director addition

                                                                                         Sue Barsamian
                                                                                                                     Peter Leav                 Carl Bass                    John Park (2)
                                                                                       Chair of Operating
                                                                                          Committee

                                                                                                                                                Jack Lazar
                                                                                        Kim Hammonds                                          Chair of Audit
                                                                                                                                               Committee                  Settlement
                                                                                                                                                                          Agreement
                                                                                                                                                                         with Starboard
                                                                                                                                             Bethany Mayer
                                                                                                                                         Board Chair and Chair of
                                                                                                                                                                             Value
                                                                                                                                             Compensation
                                                                Starboard-approved directors hold a majority of                                Committee
                                                                Board leadership positions and also serve on the
                                                                Operating Committee and Strategy Committee

Notes:
1. Average tenure and gender diversity for 2015 – 2020 based on Board composition at end of each calendar year; 2021 calculated as of September 9 Annual Meeting date.
2. Appointed through KKR strategic partnership.                                                                                                                                                                    Confidential l 36
Highly Qualified Board for SaaS and Enterprise Software Company Focused
on Growth and Profitability
Dana Evan A F N S Peter Leav C
(Class I / 2011) – Former Lead Director (Class I / 2019)
• Former CFO of VeriSign, Inc. • President, CEO and Director of McAfee Corp. Aaron Levie
• Former Venture Partner at Icon Ventures • Former President, CEO and Director of BMC (Class I / 2005)
Software, Inc. • Co-founder and CEO of Box
• Skills / Experiences: Executive management and
• Former President, CEO and Director of Polycom, Inc. • Former Chairman of Box
leadership, technology, operations, finance
• Skills / Experiences: Executive management and • Skills / Experiences: Management and leadership,
/investment/accounting
leadership, technology, operations, go-to-market technology, go-to-market strategy
• Other Public Boards: Domo, Farfetch, Momentive Global strategy
(formerly SurveyMonkey), Proofpoint (1) • Other Public Boards: McAfee Corp.
Kim Hammonds N O Dan Levin Bethany Mayer C O S
(Class II / 2018) (Class II / 2010) (Class II / 2020) ̶ Chair
• Formerly served in numerous senior executive positions • Chief Executive Officer of Degreed, Inc. • Former President, CEO and Director of Ixia
at Deutsche Bank and Boeing heading their respective • Former President and Chief Operating Officer of Box • Executive Advisor with Siris Capital Group LLC
Global Operations, and IT departments • Former senior executive at Sempra Energy, HP, Blue Coat
• Former Vice President and General Manager,
• Skills / Experiences: Executive management and Systems, Cisco and Apple Computer
Healthcare at Intuit Inc.
leadership, technology, operations, enterprise IT • Skills / Experiences: Executive management and leadership,
• Skills / Experiences: Executive management and technology, operations, finance/investment/accounting
• Other Public Boards: Tenable Holdings, UiPath, Zoom leadership, technology, operations • Other Public Boards: LAM Research, Marvell Technology,
Sempra Energy
Sue Barsamian C O Carl Bass N S
Legend:
(Class III / 2018) (Class III / 2020)
• Former Sales and Marketing Officer of HPE Software at • Former President, CEO and Director of Autodesk, Inc. Joined Since 2018 O Operating Committee
Hewlett Packard Enterprise • Skills / Experiences: Executive management and
• Former General Manager of Enterprise Cybersecurity leadership, technology, operations, enterprise IT Committee Chair S Strategy Committee
Products at Hewlett Packard Enterprise • Other Public Boards: Agile Growth Corp., Ouster,
• Skills / Experiences: Executive management and Zendesk A Audit Committee F Financial Expert
leadership, technology, operations, go-to-market strategy
• Other Public Boards: Five9 Inc., NortonLifeLock C Compensation Committee Non-Employee
Jack Lazar N Nominating and Corporate Governance Committee
A F O S A F C
(Class III / 2020) John Park
• Former CFO at GoPro, Inc.
(Class III / 2021)
• Former Senior Vice President, Corporate Development
• Partner of Kohlberg Kravis Roberts & Co. L.P. and
and General Manager at Qualcomm Atheros, Inc.
Head of Americas Technology Private Equity
• Skills / Experiences: Executive management and Notes:
leadership, technology, operations, • Skills / Experiences: Executive management and
leadership, technology, operations, enterprise IT, 1. Announced it would be acquired by Thoma Bravo for $12.3
finance/investment/accounting billion (expected to close in Q3 CY2021)
finance/investment/accounting
• Other Public Boards: Casper Sleep, Resideo
Technologies, Silicon Labs, ThredUP Inc.
Confidential l 37Box’s Directors Have a History of Supporting Sales of Their
Companies When Doing So Maximizes Stockholder Value
$35.7 billion $12.4 billion (1) $7.7 billion $7.3 billion $6.5 billion $3.6 billion
Kimberly Hammonds Dana Evan Carl Bass Jack Lazar Sue Barsamian Jack Lazar
$3.3 billion
Kimberly Hammonds $1.9 billion $1.8 billion $1.7 billion $1.4 billion $1.3 billion $1.3 billion
Sue Barsamian Peter Leav Dana Evan Bethany Mayer Carl Bass Carl Bass Dana Evan
$1.1 billion $1.1 billion $899 million $629 million $487 million $333 million $274 million
Sue Barsamian Jack Lazar Dana Evan Jack Lazar Dana Evan Carl Bass Carl Bass
Books That Work
Undisclosed Undisclosed Undisclosed Undisclosed Undisclosed Undisclosed
$18 million Transaction Value Transaction Value Transaction Value Transaction Value Transaction Value
Transaction Value
Carl Bass Carl Bass Kimberly Hammonds Jack Lazar Dan Levin Bethany Mayer
Peter Leav
Box’s directors have been involved as board members or C-suite executives in at least 27 company sale transactions
(including at least 14 public companies) with a combined transaction value of ~$95 billion
Notes:
1. Subject to regulatory approvals and final closing.
Confidential l 38Commitment to High Standards of Corporate Governance
Recent and Ongoing Enhancements
Separated Chair / CEO Roles with Independent Chair • 10-member Board with average tenure of ~5 years
• Board committees comprised of only independent directors, with three
of four standing committees chaired by women. Independent directors
Eliminated Dual Class Structure in 2018 meet in regular executive sessions during Board meetings without
management present
• Updated our Corporate Governance Guidelines in 2021 to:
Eliminated Supermajority Vote Requirement to Amend the Bylaws
− Add a director resignation policy for incumbent directors who fail to
receive a majority of votes cast in an uncontested election
Introduced Majority Voting in Uncontested Director Elections − Add considerations for Board diversity
− Provide more detail on the responsibilities and duties of the Chair of
the Board
Adopted NEO / Director Stock Ownership Guidelines
− Demonstrate the Board’s commitment to Board refreshment by
seeking to maintain an average tenure for the independent directors
of 10 years or less
Updated Corporate Governance Guidelines
• Adopted clawback policy
Increased Disclosure of Environmental and Social Initiatives on a • Annual CEO performance evaluation and examination of emergency
Dedicated Part of Our Website CEO / succession plan
Confidential l 39Compensation Program Promotes Executive Alignment with
Stockholder Interests
CEO Compensation That is Fully Aligned with All Stockholders Provisions and Philosophy That Encourage Long-Term Value Creation
✓ CEO has historically directed any equity awards that would have otherwise been granted to
With very modest annual compensation relative to peers, Aaron Levie’s reward him be re-allocated to the overall equity budget used for issuance to our employees
for performance is almost entirely linked to the appreciation of his ~$100
CEO preference to also receive modest short-term compensation in order to allow
million stake in our Company ‒
Company to invest in other areas of the business
Total CEO Compensation (1) ‒ Low historical CEO pay ratio of below 2:1
FY 2016 – FY 2020 ✓ Metrics selected for annual incentives that directly link to company financial objectives
($MM)
$28.6 (revenue and adjusted operating income)
$25.1
✓ Goals for the annual incentive metrics are set at levels determined to be challenging and
requiring substantial skill and effort by senior management
$4.4 ✓ Board employs discretion to improve alignment with shareholder outcomes when deemed
appropriate
Box SaaS Peer Set Average
(2)
SaaS Peer Set Median
(2)
✓ Caps on total payouts to manage potential incentive compensation windfalls
✓ Stock ownership guidelines
Aaron Levie’s total compensation aggregated over the last five fiscal years is ~5.5x less than ✓ Robust anti-hedging and anti-pledging policies apply to all employees and directors
the SaaS peer set average and ~4.7x less than the SaaS peer set median. Aaron Levie’s
✓ Limited accelerated vesting in circumstances such as upon termination or change in control
compensation is almost entirely driven by Box’s TSR.
✓ Provide stockholders an annual Say-on-Pay vote
The new Compensation Committee Chair, Bethany Mayer, and the entire Committee are committed to reducing the compensation program’s equity burn rate and
remain open to stockholder feedback as the Company continues to enhance its compensation program
Notes:
1. Based on total CEO compensation between each company’s FY 2016 – FY 2020 and reported by each company in their respective proxy statements.
2. SaaS Peer Set reflects companies identified in our proxy statement on page 12 of Box's Amended Form 10-K for FY 2021 and are comparable with respect to industry, market capitalization, and growth trajectory. SaaS Peer Set
includes 8x8, FireEye, Guidewire, HubSpot, New Relic, Nutanix, Qualys, Momentive, Solar Winds, Zendesk, and Zuora; excludes Cloudera, Cornerstone OnDemand, Five9, Forescout, Proofpoint and RealPage, which have entered
definitive agreements to be acquired and will cease trading upon closing.
Confidential l 40Box’s Board and Reconstituted Compensation Committee are Actively
and Appropriately Overseeing Compensation Program
Compensation program will continue to evolve taking into account stockholder feedback
Starboard Topic Box’s Compensation Actions
✓ Box’s broad-based equity-focused compensation program encourages employee investment in company success and is aligned to
stockholder interests
✓ The Compensation Committee has been keenly focused on reducing its net burn rate, which has already decreased from 5.4% in FY 2020
Equity Burn to 4.1% in FY 2021
✓ Stock-based compensation (SBC) is recognized over the four year vesting period, resulting in a delayed impact of the reduced burn rate in
SBC while any cash component is expensed immediately
Annual Short-Term Incentive ✓ Targets for Non-GAAP operating margin took into account that the form of payout would be RSUs
Compensation ✓ The Compensation Committee expects to migrate towards cash payouts next year
✓ Changes to fiscal 2021 compensation program for NEOs, including long-term grants being made in time-based RSUs only, were in response
to market uncertainty driven by COVID-19 pandemic; this was plainly disclosed
Long-Term Equity
✓ Many companies adjusted compensation programs to improve executive team stability and compensation predictability in light of market
Compensation volatility; many investors were supportive of these adjustments
✓ The Compensation Committee expects to reinstitute performance-based awards next year for NEOs
Employee Stock ✓ The ESPP design is within market practice for new technology companies
Purchase Plan (ESPP) ✓ The plan is fully compliant with proxy advisor policies (1)
Negative Discretion
✓ Actions show the Compensation Committee’s understanding of how compensation can be used to drive value and demonstrate active
management of pay and performance alignment
Disclosure
✓ The number of NEOs is determined by SEC rules and regulations
✓ The mix of equity and cash for our other executives is similar to that of our NEOs
Notes:
1. Assumes stockholders approve the current proposal to amend the ESPP plan at the 2021 Annual Meeting.
Confidential l 41Box’s Board and Reconstituted Compensation Committee Have Been
Keenly Focused on Burn Rate
There is a delay between reduced burn rate and reduced reported stock-based compensation expense
• Since the beginning of 2020, the Box Board made substantial changes to personnel
responsible for overseeing compensation programs Box vs. Peer Group Net Burn Rate
o Bethany Mayer began acting as Compensation Committee Chair starting at
the Compensation Committee meeting in June 2020
6.0%
o The average tenure of the members of the Compensation Committee is now 5.4%
less than 2 years 4.9%
o Box appointed a new Chief People Officer in March 2020 5.0% 4.7% 4.8%
• The focus on burn rate has had an immediate impact
4.1%
3.9%
o The net burn rate in FY21 was 4.1%, a decrease from 5.4% in FY20 4.0%
o Box’s net burn rate was at the 64th percentile of peers in FY21, down from
the >75th percentile in FY20 3.1%
3.0%
• The Compensation Committee remains focused on further reducing the burn rate
2.3%
• Accounting rules result in a delay in the reduced burn rate impacting stock based
compensation (SBC) 2.0%
o Due to the four-year vesting schedule for long-term equity awards, SBC is
expensed over four years
1.0%
̶ As a result, the impact of the lower net burn rate in FY 2021 will have an
impact on SBC that is reported between FY 2021 and FY 2025
o Furthermore, there is only a partial impact on SBC in the initial year of a grant 0.0%
since these grants are made over the course of year rather than on the first FY FY FY FY FY 25th 50th 75th
day of the year 2018 2019 2020 2021 2022 Percentiles
Budget
3-Year Average of Peer Group
Notes:
1. Net burn rate is calculated by dividing the number of shares given as compensation in the fiscal year by the total number of shares outstanding at the end of the fiscal year.
Confidential l 42Starboard’s Demands are Not in the Interest of All Stockholders; Election of its Nominees Would be Destructive to Stockholder Value
Box Has Attempted to Work with Starboard Since Their Arrival
• Prior to 2020, Box grew its revenue base but decelerating growth rates and negative operating margins weighed on the performance of the
  Company and its stock price.

• Starboard contacted the Company in mid-2019. The Box Board agreed with Starboard that changes were needed and engaged constructively
  with Starboard to reach an agreement about the level of change that was most beneficial to all Box stockholders. In early 2020, the Board and
  Starboard entered into a settlement agreement that brought about several changes, including the following:

    o Three new directors were added, including two directors, Jack Lazar and Bethany Mayer, specifically approved by Starboard.

    o An operating committee was formed and included the two Starboard-approved directors and Sue Barsamian, a third director who is on the
      Board of NortonLifeLock with Peter Feld. The Operating Committee was charged with helping management identify and recommend
      opportunities for growth and margin enhancement.

• The reconstituted Board, Operating Committee and management team attacked head-on the problems that were confronting Box. Starboard
  initially applauded the Company’s efforts. However, two quarters later in December 2020, where we lowered revenue guidance by only 1.1%
  vs. consensus estimates and beat on all other guided metrics, Starboard abruptly demanded that the Company review strategic alternatives
  or fire the CEO, or else face a proxy contest from Starboard. There was no other path that was acceptable to Starboard.

                                                                                                                  (Continued on the next page)

                                                                                                                                  Confidential l 44
You can also read