Economic Profile of the Ontario Computer Animation and Visual Effects Industry - Nordicity Group Ltd. Prepared for Computer Animation Studios of ...
←
→
Page content transcription
If your browser does not render page correctly, please read the page content below
Economic Profile of the Ontario
Computer Animation and
Visual Effects Industry

Nordicity Group Ltd.

Prepared for
Computer Animation Studios of Ontario
(CASO)

June 2008

                                        1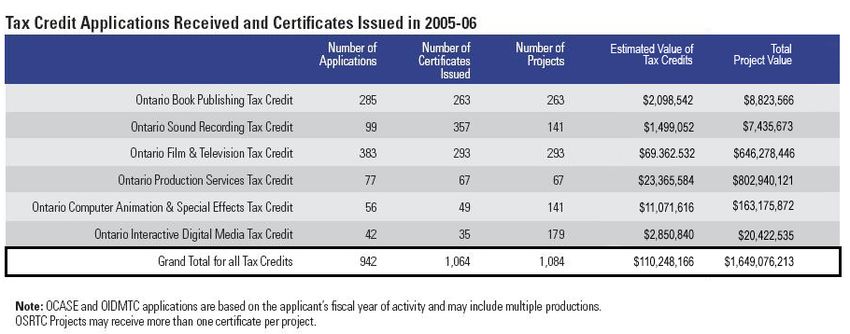
Special thanks to major funder Ontario Media Development Corporation (OMDC)
and to all project supporters:
York University
City of Toronto – Economic Development, Culture & Tourism
Royal Bank of Canada

                                                                              2
Nordicity Group Ltd.
Nordicity Group Ltd. (www.nordicity.com) is one of Canada’s leading strategy-consulting firms for
clients in the media/entertainment, culture/content, and telecommunications sectors. Our
consultants work with clients in both the private and public sectors to make business and policy
decisions, and to understand the impacts of policy and regulatory developments.
Computer Animation Studios of Ontario (CASO)
The Computer Animation Studios of Ontario (CASO) is an association dedicated to promoting and
growing the Ontario Animation and Visual Effects industry.
As an advocate for the industry in Ontario, CASO operates in the following areas:
1. International Promotion and Marketing
2. Industry Statistics and Competitive Advantage
3. Education and Organizational Relations
4. Government Relations
5. Membership
3Table of Contents Page
Executive Summary .................................................................................................................................... 6
1 Introduction.......................................................................................................................................... 9
1.1 Profile Mandate ....................................................................................................................................... 9
1.2 Approach & Research Methodology ..................................................................................................... 10
1.2.1 Project Work Plan & Milestone Timeline.....................................................................................................11
1.2.2 Secondary Research ..................................................................................................................................11
1.2.3 Survey Design ............................................................................................................................................11
1.2.4 Survey Implementation ...............................................................................................................................12
1.2.5 Survey Data Analysis, Estimates & Report Preparation .............................................................................13
1.3 Outline of Report............................................................................................................................... 14
2 Industry Description ......................................................................................................................... 15
2.1 Industry Structure & Services ............................................................................................................... 15
2.2 Computer Animation ............................................................................................................................. 17
2.3 Digital VFX ............................................................................................................................................ 18
2.4 Skilled Labour ....................................................................................................................................... 19
2.5 Business Models in the Computer Animation and VFX Industry .......................................................... 20
3 Survey Analysis................................................................................................................................. 24
3.1 Corporate Profile ................................................................................................................................... 24
3.1.1 Corporate Profile - Highlights..........................................................................................................................24
3.1.2 Business Type and Ownership .......................................................................................................................25
3.1.3 Years of Operation..........................................................................................................................................25
3.1.4 Project Mix – Service Work vs. Owned Content .............................................................................................26
3.1.5 Output Volumes for Computer Animation and VFX ........................................................................................27
3.2 Financial Profile..................................................................................................................................... 28
3.2.1 Financial Profile - Highlights ...........................................................................................................................28
3.2.2 Revenue .........................................................................................................................................................30
3.2.3 Revenue by Region ........................................................................................................................................33
3.2.4 Revenue by Market Segment .........................................................................................................................35
3.2.5 Operating Expenses .......................................................................................................................................39
3.2.6 Change in Operating Margins .........................................................................................................................42
3.2.7 Company Outsource Trends...........................................................................................................................43
3.3 Access to Financing .............................................................................................................................. 44
3.3.1 Access to Financing – Highlights ....................................................................................................................44
3.3.2 Original Capitalization .....................................................................................................................................44
3.3.3 Ongoing Financial Sources.............................................................................................................................45
3.3.4 Tax Credits .....................................................................................................................................................46
3.3.5 Use of OCASE and SR&ED Tax Credits ........................................................................................................47
3.4 Employment and Training ..................................................................................................................... 48
3.4.1 Employment and Training – Highlights ...........................................................................................................48
3.4.2 Employee Size................................................................................................................................................48
3.4.3 Availability of New Hires .................................................................................................................................51
3.4.4 Employer Satisfaction with New Graduate Hires ............................................................................................55
3.5 Market Growth Outlook ......................................................................................................................... 57
3.5.1 Market Growth Outlook – Highlights ...............................................................................................................57
3.5.2 Areas of Growth Opportunity ..........................................................................................................................57
3.5.3 Growth Limiting Factors ..................................................................................................................................58
44 State of the Industry.......................................................................................................................... 60
4.1 Estimates .............................................................................................................................................. 60
4.1.1 Revenue Overview .........................................................................................................................................60
4.1.2 Revenue Estimate from OCASE Data ............................................................................................................61
4.1.3 Other Revenue Estimate Approaches ............................................................................................................63
4.1.4. Reasonability Test – Review of Non-respondents .........................................................................................65
4.1.5 Estimates of Industry Figures .........................................................................................................................65
4.2 Summary of Industry Profile.................................................................................................................. 66
4.3 Industry Trends .................................................................................................................................... 67
References and Data Sources ................................................................................................................. 69
Appendix A – Survey Questionnaire ........................................................................................................... 69
Appendix B – OCASE Tax Credits.............................................................................................................. 81
Appendix C – Industry Revenue Estimates ................................................................................................ 82
5Economic Profile of the Computer Animation
and Visual Effects Industry in Ontario
Executive Summary
This study examines the economic profile of the computer animation and visual effects (VFX)
industry in Ontario and develops financial, corporate and employment baseline indicators for
future market analysis and comparison. It was conducted by Nordicity Group Ltd. for Computer
Animation Studios of Ontario (CASO). The project received funding assistance from the Ontario
Media Development Corporation (OMDC), York University, Royal Bank of Canada, the City of
Toronto – Economic Development and CASO. It is intended to address the need to document
industry statistics and composition, in addition to dimensions of markets and financing sources.
The study develops estimates of total industry revenue, operating expense, output volume,
number of employees and future market opportunities. The key methodological approach
involved the administration of a firm-level survey designed to collect data from senior company
managers of animation and visual effects companies. The target info was organized as follows:
o Corporate Profile – e.g. years of operations and types of business ownership
o Financial Profile – e.g. revenue by market segment and operating expense breakdowns
o Access to Financing – e.g. sources of original capitalization and ongoing financing
o Employment & Training – e.g. number of full-time, part-time and freelance employees;
availability of required skills; and perceived quality (preparedness) of new hires
o Market Growth Outlook – e.g. areas of opportunity and barriers to growth
The survey-sample data was then combined with industry revenue estimates from the OMDC’s
Ontario Computer Animation and Special Effects (OCASE) tax credit data to generate estimates
for the industry as a whole. The sample of firms that responded to the survey represented an
estimated 68% to 74% of the entire industry in Ontario on the basis of revenues. With these
data inputs, Nordicity generated a survey multiplier to estimate total industry size and industry-
wide financial performance.
6Overall, the main findings of the report are as follows:
Industry Economic Statistics
• The computer animation and VFX industry employed a total of 1,600 to 1,900 people in
2007.
• Total computer animation and VFX industry revenues are estimated to be between $170
million to $200 million on an annual basis.
Corporate Composition
• The majority of computer animation and VFX studios in Ontario are Canadian-owned,
privately-held corporations that have been in existence for over seven years.
• The industry is comprised of a large number of small and medium-sized businesses. In
fact, 81% of respondents reported fiscal 2007 revenue of under $5 million. A small
group of companies account for a large share of industry revenue - 53% of the total
survey-sample revenue was generated from 14% of respondents.
• Most computer animation and VFX studios in the province operate under a fee-for-
service business model serving producers of film, television and, increasingly, interactive
media. In fact, survey respondents had copyright ownership in only 17% of their
projects. Despite this reality, about 20% of survey respondents identified intellectual
property development as a future growth opportunity for their company.
Markets & Financing
• With respect to market segments, 16% of computer animation survey-sample revenue
was derived from feature films and 45% from TV series. For VFX companies it was the
reverse - 44% of VFX survey-sample revenue was derived from feature films and 16%
from TV series. TV commercials commanded similar shares of computer animation and
VFX survey-sample revenue at 17% and 13% respectively.
• While the majority of computer animation revenue originate within Canada, the opposite
is true for VFX revenue. This trend also holds in Ontario where 54% of total computer-
animation survey-sample revenue came from clients located within the province
compared to 44% of VFX survey-sample revenues.
• International markets provide opportunities for growth, but they also represent the strong
presence of competition, particularly regarding labour costs in Asia. Increasingly,
7Ontario-based studios, and their counterparts in other jurisdictions, face greater cost
competition. As a result, operating margins may experience downward pressure.
Increasing competition from other jurisdictions was cited as the most significant barrier to
growth by survey respondents.
• The OMDC’s OCASE labour-based tax credit assists studios in building some capacity
and is a popular financing tool in the industry - over 81% of the survey sample accessed
the tax credit. However, computer animation and VFX studios in Ontario remain
underfinanced, possibly as a result of being perceived as not attractive to traditional
sources of investment capital. Within the survey sample, a 60% share of ongoing
financing came from retained earnings/profit, 12% from private sources and only 5%
from new equity injections.
• The conventional market segments of television series and feature films continue to be
regarded as general growth opportunities for the industry. Emerging market segments
such as games, web and mobile content production are also seen as growth
opportunities – about 20% of respondents regarded web and mobile content production
as a growth opportunity for their company.
Nordicity concludes that the computer animation and VFX industry in Ontario is mature, robust
and experiencing moderate growth. The long-term, ongoing stability of the industry requires a
competitive business strategy focussed on the production and ownership of high-quality creative
to counter the growing challenge of low-cost labour availability in other jurisdictions. This
approach necessitates that computer animation and VFX studios in Ontario have adequate
access to capital and talent (particularly senior artistic and technical staff) to foster intellectual
property development and compete on higher margin, higher quality services. They need to do
so in order to distinguish themselves from competitors and attract both fee-for-service and
copyright exploitation opportunities.
81 Introduction
1.1 Profile Mandate
• In November 2007, the Computer Animation Studios of Ontario (CASO) commissioned Nordicity
Group Ltd. (“Nordicity”) to prepare an economic profile of the computer animation and visual
effects (VFX) industry in Ontario. Other stakeholders and project partners included: the Ontario
Media Development Corporation (OMDC), York University, Royal Bank of Canada, City of
Toronto – Economic Development.
• CASO was formed to address the issues and opportunities of Ontario-based computer
animation and VFX studios. CASO works with its members, as well as the OMDC and other
government bodies and agencies, to develop sound industry strategy. As a result, CASO seeks
to be equipped with essential data and industry research.
• The mandate of the study was to provide an initial examination of the business characteristics of
the industry and to develop an economic baseline for market analysis and comparison. The
core objective of the study was to determine estimates of total revenue, operating expense,
output volume, number of employees and future market opportunities.
• The principal research tool Nordicity used to gather industry data from company operators and
owners was an online survey designed to address the need for benchmark industry
documentation and research.
• As well as constructing a financial, corporate and employment profile, the scope of the survey
encompassed access to financing, including a review of the use of the Ontario Computer
Animation and Special Effects (OCASE) tax credit; new-hire employee preparedness, and
barriers to market growth.
• In addition to providing a valuable overview of the general state of the computer animation and
VFX industry in Ontario, this economic profile sets the stage for future work in the area.
• The following section outlines the approach and methodology Nordicity used to develop the
economic profile of the computer animation and VFX industry.
91.2 Approach & Research Methodology
• Nordicity developed a provincial economic profile of the computer animation and VFX industry
by working with stakeholders and incorporating limited secondary research to design, implement
and analyze an online survey. The scope of the survey included:
o Corporate Profile Questions – e.g. years of operations and types of business ownership
o Financial Profile Questions – e.g. revenue by market segment and operating expense
breakdowns
o Access to Financing Questions – e.g. sources of original capitalization and ongoing
financing
o Employment & Training Questions – e.g. number of full-time, part-time and freelance
employees; availability of required skills; and perceived quality (preparedness) of new hires
o Market Growth Outlook Questions – e.g. areas of opportunity and barriers to growth
Please refer to Appendix A for a copy of the survey questionnaire.
• The results of the survey of the computer animation and VFX industry in Ontario provide
valuable, first-time insight into many of the companies that comprise the marketplace.
• In the remainder of this section, Nordicity provides detail on the tasks undertaken to complete
the study:
Project Work Plan & Milestone Timeline
Secondary Research
Survey Design
Survey Implementation
Survey Data Analysis & Report Preparation
101.2.1 Project Work Plan & Milestone Timeline
• With input from stakeholders, Nordicity developed a work plan which mapped key milestones
and tasks with timelines. These were managed through regular communication and meetings
with the project team for the duration of the study.
• Nordicity’s preliminary secondary research revealed that there were few sources of data on the
computer animation and VFX industry in Ontario. As a result, stakeholders recognized the
significant seminal nature of the economic profile study.
1.2.2 Secondary Research
• Nordicity reviewed available domestic and international secondary research sources which
document trends and issues regarding the computer animation segment; Nordicity used the
information to help shape the content of the survey and the final report.
Domestic secondary research sources: Statistics Canada, Canadian Audio-Visual
Certification Office (CAVCO), Export Development Canada, OMDC, Profile 2008
(CFTPA), Canadian Animation Directory.
International secondary research sources: Journal of Visualization & Computer
Animation, Computer Graphics Forum, Animation World Magazine.
1.2.3 Survey Design
• The three key considerations involved in designing the Computer Animation & VFX Economic
Profile Survey were: a) sensitivity to the sharing of confidential information, such as revenue
and operating expense levels; b) the length of time and ease of use factors that comprise user
friendliness; and c) ensuring output of the survey would lead to meaningful data analysis,
including the ability to quantify responses.
• Nordicity prepared survey questions by drawing on input from industry leaders, stakeholders
and others. Nordicity also reviewed similar economic profile surveys conducted in other
industries and jurisdictions. From over 40 proposed questions, Nordicity prepared a final survey
questionnaire consisting of 26 questions.
• Survey design objectives: The sections and questions of the survey sought to provide insights
summarized in Table 1 below:
11Table 1 – Survey Design Objectives
Section Objective
A. Corporate Profile To determine general business incorporation structures, length
of operation, project volumes and output mixes of computer
animation and visual effects studios.
B. Financial Profile To compile top-level revenue and operating expense data
ranges to determine relative company sizes, market segments
and impact of costs
C. Access to Financing To gather data on initial capitalization and ongoing financing
sources, including provincial and federal tax credits.
D. Employment & Training To gather information regarding the employee base of the
industry, including the relative proportion of contract vs. full-
time employees, and the amount of work being outsourced to
foreign countries.
E. Market Growth Outlook To identify key success factors for promoting industry growth
and the barriers to growth.
• In an effort to select an online survey which met the necessary requirements, Nordicity
researched and tested a number of web-based survey applications across a variety of criteria.
• The survey was pre-tested with five members of the CASO board and the resultant feedback
provided Nordicity with insight into ways to improve the intent of the questions and the general
flow of the questionnaire.
• Following the pre-testing phase, Nordicity made final edits to the survey, and then distributed a
web link to the survey questionnaire via email. A PDF version of the survey was also available
for respondents who preferred a printable copy.
1.2.4 Survey Implementation
• Seeking a representative data sample, Nordicity focused on securing participation from
computer animation and VFX studios which represented a significant proportion of industry
revenues.
• The original list of potential respondents was comprised of about 150 computer animation and
VFX companies, including suppliers, software developers and producers as well as a range of
very small (one-person operation) to large studios; Nordicity compiled this list based on
information found in various industry directories including the Ottawa Animation Festival
delegate list.
12• The final survey list of 93 companies that was used for survey distribution included eleven very
small studio operations whose overall contribution to industry revenues is minute and four
creative content producers with animation production capability. Of these 93 companies, 78
were active computer animation and VFX studios.
• One limitation of the survey-data is that it excludes some major producers of animated content
who did not participate in the study. These companies generate the majority of their revenue
from broadcaster license fees, have in-house studios and also serve as customers to smaller
computer animation and VFX studios. 1
• To complete the survey, Nordicity targeted senior managers at the companies within the survey
sample. In an effort to maximize the response rate and timely survey completion, Nordicity
avoided using survey questions that sought a high level of detail data or information from
respondents.
• Several members of the CASO board of directors leveraged their knowledge of company
representatives on the survey list to promote the completion of the survey questionnaire.
Nordicity and the CASO board of directors conducted an extensive and extended survey follow-
up process in order to secure the 32 responses.
• With respect to the number of companies in the broader computer animation and VFX industry,
the 32 responses represent approximately 15% to 20% of the total. However, the volume
(production revenue) of the survey sample was $128 million and, based on our estimates, the
total industry revenue was about $170 million to $200 million. As a result, Nordicity estimates
that the survey sample comprises approximately 68% to 74% of the industry when measured by
revenue, and therefore is a valid representation of the industry. Please refer to Appendix C for
details.
1.2.5 Survey Data Analysis, Estimates & Report Preparation
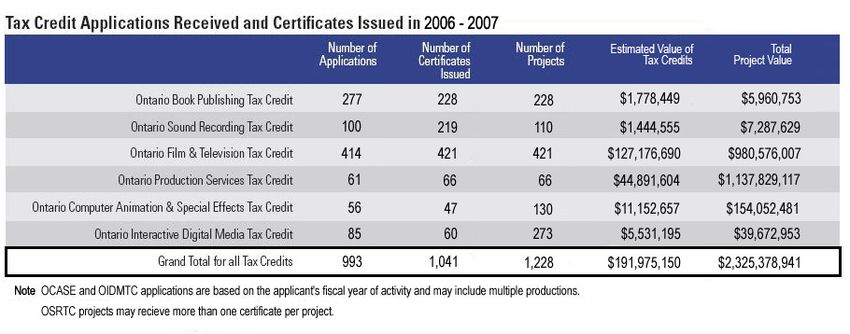
• Revenue estimates were calculated from annual Ontario Computer Animation and Special
Effects (OCASE) tax credit data. 2 The OMDC estimates that OCASE tax credit claims totalled
$11.2 million during the 2006-2007 fiscal year (April 1, 2006 to March 31, 2007). For the 2005-
2006 fiscal, OMDC estimates that the amount was $11.1 million (see Appendix B).
1
The companies include: Nelvana (Corus Kids), 9 Story, Cookie Jar and Mercury Filmworks
2
The OCASE Tax Credit is calculated as 20% of the eligible Ontario labour expenditures incurred by a qualifying
corporation with respect to eligible computer animation and special effects activities.
13• Given that the OCASE tax credit represents 20% of qualifying labour and 50% of remuneration
paid to freelancers, Nordicity used detailed calculations and assumptions to estimate a total
industry revenue range. The approach is further outlined in section 4.1.2 and a description is
available in Appendix C.
• This grossed-up revenue range estimate of the total computer animation and VFX market was
used to generate a survey multiplier and contextualize the size of the survey sample with
respect to total operating expenses, total employment, and other metrics of industry size and
industry-wide financial performance.
1.3 Outline of Report
• In Section 2, Nordicity discusses the structure, services and business models of the computer
animation and VFX industry in Ontario.
• In Section 3, Nordicity presents the results of the survey of the business leaders in the industry.
The economic profile generated focuses on financial operations, access to financing,
employment trends and market growth opportunities.
• In Section 4, Nordicity provides estimates of industry-wide metrics based on the survey-sample
data, and summarizes the key findings from its research and analysis.
142 Industry Description
2.1 Industry Structure & Services
• The computer animation and digital VFX industry in Ontario is comprised of companies that
produce content and/or provide other services for film and television markets in Canada and
internationally. For companies operating in the computer animation and VFX industry, primary
customer base includes film studios, distributors, content producers and television broadcasters.
• Companies operating in the computer animation and VFX industry also serve the commercial
market by producing TV commercials, training materials, corporate communications, or music
videos for brand owners, either directly or indirectly through an agency.
• Some production companies operating in the computer animation and VFX industry provide
post-production services in-house; whereas, other producers contract work out to specialty post-
production service houses. Some producers do both.
• Typical services provided by animation and VFX studios are summarized in Table 2 below:
Table 2 – Typical Computer Animation and VFX Services
Computer Animation VFX
1. Design and consultation 1. Design and consultation
2. Prepare budget and schedule 2. Prepare budget and schedule
3. Storyboards 3. On-set supervision
4. Create animatic reel 4. Pre-visualization
5. Create digital elements (characters, props, 5. Create digital elements (characters, props,
environments, set, motion) environments)
6. Integrate with animated sequences 6. Integrate with live-action sequences
7. Edit 7. Matte painting, crowd replication, set
8. Output to hard drive extensions
8. Addition of environment elements, e.g. fire,
Note: In some instances, Items 5 and 6 may not be water, dust, smoke
severable from each other. 9. Rig removal
10. Output to film or frame to hard drive
Note: Items 5 through 10 are stages of the
production process and, in some instances, may
not be severable from each other.
• Animation and visual effects studios do not typically provide sound recording or audio post
production services.
15• The market segments served by the computer animation and VFX industry can be summarized
as follows:
o Feature Film
o TV Movie/MOW
o TV Series
o TV Commercial
o Music Video
o Direct-to-Video
o Scientific Visualization (Medical & Legal)
o Broadband/Internet content
o Mobile content, incl. games
o Console or PC games
162.2 Computer Animation
• Computer animation is the evolution of classical cel animation into digital technology. Of the
numerous forms of commercial animation -- stop motion, claymation (using Plasticine), cut-out
and others – production of cel animation, in the style of traditional Disney and Loony Toons
cartoons, has, for the most part, been supplanted by computer technology. This style of
animation is often referred to as 2D animation reflecting the fact that visual elements (characters
and environments) have no apparent volume – they are flat, two-dimensional objects.
• With the significant improvements in computer hardware and software during the past two
decades, creating three-dimensional (3D) animation has become a commercially feasible
process.
• The fundamental difference between 3D and 2D animation is the apparent depth and volume of
the character models, environments and props. The first large scale, well-known project to use
3D technologies was the animated feature film Toy Story. Since its release in 1995, further
developments in digital technologies have enabled the production of innumerable television and
DVD projects which can now be produced with significantly lower budgets than those required
for feature films.
• Of the programs commonly produced today, animated features are usually produced as 3D
animation in order to appeal to theatrical audiences. Programs for television are produced in
both 2D and 3D animation.
• At its core, computer animation is an efficient production platform that is suited to simulating
many other media. In some studios, computer animation is replacing many traditional "hard
media" animation forms one by one, for example simulated stop-motion. The scope and
definition of computer animation is changing and increasingly meaning many things to many
people.
172.3 Digital VFX
Filmmakers use digital VFX to modify, enhance and augment live-action cinematography. Digital
VFX, or simply VFX, are a subset of visual special effects available to directors that enable
realization of the visual aspects of film and television projects. Some of these include non-digital
“in-camera” effects using manipulation of physical elements, lighting, makeup, prosthetics, “men-in-
suits” and others.
Digital technologies permit filmmakers to surpass the constraints of physical reality. Typically VFX
include integration of digital elements into live-action cinematography, combining elements from
multiple sources into composite images or creating photorealistic shots totally by computer.
VFX artists can create 3D elements that do not exist in reality – monsters, horror characters, a
castle in the forest, a pig that talks, a head that explodes – but need to have photorealistic
characteristics.
Digital set extensions permit modification of film locations that extend beyond both physical reality
and budget allowances. The same is true for crowd replication in which a handful of live actors are
multiplied to fill every seat of a sports stadium – and often now even the actors are not needed. In
addition, VFX can alter environmental elements such as making day-night and vice-versa, creating
storms, tornados, blizzards, fire storms, explosions, adding icy breath to a “winter scene” shot in
July, showing the detail of a bullet in flight and replacing the hazardous work of stuntmen, women
and animals with a process that has zero physical risk.
The range of VFX is wide and filmmakers’ capacity to conceive of new ways to expand audiences’
visual experience with creative use of VFX technologies is constantly evolving.
182.4 Skilled Labour
• Despite the advances in digital technology, it is the combined work of individual artists and
technologists that creates animation and digital VFX.
• The introduction of fast computers and advanced software has had the dual effect of increasing
the demand for complex outputs and at the same time opening jobs in the industry to a wider
range of individuals with varying skills.
• Every year, animation schools produce thousands of graduates providing basic support for
industry growth. In addition, universities and technical colleges provide a labour pool of
additional support personnel. However, new graduates cannot provide the level of skill required
for complex work. No commercial animation or VFX studio can operate in today’s market
without having a foundation of experienced working artists who have built careers on a
continuing advancement of experience and enhanced skill.
• The requirement for more complex outputs has also led to specialization of jobs within the
industry. Despite the general description of the process and output as “animation,” actually
creating the animation is a minor component of the process.
o Depending on the requirements of individual projects, animation and VFX projects will
include the artistic crews with job titles such as:
- writer, director, designer, storyboard artist, layout artist, colourist, modeler, rigger,
animator, lighter, compositor, editor.
o And the following technical crew:
- technical director, shader writer, software developer, systems administrator,
network administrator, render wrangler as well as line producer, production
managers, coordinators and assistants.
192.5 Business Models in the Computer Animation and VFX Industry
• Computer animation and VFX are generally created and sold in the manner illustrated in Figures
1 and 2 below.
Figure 1 - The Structure of the Animation Industry (TV and Feature Film)
Possible
Necessary
Creator Producer Distributor/ Service House
Broadcaster
Animation - Service
Animation - IPR
Feature Film
Direct to DVD
TV Series
Figure 2 - Structure of the VFX Industry (TV and Feature Film)
Possible
Necessary
Rights Holder Producer Service House
VFX - Service
TV Series
Feature Film
20There are two principal business models in the in the computer animation and VFX industry – the
owner operator – “bootstrap start-up” and program producer approach.
1. Owner-operator – Bootstrap Start-up
• The “owner operator bootstrap start-up” is the most common form of business model in both the
computer animation and VFX industry. In most cases, these enterprises evolve from employees
of existing studios who leave to start their own entrepreneurial new ventures. Often this is a
direct result of business layoffs, studio closures, or sales or mergers of studios.
• Typically a new studio is started by an individual with artistic training and experience;
sometimes this individual will partner with a “business” associate. Savings and contributions of
family and friends provide seed capital and early contracts usually consist of work from clients
known to the operator from former studios. At this stage, work is on a fee-for-service basis with
no retention of property rights by the studio.
• It is easy to understand why the preponderance of studios begins with this model. Lack of
capital for start-up operations and negligible opportunity to attract it limits scale of new
operations. Landing service contracts from producers enables studios to build capacity in direct
response to workflow and limit the amount of capital required and associated risk. Developing
animation properties for sale to broadcasters and distributors is expensive and risky with only a
small proportion of potential projects ever being produced. Developing properties that will have
visual effects (VFX) is even more expensive and entails similar risk.
• Once in operation, two factors drive the operations of the fee-for-service business: 1)
establishing a constant flow of new projects and 2) maintaining adequate working capital.
• The availability of new work depends on a number of factors including competition, project
budgets and schedules, fit of work with studio capabilities, volume of existing work in process,
and availability of incremental staff. Any one of these factors may cause a studio to miss an
opportunity to develop a continuous flow of work.
• The gaps in production create a number of issues for the studio. Often it needs to discount
pricing to attract business. Often it needs to hold staff and resources through the gap period
between projects, to ensure availability of staff when the next project commences. Both of
these scenarios deplete available working capital. This is particularly problematic when most, if
not all, capitalization is derived from operations.
• Market factors affect these studios in numerous ways. Some studios in Ontario have developed
a reputation for quality work that improves their ability to attract work. However, in the VFX
21segment, there is an ongoing demand from clients to increase the complexity of the work
beyond any corresponding increase in budgets or schedules. Such demands require the studio
to increase the time to perform the work often with more skilled (and more expensive) artists
and often with increased computer power and software capability.
• In the animation segment, the demands by clients are more often to be schedule and cost. Off-
shore competition from low-cost labour areas predominantly India, China, Thailand and
Philippines cause a downward pressure on pricing. For example, an average animator in
3
Mumbai will earn about $200 per week. In Toronto, an employee with the same skill level will
earn $1,200 per week; the employer must also cover payroll taxes and the costs of employee
benefits, which are likely higher than those in Mumbai. Even after taking into account the effect
of the OCASE, labour costs will be more than four times the salary cost in India.
• Affecting both the computer animation and VFX segments, aggressive tax credits in other
jurisdictions often have the effect of Ontario studios reducing bids to match the net prices from
such areas and thereby reducing profitability and working capital. This appears to be a global
trend as indicated below:
Jurisdiction Base Production Credit Animation and VFX Credit
Ontario 25% of qualified labour Add’l 20% qualified animation or VFX labour 4
British Columbia 45% of qualified labour Add’l 15% qualified labour relating to
Quebec 20% of qualified labour Add’l 10.2% qualified animation or VFX labour
Manitoba 45% of qualified labour Included
Nova Scotia 35% of qualified labour Included
Source: “The Big Table – Digital Media and Animation Incentives in Canada”, PricewaterhouseCoopers, 2007.
• Generally, owner-operator studios attempt to move from strictly service work into becoming
producers with the objectives of 1) increasing efficiency by eliminating external producer level in
value chain, 2) gaining more control over flow of production into studios, 3) mitigating general
risk by developing independent profit centre. This is often done in the first instance as a co-
production with an existing producer.
3
Source: http://nitawriter.wordpress.com/2007/07/07/plenty-of-jobs-for-animators-in-india/
4
The effective rate of Credit is 10 – 12% depending on individual studio’s circumstances.
222. Program Producer
• In some instances animation producers will integrate an animation production capability into
their operation. This structure extends the producer’s direct role in production beyond the fairly
typical acquisition of rights to or development of programs, securing financing and distribution.
Such vertical integration gives the producer a greater degree of control of costs and the
production process. This model is non-existent in the Canadian VFX segment.
• As noted above, many service providers have aspirations of becoming producers and several
have accomplished this to varying degrees. In those instances, the company will usually have
followed the “Bootstrap” model above in developing their business.
• This model requires a higher level of capitalization due to the necessity of developing properties
for sale to broadcasters or distributors in order to feed their production facility. In some
instances these producers will take on some service work in order to mitigate risk. As well, one
studio has a known portfolio of owned, co-produced and service projects and as well produces
animation in-house as well as takes on sub-contracting projects.
233 Survey Analysis
3.1 Corporate Profile
As stated earlier, Nordicity estimates that the survey sample of 32 accounted for between 68%
and 74% of the entire industry in Ontario on the basis of revenues. The sample coverage
managed to capture a greater percentage of the larger companies than the smaller ones, which
enabled the project team to cover nearly three quarters of the animation and VFX industry.
• Computer Animation: Of the total sample of 32 surveyed companies, 23 reported that they
produced some output of computer animation production volume. Of these 23 companies, 12
(53%) reported that they produced only computer animation projects, and did not produce VFX
projects.
• VFX: Of the total sample of 32 companies, 18 reported that they produced some output of VFX
volume. Of these 18 companies, five (28%) reported that they produced only VFX projects, and
did not produce computer animation projects.
3.1.1 Corporate Profile - Highlights
• Seventy-eight percent of respondents were privately held corporations, 19% were sole
proprietorship/partnerships and 3% were public corporations. The public corporations were not
Canadian-controlled.
• While only 3% of respondents have been operational for less than two years, the data suggest
that there was a wave of company formation and market entry in recent years – 34% of survey
respondents have been in business for two to six years. Still, the majority of surveyed
companies have been in operation for more than seven years: 38% of respondents have been
in operation for between 7 and 11 years; 10% of respondents have existed for over 20 years.
• Survey respondents had copyright ownership in only 17% of the projects in which they were
involved; for the other 83% of projects, respondents provided services but did not have
copyright ownership.
• Survey respondents generated 14,408 minutes of computer-animation output in 2007, a 9%
increase over 2006 levels. Survey respondents also generated 5,915 shots of VFX production,
a decrease of 6% from 2006 levels.
243.1.2 Business Type and Ownership
• In 2007, the majority of computer animation and VFX survey respondents were privately held
corporations (78%). Nineteen percent were sole proprietorship/partnerships and only 3% were
public corporations.
• Ninety-seven percent of the respondents were Canadian-controlled companies. All but five
respondents (16%) listed Toronto as the primary site of service delivery.
Exhibit 1 Types of Business Incorporation
Public
Corporation
3%
Private -
Corporation
78%
Private - Sole
Proprietorship/
Partnership
19% 0% 20% 40% 60% 80% 100%
Percentage of Respondents
3.1.3 Years of Operation
• Of the surveyed companies, 38% reported that they have been in operation for between seven
and 11 years; and 34% reported that they had been in operation for between two and six years.
Sixteen percent of respondents have been in operation for between 12 to 20 years; 9% have
been in operation for over 20 years, and 3% for less than two years.
• The data summarized in Exhibit 2 suggest that while the majority of companies have been in
operation for over seven years, there was a wave of new company formation or market entry
that occurred in the early 2000s. The fact that approximately one-third of companies have only
been in operation for between two and six years is evidence of this relatively recent wave of
company formation.
25Exhibit 2 Years of Operation
More than 20 years
12 - 20 years
7 - 11 years
2 - 6 years
Less than 2 years
0% 5% 10% 15% 20% 25% 30% 35% 40%
Percentage of Respondents
3.1.4 Project Mix – Service Work vs. Owned Content
• In 2007, Ontario-based computer animation and digital VFX companies had content ownership
in only 17% of the projects that they were involved in; for the vast majority projects (83%),
Ontario-based companies provided service work and had no content ownership.
Exhibit 3 Proportion of Service Work to Owned Content, FYE 2007
Content owned
by your 17%
company
Service work 83%
0% 20% 40% 60% 80% 100%
Percentage of Respondents
263.1.5 Output Volumes for Computer Animation and VFX
• In 2007, the companies in the survey sample generated a total of 14,408 minutes of computer-
animation production; the sampled companies’ computer animation output increased by 9% in
2007, from 13,276 minutes in 2006.
Exhibit 4 Output Volume – Computer Animation Production
14,408 13,276
14,000
No. of Minutes
12,000
10,000
8,000
6,000
4,000
2,000
-
FYE 2007 FYE 2006
Years
• The survey-sample companies also generated 5,915 shots of VFX production in 2007, down 6%
from 6,280 shots in 2006.
Exhibit 5 Output Volume – VFX Production
7,000
6,280
6,000
5,915
No. of Shots
5,000
4,000
3,000
2,000
1,000
-
FYE 2007 FYE 2006
Years
273.2 Financial Profile
3.2.1 Financial Profile - Highlights
Revenue Estimates
• Eighty-one percent of respondents reported fiscal 2007 revenues of under $5 million; 14% of
respondents reported revenues over $15 million, this group represented 53% of the total survey-
sample revenue.
• Nordicity estimates that the total revenues for the survey respondents (only those companies
that answered the revenue question) were $128 million in 2007and $107 million in 2006; an
increase of 19.6%.
Computer Animation – Region and Market Segments
• Survey respondents reported that they earned 61% of their computer-animation revenues in
fiscal 2007 from clients based in Canada; 54% of total computer-animation revenues came from
clients located in Ontario.
• Forty-two percent of computer animation project revenue was derived from feature films and
31% from TV series in fiscal 2007.
o Respondents projected a slight decline in feature film activity to about 13% from 16% in the
next two to three years; TV series revenues are estimated to decline marginally to 40% from
45%;
o In the next two to three years, survey respondents expect broadband/internet, mobile and
console/PC games segments to grow from about 0% to 8%, 3% and 2%, respectively.
VFX– Region and Market Segments
• Survey respondents reported that they earned 45% of their VFX revenues fiscal 2007 from
clients based in Canada; 44% of total VFX revenues came from clients located in Ontario.
• For the fiscal year ending in 2007, 45% of VFX project revenue was derived primarily from
feature films. The TV series and TV commercial segments commanded 16% and 13%
respectively.
o Respondents projected 47% of VFX project revenues would come from feature films in the
next two to three years; 16% from TV series, 16% from TV commercials and 10% from TV
Movies/MOWs.
o The broadband and mobile segments are projected to grow from 0% to 3% respectively.
28Operating Expense Estimates
• Nordicity estimates that the total operating expenses across the responding companies was
$91.1 million in 2007 and $75.8 million in 2006. Operating expenses among the responding
companies increased 20.1% between 2006 and 2007; this increase was consistent with the
19.6% increase in reported revenue.
• The surveyed companies stated that the average change in operating margins was −2.6%.
Labour Costs
• Wages, other compensation and employee benefits represented, on average, 64.0% of total
operating expenses.
• Respondents cited lower labour costs in other jurisdictions as the primary reason for
outsourcing.
• Of the 40% of respondents who outsourced any element of their business to other companies,
59.2% originated from the VFX segment; 40.7% from computer animation.
293.2.2 Revenue
Revenue Profile
• In order to protect the confidentiality of survey respondents’ revenue information, Nordicity
designed a survey question that asked respondents to identify one of 28 revenue ranges (of $1
million increments) within which their 2007 and 2006 revenues fell. Despite structuring the
question is this manner, only 26 of the 32 total survey respondents provided an answer to the
question pertaining to revenues.
• In 2007, three respondents generated revenues that exceeded $15 million; two respondents
reported revenues exceeding $15 million in 2006. On the other end of the revenue-size
spectrum, only one respondent recorded revenues of less than $100,000 in 2007 versus two
respondents in 2006.
• In both 2006 and 2007, most respondents reported revenues of between $1.0 million to
$1.9 million. In 2007, 7 of 26 respondents reported revenues between $1.0 million and $1.9
million; in 2006, 5 of 26 respondents reported revenues in this range.
• As illustrated in Exhibit 6, 81% of all respondents (21 out of 26) reported 2007 revenues of
under $5 million; among the companies reporting revenues of under $5 million, 42.3% (11
respondents) reported revenues in the bottom part of the range (less than $2 million.).
• Exhibit 6 also shows that a large cluster of computer animation studios (67% of the total number
of responding studios) reported revenues of between $1 million to $4 million; and no
respondents reported revenues of between $8 million and $15 million in 2007. Fourteen
percent of respondents reported revenues over $15 million.
• Subsequent to the survey, Nordicity identified the companies that reported revenues over
$15 million and asked them to identify one of seven additional revenue ranges ($5 million
increments from $15 million to $50 million) within which their 2007 and 2006 revenues fell.
Nordicity used these additional data to refine its estimates of total revenues among the sampled
companies.
• While the survey sample was comprised of many small and mid-sized companies, there were
also a small number of large companies within the sample. In fact, three companies within the
sample accounted for 53% of the 2007 revenue generated by all companies within the sample.
30Exhibit 6 Revenue Profile Comparison
12
10
8
No. of Companies
FYE 2007
6
FYE 2006
4
2
0
Less than $2M $2.00M to $4.99M $5.00M to $9.99M $10.00M to Over $15.00M
$14.99M
Revenue Ranges
• Exhibit 7 shows the distribution of survey sample revenues over $15 million.
Exhibit 7 Revenue Profile Comparison – Over $15 million
Revenue Range No. of Companies
FYE 2007 FYE 2006
$15.00M to $19.99M 1 1
$20.00M to $24.99M 1 1
$25.00M to $29.99M 1 0
31Survey Sample Revenues
• For purposes of confidentiality, Nordicity asked respondents to select ranges that corresponded
with their levels of revenue for the past two years.
• Nordicity derived estimates of survey sample revenues by using the mid-points of each range
and multiplying each mid-point by the number of respondents in each revenue range. For
example, in response to the question regarding 2007 revenues, five respondents selected the
range, “$1.50 million to $1.99 million.” The mid-point (median) for this range is equal to $1.745
million. On the basis of these data points, Nordicity derived an estimate of $8.725 for the total
revenue across all five respondents (5 respondents X $1.745 million = $8.725 million).
• Because the top-end revenue range is open ended (“Over $15 million”), Nordicity could not, at
first, apply the mid-point estimation approach. Instead, Nordicity contacted all respondents
which indicated that their 2006 or 2007 revenues exceeded $15 million. Nordicity asked them to
complete a supplementary question with a seven revenue ranges above $15 million. On the
basis of respondents’ answer to this supplementary question, Nordicity was able to apply the
mid-point estimation approach (described in the preceding paragraph) and derive an estimate
for the total revenues among this group of large companies.
Using this method, Nordicity estimates for the revenues of the survey respondents totalled $128
million in 2007and $107 million in 2006. This represents an increase of nearly 20% from 2006
to 2007.
Exhibit 8 Revenue Estimates
$140,000,000
$128,100,000
$120,000,000
$107,100,000
$100,000,000
$80,000,000
Revenue
$60,000,000
$40,000,000
$20,000,000
$0
FYE 2007 FYE 2006
323.2.3 Revenue by Region
Computer Animation
• Survey respondents reported that they earned a majority (61%) of their computer animation
revenues from clients based in Canada in fiscal 2007. In fact, just over one-half (54%) of total
computer animation revenues came from clients located in Ontario. Quebec-based clients
accounted for only 0.5% of the total, while clients located in other parts of Canada (excluding
British Columbia) accounted for 6.5%.
• Thirty-nine percent of computer animation revenues originated from clients outside of Canada.
New York was the source of 19% of computer animation revenues; revenues from clients based
in Los Angeles accounted for 7% or computer animation revenues.
• Clients based in Europe accounted for 7.5% of total computer animation revenues, with the
United Kingdom accounting for 1.9% of total revenues and other European countries accounting
for 5.6%.
Exhibit 9 Revenue by Region – Computer Animation, FYE 2007
Europe - Other
USA - Other 5.6%
6.0%
USA - New York
18.6%
Canada -
Ontario 53.7%
USA - L.A. 7.3%
Canada - Other
6.5% Europe -
UK/Canada -
Quebec/Asia
2.5%
33You can also read