SOCIO-ECONOMIC
CONTRIBUTION OF THE
EUROPEAN COSMETICS
   INDUSTRY 2019
←
→
Page content transcription
If your browser does not render page correctly, please read the page content below

SOCIO-ECONOMIC CONTRIBUTION OF THE EUROPEAN COSMETICS INDUSTRY 2019
Socio-Economic Contribution of the European Cosmetics Industry

       Socio-Economic Contribution of the
       European Cosmetics Industry
       June 2019
       First published in June 2016 and updated with industry economic data in June 2019.
       To explore contributions for environmental sustainability, please refer to Cosmetics
       Europe Environmental Sustainability Report.

   Written by Cosmetics Europe with support from Risk & Policy Analysts Ltd (RPA)
Contents
Introduction		4
Executive Summary		5
1. Touching People’s Lives		8
     1.1 Use of cosmetics		                                        9
     1.2 Expenditure on cosmetics		                                9
     1.3 Functional benefits		                                    10
     1.4 Emotional benefits		                                     13
2. Supporting Jobs & Growth in Europe		15
     2.1 The European cosmetics market		                          15
     2.2 The cosmetics value chain		                              17
     2.3 Enterprises in the cosmetics value chain		               17
     2.4 Contribution to Europe’s GDP (GVA)		                     20
     2.5 Job creation		                                           21
     2.6 Wages and salaries		                                     23
     2.7 Employment taxes		                                       23
     2.8 Responsible employer		                                   24
3. Advancing Innovation & Science in Research		27
     3.1 R&D in the European cosmetics industry		                 27
     3.2 Working with the scientific community		                  30
     3.3 New opportunities in the digital economy		               31
4. Contributing to European Economic Welfare		32
     4.1 Leveraging European internal market		                    32
     4.2 Exports from Europe		                                    32
     4.3 Development of global intangible assets		                33
     4.4 Support for world-leading marketing services cluster		   34
     4.5 Inward investment by non-EU multinational corporations		 34
5. Securing a Sustainable Future		35
     5.1 Sustainability in action		                               35
     5.2 Working with local communities		                         37
6. Conclusions		39
7. Abbreviations and list of references		40

                                                                       3
Socio-Economic Contribution of the European Cosmetics Industry

       Introduction
       The cosmetics and personal care industry makes            SOCIO-ECONOMIC CONTRIBUTION OF THE EUROPEAN
       a significant social and economic contribution to         COSMETICS INDUSTRY
       national and regional economies across the EU.
                                                                 The economic contribution made by the European
       Through the purchase of goods and services and the
                                                                 cosmetics industry can be divided into three main types:
       payment of taxes and employee wages, the cosmetics
       industry generates multiple rounds of economic            • Direct impact: Where this corresponds to the
       spending and re-spending that benefits the European         contribution to the European economy created by
       economy and its citizens.                                   the manufacture of cosmetic products.

       This report, prepared by Cosmetics Europe with the        • Indirect impact: Where this results from the
       support of Risk & Policy Analysts Ltd (RPA), provides       purchase of goods and services by firms directly
       a comprehensive evaluation of the socio-economic            involved in the manufacture of cosmetic products.
       contribution made by the European cosmetics                 These impacts accrue both ‘up-stream’ in the
       industry (covering the EU-28 plus Norway and                supply chain (e.g. when companies manufacturing
       Switzerland). Based on a top-down analysis of the           cosmetic products purchase raw materials,
       cosmetics supply chain, starting from raw material          packaging components and other goods and
       inputs, through manufacturing, distribution and             services (e.g. IT equipment, business services) from
       wholesale, to retail and the beauty services industry,      their suppliers) as well as ‘downstream’ in the
       this report seeks to illustrate the socio-economic          supply chain (e.g. in the distribution, wholesale and
       importance of the European cosmetics industry,              retail sale of cosmetic products and in the beauty
       considering indicators such as employment (jobs             services sector).
       and wages), social security contributions and Gross
                                                                 • Induced impact: Where this is defined as the
       Value Added (GVA).
                                                                   additional contribution to the economy resulting
       The research for this report is based on a combination      from increased expenditure by the workforce
       of literature review and consultation with companies        employed directly and indirectly by the cosmetics
       and industry associations operating in the sector.          industry. The income earned by the workers is spent
       Conservative estimates have been used throughout            on various goods and services, leading to further
       to ensure that benefits are not overstated. While           economic activity and employment.
       the focus of this study has been on producing
                                                                 In addition to the above, the cosmetics industry also
       quantitative (economic) information, some of the
                                                                 has a number of ‘catalytic’ impacts:
       wider, qualitative, benefits of the sector are also
       discussed. In particular, consideration is given to the   • Cosmetic products have important functional and
       various ways in which cosmetics (through satisfying         emotional benefits. When consumers use cosmetic
       individuals’ various physical and emotional needs)          products their quality of life is enhanced.
       tangibly improve people’s lives.        By combining      • Over recent years, Europe has faced a myriad of
       quantitative data on the economic benefits of               financial difficulties. By attracting investment from
       the European cosmetics industry with qualitative            outside of the EU, developing intangible assets
       information on the wider catalytic impacts of               (e.g. brands) and investing in R&D, the cosmetic
       cosmetics, this study aims to capture the full effect       industry is helping to enhance the competitiveness
       of the cosmetic products industry across its entire         of the European economy and contributing to the
       value chain.                                                future prosperity of Europe and its citizens.
                                                                 Environmental and social responsibility are also a
                                                                 key concern for the cosmetics industry and the sector
                                                                 makes significant investments to ensure its products
                                                                 are ethical and sustainable.

4
Executive Summary
The cosmetics and personal care industry includes         The cosmetics industry is a science-driven,
a wide range of products dedicated to health, beauty      fast-paced and a highly innovative sector which
and well-being. Ranging from hair care, skin care, oral   makes large investments in R&D. Assuming that
and body care to perfumery and decorative cosmetics,      companies in the cosmetics industry spent just
cosmetic products are an an important part of people’s    5% of their annual turnover on R&D in 2017, total
every day life. The use of cosmetic products brings       expenditure on R&D in Europe would have been
important functional and emotional benefits. For          circa €2.35 billion. There are at least 77 innovation
example, brushing our teeth with toothpaste helps us to   facilities in Europe carrying out research in relation
maintain good oral health, while washing our hands with   to cosmetics and around 28,800 scientists are
soap can help to prevent the spread of disease. The use   employed by the European cosmetics industry.
of cosmetics can also improve our mood, enhance our
                                                          The industry supports millions of jobs. Including
appearance and create positive self-esteem, as well as
                                                          direct, indirect and induced economic activity, the
provide a means of social expression.
                                                          industry supports over 2 million jobs. Of these, 167,730
Europe is the global flagship producer of cosmetic        workers are employed directly in the manufacture of
products. In 2018, the European cosmetics market          cosmetic products, and around 1.63 million workers are
was valued at €78.6 billion, making Europe the largest    employed indirectly in the cosmetics value chain. For
market for cosmetic products in the world. Trade is       every 10 workers employed (directly or indirectly) by the
a critical component of the industry, with trade in       European cosmetics industry, at least two further jobs
cosmetic products and ingredients (within the EU30)       are generated in the wider economic value chain (as a
exceeding €35 billion. Around €21.5 billion worth of      result of employees spending their wages on goods
cosmetic products were exported from Europe in            and services). It is estimated that between 366,200 and
2018. Such exports are particularly important in          549,400 workers are employed thanks to these ‘induced’
countries strongly affected by the Euro crisis (such      employment effects.
as Spain and Italy) where the cosmetics sector is
                                                          Cosmetics Europe and its members have a common
helping to secure national economic recovery.
                                                          belief that sustainability and business success go
The industry makes a significant contribution to          hand in hand. Cosmetics Europe plays a key role
the European economy across its value chain. It is        in bringing its members together and developing a
estimated that the cosmetics industry brings at least     forward-looking common sustainability agenda with
€29 billion in added value to the European economy        the aim to jointly improve the sustainability profile
every year, of which approximately €11 billion is         of the sector. For example, Cosmetics Europe has
contributed directly by the manufacture of cosmetic       developed guidance documents to assist companies
products (the remaining €18 billion is generated          (particularly SMEs) to become more sustainable and
indirectly through the supply chain).                     has engaged, together with four other European
                                                          associations, in the development of Best Practice
SMEs are key drivers of innovation and economic
                                                          for the cosmetics industry in the field of compliance
growth. More than 5,800 SMEs are involved in the
                                                          with legislation regarding access to genetic resources
manufacturing of cosmetics in Europe. In addition,
                                                          and the fair and equitable sharing of benefits derived
there are over 100 companies manufacturing cosmetic
                                                          from their utilisation. Cosmetics Europe is open
ingredients in Europe, 23,000 enterprises involved in
                                                          and committed to collaboration with all relevant
the wholesale of cosmetics and 46,400 specialist stores
                                                          stakeholders, throughout the value chain.
retailing cosmetics. Furthermore, about half a million
hairdressing and beauty salons (the majority of which
are also SMEs or micro-enterprises) rely on the use of
cosmetics. The number of European spas is also growing
and may be a source of inward investment to Europe in
the form of “wellness tourism”.

                                                                                                                      5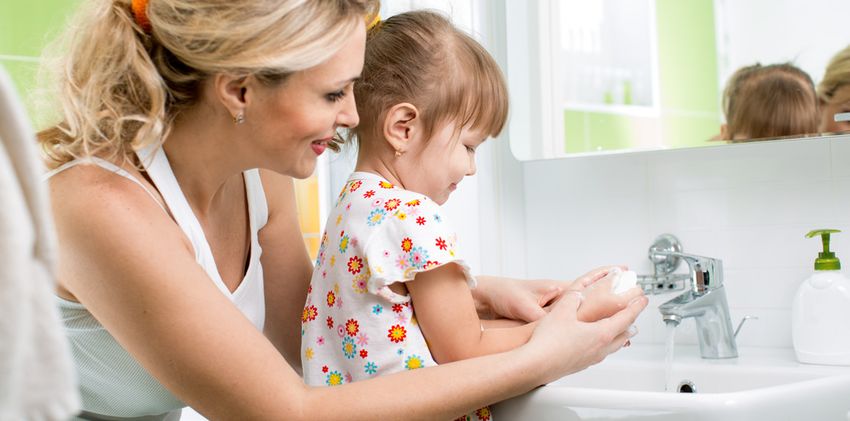
Socio-Economic Contribution
  of the European Cosmetics Industry 2018
         SMEs & big companies are key drivers of innovation & economic growth in the industry

   >5,800 SMES                                    France, Italy & the UK have
                                                  the largest number of SMEs;
    The number is growing                         followed by Poland
                                                  and Spain
     +100 companies manufacturing
         cosmetics ingredients
      23,000 enterprises involved in              578                                                          493
       the wholesale of cosmetics
         46400 specialist stores                  872
          retailing cosmetics
                                                                                                               828
        500,000 hairdressing and
                                                  456
             beauty salons

                The industry supports millions of European jobs up & down the value chain

             Over                                                                        197,000

  2 MILLION
                                                                                  people employed directly
                                                                                       1.63million
    JOBS
                                                                                  people employed indirectly
                                                                                        >366,000
      across Europe                                                                people employed through
                                                                                       induced effects

                167,730 workers employed in the manufacture of cosmetics

           GENDER DISTRIBUTION                             Every 10 workers
             IN THE EUROPEAN                                employed in the
           COSMETICS INDUSTRY                            cosmetics value chain
                                                          will support at least
   Male                                Female            two jobs in the wider
   40%                                   60%                    economy

                                                                                       ~1,000,000
                                                                                        people active in the
                                                                                        hairdressing sector

All data references can be found on pages 41-43
Europe is the global flagship producer of cosmetic products

                                                                                                             > 35bn
                                                                                                           trade in cosmetic
Europe
                                                                                                        products & ingredients
€78.6bn                                                                             Japan €29.4bn
                                                                                                            within the EU30
                                                                           South Korea €9.8bn
US €67.2bn

                                                                                                             21.5bn
                                                                                    China €47.6bn

Brazil €22.8bn
                                                                                    India €10.7bn      total exports of cosmetic
                                                                                                         products from Europe
                                                                                                            (i.e. extra EU-30)

                            Skin care & toiletries:                                                   France & Germany:
                 largest share of the European market (2018)                                        Europe’s main exporters

  €20.39bn              €19.92bn           €14.92bn       €12.28bn     €11.07bn               50% of total global exports
  Skin Care            Toiletries          Hair Care      Fragrances   Decorative                        from Europe
                                                          & Perfumes   Cosmetics

                                      A science-driven & highly innovative industry

                      Expenditure                                                  At least
                       on R&D in                                              77 scientific
                        Europe                                                 innovation
                                                                                  facilities
                      €2.35bn                                                   in Europe
                                                                                                          > 28,800 scientists
                                                                                                        employed in the sector

                                        The industry is about taking care of people

                             72%                                                           80%
                             of consumers                                                  of consumers
                             feel the cosmetics and personal                               identify cosmetics and personal
                             care products they use improve                                care products as important or very
                             their quality of life                                         important in building up self-esteem

                                         Handwashing with soap: reduces risk of diarrhoea
                                         by ~44-47% & acute respiratory illness by 23%

         The industry places a strong emphasis on ensuring environmental responsibility and
                    supporting proactive voluntary and self-regulatory initiatives
 2015: Cosmetics Europe recommendation to discontinue the use of solid plastic micro particles for cleansing and exfoliating
                          in wash-off cosmetic and personal care products (plastic microbeads).
 2016: Cosmetics Europe membership survey found a rapid and substantial 82% reduction, between 2012 and 2015, in the use
        of plastic microbeads for exfoliating and cleansing purposes in wash-off cosmetic and personal care products.
    2018: The strength and effectiveness of the Cosmetics Europe recommendation and the industry voluntary action were
  reconfirmed. New data showed that between 2012 and 2017, 97.6% of plastic microbeads used for cleansing and exfoliating
                             in wash-off cosmetic and personal care products were phased out.
Socio-Economic Contribution of the European Cosmetics Industry

       1. Touching People’s Lives
       The vast majority of Europe’s 500 million consumers use cosmetic and personal care products (hereafter
       ‘cosmetics’) contributing to well-being and healthy lifestyles, and positive self-esteem every day. Ranging from
       antiperspirants, fragrances, makeup and shampoos, to soaps, sunscreens and toothpastes, cosmetics play an
       essential role in all stages of our life (Cosmetics Europe, 2017).
       COSMETICS ARE AN IMPORTANT PART OF PEOPLE’S EVERYDAY LIFE

                                                                                               Shaving
                                                               Mouth-
                                        Creams                                                 creams                        Exfoliators
                                                               washes
                    Lotions
                                                                                                               Serums
                                                                         Toothpastes
                                                                                          Facial
                                                                                          masks
                                                        Flosses                                                              Hydrating &
                                                                                                                             Anti-ageing
                     Oils              Sun Care
                                                                                                                               creams
                                                                                                           Skin Care
                                                                      Oral Care        Cleansing
                                                                                        lotions
                              Gels
                                                                                                                                     Toners
                                            Sprays
                                                                                                     Moisturisers
                                                                                                                       Eye creams
                         Shampoos

                                                     Lotions
                                                                                               Soaps
          Conditioners                                                 TYPES OF                                 Antiper-
                                                                                                                                       Body
                                                                                                                spirents
                                                                      COSMETICS                                                       washes

                                        Hair Care           Hair
                         Serums                          colourants
                                                                                                                                  Shower
                                                                                                             Body Care
                                                                                                   Oils                            gels

                                                    Anti-
             Texturisers                          dandruff
                                                 shampoos                   Nail                                                      Body lo-
                                  Mousses                                varnishes                                                     tions
                                                                                                                    Scrubs

                                                   Lip &                                Scented
                         Lipsticks &             eyeliners                                oils
                           glosses                                        Blushes
                                                                                                          Perfume
                                                                                                                             After
                                                      Decorative                                                             shave
                                                      Cosmetics
                                                                         Mascaras
                         Foundations                                                           Salves
                                                                                                               Perfumes
                                         Powders                 Eye
                                                               shadows

8
1.1 Use of cosmetics
The market penetration of some cosmetic products           FREQUENCY OF USE (NUMBER OF TIMES PER DAY)
is likely to be near 100%. For instance, deodorant         FOR A SAMPLE OF COSMETIC PRODUCTS
penetration is close to total in the UK, whereas results   (FICHEUX ET AL., 2015)
from a 2017 survey show that 90% of young women (18-
                                                                                                           Shower gel
29 years old) use deodorant every day (Statista, 2018a).
In France, 98% of adult women and 94% of adult men                                                 Liquid shampoo
use liquid shampoo (Ficheux et al., 2015).
                                                                                                       Conditioner
In terms of the frequency with which cosmetic
                                                                                                Deodorant (roll on)
products are used, differences can be observed
across countries, between people of different genders                                Deodorant (aerosol)
and ages and for different cosmetic products.
                                                                                                Sunscreen (cream)
A sample of data for some of the most widely used
cosmetic products is given in the diagram to the                                                 Moisturiser (face)
right. In a detailed survey of French consumers,
                                                                                                 Hand moisturiser
the most frequently used cosmetic product was
toothpaste, which adult women used 1.59 times per                                                          Toothpaste

day on average. Adult men used toothpaste 1.52                                                                          2         1.5          1     0.5        0          0.5         1         1.5   2
times per day on average.                                                                                                               Frequency of use (number of times per day)

                                                                                                                                             Adult women                   Adult men

1.2 Expenditure on cosmetics
European consumers spend, on average, €135                 COMPARISON BETWEEN PER CAPITA EXPENDITURE
per year purchasing cosmetic products. A close             ON COSMETICS (COSMETICS EUROPE, 2018) AND PER
relationship can be observed between expenditure on        CAPITA GDP (EUROSTAT, 2016)
cosmetics and GDP, as shown in the figure overleaf.
In 2018, consumers in Switzerland and Norway spent                                                80,000

the most on cosmetics (around €225 per year), which                                                                                                                               NO
                                                                                                  70,000
is unsurprising given that these countries have the                                                                                                                  BE/LU       EUROPE
highest per capita GDP. Consumers in Bulgaria spent                                                                                                              IE              9EU-30)
                                                           GDP per Capita (2016) (€, Nominal)

                                                                                                  60,000
the least on cosmetics – at €58 per year.
                                                                                                                                                                DK
                                                                                                  50,000
Information from the literature review indicates that                                                                                                           NL
                                                                                                                                                                      SE

                                                                                                                                                          AT
average annual spend on cosmetics increases by                                                    40,000                                                        DE
                                                                                                                                                                  FI

age, such that older consumers spend considerably
                                                                                                                                                     UK         FR

                                                                                                  30,000
more than their younger counterparts. In the UK,                                                                                                     ES
                                                                                                                                                                IT

for example, consumers aged over 65 spend more                                                    20,000                                SL
                                                                                                                            HU                  EE   PT
than three times as much on ‘health and beauty’ as                                                                                EL RO
                                                                                                                                 LT
                                                                                                                                       LV      SK
                                                                                                                                      CZ PL
consumers aged 19-24 (Kantar Worldpanel, 2014, as                                                 10,000
                                                                                                                             CH
                                                                                                                                  BG

reported by Statista, 2015). European women over the
                                                                                                       0
age of 60 spend three times as much on skincare as                                                          0       50                   100              150              200             250         300

women under 25 (Credit Suisse, 2013).                                                                           Per Capita Consumption of Cosmetics (2017) (€, RSP basis)

                                                                                                                                                                                                             9
Socio-Economic Contribution of the European Cosmetics Industry

       EUROPEAN WOMEN’S AVERAGE ANNUAL EXPENDITURE ON SKINCARE, BY AGE GROUP (CREDIT SUISSE, 2013)

                                                                     Average annual spending (€)

                       €0      €10.00       €20.00   €30.00        €40.00      €50.00     €60.00      €70.00   €80.00        €90.00   €100.00

                                                                                                                                                Average annual
                                                                                                                                                spending (€)
          60+ years         €87.30                                                                                     4.9
                                                                                                                                                Average number
                                                                                                                                                of units purchased

         40-59 years        €73.00                                                                               4.7

         25-39 years        €40.30                                                      3.3

           Under 25         €25.10                                    2.3

                       0                1                     2                  3                    4                 5                6
                                                                  Average number of units purchased

       1.3 Functional benefits
       Cosmetics contribute to well-being and healthy                                         reduces plaque and tartar which can lead to tooth
       lifestyles. As our hands are vectors for disease,                                      damage and gum disease. Brushing teeth with
       carrying pathogens from contaminated sources to                                        toothpaste is not only important for oral health but
       susceptible hosts, simple tasks such as washing                                        there is evidence that there is a link between gum
       hands with soap can help prevent serious illness.                                      disease and cardiovascular disease (de Oliveira et
       Multiple studies have shown that the leading causes                                    al., 2010). Dental care can be a significant economic
       of child mortality in developing countries, diarrhoeal                                 burden for high-income countries, where 5-10% of
       disease and respiratory infections, can be prevented                                   public health expenditure is related to oral health
       by handwashing with soap. Indeed, a recent literature                                  (WHO, 2012). There is strong evidence that the benefits
       review by Ensink (2015) reveals that handwashing                                       of preventing tooth decay far exceed the costs of
       with soap can reduce the risk of diarrhoea by around                                   treatment (Patel, 2012). In 2012, EU27 expenditure
       44% to 47% and acute respiratory illness by 23%                                        (public and private) on oral health totalled €79 billion
       (Ensink, 2015).                                                                        and is anticipated to reach €93 billion by 2020 (Patel,
                                                                                              2012). If we assume that, without toothpaste, total
       Many cosmetic products contain herbs and essential
                                                                                              expenditure on oral health would be just 5% higher
       oils that can provide additional benefits to our
                                                                                              than today, then the total benefits of using toothpaste
       wellbeing. For example, lavender oil is often added
                                                                                              (in terms of avoided costs) would be approximately
       for its calming and relaxing properties, while citrus
                                                                                              €4.5 billion per annum.
       oils may be added because they are uplifting
       (Deckard, 2015).
       The use of toothpaste in industrialised countries has
       been proven to reduce the prevalence of dental caries,
       particularly toothpaste with fluoride. Toothpaste

10
Exposure to ultraviolet radiation is the only established It was found that invasive melanoma was reduced by
exogenous causal factor for melanoma (a type of skin 75%, for approximately 15 years after trial cessation,
cancer that can spread to other organs of the body) in the group who applied sunscreen daily. Regular
(Williams & Dienes, 2014). Recent studies have shown application of SPF 15+ sunscreen appeared to reduce
that consistent and optimal use of sunscreen may the incidence of new primary melanomas for up to 10
prevent the incidence of melanoma. For example, one years after the trial cessation.
study carried out between 1992 and 2006 examined
the cancer rates of two groups of adults, aged
between 25 and 75 years old (Green et al., 2011). In
this study, one group used sunscreen daily and the
other used sunscreen at their discretional frequency.
1172%
OF CONSUMERS FEEL THE
COSMETICS AND PERSONAL
CARE PRODUCTS THEY USE
IMPROVE THEIR QUALITY
OF LIFE
121.4 Emotional benefits
Cosmetics can help to improve our mood, enhance differences in how various cosmetic and personal
our appearance and create positive self-esteem. care products are perceived. For example, 75% of
They can also help to exhibit personal style and, as Southern European consumers considered sun care
such, are an important means of social expression. products as being important or very important, while
only 32% of Nordic consumers agreed.
A recent Consumer Insights survey by Cosmetics
Europe has shown that 72% of people believe that In Germany, IKW has conducted a study on the
cosmetics improve their quality of life, while 74% of development of self-esteem in young people
people believe cosmetics help them to build up their aged between 14 and 21 years old (IKW, 2018). The
self-esteem. results show that young people invest a lot in their
appearance; for example, 96% of survey respondents
Oral care products (including items such as
indicated that they use toothpaste every day, while
toothpaste, mouthwash and dental floss) are
83% use deodorant daily. A large majority (85%) of
perceived as being particularly important. In the
young people indicated that cosmetic products make
Consumer Insights survey, 94% of consumers said
them “feel safer” (e.g. because they do not smell
that oral care products were ‘ important’ or ‘very
badly or break out in spots), while 53% use cosmetic
important’ to their daily lives. As shown in the bar
products because they want to “feel more like a young
chart on the next page, body care products were
man/woman”. In a 2015 survey by FEBEA, more than
perceived as ‘ important’ or ‘very important’ by
60% of people said that cosmetics have a positive
90% of consumers, while 85% said that hair care
impact on their well-being, image, self-confidence
products were ‘ important’ or ‘very important’ to
and mood (FEBEA, 2015).
their daily lives. The survey also found some regional
THE PERSONAL CARE AND COSMETIC PRODUCTS THAT THE PERSONAL CARE AND COSMETIC PRODUCTS
I USE IMPROVE MY QUALITY OF LIFE (COSMETICS THAT I USE HELP ME TO BUILD UP MY SELF-ESTEEM
EUROPE, 2017) (COSMETICS EUROPE, 2017)
1% 2% 1% 2%
4% 4%
32%
29% 21% 19%
42%
43%
Strongly disagree Somewhat agree Strongly disagree Somewhat agree
Somewhat disagree Strongly agree Somewhat disagree Strongly agree
Neither agree nor disagree Does not apply Neither agree nor disagree Does not apply
13Socio-Economic Contribution of the European Cosmetics Industry
IMPORTANCE OF PERSONAL CARE AND COSMETIC PRODUCTS IN YOUR DAILY LIFE (IN %) (COSMETICS EUROPE, 2017)
HAIR CARE PRODUCTS
MAKE-UP PRODUCTS
PERFUME PRODUCTS
BODY CARE PRODUCTS
SKIN CARE PRODUCTS
ORAL CARE PRODUCTS
SUN CARE PRODUCTS
0% 10% 20% 30% 40% 50% 60% 70% 80% 90% 100%
Does not apply Not important Not Very Important Neutral Important Very Important
Low self-image and self-esteem can have a negative up they were “naked / as though something was
effect on our health. A study by the Renfrew Center missing”. The study found that women wear make-up
Foundation (2012), which surveyed 1,292 women because they like the way it makes them look (48%
(aged 18+), found that almost half of women have of respondents), and because cosmetic use makes
negative feelings when they don’t wear make-up. Of them feel good (32%).
those surveyed, 16% felt unattractive, 14% felt self-
conscious and 14% felt that without wearing make-
Look Good Feel Better (LGFB) is a charity dedicated to improving
the self-esteem, confidence and well-being of women and
teenagers undergoing cancer treatment.
The charity is supported by over 50 leading companies and
brands from the cosmetics industry. LGFB helps to improve
self-image and appearance through free group and self-help skincare and make-up workshops.
The service is available in 27 countries worldwide and over 1.87 million people have been
supported to date.
A major research initiative highlighted that 97% of respondents felt more confident after attending a
LGFB workshop and that the effects of this are enduring, with 96% of respondents still feeling more
confident three months later (out of 2,000 beneficiaries contacted).
Source: Look Good Feel Better, UK (2019)
142. Supporting Jobs & Growth in Europe
2.1 The European cosmetics market
In 2018, the European cosmetics market was valued market, with retail sales for both product groups
at €78.6 billion, making Europe the largest cosmetics worth approximately €20 billion in 2018 (see graph
market in the world. Among the European countries, below). Retail sales of haircare products totalled €14.92
Germany has the largest market for cosmetic products, billion in 2018, while sales of fragrances/perfumes
valued at €13.8 billion in 2018, followed by France (€11.4 and decorative cosmetics totalled €12.28 billion and
billion), the UK (€10.9 billion), Italy (€10.1 billion) and €11.07 billion respectively.
Spain (€7 billion). In terms of products, skin care and
toiletries occupy the largest share of the European
EUROPEAN MARKET BY PRODUCT
EUROPEAN MARKET FOR COSMETIC PRODUCTS CATEGORY (RSP BASIS, € BILLION)
(RSP BASIS, € BILLION) (COSMETICS EUROPE, 2018) (COSMETICS EUROPE, 2018)
Other €25.4
Skin Care €20.39
Spain €7
Italy €10.1
Toiletries €19.92
UK €10.9
France €11.4
Hair Care €14.92
Germany €13.8
Fragrances
& Perfumes €12.28
GLOBAL MARKET FOR COSMETICS PRODUCTS
(€ BILLION) (COSMETICS EUROPE, 2018)
Decorative
South Korea €9.8 Cosmetics €11.07
India €10.7
Brazil €22.8
Japan €29.4
China €47.6
US €67.2
Europe €78.6
15EUROPE IS THE GLOBAL
FLAGSHIP PRODUCER OF
COSMETIC PRODUCTS
162.2 The cosmetics value chain
The industry value chain can be segmented into THE COSMETICS VALUE CHAIN
five main stages. As shown in the figure, the first
stage in the value chain comprises the companies
that provide the raw materials required to make
cosmetic products. These include companies Inputs to
manufacturing the ingredients used in the production Production
of cosmetics, but also companies developing and
manufacturing packaging components and R&D
activities (e.g. market research, product formulation
and industrial design). The next step of the value Manufacturing
chain (manufacturing) is made up of manufacturers.
Socio-economic benefits are created through
production, but also through supporting activities (e.g.
marketing and advertising, IT, accounting and legal Distribution &
services and business administration). The finished Wholesale
cosmetic product may then pass through distribution
and/or wholesale. The final stage of the value chain
involves the retail sale and purchase of cosmetics.
End-consumers may buy cosmetic products through Retail & Beauty
Services
a range of channels, including grocery stores
supermarkets, department stores, pharmacies, online
stores and beauty salons. Beauty salons (e.g. nail
salons, hair salons, spas, etc.) also purchase, use and
Consumers
sell cosmetic products.
2.3 Enterprises in the cosmetics value chain
While the vast majority of companies in the cosmetics
industry are SMEs, the strength of the sector lies in the
co-existence of both large and small companies.
In some countries (e.g. France) SMEs make up
SMEs ARE KEY DRIVERS OF
more than 80% of all cosmetic manufacturers INNOVATION AND ECONOMIC
(FEBEA, 2015b). According to data provided by
Euromonitor International (2019), there were 5,800 GROWTH.
SMEs manufacturing cosmetic products in Europe
in 2018. Many SMEs in the cosmetics industry THERE ARE MORE THAN
employ less than 10 workers and thus qualify as a
micro-enterprise (unfortunately, specific data on
5,800 SMEs MANUFACTURING
the number of micro-businesses manufacturing COSMETICS IN EUROPE.
cosmetics are not available).
17Socio-Economic Contribution of the European Cosmetics Industry
NUMBER OF SMEs MANUFACTURING COSMETICS BY COUNTRY IN 2018 (EUROMONITOR INTERNATIONAL, 2019)
FR 872
IT 828
UK 578
PL 493
ES 476
DE 397
HU 228
CH 225
SE 197
NL 176
OTHER 1350
In terms of inputs to production, there are over 100 Cosmetics are distributed to consumers through
companies manufacturing cosmetic ingredients in a wide variety of different channels, including
Europe (EFfCI, 2018) and it is likely that a large number supermarkets, pharmacy and drug stores,
of enterprises are also involved in the manufacture department stores, direct selling, speciality
of cosmetic packaging and packaging components. stores, beauty salons and, increasingly, internet
Indeed, it is estimated that in 2009 the European retailing. In 2015, there were approximately
cosmetics industry consumed $5,506 million (€4,317 46,400 specialist stores retailing cosmetic products
million) of packaging, which gives an indication of the in Europe (Eurostat, 2015). Our research indicates
scale of this industry in Europe (Pira International, as that specialist stores make up less than 26% of total
reported by Statista, 2015). cosmetic sales; which implies that the total number
of retail outlets selling cosmetic products is likely to
In 2015, there were approximately 23,000 enterprises
be considerably higher than 46,400.
involved in the wholesale of cosmetics in Europe, the
majority of which were located in Italy (17%), Spain
(15%) and France (10%) (Eurostat, 2015).
COSMETIC SALES BY DISTRIBUTION CHANNEL (BY VALUE OF SALES)
Supermarket / hypermarketNUMBER OF ENTERPRISES INVOLVED IN THE NUMBER OF ENTERPRISES INVOLVED IN THE RETAIL SALE
WHOLESALE OF COSMETICS BY COUNTRY OF COSMETICS BY COUNTRY (SPECIALISED STORES ONLY)
(EUROSTAT, 2015) (EUROSTAT, 2015)
OTHER 4,950 OTHER 6,520
GR 870 UK 1,180
SE 920 CZ 1,260
RO 950 BG 1,960
NL 1060 PT 2,000
UK 1,350 GR 2,410
DE 1,430 FR 4,010
PL 1,650 DE 4,080
FR 2,410 PL 4,380
ES 3,480 ES 6,300
IT 3,920 IT 12,350
The beauty services sector (which includes hairdressing NUMBER OF HAIRDRESSING ESTABLISHMENTS IN THE
salons and other personal grooming establishments) EU (ICF GHK, 2014)
relies heavily on the use of cosmetic products and a
growing number of enterprises in the sector actively
sell cosmetic products. Data are not available on
the total number of beauty salons using and selling
cosmetics in Europe, although information from five HIGH ESTIMATE
500,000
countries (France, Germany, Italy, Spain and the UK)
indicates that there are at least 77,750 beauty salons
(Clarke, 2009).
It has been estimated that there are between
400,000 and 500,000 hairdressing establishments LOW ESTIMATE
in the EU, with the largest number in Italy (73,000 in
2012), Germany and France (over 65,000 businesses
400,000
per country) (ICF GHK, 2014). The sector is also sizable
in terms of number of businesses in the Czech
Republic, Poland, Spain and the UK (more than
35,000 businesses respectively). The hairdressing
sector is dominated by SMEs and micro-enterprises,
The number of European spas is also growing and
with the average businesses consisting of five
may be a source of inward investment to Europe in
hairdressers (often one owner operator and four
the form of “wellness tourism”.
staff members). ICF GHK (2014) report that, in recent
years, the share of micro-enterprises in the sector Although specific data are not available, numerous
(ranging from companies run by owner operators to other types of enterprises are also involved indirectly
those having up to two employees) and franchised in the cosmetics value chain. For example, distribution
salons has grown at the expense of what can be is a key business area in the cosmetics value chain.
considered ‘small’ businesses (between three and Many enterprises are also likely to be involved in
ten employees). This can, in part, be attributed to advertising and the provision of business services (IT,
policies to support self-employment. legal services, accountancy, utilities, property, etc.).
19Socio-Economic Contribution of the European Cosmetics Industry
2.4 Contribution to Europe’s GDP (GVA)
The manufacture of cosmetic products contributes
(directly) around €11.05 billion in GVA to the European
economy each year. In terms of indirect impacts, the THE COSMETICS INDUSTRY
wholesale and retail sale of cosmetics also contribute
to Europe’s GDP. Data from Eurostat indicates that, in CONTRIBUTES TO THE
2015, these activities contributed at least €18.14 billion
in GVA to the European economy. Note that data are FUTURE PROSPERITY
missing or incomplete for some countries (namely the OF EUROPE.
Czech Republic, Ireland, the Netherlands, Slovenia and
Switzerland) and that other indirect impacts along the
supply chain have not been included in this estimate.
A total of €29.19 billion is therefore likely to represent
an underestimate of the total GVA contributed by the
European cosmetics industry.
GVA IN THE COSMETICS VALUE CHAIN (€ BILLION, 2015) (EUROSTAT, 2015)
Other DE
€2.26 €2.31
Other
€3.33
ES
€0.96
MANUFACTURE FR
€5.10 WHOLESALE
€11.05 billion €10.12 billion UK
UK
€1.00 €2.04
IT
€0.88
IT
€1.14 ES
DE €1.56 €1.06 FR €1.38
FR
Other €7.38
Other DE €8.36
€2.59 €2.65
RETAIL TOTAL
(SPECIALISED STORES)
€8.02 billion ES
€29.19 billion
€2.51
ES DE
€0.50 €6.52
IT
€0.95 IT
FR €2.97
€0.91
UK €0.92 UK €3.95
202.5 Job creation
Including direct, indirect and induced employment,
the European cosmetics industry is estimated to
support over 2 million jobs.
THE COSMETICS INDUSTRY
Direct employment GENERATES MILLIONS OF JOBS
Data from Eurostat for 2015 indicates that more than THROUGHOUT THE EUROPEAN
138,000 people (FTE units) are employed directly in the
manufacture of cosmetic products. France, Germany, SUPPLY CHAIN.
Poland, the UK and Spain account for the majority
(77%) of these jobs. Taking into account growth in the
sector in recent years and accounting for data gaps
TOTAL INDIRECT (DOWNSTREAM) EMPLOYMENT IN THE
in the Eurostat database, Cosmetics Europe calculate
COSMETICS VALUE CHAIN (COSMETICS EUROPE, 2018)
that, in 2018, total employment in the manufacture of
cosmetic products was 167,730 workers.
NUMBER OF WORKERS EMPLOYED IN THE
MANUFACTURE OF COSMETIC PRODUCTS IN EUROPE
IT
(COSMETICS EUROPE, 2018) 296,520
TOTAL
Others
624,930
INDIRECT
EMPLOYMENT DE
250,180
Other
42,120
FR
47,040 1,634,900 workers
UK
MANUFACTURE ES
117,230
188,290
FR
ES
167,730 workers 157,950
14,410
DE
IT 27,360
18,330 Taking into account recent growth in the European
PL 18,470 cosmetics industry and employment relating
to the distribution of cosmetic products and
beauty services, Cosmetics Europe calculate that
total indirect employment in the European cosmetics
Indirect employment industry was ~1.63 million workers in 2018. This
In 2015, at least 441,300 people were employed includes around 1 million individuals that are active
indirectly (downstream) in the European cosmetics in the hairdressing sector in the EU (ICF GHK, 2014).
value chain, where this includes employment in
the wholesale and retail sale of cosmetic products
in specialist stores (Eurostat 2015). As explained
previously, specialist stores only make up a small
proportion of total cosmetics sales and so the
total number of people involved in the retail sale of
cosmetic products is likely to be considerably higher.
21It has been estimated that hairdressing makes Induced employment
up, on average, about 0.5% of total employment Our research indicates that an induced employment
in the Member States and that Germany multiplier of 0.2 to 0.3 is appropriate for the
has the largest number of workers in the cosmetics industry. An employment multiplier of
hairdressing sector (~274,000) (ICF GHK, 2014). 0.2 simply means that for every 10 jobs created
directly or indirectly in the supply chain for cosmetic
Note that, in reality, there are likely to be more products, a further two jobs are created through
than 1.6 million people employed indirectly in induced employment effects. In total, it is estimated
the European cosmetics industry as this figure that 366,200 to 549,400 jobs are created as a result
excludes employment ‘upstream’ in the cosmetics of induced employment effects in the European
supply chain (e.g. in the manufacture of cosmetic cosmetics industry.
ingredients, and provision of business services,
etc.). Although reliable data on the total number of INDUCED EMPLOYMENT IN THE EUROPEAN COSMETICS
people employed upstream in the cosmetics value INDUSTRY, NUMBER OF WORKERS (2018) (OWN ESTIMATE)
chain does not exist, the International Fragrance
Association (IFRA) has estimated that there may be
in the region of 7,000 people employed directly in
the European fragrance industry. Fragrances are
an important ingredient used in many cosmetic
HIGH ESTIMATE
549,400
products, but also find use in some household and
industrial products; thus, only a proportion of these
jobs can be attributed to the production of cosmetic WORKERS
fragrances (IFRA, 2013). It has been estimated that
around 60% to 70% of the world’s fully qualified
perfumers reside in Europe (up to 540 to 630 people) LOW ESTIMATE
(IFRA, 2013).
366,200
WORKERS
222.6 Wages and salaries
Direct employment TOTAL WAGES AND SALARIES PAID TO EMPLOYEES
(€ MILLION, 2015) (EUROSTAT, 2015)
Over €5.1 billion per year is paid in wages and
salaries to workers employed directly in the
DIRECT IMPACT
manufacture of cosmetic products (based on 2015
data for most countries), note that this excludes
wages and salaries paid to workers in Malta, Manufacture 5,140
Slovenia, and Switzerland for which comparable
data do not exist. INDIRECT IMPACT
Indirect employment
Data on the total wages and salaries paid to workers Wholesale 5,209
employed indirectly by the cosmetics industry are
only available for the wholesale and retail sale of
Retail
cosmetics in specialised stores and are not available
for other sources of indirect employment up and
(Specialised 6,768
Stores)
down the supply chain. The data shown in the graphs
to the right therefore underestimate the total wages
and salaries paid. Nevertheless, this conservative
data shows that, as a minimum, €12.0 billion is TOTAL 17,117
paid in wages and salaries to workers employed
indirectly in the supply chain for cosmetics.
2.7 Employment taxes
Direct & indirect employment taxes As indicated in the graphs below, at least €5.3
Data on the total social security contributions billion in social security contributions was made
made by workers in the cosmetics industry are only by workers employed in the cosmetics industry in
available for the manufacture, wholesale and retail 2015. Of this, approximately €2.4 billion was paid by
sale of cosmetics (in specialised stores). As for the workers employed directly in the manufacture of
data on total wages and salaries, this represents an cosmetic products.
underestimate of the total employment taxes paid
by workers employed in the cosmetics industry,
but provides a useful baseline, or minimum value,
of the total social security contributions paid.
23Socio-Economic Contribution of the European Cosmetics Industry
SOCIAL SECURITY CONTRIBUTIONS MADE BY WORKERS IN THE COSMETICS INDUSTRY
(€ MILLION, 2015) (EUROSTAT, 2015)
Other
€257
ES Other FR
€124 €342 €327
DE
€189 FR
MANUFACTURE €1,060
WHOLESALE
IT
€204
€2,424 million €1,363 million
IT
€150 DE
€235
ES
SK
€153 UK
€590
€157
Other Other
€331 €1,167 FR
€1,590
RETAIL DE
€619 TOTAL
AT (Specialised Stores)
ES
€5,352 million
€94
ES
€1,564 million €382
€105
IT
€568
FR DE
€204 €1,042
IT €214 SK €604
2.8 Responsible employer
Overall, the European cosmetics industry employs Data on the age distribution of workers in the
more female workers (60%) than males (40%), cosmetics industry are not available for all countries.
although there are variations between countries. Nevertheless, partial information from consultation
For example, in France, which employs the largest indicates that between 10% and 25% of workers (16,600
number of workers, 58% of workers are male. to 41,400 people) are under the age of 29, 45% to 65% of
workers (74,600 to 107,700 people) are between the ages
of 30 and 49 and around 15% to 35% of workers (24,900
to 58,000 people) are aged 50+.
24Companies in the cosmetics industry are increasingly Besides paying employee’s wages and salaries,
taking steps to increase diversity and equality in the most large companies provide additional in-house
workplace. For example, by increasing the diversity benefits to their workers. For example, healthcare
of leadership teams through increasing the number benefits (e.g. health check-ups, smoking-cessation
of female executives on management boards and by programmes, influenza vaccinations, fitness
hiring people with disabilities. programmes), maternity/paternity leave and
insurance guaranteeing a payment in the event of
GENDER DISTRIBUTION OF WORKERS death or disability. Companies in the cosmetics
N THE EUROPEAN COSMETICS INDUSTRY industry also invest in training to develop the skills
(COSMETICS EUROPE, 2018) of their employees. Information from consultation
suggests that more than 32,000 workers have received
in-house or external training in 2017. Companies in
Male Female
the cosmetics industry also provide a large number
40% 60% of internships, apprenticeships, work experience
placements and graduate schemes. For example,
more than 2,900 paid internships were provided by
the European cosmetics industry in 2017.
NUMBER OF WORKERS EMPLOYED IN THE MANUFACTURE OF COSMETICS BY AGE GROUP (EU 30)
Low estimate High estimate
% workforce 10% 25%
50 years
Estimated no. workers 24,900 58,00
Own estimate based on data from consultation. Total number of workers employed in the manufacture of
cosmetics in Europe: n = 165,750
25THE COSMETICS
INDUSTRY IS
A SCIENCE-DRIVEN,
FAST PACED AND
HIGHLY INNOVATIVE
SECTOR.
263. Advancing Innovation & Science
in Research
3.1 R&D in the European cosmetics industry
The European cosmetics industry plays a leading
role in product development and is a fast-paced and
highly innovative sector.
THERE ARE AT LEAST 77
Information from consultation indicates that there
INNOVATION FACILITIES IN EUROPE
are at least 77 innovation facilities in Europe CARRYING OUT RESEARCH IN
carrying out research in relation to cosmetics.
This includes partial data for Belgium, Germany,
RELATION TO COSMETICS.
Denmark, Spain, France, Croatia, The Netherlands,
Sweden, Slovenia, Switzerland and Norway and is
likely to be a considerable underestimate of the
total number of such facilities. Large companies
operating in the European cosmetics industry
often have multiple different research centres
focusing, for example, on product development,
market research and regulatory compliance.
NUMBER AND LOCATION OF INNOVATION FACILITIES IN EUROPE CARRYING OUT RESEARCH IN RELATION TO
COSMETICS (PARTIAL DATA BASED ON CONSULTATION, COSMETICS EUROPE 2018)
1
Belgium: 1
1
Germany: 3
Denmark: 1 1
Spain: 40
France: 14 10
Croatia: 4 1 3
Netherlands: 10
14
Sweden: 1 1
1
Slovenia: 1 4
Switzerland: 1
40
Norway: 1
27Socio-Economic Contribution of the European Cosmetics Industry
On average, large companies in the cosmetics Between 2012 and 2016, Europe’s top 10 make-up
industry have a product portfolio of around 10,000 innovators reportedly produced over 2,750 inventions
different cosmetic products and reformulate around (Clarative Analytics, 2017).
25% to 30% of their products every year (European
Commission, 2013). Out of these reformulations, It has been reported that innovation related
about 10% depend on ingredients that are new to the to antiperspirants, perfumes and skin-related
market (i.e. not used in any other sector), or are new technology is particularly strong (Clarative Analytics,
to the cosmetics industry (i.e. already used in other 2017). It can take over 5 years of research and
sectors, but not previously used for cosmetics). Large formulation to bring a new product to the market.
companies introduce around 80 new ingredients
to their product portfolio each year, while SMEs
introduce on average 22. SMEs are thought to have
around 40 to 160 products in their product portfolio.
Information from consultation indicates that large
enterprises manufacturing cosmetics in Europe
spend in the region of 5% of their annual turnover
(sales) on R&D (within Europe). Assuming that all
companies in the cosmetics industry spend 5% of
TOTAL EXPENDITURE ON R&D
IN EUROPE IN 2017
€2.35 BILLION
(ESTIMATED)
their annual turnover on R&D, total expenditure on
R&D in Europe would have totalled €2.35 billion in
2017. It should be noted that because the business
model for carrying out research frequently involves a
partnership (e.g. between a cosmetics manufacturer
and a supplier and/or research institute), this figure
is likely to be an underestimate.
28Finding alternatives to animal testing
and demonstrating their use
For more than 20 years, the cosmetics industry’s best scientists, and its strategic
partners, have been dedicated to supporting the development, validation and/or
regulatory acceptance of alternative test methods and approaches.
Cosmetics Europe’s research into alternatives to animal testing is founded on
multidisciplinary partnerships between our member companies (including large
as well as small and medium sized enterprises), and other parties that have
a deep interest and knowledge of alternative methods and approaches for
consumer safety assessment. The research partners include the international
regulatory community, validating agencies, academia, research institutes, and
the suppliers industry.
The main research programme, the Long Range Science Strategy (LRSS), is
supported and funded by a consortium of Cosmetics Europe members. Started
in 2016 and scheduled to run until 2020, it comprises a number of projects across
the five most relevant areas for the safety evaluation of cosmetic ingredients:
(i) eye irritation and severe eye damage, (ii) genotoxicity/mutagenicity, (iii) skin
sensitisation, (iv) exposure, absorption, distribution, metabolism, and elimination
(ADME), and (v) systemic toxicity. The data and outcomes generated in each of
the five research areas have already allowed us to develop several robust safety
assessment approaches.
Cosmetics Europe will continue to develop case studies to facilitate discussions
with safety assessors both from industry and the regulatory community on the use
of the new approaches and to demonstrate their merit.
29Socio-Economic Contribution of the European Cosmetics Industry
3.2 Working with the scientific community
In 2018, 28,800 scientists were employed in the Indeed, information from consultation indicates that
European cosmetics sector, covering a diverse range cosmetic companies may work with several different
of scientific disciplines - physics, microbiology, organisations simultaneously and that many of their
biology, toxicology, physiology, rheology, R&D projects are undertaken with supplier input.
nanoscience, analytical chemistry and genetics to Such relationships allow companies to have access
name a few. By attracting and training workers with to (and share) technologies and knowhow that they
specialist skills, the cosmetics industry increases the do not have in-house and provide participants with a
pool of talent and skilled labour for other science-led competitive advantage.
industries - such as pharmaceuticals.
TOTAL NUMBER OF SCIENTISTS EMPLOYED
IN THE EUROPEAN COSMETICS INDUSTRY
>28,800 SCIENTISTS (COSMETICS EUROPE, 2018)
ARE EMPLOYED IN THE EUROPEAN
COSMETICS INDUSTRY
(COSMETICS EUROPE, 2018) Other
6,840 FR
8,350
Companies operating in the cosmetics industry TOTAL SCIENTISTS
frequently collaborate with other organisations PL
when they undertake research, where this includes
1,690
>28,800
European universities, scientific research institutes, IT
2,480
NGOs and start-ups. Research projects in the DE
5,310
cosmetics industry may have a variety of partner UK
4,130
configurations (private/private, private/public, or
public/public) (Bretonès & Scheel, 2011).
SOCIETY OF COSMETIC SCIENTISTS COSMETIC VALLEY (FRANCE)
The Society of Cosmetic “Cosmetic Valley” is a world-leading
Scientists provides professionals technopol, situated across three regions
working in the cosmetics of Northern France: Centre, Ile-de-France and Upper
industry with the opportunity Normandy. Officially designated a “competitiveness
to disseminate their research cluster” in 2005, it is the most important French business
and exchange knowledge pertinent to cluster specialized in the production of consumer goods.
cosmetics and related sciences. It does this The Cosmetic Valley cluster comprises 400 member
through activities including publications, companies, has an annual turnover of €26 billion and
educational programmes and scientific creates approximately 90,000 jobs. As of December 2015,
meetings. Through this type of activity, the the Cluster had officially backed more than 175 R&D
cosmetics industry creates ‘knowledge spill- projects, worth €280 million. Eight universities, 226 state
over effects’ which benefit consumers and laboratories and 8,200 researchers (public and private)
other sectors of the economy. participate in Cosmetic Valley.
Source: SCS (2015) Source: Cosmetic Valley (2018)
303.3 New opportunities in the digital economy
The digital economy is developing rapidly and is the example, by spurring innovation in business models
single most important driver of European innovation, and enabling greater access to international markets.
competitiveness and growth (European Commission,
Beauty bloggers and vloggers are also changing the face
2015). Although e-commerce only accounts for a
of the cosmetics industry, with some making successful
relatively small proportion of overall cosmetics
careers for themselves by posting commentaries and
sales, the quantity, value and overall proportion of
tutorials on platforms such as YouTube or Instagram.
cosmetic products sold online in Europe is expected
to grow substantially over the coming years. In
PROPORTION OF SHOPPERS THAT BOUGHT
Germany, for example, online beauty and cosmetics
COSMETICS, SKINCARE AND/OR HAIRCARE PRODUCTS
sales increased by 14% in 2017, faster than the overall
ONLINE IN 2016 (POSTNORD, 2016)
online retail market (Rigby, 2018).
The cosmetics industry is at the forefront of
Belgium 15%
stimulating new online retail formats and the
digital economy will increasingly impact the way the Italy 17%
industry communicates with people and distributes
its products. Embracing new online retail formats Netherlands 17%
will be essential, alongside maintaining traditional
distribution channels, such as selective distribution Spain 18%
and in-store product experiences. New technologies
may bring with them new modes of diagnosis, more Poland 23%
effective methods of delivery or production, and
improved product functionality. Nordics 23%
The cosmetics industry has developed a number
of new initiatives to encourage consumers to shop France 28%
online, including flexible delivery options and
editorial content and advice lines that encourage Germany 31%
browsing. One company has created an app that
allows internet users to try cosmetic products via
UK 32%
the camera on their phone, without using any make-
up samples. Consumers are subsequently able to
purchase the cosmetics online directly via the app.
The innovation generated by online and multi-channel
retailers is likely to make a significant contribution to
the competitiveness of the European economy, for
31Socio-Economic Contribution of the European Cosmetics Industry
4. Contributing to European
Economic Welfare
4.1 Leveraging European internal market
Trade in cosmetic products and ingredients within
the EU30 exceeded €35 billion in 2016. France and
Germany were the main exporters, exporting €7.56 TRADE IN COSMETIC
billion and €6.03 billion respectively to the EU30 in
2016. Germany was the main destination for cosmetic
PRODUCTS AND INGREDIENTS
products and ingredients made in France, while the WITHIN THE EU30 EXCEEDED
UK was the main destination for cosmetic products
and ingredients made in Germany. The UK, Ireland and
€35 BILLION IN 2016
Italy are also key exporters of cosmetic products and (UN COMTRADE DATABASE, 2016)
ingredients, exporting €3.47 billion, €3.18 billion and
€2.73 billion respectively to the EU30 in 2016.
SUM OF TRADE VALUE IN 2016 (€ BILLION) (UN COMTRADE DATABASE, 2016)
Exported to
France Germany UK Ireland Italy Other TOTAL
France 1.85 1.14 0.05 1.03 3.50 7.56
Germany 0.74 0.81 0.06 0.49 3.92 6.03
Exported from
UK 0.34 0.63 0.80 0.14 1.56 3.47
Ireland 0.44 0.50 0.67 0.21 1.37 3.18
Italy 0.48 0.58 0.36 0.02 1.30 2.73
Other 1.56 2.42 1.60 0.09 0.92 12.75
Total 3.56 5.98 4.58 1.01 2.79 17.80 35.73
4.2 Exports from Europe
In 2018, exports of cosmetic products from Europe VALUE OF COSMETIC EXPORTS FROM EUROPE (EU30),
(i.e. extra EU30) totalled €21.5 billion. France and BY EXPORT COUNTRY (€ BILLION)
Germany were Europe’s main exporters, exporting (COSMETICS EUROPE, 2018)
more than €10 billion between them and accounting
for 50% of total global exports from Europe. France €7,802
Germany €3,054
EXPORTS OF COSMETIC PRODUCTS Italy €2,023
FROM EUROPE WERE VALUED AT
Spain €1,852
€21.5 BILLION IN 2018
(COSMETICS EUROPE, 2018) UK €1,409
Other €5,360
324.3 Development of global intangible assets
Intangible assets are defined as identifiable non- by 17.6% between 2013 and 2015. Of the world’s 50
monetary assets that cannot be seen, touched or leading cosmetic brands, 22 are domiciled in Europe
physically measured. Examples of intangible assets (BrandFinance, 2017). France is an important player in
include patents, trademarks and the value of a terms of global cosmetic brands, with brands worth
company’s brand name. approximately €39 billion in 2015. Cosmetic brands
in the UK and Germany were worth an estimated
The total value of Europe’s leading cosmetics brands
€12.7 billion and €7.0 billion respectively in 2015.
is estimated to exceed €59 billion and has grown
BRAND VALUE OF EUROPE’S LEADING COSMETIC BRANDS, BY COUNTRY 2015 (€ BILLION) (BRANDFINANCE 2017)
UK
€12.7 billion
Germany
€7.0 billion
France
€39.2 billion
BRAND VALUE OF EUROPE’S LEADING COSMETIC BRANDS, 2013 TO 2015 (€ BILLION) (BRANDFINANCE, 2017)
62.0
60.0
+3.1%
58.0
56.0 €60.0
+14.1% €58.2
54.0
52.0
€51.0
50.0
2013 2014 2015
The data presented in the figures on this page are based on an analysis by BrandFinance (2017) of the world’s 50
leading cosmetic brands and thus represents an underestimate of the total value of cosmetic brands in Europe,
as the value of smaller brands has been excluded. Discrepancies between the values shown in the graph are
due to rounding.
33Socio-Economic Contribution of the European Cosmetics Industry
4.4 Support for world-leading marketing
services cluster
Information from consultation indicates that A total of 1,861 advertisements were reviewed, including
Europe’s largest cosmetic companies may spend in 577 television and 1,284 print advertisements aired/
the region of 20% to 30% of their annual turnover published in six representative markets over a three
(sales) on marketing. Taking this data into account, month period – September 2014, March and June
together with data on the total value of cosmetics 2015. It showed that 91% of the advertisements
produced in Europe, it is estimated that the European of cosmetic products were in compliance with all
cosmetics industry invested between €9.4 billion relevant advertising codes/laws.
and €14.1billion in marketing in 2017.
The industry supports responsible marketing TOTAL EXPENDITURE ON MARKETING FOR COSMETICS
IN THE EU30 IN 2017 (€ BILLION) (OWN ESTIMATE)
practices and proactively drives self-regulatory
initiatives in advertising. Cosmetics Europe launched
a ‘Charter and Guiding Principles on responsible
High
advertising and marketing communication’ in 2012 Estimate €14.1
in response to the accepted best practice model for
effective advertising self-regulation. This Charter sets
Low
out the benchmark for the responsible advertising of Estimate €9.4
cosmetic products in Europe. The industry has also
undergone its first independent audit conducted by
the European Advertising Standards Alliance (EASA).
4.5 Inward investment by non-EU
multinational corporations
Inward investment plays a crucial role in enhancing US$50 million (€39 million) to build, was anticipated
the competitiveness of Europe within the global to offer employment to over 300 workers. Cosmetics
economy and leads to the creation of jobs for manufactured at the site are exported to markets in
European workers, increased tax revenues and Europe, the Middle East and Africa.
the inward flow of new technologies and skills. For
example, in 2009, a company from outside of Europe
opened a new cosmetics production plant in Central
Poland. The plant, which is estimated to have cost
34You can also read


