Study On European Urban Transport Roadmaps 2030 - Urban transport policy roadmaps
←
→
Page content transcription
If your browser does not render page correctly, please read the page content below
Study On European Urban Transport
                  Roadmaps 2030
          Urban transport policy roadmaps

                        Ref: MOVE/C1/2013-188-2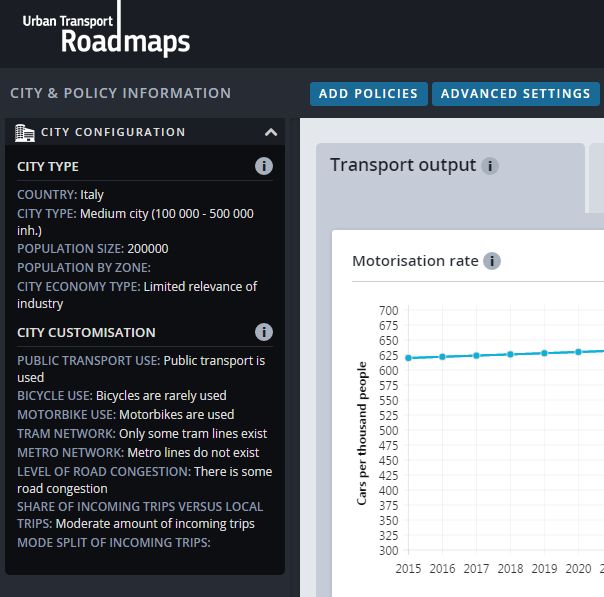
Study On European Urban Transport Roadmaps 2030

Customer:                                       Contact:
DG MOVE                                         Guy Hitchcock
                                                Ricardo Energy & Environment
Customer reference:                             Gemini Building, Harwell, Didcot, OX11 0QR
                                                t: +44 (0)1235 75 3327
MOVE/C1/2013-188-2
                                                e: guy.hitchcock@ricardo.com
                                                Ricardo-AEA Ltd is certificated to ISO9001 and
Confidentiality, copyright &                    ISO14001
reproduction:
This report is the Copyright of the European
Commission and has been prepared by
Ricardo Energy & Environment, a trading         Author:
name of Ricardo-AEA Ltd, under contract to
DG MOVE dated 23/12/2013. The contents          Claudia de Stasio (TRT), Davide Fiorello (TRT),
of this report may not be reproduced in         Francesca Fermi (TRT), Guy Hitchcock (Ricardo
whole or in part, nor passed to any             Energy & Environment), Sujith Kollamthodi (Ricard
organisation or person without the specific     Energy & Environment)
prior written permission of the European
Commission. Ricardo Energy &
Environment accepts no liability whatsoever
to any third party for any loss or damage
arising from any interpretation or use of the
information contained in this report, or
reliance on any views expressed therein.        Date:
                                                11 March 2016

                                                Ricardo-AEA reference:
                                                ED59199

  Disclaimer
  The information and views set out in this report are those of the author(s) and do not
  necessarily reflect the official opinion of the Commission. The Commission does not
  guarantee the accuracy of the data included in this study. Neither the Commission nor any
  person acting on the Commission’s behalf may be held responsible for the use which may
  be made of the information contained therein.

Urban Transport Policy Roadmaps                                                                     i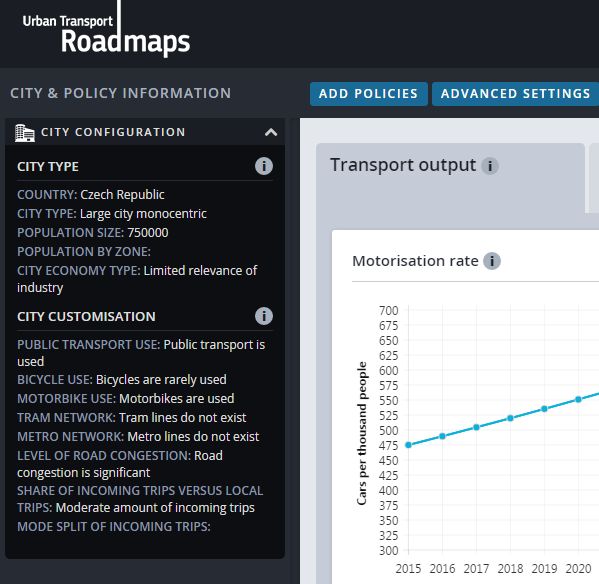
Study On European Urban Transport Roadmaps 2030

Table of contents
1    Introduction ................................................................................................................ 1
     1.1 Background and objectives of the policy roadmaps ............................................ 1
     1.2 Defining a policy roadmap .................................................................................. 1
     1.3 Content of the report .......................................................................................... 2
2    Background trends .................................................................................................... 4
     2.1 Reference trend ................................................................................................. 4
     2.2 Alternative trend ................................................................................................10
3    Urban policy measures .............................................................................................16
     3.1 Key urban policy measure .................................................................................16
     3.2 Classification of policies ....................................................................................17
4    Policy scenarios ........................................................................................................22
     4.1 Promote and regulate ........................................................................................25
     4.2 Plan and Build ...................................................................................................25
     4.3 Charge and Provide ..........................................................................................25
5    The policy roadmaps ................................................................................................27
     5.1 Promote and regulate roadmap .........................................................................27
     5.2 Plan and Build roadmap ....................................................................................33
     5.3 Charge and Provide roadmap ...........................................................................37
6    Impact of the roadmaps ............................................................................................43
     6.1 “Promote & Regulate” .......................................................................................43
     6.2 “Plan & Build” ....................................................................................................53
     6.3 “Charge and Provide” ........................................................................................63
7    Conclusions...............................................................................................................74
8    References .................................................................................................................75

Urban Transport Policy Roadmaps                                                                                                   ii
Study On European Urban Transport Roadmaps 2030

1 Introduction

1.1 Background and objectives of the policy roadmaps
Cities in Europe are vital centres of economic activity, innovation and employment. Many of
them face increasing challenges to their mobility systems such as congestion, air quality,
ambient noise, CO2 emissions, accidents and urban sprawl. These have significant negative
impacts on the environment, health and economic performance of cities and can often affect
a much broader area than the city itself. Many of these problems are expected to increase in
the future as cities continue to grow in size and face demographic changes such as ageing
populations.
Urban transport systems are integral elements of the European transport system and are
therefore of concern for the Common Transport Policy. Urban transport faces a number of
sustainable development challenges. The 2011 Transport White Paper sets ambitious targets
to address these challenges. Meeting these targets will not happen autonomously as a result
of technological development or market forces and consequently, policy action is needed at
the city level in order to ensure that the objectives for urban transport are met.
There is a wide range of instruments available to implement this policy effort, including land-
use planning, pricing schemes, infrastructure for non-motorised modes, charging/refuelling of
clean vehicles to reduce emissions, and many others. These instruments should be part of a
meaningful strategy in order to develop cost-effective interventions.
This study on developing EU Urban Transport Roadmaps to 2030 is aimed at playing an
important role in supporting cities to meet the Transport White Paper objectives for urban
transport through the provision of a web based policy support tool, supported by detailed policy
roadmaps and underpinned by a range of stakeholders’ engagement activities.
The availability of tools and guidance documents is central to the development of cost-effective
strategies, helping policy-makers to understand the range of possible actions and steps to
successful implementation.
The development of the policy roadmaps is focused on the achievement of the EU’s 2030
objectives for urban transport, as specified in the 2011 Transport White Paper. Roadmaps
describe the specific steps that need to be taken to implement a strategy and the timing
required for each step, taking the urban context into account. The development of the
roadmaps helps to recognise that different types of policy measures are appropriate for
different types of cities. The analysis of scenarios and roadmaps help to assess the impact of
the European urban mobility policies in the long term.

1.2 Defining a policy roadmap
The definition of a roadmap starts from setting objectives, i.e. defining a scenario where some
changes have occurred in order to improve the current conditions from some relevant point of
view (for this study the sustainability of urban transport and mobility). The scenarios also define
the policy content in terms of measures aimed at meeting the objectives. The measures
included in the scenarios can be diverse in nature, objective and complexity. Their
implementation requires time and resources and should consider the local conditions, the
stakeholders involved and other practical aspects.
These practical aspects can be fully specified only with reference to real cases where the policy
measures are applied. However, the ambition of this study is to provide more than just a list of
theoretical measures. Therefore the policy scenarios are supported by roadmaps.
Roadmaps define how each scenario can be achieved (i.e. the specific steps that will need to
be taken and the timing required for each step) in a hypothetical urban context. The roadmaps

Urban Transport Policy Roadmaps                                                                  1
Study On European Urban Transport Roadmaps 2030
also discuss the implementation issues that should be taken into account and identify the main
stakeholders that should be involved.
In order to define a representative roadmap the following key steps have to be followed:
(a) The identification of the basic components of the scenarios. These components are the
policy measures available to define a scenario to move towards the objectives.
(b) The classification of the contributions that each component can provide to the scenarios.
The policy measures are different, some require physical investments others are mainly a
matter of setting (and enforcing) different rules. Also, the type of impact expected from each
instrument is different, some have complementary effects, and some may have conflicting
effects.
(c) Grouping of measures in consistent scenarios. Having in mind the objectives and building
on the classification of the policy instruments, a coherent package of measures can be defined.
Alternative scenarios can be developed according to the nature of the measure, the strength
of the interventions, their expected effectiveness and implementation costs.
(d) The specification of the pathway to proceed towards specific scenario goals. The final step
makes the roadmap more than a list of potential measures as the practical issues related to
the implementation of the policy measures are considered: timing, relationships between
different interventions, stakeholders involved and others.
1.3 Content of the report
Local conditions are very relevant for the definition of roadmaps. Therefore the purpose of this
study cannot be to come up with detailed roadmaps for a specific urban context. The
development of roadmaps within this project has two main objectives:
First, to identify alternative policy scenarios and implementation roadmaps, selecting
different subsets of instruments among all the potential policy measures identified in
previous steps of the project.
Second, to define practical examples for experimenting with the policy support tool to
show how the tool can help for policy screening purposes.
Three alternative policy scenarios are developed in this report:
1. Promote and Regulate. A scenario based on changing behaviour by means of push
and pull incentives.
2. Plan and Build. A scenario oriented on investments in the technology and transport
infrastructure.
3. Charge and Provide. A scenario focused around the use of economic incentives like
road charging and parking pricing.
The combination of these three scenarios and alternative assumptions on background
conditions (e.g. technological progress, energy shortage, taxation policies, etc.) produces five
policy roadmaps.
These roadmaps do not represent recommended policy interventions; rather, they have been
conceived to show how different policy instruments can be grouped together in consistent
policy packages and to serve as case studies for the policy support tool.
For each roadmap the following elements are provided in this report:
A short description of the initial conditions, i.e. of the hypothetical city where the
roadmap is applied, of the mobility issues it faces and of the objectives the local
authorities would like to achieve;
A graphical description of the temporal sequence of measures and of their impacts on
the city context. In this description a classification of the measures as enabling
Urban Transport Policy Roadmaps 2Study On European Urban Transport Roadmaps 2030
measures (i.e. the main measures of the roadmap) and ancillary measures is also
shown;
A narrative description of the content of the measures applied at different time steps
and of the expected transformation of the city context;
A discussion of relevant implementation issues that should be considered;
A list of key stakeholders that should be involved in the planning and implementation
process.
The format of the report is as follows: Chapter 2 provides an overview of the assumptions of
the background trends. Chapter 3 details the key urban policy measures considered for the
definition of the roadmaps – setting the scene for the following chapters. Chapter 4 describes
the policy scenarios, resulting from the combination of a subset of measures under a given
assumption regarding the background conditions. Chapter 5 sets out how each roadmap is
implemented in a hypothetical urban context, discussing the implementation issues and
identifying the main stakeholders involved. Finally Chapter 6 outlines the impacts of the policy
roadmaps resulting from the use of the web-based tool of the EU Roadmaps to 2030 study.
Chapter 7 draws the conclusions on the analysis of the policy roadmaps and their
implementation.
Urban Transport Policy Roadmaps 3Study On European Urban Transport Roadmaps 2030 2 Background trends In a given city, the urban environment at the horizon of the year 2030 will depend of course on the choices that the city itself will be making concerning the transport system (infrastructure and services), transport regulation and land use planning. Transport policy choices at the local level are a key factor to shape the future of urban mobility and the overall liveability of the city. The roadmaps considered in this report address this key factor. Nevertheless the impacts of policies implemented at the urban level are not the only factors influencing the development of the future conditions. Other aspects play a significant role such as the technological development of the vehicle fleet, the availability of renewable energy or policy choices at the national or European level. These aspects are exogenous to the urban level, i.e. cannot be influenced by the local decisions. A policy assessment exercise should take these aspects into account as the impact of different measures can be affected (i.e. amplified or smoothed) by the underlying exogenous conditions. There is some uncertainty on how exogenous conditions could develop in the future. Taking a point in the future – like the year 2030 – the availability of energy, the uptake of renewable sources and the overall market availability of innovative engines are a matter of forecasts and projections. Producing such forecasts is outside the scope of this study, and it is important to recognise that exogenous conditions may vary and can be taken into account in terms of alternative trends by country. The first trend is the reference trend as defined by recent studies, namely European Energy and Transport Trend to 20501 and GHG-TransPoRD. This trend is rather conservative, for most of the elements considered limited changes are expected in the next 15 years. The second trend is an alternative one which includes different assumptions regarding technological development as well as higher energy prices and also a national policy environment in terms of green taxation, with higher fuel duties and car ownership taxes with respect to the reference trend, where no specific actions are undertaken. The content of the two alternative background trends is described in the two following sections. 2.1 Reference trend The reference trend is defined on the basis of recent studies providing projections on technology and energy indicators. 2.1.1 Vehicle technology With reference to the penetration of innovative vehicles in car fleet (hybrid electric, battery electric, fuel cells) and Light Duty Van (LDV) fleet (battery electric), the trend has been developed on the basis of the Reference scenario of the PRIMES-TREMOVE model, released in 2013 for the European Energy and Transport Trend to 2050. In this scenario it is assumed that by 2030 the share of hybrid vehicles will be 28.5% of the car fleet, while battery electric vehicles will represent about 1% and fuel cells around 0.1% only (Table 2-1). With reference to LDVs, the PRIMES-TREMOVE model forecasts a share of 1.6% of battery electric vehicles (including also plug-in hybrids) in 2030. Starting from this data, it is also assumed for the purpose of the tool that the proportion of battery-electric LDVs is higher among vehicles used for freight distribution from urban logistics platforms2. The assumed share in this case is 3.6% of the fleet. Concerning bus technology, without specific policy measures the penetration of innovative vehicles is assumed to follow an average trend based on data from PRIMES-TREMOVE model 1 European Commission, 2013. EU Energy, Transport And GHG Emissions: Trends To 2050 - Reference Scenario 2013 2 It is assumed for the purpose of the tool that the use of electric and hybrid electric vehicles for urban distribution is higher than in the total LDV fleet. In the recent years the use of (hybrid) electric vehicles has being already tested and implemented in this context in several cities (i.e. see Pelletier et. Al. (2014). Urban Transport Policy Roadmaps 4
Study On European Urban Transport Roadmaps 2030
(0.03% absolute growth for CNG, 0.4% for hybrid electric and 0.03% for battery electric). When
the green fleet policy is activated under the reference scenario it is assumed that innovative
buses are mainly hybrid electric vehicles, with a small share of CNG and battery electric
vehicles. Since the share of innovative buses depends on the activation of a specific policy
and the impact of this policy depends on local conditions, in Table 2-2 we report an example
of the share of innovative buses in the whole fleet in Italy (data are differentiated by country).
The Heavy Goods Vehicle (HGV) fleet is assumed to include diesel vehicles only over the
whole time period.

Table 2-1: Reference trend: cars and LDVs vehicle technology in Italy

                                                                                             Share of the total vehicle fleet
    Vehicle                                         Vehicle technology
                                                                                           2015                2020                 2030
    Cars                                           Hybrid electric                          0.4%                8.9%                28.5%
                                                   Battery electric                          0%                 0.1%                 0.9%
                                                   Fuel cells                                0%                  0%                  0.1%
    LDVs                                           Electric (hybrid and                      0%                 0.1%                 1.6%
                                                   battery)
    LDVs from urban platforms                      Electric (hybrid and                      0%                 1.1%                 3.6%
                                                   battery)
Source: Elaborations on the PRIMES-TREMOVE reference scenario for European Energy and Transport Trend to
2050

Table 2-2: Reference trend: bus vehicle technology in Italy

                                                                          Composition of innovative vehicles
    Vehicle            Vehicle technology
                                                                   2015                        2020                           2030
    Bus                CNG                                         12.0%                       12.2%                         12.5%
                       Hybrid electric                             0.1%                         2.0%                          6.1%
                       Battery electric                            0.0%                         0.2%                          0.4%
                       Diesel                                      87.9%                       85.6%                         81.0%
                       Total                                       100%                        100%                           100%
Source: Elaborations on the PRIMES-TREMOVE rreference scenario for European Energy and Transport Trend to
2050

2.1.2 Fuel economy
The average car fuel consumption trend is estimated in terms of yearly improvement rate (i.e.
fuel consumption reduction) by fuel type on the basis of data from the reference scenario3 of
the ASTRA-EC model (developed for the ASSIST project)4. Considering the driving activity
within an urban context, the improvement rate assumed for gasoline, diesel, CNG and LPG
vehicles is about 1.3-1.5 % per year, while for innovative vehicles an improvement rate of about
0.4 % per year is supposed.
The average fuel consumption of motorbike, LDV, HGV and buses is also improved at rates
proportional to the car trend.

3
 The ASTRA EC model reference scenario is calibrated in line with the EU Energy and Transport trends.
4
 Krail, M., Schade, S., Fermi, F., Fiorello, D., Laparidou, K. (2014): Approach and Results of the Validation of the ASTRA-EC Model, Deliverable
D5.1 of ASSIST (Assessing the social and economic impacts of past and future sustainable transport policy in Europe). Project co-funded by
European Commission 7th RTD Programme. Fraunhofer-ISI, Karlsruhe, Germany.

Urban Transport Policy Roadmaps                                                                                                                    5
Study On European Urban Transport Roadmaps 2030
Table 2-3: Reference trend: car average fuel consumption change
Vehicle Vehicle technology Yearly fuel consumption growth rate
Car Gasoline -1.3%
Diesel -1.5%
CNG -1.3%
LPG -1.3%
Hybrid electric -0.5%
Battery electric -0.4%
Fuel cells -0.4%
Source: ASSIST project (2014)
2.1.3 Polluting emissions factors
The ASSIST reference scenario is also used for the trend of pollutant emissions by transport
mode. This trend is the consequence of vehicle fleet renewal and progressively more restrictive
Euro Emission standards. Table 2-4 reports the reference trend of polluting emission factors
for PM, CO, VOC and NOx with reference to driving activity within an urban context.
Table 2-4: Reference trend: polluting emissions factors
Pollutant Mode Yearly growth rate
PM Car -3.6%
Motorbike -5.1%
Bus -3.4%
LDV -5.7%
HGV -14.3%
CO Car -1.7%
Motorbike -5.9%
Bus -2.1%
LDV -1.6%
HGV -2.5%
NOx Car -6.7%
Motorbike -1.3%
Bus -3.3%
LDV -8.3%
HGV -7.0%
VOC Car -5.5%
Motorbike -3.1%
Bus -1.1%
LDV -1.7%
HGV 0.6%
Source: ASSIST project (2014)
2.1.4 Energy price
The reference assumptions regarding energy supply are expressed in terms of fuel prices.
End-user fuel price is made of two components: resource fuel price and fuel taxation. Fuel
taxation is considered under the assumptions on car taxation (see 2.1.5 below).
Urban Transport Policy Roadmaps 6Study On European Urban Transport Roadmaps 2030
In the ASSIST reference scenario a moderate increase (in real terms) of resource price is
expected. Namely, gasoline and diesel resource price is assumed to grow by 0.4% per year,
CNG prices grow by 1.1% per year and LPG prices grow by 0.6% per year. Electricity prices
are expected to decline by 0.6% per year, while hydrogen price is assumed constant.
Table 2-5: Reference trend: energy price
Vehicle Fuel Yearly growth rate
Pure fuel price trend Gasoline 0.4%
Diesel 0.4%
CNG 1.1%
LPG 0.6%
Electricity -0.6%
Hydrogen 0.0%
Source: ASSIST project (2014)
2.1.5 Car taxation
In the reference trend it is considered that at the national and European level no specific fiscal
instruments are activated to promote sustainable mobility. Nevertheless fuel taxes are
expected to grow in real terms. Gasoline and diesel taxes are assumed to grow by 0.4% per
year, CNG fuel tax is assumed to remain constant, while LPG taxes are assumed to grow by
0.6% per year. Electricity and hydrogen taxes are assumed to decline by 0.6% and respectively
3.1% per year (Table 2-6). Car ownership taxes are assumed to remain stable.
Table 2-6: Reference trend: energy taxation
Vehicle Fuel Yearly growth rate
Fuel tax trend Gasoline 0.4%
Diesel 0.4%
CNG 0.0%
LPG 0.6%
Electricity -0.6%
Hydrogen -3.1%
Source: ASSIST project (2014)
2.1.6 Car ownership
Car ownership influences personal mobility. A recent survey in the 28 EU countries5 has shown
that a significant correlation exists between the motorisation rate and the market share of cars
in daily trips. Urban policies can influence car ownership, which however originates also from
several social and economic factors that are not under the control of urban authorities. This
factor is therefore considered an exogenous trend in the reference scenario. Based on the
European Energy and Transport Trend to 2050 projections, car ownership in the reference
scenario is different country by country as reported in Table 2-7. Growth is stronger in
countries starting from lower values and limited in countries where the motorisation rate is
already high.
5
Fiorello D., Zani L.,(2015): “EU Survey on issues related to transport and mobility – Final Report”. Study on behalf of JRC-IPTS of the European
Commission, Milan.
Urban Transport Policy Roadmaps 7Study On European Urban Transport Roadmaps 2030
Table 2-7: Reference trend: Car ownership
Car ownership at 2015 Yearly change 2015 – 2030
Country
(cars/1000 inhabitants) (cars/1000 inhabitants)
BE - Belgium 490 2.0
BG - Bulgaria 390 5.0
CZ - Czech Republic 475 5.0
DK - Denmark 400 1.0
DE - Germany 540 0.5
EE - Estonia 490 7.0
IE - Ireland 420 1.0
EL - Greece 470 2.0
ES - Spain 480 3.0
FR - France 525 2.0
HR - Croatia 340 6.0
IT - Italy 620 2.0
CY - Cyprus 550 -2.0
LV - Latvia 310 3.0
LT - Lithuania 590 3.0
LU - Luxemburg 660 0.5
HU - Hungary 320 4.0
MT - Malta 580 -2.0
NL - The Netherlands 470 1.0
AT - Austria 550 2.0
PL - Poland 500 4.0
PT - Portugal 430 1.0
RO - Romania 220 5.0
SI - Slovenia 530 6.0
SK - Slovakia 350 8.0
FI - Finland 570 1.0
SE - Sweden 475 2.0
UK - United Kingdom 475 2.0
Source: EUROSTAT, Elaborations on the European Energy and Transport Trend to 2050
2.1.7 Energy mix for electricity generation
Although it is not the case in this reference trend (but it is in the alternative trend, see section
2.2), when a significant share of battery electric cars is assumed to enter the vehicle fleet, the
impact on greenhouse emissions depends on the energy mix for electricity generation. Using
electricity produced from fossils fuels will generate indirect emissions from electric vehicles at
the power stations, whereas using renewable sources means that electric cars are true zero-
emissions vehicles.
The European Energy and Transport Trend to 2050 is used as a reference for the energy mix
for electricity generation and its trend over time in the reference scenario. Data is differentiated
by country as shown in the following tables (Table 2-8 and
Urban Transport Policy Roadmaps 8Study On European Urban Transport Roadmaps 2030 Table 2-9) for the years 2015 and 2030. Table 2-8: Reference trend: Energy mix for electricity generation at 2015 Country Solid fuels Oil Gas Nuclear Renewables BE - Belgium 2.1% 0.5% 39.5% 41.9% 16.0% BG - Bulgaria 44.3% 0.2% 9.8% 30.5% 15.2% CZ - Czech Republic 42.0% 0.0% 5.0% 40.3% 12.7% DK - Denmark 32.9% 0.6% 22.4% 0.0% 44.1% DE - Germany 37.8% 0.2% 17.4% 15.5% 29.1% EE - Estonia 80.7% 0.9% 8.0% 0.0% 10.4% IE - Ireland 37.6% 0.2% 36.3% 0.0% 25.9% EL - Greece 48.4% 9.7% 13.3% 0.0% 28.6% ES - Spain 11.1% 5.1% 27.5% 19.1% 37.2% FR - France 2.6% 0.2% 6.6% 73.0% 17.6% HR - Croatia 9.0% 1.3% 34.7% 0.0% 55.0% IT - Italy 16.9% 1.5% 48.3% 0.0% 33.3% CY - Cyprus 0.0% 90.5% 0.0% 0.0% 9.5% LV - Latvia 0.9% 0.7% 42.6% 0.0% 55.8% LT - Lithuania 0.0% 0.6% 85.3% 0.0% 14.1% LU - Luxemburg 0.0% 0.0% 77.9% 0.0% 22.1% HU - Hungary 18.9% 1.8% 21.9% 48.0% 9.4% MT - Malta 0.0% 99.3% 0.0% 0.0% 0.7% NL - The Netherlands 28.7% 0.8% 50.2% 3.0% 17.3% AT - Austria 9.0% 0.5% 16.9% 0.0% 73.6% PL - Poland 86.1% 0.5% 3.9% 0.0% 9.5% PT - Portugal 14.8% 3.3% 23.5% 0.0% 58.4% RO - Romania 30.1% 3.5% 9.8% 17.7% 38.9% SI - Slovenia 25.2% 0.0% 14.2% 33.3% 27.3% SK - Slovakia 5.4% 0.0% 7.6% 62.0% 25.0% FI - Finland 9.1% 0.1% 11.9% 45.9% 33.0% SE - Sweden 0.5% 0.4% 1.5% 39.3% 58.3% UK - United Kingdom 27.9% 0.4% 40.7% 16.3% 14.7% Source: European Energy and Transport Trend to 2050 Urban Transport Policy Roadmaps 9
Study On European Urban Transport Roadmaps 2030
Table 2-9: Reference trend: Energy mix for electricity generation at 2030
    Country                           Solid fuels                Oil                 Gas                Nuclear           Renewables
    BE - Belgium                           2.5%                 1.3%                53.3%                 0.0%                 42.9%
    BG - Bulgaria                         41.2%                 0.8%                14.7%                26.2%                 17.1%
    CZ - Czech Republic                   22.7%                 0.0%                 7.9%                55.4%                 14.0%
    DK - Denmark                           0.8%                 0.5%                25.6%                 0.0%                 73.1%
    DE - Germany                          22.9%                 0.3%                24.4%                 0.0%                 52.4%
    EE - Estonia                          55.3%                 0.0%                13.5%                 0.0%                 31.2%
    IE - Ireland                           3.0%                 0.2%                30.7%                 0.0%                 66.1%
    EL - Greece                           12.3%                 4.5%                38.7%                 0.0%                 44.5%
    ES - Spain                             9.5%                 0.6%                25.6%                16.1%                 48.2%
    FR - France                            0.0%                 0.1%                 3.8%                58.4%                 37.7%
    HR - Croatia                           3.2%                 1.2%                26.1%                 0.0%                 69.5%
    IT - Italy                            17.1%                 1.4%                33.0%                 0.0%                 48.5%
    CY - Cyprus                            0.0%                 0.4%                68.1%                 0.0%                 31.5%
    LV - Latvia                            0.9%                 0.6%                30.8%                 0.0%                 67.7%
    LT - Lithuania                         0.0%                 0.1%                25.5%                61.2%                 13.2%
    LU - Luxemburg                         0.0%                 0.0%                56.4%                 0.0%                 43.6%
    HU - Hungary                           3.0%                 0.6%                 8.5%                72.4%                 15.5%
    MT - Malta                             0.0%                 1.1%                61.0%                 0.0%                 37.9%
    NL - The Netherlands                  23.5%                 1.1%                35.5%                 3.7%                 36.2%
    AT - Austria                           0.5%                 0.4%                10.1%                 0.0%                 89.0%
    PL - Poland                           53.6%                 0.1%                 7.4%                22.1%                 16.8%
    PT - Portugal                          0.4%                 0.2%                11.0%                 0.0%                 88.4%
    RO - Romania                          17.5%                 2.6%                14.7%                19.0%                 46.2%
    SI - Slovenia                         19.6%                 0.0%                13.9%                31.6%                 34.9%
    SK - Slovakia                          5.4%                 0.1%                 6.2%                64.4%                 23.9%
    FI - Finland                           4.4%                 0.0%                 6.0%                59.2%                 30.4%
    SE - Sweden                            0.7%                 0.1%                 0.9%                40.8%                 57.5%
    UK - United Kingdom                    2.6%                 0.6%                37.2%                 9.3%                 50.3%
Source: European Energy and Transport Trend to 2050

2.2 Alternative trend
The alternative trend incorporates different assumptions regarding the elements of the
reference trend. More specifically the alternative trend provides a more favourable background
for improving the sustainability of urban transport: faster development of vehicle technology,
higher fuel prices due to energy shortage as well as green taxation at the national level.

2.2.1 Vehicle technology
In the alternative trend a faster penetration of innovative vehicles in the passenger car fleet
(hybrid electric, battery electric, fuel cells) and freight LDV fleet (battery electric) is assumed.
The assumptions are based on the technological scenario of the GHG-TransPoRD project6. In

6
  Fiorello D., Schade W., Akkermans L., Krail M., Schade B., Shepherd S. (2012): Results of the technoeconomic analysis of the R&D and
transport policy packages for the time horizons 2020 and 2050. Deliverable D4.1 of GHG-TransPoRD: Project co-funded by European
Commission 7th RTD Programme. TRT Trasporti e Territorio SRL, Milan, Italy.

Urban Transport Policy Roadmaps                                                                                                          10
Study On European Urban Transport Roadmaps 2030
this project, different scenarios were developed to fulfil the major target of the European
Transport White Paper of 2011 of reducing GHG emissions of transport by 60% until 2050.
In this technological trend it is assumed that by 2030 almost half of the car fleet will be made
up of alternatively fuelled vehicles. Namely the share of hybrid vehicles should be about 15%,
battery electric vehicles 25% and fuel cells around 4% (Table 2-10). With reference to freight
LDVs, the assumption implemented is one out of four will be a battery electric vehicles in 2030
(and as far as LDVs used for urban distribution of goods from logistic platforms, even one out
of three vehicles).
Furthermore, under this alternative trend also a larger share of hybrid electric and CNG buses
than in the reference scenario is assumed when the green fleet policy is activated (depending
also on the policy input7, Table 2-11).
Table 2-10: Alternative trend: cars and LDVs vehicle technology in Italy
Share of the total vehicle fleet
Vehicle Vehicle technology
2015 2020 2030
Car Hybrid electric 0.4% 8.7% 15.3%
Battery electric 0% 3.6% 25.1%
fuel cells 0% 0% 4.0%
LDV Electric (hybrid and 0% 4.8% 26.3%
battery)
LDVs from urban platforms Electric (hybrid and 0% 7.8% 33.3%
battery)
Source: Elaborations on the GHG-TransPoRD project - Technological scenario (2012)
Table 2-11: Alternative trend example: bus vehicle technology in Italy with the
application of green fleet policy
Composition of innovative vehicles
Vehicle Vehicle technology
2015 2020 2030
Bus CNG 12.0% 16.3% 18.5%
Hybrid electric 0.1% 3.9% 9.1%
Battery electric 0.0% 0.2% 0.4%
Diesel 87.9% 79.6% 72.0%
Total 100% 100% 100%
Source: Elaborations on the GHG-TransPoRD project - Technological scenario (2012)
2.2.2 Fuel economy
The average car fuel consumption is assumed to improve at double speed than in the reference
scenario. The improvement rate for gasoline, diesel, CNG and LPG vehicles is therefore about
-2.6 / -3.0 % per year, while for innovative vehicles a growth rate of about -0.8 % / -1% per
year is implemented (
Table 2-12).
The average fuel consumption of motorbike, LDV, HGV and buses is also improved at rates
proportional to the car trend.
7
Green fleet policy assuming 3 years investment period from 2019, with the aim of a limited reduction of pollution and fuel consumption
Urban Transport Policy Roadmaps 11Study On European Urban Transport Roadmaps 2030
Table 2-12: Alternative trend: car average fuel economy
Vehicle Vehicle technology Yearly growth rate
Car Gasoline -2.6%
Diesel -3.0%
CNG -2.5%
LPG -2.5%
Hybrid electric -1.1%
Battery electric -0.8%
fuel cells -0.8%
Source: Study on Urban Transport Roadmaps 2030
2.2.3 Air pollutant emissions factors
With reference to air pollutant emissions, the reduction of the emission factor per vkm is
amplified by 50% with respect to the reference scenario of the ASTRA-EC model, under the
assumption of a faster renewal of the vehicle fleet in terms of Euro Emission standards (Table
2-13).
Table 2-13: Alternative trend: polluting emissions factors
Pollutant Mode Yearly growth rate
PM Car -5.3%
Motorbike -7.6%
Bus -5.1%
LDV -8.5%
HGV -21.5%
CO Car -2.6%
Motorbike -8.9%
Bus -3.1%
LDV -2.5%
HGV -3.7%
NOx Car -10.0%
Motorbike -2.0%
Bus -5.0%
LDV -12.5%
HGV -10.5%
VOC Car -8.2%
Motorbike -4.6%
Bus -1.6%
LDV -2.6%
HGV 0.0 %
Source: Study on Urban Transport Roadmaps 2030
2.2.4 Energy price
Resource fuel price is assumed to develop faster than in the reference trend as result of lower
energy supply. The trend has been estimated on the basis of the fossil fuel shortage scenario
of the ASSIST project: by 2030 gasoline and diesel resource prices are expected to grow by
Urban Transport Policy Roadmaps 12Study On European Urban Transport Roadmaps 2030
1.7% and 3% per year respectively, CNG by 2.2%, LPG by 1.1%. Electricity prices are
expected to grow by 2.2% per year, while hydrogen prices by 1.1% per year (Table 2-14).
Table 2-14: Alternative trend: energy price
Vehicle Fuel Yearly growth rate
Pure fuel price Gasoline 1.7%
trend Diesel 3.0%
CNG 2.2%
LPG 1.1%
Electricity 2.2%
Hydrogen 1.1%
Source: ASSIST project (2014)
2.2.5 Car taxation
In the alternative trend the implementation of green taxation, namely fuel and car ownership
taxes, are higher than in the reference trend. Fuel taxes are supposed to grow in all countries
at the growth rate needed to raise the current average EU level to current highest level (Table
2-15). Car ownership taxes are supposed to be progressively increased even if at the limited
pace of 2% per year.
Table 2-15: Alternative trend: fuel taxation
Vehicle Fuel Yearly growth rate
Fuel tax trend Gasoline 1.8%
Diesel 2.7%
CNG 6.6%
LPG 3.2%
Electricity 0.0%
Hydrogen 0.0%
Source: Study on Urban Transport Roadmaps 2030
2.2.6 Car ownership
Because of higher energy costs and also of green taxation (see below) a slower development
of car ownership is expected in comparison to the reference scenario. The impact on car
ownership simulated at EU level in the HOP! Project (Macro-economic impact of High Oil
Prices) (2008) has been used as a reference to estimate the alternative trend. Again, the value
of motorisation rate at the year 2030 is different country by country (
Table 2-16).
Urban Transport Policy Roadmaps 13Study On European Urban Transport Roadmaps 2030
Table 2-16: Alternative trend: Car ownership
Yearly change 2015 – 2030
Country
(cars/1000 inhabitants)
BE - Belgium 1.6
BG - Bulgaria 4.0
CZ - Czech Republic 4.0
DK - Denmark 0.8
DE - Germany 0.4
EE - Estonia 5.6
IE - Ireland 0.8
EL - Greece 1.6
ES - Spain 2.4
FR - France 1.6
HR - Croatia 4.8
IT - Italy 1.6
CY - Cyprus -2.4
LV - Latvia 2.4
LT - Lithuania 2.4
LU - Luxemburg 0.4
HU - Hungary 3.2
MT - Malta -2.4
NL - The Netherlands 0.8
AT - Austria 1.6
PL - Poland 3.2
PT - Portugal 0.8
RO - Romania 4.0
SI - Slovenia 4.8
SK - Slovakia 6.4
FI - Finland 0.8
SE - Sweden 1.6
UK - United Kingdom 1.6
Source: Elaborations on the HOP! Project (Macro-economic impact of High Oil Prices) (2008)
2.2.7 Trip rates
In this alternative scenario it is assumed that higher energy prices lead to reductions in
personal mobility. This assumption is translated into a slight reduction of trip rates, i.e. the
assumed average number of trips made per individual. The assumed reduction is 0.3% per
year for working trips and respectively 0.6% for personal trips.
2.2.8 Energy mix for electricity generation
Another assumption is that in the alternative trend the uptake of renewable energy sources is
faster than in the reference trend. Namely, the share of renewable resources for electricity
production is assumed to be higher than in the reference trend. Following the assumptions
made in GHG-TransPoRD, an average share of 60% for renewable sources is expected in the
Urban Transport Policy Roadmaps 14Study On European Urban Transport Roadmaps 2030
year 2030 at the EU level. In each country (Table 2-17) the share can be higher or lower than
this average depending on the current level as well as on the development expected in the
reference trend.
Table 2-17: Alternative trend: share of renewable sources in the energy mix for
electricity generation at 2030
Renewables in the reference Renewables in the alternative
Country
trend trend
BE - Belgium 42.9% 57.9%
BG - Bulgaria 17.1% 23.1%
CZ - Czech Republic 14.0% 18.9%
DK - Denmark 73.1% 98.0%
DE - Germany 52.4% 70.7%
EE - Estonia 31.2% 42.1%
IE - Ireland 66.1% 89.1%
EL - Greece 44.5% 60.0%
ES - Spain 48.2% 65.0%
FR - France 37.7% 50.8%
HR - Croatia 69.5% 93.7%
IT - Italy 48.5% 65.4%
CY - Cyprus 31.5% 42.5%
LV - Latvia 67.7% 91.3%
LT - Lithuania 13.2% 17.8%
LU - Luxemburg 43.6% 58.8%
HU - Hungary 15.5% 20.9%
MT - Malta 37.9% 51.1%
NL - The Netherlands 36.2% 48.8%
AT - Austria 89.0% 98.0%
PL - Poland 16.8% 22.7%
PT - Portugal 88.4% 98.0%
RO - Romania 46.2% 62.3%
SI - Slovenia 34.9% 47.1%
SK - Slovakia 23.9% 32.2%
FI - Finland 30.4% 41.0%
SE - Sweden 57.5% 77.5%
UK - United Kingdom 50.3% 67.8%
Source: Study on Urban Transport Roadmaps 2030
Urban Transport Policy Roadmaps 15Study On European Urban Transport Roadmaps 2030
3 Urban policy measures
The scenarios defined to improve the sustainability of urban transport consist of the
implementation of various policy measures. Policy measures are the elementary components
that are used for defining the roadmaps that will be described later. In this section the key
urban policies that are considered for the definition of the roadmaps are introduced.
3.1 Key urban policy measure
A wide range of policy measures exist that are potentially useful for setting up urban strategies
aimed at addressing transport sustainability. Sources such as the ELTIS, CIVITAS and
EPOMM websites provide a wide range of examples of individual actions to promote
sustainable mobility. These existing catalogues of solutions and best practice formed the basis
for developing a prioritised set of policy measures. A long list of policy measures was identified
from these sources by clustering the actions (often very focused and context specific) into
broader measures. From this long list of measures a set of key policy measures was identified
based on criteria including:
Policy type (i.e. demand management; green fleets; infrastructure investment; pricing
and financial incentives; and traffic management/control);
Institutional level of implementation (i.e. by national or local authorities);
Effectiveness on key impact areas, cost distribution, and transport modes covered.
The set of 19 short-listed policy measures are detailed below in Table 3-1.
Table 3-1: Key policy measures
Policy Type Measure
Demand Management Sustainable travel information and promotion
Bike Sharing Scheme
Car sharing (Car Clubs)
Delivery and Servicing Plans
Land-use planning - density and transport infrastructure
Green Fleets Green energy refuelling infrastructures
Green public fleets
Infrastructure Bus, trolley and tram network and facilities
Investments Walking and cycling networks and facilities
Park and ride
Metro network and facilities
Urban Delivery Centres and city logistics facilities
Pricing and financial Congestion and pollution charging
incentives Parking pricing
Public Transport integrated ticketing and tariff schemes
Traffic management and Legal and regulatory framework of urban freight transport
control Prioritising Public Transport
Access regulation and road and parking space reallocation
Traffic calming measures
Urban Transport Policy Roadmaps 16Study On European Urban Transport Roadmaps 2030 3.2 Classification of policies The first classification criterion was the policy type as shown in Table 3-1. In the definition of these groups, an element of pragmatism was required, reflecting that there would always be some level of overlap between the measures and the different groups. A second classification criterion was the type of impact expected. Four major categories of impact were defined and for each measure the level of impact was assessed. This assessment was made according to literature and also using the results of tests made with the policy support tool. The purpose of this classification was to identify the most promising measures depending on the specific objective of the policy intervention i.e. to reduce accidents or reduce emissions. Table 3-2 summarises the classification of the key measures according to the level of expected impact of each policy measure. A different way to classify policy measures is to consider the transport modes that are affected by the measures directly or indirectly. A direct effect occurs when a transport mode is the object of the measure. For instance, a bike sharing scheme is directly aimed at promoting cycling and parking pricing measures address car use. Since transport modes are in competition, indirect effects occur as well. For instance, when walking and cycling facilities make pedestrian and cycling trips safer and more comfortable then there can be an adverse impact on public transport demand. Also positive indirect impacts can be assumed. For instance, bike sharing can be an alternative to public transport but can also be complementary to public transport. Based on literature and on the outcome of tests made with the policy support tool the classification of the key measures according to their influence on transport modes is provided in Table 3-3. A further element of categorisation concerns implementation costs in terms of size and distribution between different groups. This type of classification addresses efficiency and distributional aspects associated with the various measures. In the definition of scenarios for promoting sustainable mobility, these two aspects are very relevant as resources are finite and any intervention can be more or less politically sensitive depending on the burden of costs for various groups. According to data drawn from the literature, a classification of measures according to costs was defined as shown in Urban Transport Policy Roadmaps 17
Study On European Urban Transport Roadmaps 2030
Table 3-4.

Urban Transport Policy Roadmaps                                               18
Study On European Urban Transport Roadmaps 2030

Table 3-2: Key policy measures classified according to impact by policy outcome
                                                                                               Impact by policy outcome
  Policy                                                                                                    Accessibility
                                                         Measure             GHG /AQ
   type                                                                                       Congestion        /Social        Safety
                                                                            emissions
                                                                                                              inclusion
                                                  Sustainable travel       Medium             Low/Medium    Low
                                                  information and
                                                  promotion
         Demand management

                                                  Bike sharing scheme      Low                Low/Medium    Low
                                                  Car sharing (Car         Low                Low           Low/Medium
                                                  Clubs)                   (Air Quality
                                                                           could be
                                                                           medium if
                                                                           LEVs used)
                                                  Delivery and servicing   Medium             Low                           Low
                                                  plans
                                                  Land use planning -      Medium             Low/Medium    High/Medium     Low/ Medium
                                                  density and transport
                                                  infrastructure
                                                  Green energy             Medium/
                                                  refuelling               high(b)
    Green
    fleets

                                                  infrastructures
                                                  Green Public fleets      Low/Medium                                       Low

                                                  Bus, trolley and tram    Medium             Medium        Medium          Low
         Infrastructure investment

                                                  network and facilities
                                                  Walking and cycling      Low                Low/Medium    Medium/High     Low
                                                  network and facilities   (links with PT
                                                                           too)
                                                  Park and ride            Low                Low/Medium    Low/Medium      Low

                                                  Metro network and        Medium             Medium/High   Medium          Medium
                                                  facilities
                                                  Urban Delivery           Low / Medium       Low/Medium                    Low
                                                  Centres and city
                                                  logistics facilities
                                                  Congestion and           Medium             Medium        Low(d)          Low
                                                  pollution charging
  Pricing and

                                     incentives
   financial

                                                  Parking pricing          Medium             Medium        Low(d)

                                                  Public Transport         Low                Low           Low/Medium
                                                  integrated ticketing
                                                  and tariff schemes
                                                  Legal and regulatory     Low                Low/Medium    Low(d)          Low
    Traffic management

                                                  framework of urban
                                                  freight transport
        and control

                                                  Prioritising public      Low/medium         Low                           Low
                                                  transport
                                                  Access regulations       Low                Low/Medium    Low/Medium      Low
                                                  and road and parking
                                                  space reallocation
                                                  Traffic calming          Low                Low                           Low/medium
                                                  measures
    (a)                              Air Quality could be medium if electric vehicles are used
    (b)                              Depends on fuel and use in vehicles
    (c)                              For air quality only
    (d)                              Potentially adverse effect

Urban Transport Policy Roadmaps                                                                                                         19
Study On European Urban Transport Roadmaps 2030
Table 3-3: Key policy measures classified according to impact by mode
Impact by mode
Policy
Measure Public Walking/
type Car Freight
Transport Cycling
Sustainable travel information
and promotion
management
Bike sharing scheme
Demand
Car sharing (Car Clubs)
Delivery and servicing plans
Land use planning - density
and transport infrastructure
Green energy refuelling
Green
fleets
infrastructures
Green Public fleets
Bus, trolley and tram network
and facilities
Infrastructure
Walking and cycling network
investment
and facilities
Park and ride
Metro network and facilities
Urban Delivery Centres and
city logistics facilities
Congestion and pollution
Pricing and
incentives
charging
financial
Parking pricing
Public Transport integrated
ticketing and tariff schemes
Legal and regulatory
management and
framework of urban freight
transport
control
Traffic
Prioritising public transport
Access regulations and road
and parking space reallocation
Traffic calming measures
Urban Transport Policy Roadmaps 20Study On European Urban Transport Roadmaps 2030
Table 3-4: Key policy measures classified according to implementation costs
Policy Distribution of implementation costs
Measure
type Citizens Businesses City Government
Sustainable travel Low
Demand management
information and promotion
Bike sharing scheme Low Low Low
Car sharing (Car Clubs) Low(b) Low(a)
Delivery and servicing Low(b) Low
plans
Land use planning - Low (b) Low Low/
density and transport Medium
infrastructure
Green energy refuelling Medium Medium
Green
fleets
infrastructures
Green Public fleets Medium/ Medium
High
Bus, trolley and tram Medium Medium/ Medium
network and facilities High
Walking and cycling Low/ Low/
Infrastructure
investment
network and facilities Medium Medium
Park and ride Low Medium Medium/
High
Metro network and High High (very)
facilities
Urban Delivery Centres Low Medium
and city logistics facilities
Congestion and pollution Medium/ Medium Medium(c)
charging High
Pricing and
incentives
financial
Parking pricing Medium/ Medium Low
high
Public Transport Medium/
integrated ticketing and high(d)
tariff schemes
Legal and regulatory Medium
Traffic management
framework of urban freight
transport
and control
Prioritising public Medium/
transport high
Access regulations and Low/
road and parking space medium
reallocation
Traffic calming measures Low
(a) Costs depend on the scheme chosen
(b) In principle cost savings could be achieved
(c) Revenues are in principle larger than costs at least in medium-longer term
(d) Costs are significant if this measure include the implementation of an integrated ticketing system
Urban Transport Policy Roadmaps 21Study On European Urban Transport Roadmaps 2030
4 Policy scenarios
Bearing in mind the goals of the 2011 Transport White Paper and in particular the target of
halving the use of conventionally fuelled cars in cities by 2030, which is the time horizon of
this study, a policy initiative at the urban level is needed. The policy measures presented in
the previous section together make up the toolbox that can be used to implement this initiative.
As shown with the different classifications provided, measures differ in scope, effectiveness,
implementation costs and distribution. A policy initiative is expected to select some of the
potential measures and to combine them in order to define a realistic policy scenario.
In this section we introduce five alternative policy scenarios. Each scenario results from the
combination of a subset of measures under a given assumption regarding the background
conditions (see section 2). Namely, three alternative policy approaches are defined and two of
these are considered under two different exogenous trends.
The three alternative policy approaches are defined as follows:
1. Promote and Regulate, based on changing behaviour by information and promotion.
2. Plan and Build, focused on investments in the technology and infrastructure.
3. Charge and Provide, considering the use of economic incentives like road charging
and parking pricing.
Each policy approach includes a subset of enabling measures, i.e. a group of main
interventions and also some ancillary measures to support the application and the impact of
the enabling measures.
One aspect of the “Plan and Build” approach is the promotion of innovative vehicle
technologies. At the urban level the policy effort directed at this is focused on providing re-
charging infrastructures for electric vehicles or funds to renew the bus fleet with low or zero-
emissions vehicles. However, interventions to promote “greener” vehicles are effective as far
as such vehicles are actually available in the market and are competitive. This condition is not
under city authorities’ control. Therefore, the effectiveness of the “Plan and Build” strategy is
significantly dependent on exogenous conditions. In order to take this aspect into account, this
approach is analysed (see section 5 below) with two different background trends. In one
scenario the reference exogenous conditions are assumed. In the other scenario the
alternative trend (see section 2 for details) is assumed as far as technological development
and energy supply are concerned.
The “Charge and Provide” approach is related to the use of economic incentives like road
charging and parking pricing. It is fair to assume that this strategy can be more effective if also
other economic instruments are activated like vehicle taxation and fuel duties. These other
instruments are decided at a national or even super-national level and therefore represent
again an exogenous condition. Thus, also this strategy is analysed in two scenarios: one
assuming the reference trend and the other assuming the alternative trend where green
taxation is activated at a broad level.
Urban Transport Policy Roadmaps 22Study On European Urban Transport Roadmaps 2030 Table 4-1 summarises the content of each policy approach. One aspect of the “Plan and Build” approach is the promotion of innovative vehicle technologies. At the urban level the policy effort directed at this is focused on providing re- charging infrastructures for electric vehicles or funds to renew the bus fleet with low or zero- emissions vehicles. However, interventions to promote “greener” vehicles are effective as far as such vehicles are actually available in the market and are competitive. This condition is not under city authorities’ control. Therefore, the effectiveness of the “Plan and Build” strategy is significantly dependent on exogenous conditions. In order to take this aspect into account, this approach is analysed (see section 5 below) with two different background trends. In one scenario the reference exogenous conditions are assumed. In the other scenario the alternative trend (see section 2 for details) is assumed as far as technological development and energy supply are concerned. The “Charge and Provide” approach is related to the use of economic incentives like road charging and parking pricing. It is fair to assume that this strategy can be more effective if also other economic instruments are activated like vehicle taxation and fuel duties. These other instruments are decided at a national or even super-national level and therefore represent again an exogenous condition. Thus, also this strategy is analysed in two scenarios: one assuming the reference trend and the other assuming the alternative trend where green taxation is activated at a broad level. Urban Transport Policy Roadmaps 23
Study On European Urban Transport Roadmaps 2030
Table 4-1: Composition of the three policy strategies

   Policy                                                           Promote and                          Charge and
                                                  Measure                           Plan and Build
    type                                                              Regulate                            Provide

                                           Sustainable travel
                                           information and
          Demand management

                                           promotion
                                           Bike sharing scheme
                                           Car sharing (Car
                                           Clubs)
                                           Delivery and servicing
                                           plans
                                           Land use planning -
                                           density and transport
                                           infrastructure
                                           Green energy
                                           refuelling
     Green
     fleets

                                           infrastructures
                                           Green Public fleets

                                           Bus, trolley and tram
                                           network and facilities
                                           Walking and cycling
     Infrastructure

                                           network and facilities
       investment

                                           Park and ride

                                           Metro network and
                                           facilities
                                           Urban Delivery
                                           Centres and city
                                           logistics facilities
                                           Congestion and
                                           pollution charging
   Pricing and

                              incentives
    financial

                                           Parking pricing

                                           Public Transport
                                           integrated ticketing
                                           and tariff schemes
                                           Legal and regulatory
     Traffic management

                                           framework of urban
                                           freight transport
         and control

                                           Prioritising public
                                           transport
                                           Access regulations
                                           and road and parking
                                           space reallocation
                                           Traffic calming
                                           measures
                                           Enabling measure
                                           Ancillary measure

The combination of the three policy approaches, which are described in the paragraphs below,
and of the assumptions on the background conditions produces the five policy scenarios
summarised in Table 4-2.

Urban Transport Policy Roadmaps                                                                                       24
Study On European Urban Transport Roadmaps 2030
Table 4-2: Summary of the policy scenarios
Policy scenario Urban Strategy Background Conditions
1 Promote and Regulate Reference
2 Plan and Build - reference Reference
3 Plan and Build - alternative Alternative
4 Charge and Provide - reference Reference
5 Charge and Provide - alternative Alternative
4.1 Promote and regulate
The “Promote and Regulate” approach is especially focused on the behavioural side. It is
centred on policy measures targeted at inducing a more sustainable mobility behaviour of
citizens. Sustainable modes are promoted by dedicated campaigns including personalised
marketing actions. Also, the use of shared vehicles (cars and bikes) is supported and
integrated ticketing is implemented to promote the use of public transport. At the same time,
car mobility is regulated; traffic restrictions are introduced, traffic calming measures are applied
in the urban area and parking is regulated and charged. Delivery and servicing plans are
promoted to improve the sustainability of urban freight transport.
Considering the classifications of measures introduced in Section 3, this strategy involves all
transport modes and its effects are supposed to be especially concentrated on reducing
congestion and improving safety, also with positive impacts on air quality.
It is a relatively low cost strategy for the municipality also with limited costs for citizens and
business and basically no financial support required from government.
The “Promote and Regulate” approach is aimed at the short to medium term. Some of its
measures are relatively fast to implement, others need some more time and resources but
basically there are no long term programmes.
4.2 Plan and Build
The “Plan and Build” approach is oriented on the technology and infrastructure side. This
approach aims to change the urban environment and its existing transport facilities. It can be
considered a long term strategy. Land use planning plays a key role in this perspective. The
development of new settlements is framed within a sustainable perspective and liveability and
affordability of the existing urban area are promoted in order to stop and reverse urban sprawl.
At the same time new public facilities are built to increase transport supply and improve its
reliability. Investments also include new structures to rationalise urban freight transport as well
as infrastructures and transport means to support the breakthrough of low-carbon vehicles.
The focus of this strategy is especially on public transport, with less emphasis on other
transport alternatives. More than for other approaches effects are expected in terms of
improved accessibility although emissions savings and reduced congestion are also major
targets.
Given the role of infrastructure this approach is an expensive one. The financial effort of the
urban authority is substantial and at the same time also large contributions from governmental
funds are needed.
The “Plan and Build” strategy is ambitious and long term as many of its measures need time
to be implemented and provide results.
4.3 Charge and Provide
The “Charge and Provide” approach is a sort of mix between the two first approaches. It
includes regulations and behavioural incentives as well as the provision of infrastructures and
services. Economic instruments play a key role in this approach. Their role is twofold. On the
Urban Transport Policy Roadmaps 25You can also read