Biological invasions in Singapore and Southeast Asia: data gaps fail to mask potentially massive economic costs
←
→
Page content transcription
If your browser does not render page correctly, please read the page content below
A peer-reviewed open-access journal
NeoBiota 67: 131–152 (2021)
doi: 10.3897/neobiota.67.64560                            RESEARCH ARTICLE
                                                                                                                              NeoBiota
https://neobiota.pensoft.net                                                                           Advancing research on alien species and biological invasions

  Biological invasions in Singapore and Southeast Asia:
data gaps fail to mask potentially massive economic costs

                 Phillip J. Haubrock1,2*, Ross N. Cuthbert3,4*, Darren C.J. Yeo5,6,
                          Achyut Kumar Banerjee7, Chunlong Liu8,9,10,11,
                            Christophe Diagne11, Franck Courchamp11

1 Senckenberg Research Institute and Natural History Museum Frankfurt, Department of River Ecology and
Conservation, 63571 Gelnhausen, Germany 2 University of South Bohemia in České Budějovice, Faculty
of Fisheries and Protection of Waters, South Bohemian Research Center of Aquaculture and Biodiversity of
Hydrocenoses, Zátiší 728/II, 389 25, Vodňany, Czech Republic 3 GEOMAR Helmholtz-Zentrum für Ozean-
forschung Kiel, 24105, Kiel, Germany 4 School of Biological Sciences, Queen’s University Belfast, 19 Chlorine
Gardens, Belfast, BT9 5DL, Northern Ireland, UK 5 Department of Biological Sciences, National Univer-
sity of Singapore, 16 Science Drive 4, Singapore 117558, Republic of Singapore 6 Lee Kong Chian Natural
History Museum, National University of Singapore, 2 Conservatory Drive, Singapore 117377, Republic of
Singapore 7 School of Life Sciences, Sun Yat-sen University, 510275, Guangzhou, China 8 Leibniz Institute
of Freshwater Ecology and Inland Fisheries (IGB), Berlin, Germany 9 Institute of Biology, Freie Universität
Berlin, Germany 10 Berlin-Brandenburg Institute of Advanced Biodiversity Research (BBIB), Berlin, Germany
11 Université Paris-Saclay, CNRS, AgroParisTech, Ecologie Systématique Evolution, 91405, Orsay, France

Corresponding authors: Phillip J. Haubrock (phillip.haubrock@senckenberg.de);
                             Darren C.J. Yeo (darrenyeo@nus.edu.sg)

Academic editor: Franz Essl | Received 17 February 2021 | Accepted 25 March 2021 | Published 29 July 2021

Citation: Haubrock PJ, Cuthbert RN, Yeo DCJ, Banerjee AK, Liu C, Diagne C, Courchamp F (2021) Biological
invasions in Singapore and Southeast Asia: data gaps fail to mask potentially massive economic costs. In: Zenni RD,
McDermott S, García-Berthou E, Essl F (Eds) The economic costs of biological invasions around the world. NeoBiota
67: 131–152. https://doi.org/10.3897/neobiota.67.64560

Abstract
The impacts of invasive alien species are well-known and are categorised as a leading contributor to bio-
diversity loss globally. However, relatively little is known about the monetary costs incurred from inva-
sions on national economies, hampering management responses. In this study, we used published data
to describe the economic cost of invasions in Southeast Asia, with a focus on Singapore – a biodiversity-
rich, tropical island city state with small size, high human density and high trade volume, three factors
likely to increase invasions. In this country, as well as in others in Southeast Asia, cost data were scarce,

* These two authors contributed equally

Copyright Phillip J. Haubrock et al. This is an open access article distributed under the terms of the Creative Commons Attribution License (CC
BY 4.0), which permits unrestricted use, distribution, and reproduction in any medium, provided the original author and source are credited.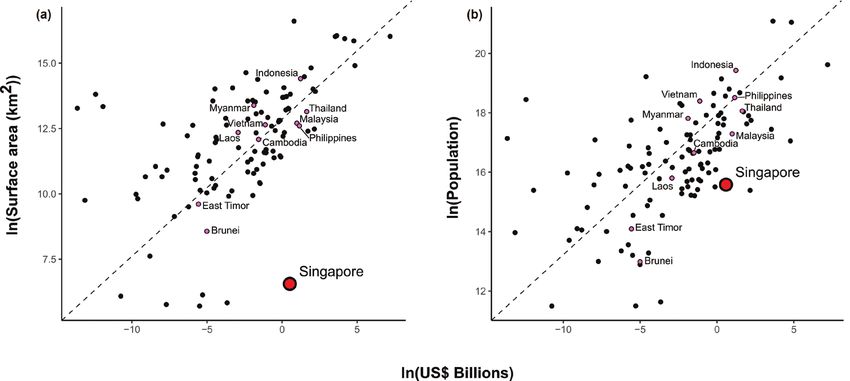
132                    Phillip J. Haubrock et al. / NeoBiota 67: 131–152 (2021)

with recorded costs available for only a small fraction of the species known to be invasive. Yet, the overall
available economic costs to Singapore were estimated to be ~ US$ 1.72 billion in total since 1975 (after
accounting for inflation), which is approximately one tenth of the total cost recorded in all of Southeast
Asia (US$ 16.9 billion). These costs, in Singapore and Southeast Asia, were mostly linked to insects in
the family Culicidae (principally Aedes spp.) and associated with damage, resource loss, healthcare and
control-related spending. Projections for 11 additional species known to be invasive in Singapore, but
with recorded costs only from abroad, amounted to an additional US$ 893.13 million, showing the po-
tential huge gap between recorded and actual costs (cost records remain missing for over 90% of invasive
species). No costs within the database for Singapore – or for other Southeast Asian countries – were ex-
clusively associated with proactive management, highlighting that a shortage of reporting on the costs of
invasions is mirrored by a lack of investment in management. Moreover, invasion cost entries in Singapore
were under-reported relative to import levels, but total costs exceeded expectations, based on land area and
population size, and to a greater extent than in other Southeast Asian countries. Therefore, the evaluation
and reporting of economic costs of invasions need to be improved in this region to provide efficient data-
based support for mitigation and management of their impacts.

Abstract (Chinese)
外来物种入侵新加坡和东南亚:数据缺乏不能掩盖潜在巨大的经济损失 众所周知,外来物
种入侵的影响是导致全球生物多样性降低的一个重要因素。然而,对于外来物种入侵造成国
家经济损失知之甚少,从而阻碍了有效的管理响应。在这项研究中,我们使用已发表的数据
揭示外来物种入侵东南亚造成的经济损失,重点关注新加坡:一个生物多样性丰富的热带岛
屿城市国家,面积小、人口密度高、进出口贸易量大,这三个因素可能会增加入侵。新加坡
和东南亚的其他国家一样缺乏外来物种入侵造成经济损失的数据,只有一小部分已知的入
侵物种造成经济损失的记录。然而,自1975年以来,外来物种入侵在新加坡造成经济损失估
计约为17.2亿美元(考虑到通货膨胀),约占整个东南亚经济损失(169亿美元)的十分之
一。外来物种入侵在新加坡和东南亚的造成的经济损失主要与蚊科(Culicidae)昆虫(主
要是伊蚊)有关,与其造成的直接伤害、资源损失、医疗保障和防治的开支有关。根据在其
他国家造成损失的经验,估算另外11种在新加坡入侵物种造成了8.9313亿美元的经济损失,
这一结果表明记录和实际损失之间的巨大差距(超过90%的入侵物种的缺乏造成经济损失的
记录)。在新加坡或其他东南亚国家的数据库中,没有外来入侵物种造成经济损失的记录,
因此缺乏前瞻性的管理措施。这突出表明,对于入侵物种造成经济损失报告的短缺与相关管
理投资的缺乏是一致的。此外,相对于进口水平,新加坡的入侵物种造成的经济损失是被低
估的,根据土地面积和人口规模,总的经济损失超过了预期,远远高于其他东南亚国家。因
此,在这个地区需要加强对入侵物种造成经济损失的评估和报告,从而为减轻和管理其影响
提供有效的数据支持。

Abstract (Malay)
Penaklukan spesis di Singapura dan Asia Tenggara: jurang data gagal untuk menutup
kos ekonomi yang berpotensi besar). Kesan buruk spesies asing invasif diketahui ramai dan
dikategorikan sebagai penyumbang utama kehilangan biodiversiti di peringkat global. Walau
bagaimanapun, tindak balas pengurusan terhalang kerana kekurangan maklumat tentang penila-
ian kewangan yang timbul daripada penaklukan spesis asing invasif terhadap ekonomi negara.
Dalam kajian ini, kami menggunakan data yang telah diterbitkan untuk menggambarkan kos
ekonomi penaklukan spesis di Asia Tenggara, dengan fokus pada Singapura – sebuah negara
pulau tropika yang kaya dengan biodiversiti, mempunyai saiz kecil, kepadatan manusia yang
tinggi dan jumlah perdagangan yang tinggi, tiga faktor yang berkemungkinan meningkatkan
penaklukan spesis. Di negara ini, dan juga di negara-negara lain di Asia Tenggara, data kos masih
Invasive species in Southeast Asia                                      133

kekurangan, dengan kos yang sedia ada cuma untuk sebilangan kecil spesies yang diketahui in-
vasif. Namun, keseluruhan kos ekonomi yang tersedia untuk Singapura dianggarkan ~ US$ 1.72
bilion secara keseluruhan sejak tahun 1975 (setelah memperhitungkan inflasi), yang merupakan
kira-kira sepersepuluh daripada jumlah kos yang dilaporkan di seluruh Asia Tenggara (US$ 16.9
bilion). Kos ini, di Singapura dan Asia Tenggara, kebanyakannya berkaitan dengan serangga
dalam keluarga Culicidae (terutamanya, Aedes spp.) dan berkaitan dengan kerosakan, kehilangan
sumber daya, penjagaan kesihatan dan perbelanjaan yang berkaitan dengan kawalan. Jangkaan
untuk 11 spesies tambahan yang diketahui invasif di Singapura, tetapi hanya dengan mengguna-
kan kos yang dilaporkan dari luar negara, berjumlah US$ 893.13 juta tambahan, menunjukkan
potensi adanya jurang besar antara kos yang direkodkan dan yang sebenar (laporan kos masih tia-
da untuk lebih daripada 90% invasif spesies). Kos dalam pangkalan data untuk Singapura – atau
untuk negara-negara Asia Tenggara lain – tidak dikaitkan secara eksklusif dengan pengurusan
proaktif. Ini menunjukkan bahawa kekurangan laporan tentang kos penaklukan spesis dicermin-
kan oleh kekurang pelaburan untuk pengurusan. Lebih-lebih lagi, kemasukan kos penaklukan
spesis di Singapura kurang dilaporkan berkaitan dengan tahap import, tetapi jumlah kos mel-
ebihi jangkaan, berdasarkan keluasan tanah dan saiz penduduk, dan di tahap yang lebih tinggi
daripada negara-negara Asia Tenggara yang lain. Oleh itu, penilaian dan pelaporan kos ekonomi
penaklukan spesis perlu ditingkatkan di rantau ini untuk memberikan sokongan berasaskan data
yang efisien untuk mengurangkan dan menguruskan kesan buruk akibat spesis asing invasif.

Abstract (French)
Invasions biologiques à Singapour et en Asie du Sud-Est: les lacunes dans les données ne masquent
pas des coûts économiques potentiellement énormes. Les impacts des espèces exotiques envahissantes
(EEE) sont bien connus et sont classés comme l’un des principaux contributeurs à la perte de biodiversité à
l’échelle mondiale. Cependant, on en sait relativement peu sur les coûts monétaires induits par les invasions
sur les économies nationales, qui entravent les décisions de gestion. Dans cette étude, nous avons utilisé des
données publiées pour décrire le coût économique des invasions en Asie du Sud-Est, en mettant l’accent sur
Singapour - une ville-état insulaire tropicale riche en biodiversité de petite taille, avec une densité humaine
et un volume commercial élevés; trois facteurs susceptibles d’augmenter les invasions. Dans ce pays, ainsi
que dans d’autres en Asie du Sud-Est, les données sur les coûts étaient rares, les coûts enregistrés n’étant
disponibles que pour une petite fraction des espèces réputées envahissantes. Pourtant, les coûts économiques
globaux disponibles pour Singapour ont été estimés à au moins ~ 1,72 milliard de dollars américains, soit
environ un dixième du coût total enregistré dans toute l’Asie du Sud-Est (16,9 milliards de dollars améric-
ains). Ces coûts, à Singapour et en Asie du Sud-Est, étaient principalement liés aux insectes de la famille
des Culicidae (principalement Aedes spp.) et associés aux dommages, à la perte de ressources, aux soins de
santé et aux dépenses liées au contrôle. Les projections pour 11 espèces supplémentaires connues pour être
envahissantes à Singapour, mais avec des coûts enregistrés uniquement en provenance de l’étranger, se sont
élevées à 893,13 millions USD supplémentaires, montrant l’énorme écart potentiel entre les coûts enregis-
trés et réels (les enregistrements de coûts restent manquants pour plus de 90% des espèces envahissantes).
Aucun coût dans la base de données pour Singapour - ou pour d’autres pays d’Asie du Sud-Est - n’était
exclusivement associé à une gestion proactive, ce qui souligne qu’un manque de rapports sur les coûts des
invasions se traduit par un manque d’investissement dans la gestion. De plus, les entrées de coûts d’invasion
à Singapour ont été sous-déclarées par rapport aux niveaux d’importation, mais les coûts totaux ont dépassé
les attentes fondées sur la superficie des terres et la taille de la population, et dans une plus grande mesure que
dans d’autres pays d’Asie du Sud-Est. Par conséquent, l’évaluation et la communication des coûts économ-
iques des invasions doivent être améliorées dans cette région pour fournir un soutien efficace basé sur des
données pour l’atténuation et la gestion de leurs impacts.
134                    Phillip J. Haubrock et al. / NeoBiota 67: 131–152 (2021)

Abstract (Spanish)
Invasiones biológicas en Singapur y el sudeste asiático: la falta de datos no logra enmascarar cos-
tos económicos potencialmente masivos. Los impactos de las especies invasoras son bien conocidos y
se caracterizan por ser uno de los principales contribuyentes para la pérdida de la biodiversidad a nivel
global. No obstante, se conoce relativamente poco sobre el impacto monetario que las invasiones provocan
en las economías de las naciones, lo cual obstaculiza las respuestas de manejo. En el presente estudio, se
emplearon datos publicados para describir los costes económicos de las especies invasoras en el sudeste
asiático, con un enfoque en Singapur –una pequeña ciudad isleña tropical con alta riqueza biológica,
alta densidad poblacional y un alto volumen del mercado; tres factores que se asocian con el incremento
de invasiones biológicas–. En este país, como en otros del sudeste de Asia, los datos sobre los costes son
escasos, donde los registros de costes disponibles representaron solo una fracción de las especies que se
conocen como invasoras. No obstante, los datos sobre los costes económicos disponibles en general se
estimaron al menos en ~ US $1.72 mil millones en Singapur, lo cual corresponde aproximadamente a
una onceava parte de los costes reportados en todo el sudeste de Asia (US $16.9 mil millones). Los costes
identificados en Singapur y el sudeste asiático se asociaron principalmente con insectos de la familia
Culicidae (principalmente Aedes spp.) y se asociaron con gastos por daños, pérdida de recursos, cuidado
de la salud, y aquellos relacionados con el control. Las proyecciones para las 11 especies adicionales que
se sabe que son invasoras en Singapur, pero con registros superficiales en sus costes, alcanzaron un total
de US $893.13 millones, mostrando un gran vacío potencial entre la información registrada y los costes
actuales (los registros mantienen una ausencia sobre los costes del 90% de las especies invasoras). Ningún
coste en la base de datos de Singapur –o para otro país sudasiático– se asoció exclusivamente con manejo
proactivo, destacando que la escasez de información sobre los costes de las invasiones se refleja en la falta
de inversión en el manejo. Además, las entradas de los costes de invasoras se mostraron inferiores a los
niveles de importación en Singapur, pero los costes totales superaron las expectativas basadas en la exten-
sión del área y el tamaño de la población, y en mayor medida que en otros países del sudeste de Asia. Por
lo tanto, es necesario mejorar la evaluación y la presentación de informes sobre los costes económicos de
las invasiones en esta región a fin de proporcionar un apoyo eficaz basado en datos para la mitigación y el
manejo de sus impactos.

Keywords
Ecosystem services, imports, InvaCost, monetary impact, tropics, socioeconomic sectors

Introduction

Biological invasions cause significant ecological impacts around the world, posing pro-
found impediments to conservation efforts and potentially driving marked socioeco-
nomic costs (Hulme et al. 2009; Early et al. 2016; Seebens et al. 2017). Invasive species
are amongst the main drivers of biodiversity loss worldwide (Malcolm and Markham
2000; Stigall 2010; Bellard et al. 2016; Haubrock et al. 2021). In a socioeconomic
context, invasions can directly affect human health, damage goods and services, com-
promise public and social welfare and impact agriculture (Bradshaw et al. 2016; Paini
et al. 2016; Jones 2017; Shackleton et al. 2019). Yet, disproportionately few economic
resources are allocated to remediate the large-scale consequences of such invasions in
different parts of the world (Hulme et al. 2009; Scaler, 2010; Early et al. 2016). One
Invasive species in Southeast Asia                      135

of the reasons underlying this discrepancy is undoubtedly related to the limited knowl-
edge and societal awareness of their actual impacts (Courchamp et al. 2017).
     Whilst the ecological impacts of invasive species are well-described (see, for exam-
ple, Gurevitch and Padilla 2004; Didham et al. 2005; Cuthbert et al. 2019a, 2020;
Mofu et al. 2019), relatively few studies have synthesised monetary aspects associated
with biological invasions (but see Pimentel et al. 2005 for the USA; Kettunen et al.
2009 for Europe; Oreska and Aldridge 2011 for the UK; Gren et al. 2009 for Swe-
den; Hoffmann and Broadhurst 2016 for Australia; Xu et al. 2006 for China). Yet,
highlighting the economic costs of invasions can actually represent a key awareness-
building tool for both the general public and authorities, as well as an efficient way
for motivating policies, guiding decision-making and prioritising management actions
towards invasive species (Dana et al. 2014; McConnachie et al. 2016; Hiatt et al. 2019;
Diagne et al. 2020a). Such economic costs might relate to a large variety of impacts,
through damage directly or indirectly driven by invaders (e.g. Shwiff et al. 2010),
to different types of expenditure dedicated to preventing, controlling or eradicating
invasions (e.g. Hoffmann and Broadhurst 2016). Nonetheless, the scarcely reported
economic costs are spatially, temporally and taxonomically fragmented (Diagne et al.
2020a), leading to a lack of a holistic understanding of the monetary aspects of inva-
sions. This represents a major challenge for decision-making as invasions represent an
ever-increasing trans-boundary socio-ecological challenge (Lovell et al. 2006; Marbuah
et al. 2014; Diagne et al. 2020a). Particularly, while regional estimates have highlight-
ed the diversity of costs (e.g. Pimentel et al. 2000, 2005; Kettunen et al. 2009; Nghiem
et al. 2013), limited spatial resolution has resulted in piecemeal financial commitments
to tackle the growing economic problem of invasions at relevant scales. More detailed
and comparable information on specific costs is urgently needed at the government-
level, where budgets are established and managed.
     As an international travel and trade hub with numerous introduction pathways,
Singapore is a country facing high risk of biological invasions (Yeo and Chia 2010;
Seebens et al. 2013; Wong 2018) and may thus be a particularly useful example for
such nationally-scaled cost estimation. Thus, Singapore is outstanding amongst other
Southeast Asian countries due to its very dynamic economic connectivity, despite a
relatively small surface area. Singapore is a highly urbanised and densely populated,
but biodiverse, tropical island city state, centrally located within Southeast Asia (Tan
et al. 2010; Ng et al. 2011; World Bank 2019). The few publications reporting costs
of invasive species in Singapore have suggested they might be important (Nghiem et
al. 2013), yet costs have lacked synthesis. At least 142 non-native animal species have
been reported in Singapore (Yeo and Chia 2010), including species listed on several
‘worst invasive alien species’ lists (e.g. IUCN).
     Recently, the available literature on economic costs of invasive species globally
was compiled in the InvaCost database (Diagne et al. 2020b) with the aim of generat-
ing the means to fill knowledge gaps on invasion costs worldwide. Using data avail-
able from this database, we synthesised and described the available information on
economic costs of invasions in Southeast Asia, focusing on Singapore in particular.
136 Phillip J. Haubrock et al. / NeoBiota 67: 131–152 (2021) We specifically investigated (a) how recorded costs and species are characterised across Southeast Asian countries and (b) Singapore as a more detailed example or case study to describe recorded costs impacting its economy, according to (i) taxa, (ii) cost types and (iii) activity sectors. We also deciphered whether the level of reliability of esti- mates may impact the financial burden of invaders. Furthermore, we extrapolated additional costs for invaders reported in Singapore, but with unknown costs there. Finally, we correlated invasion costs with importation levels, surface area and popula- tion size amongst countries to assess the specificities of Southeast Asian countries. We hypothesised that the costs of invasive species in Singapore are underestimated and yet substantial, as are probably those of other Southeast Asian countries. Methods Data acquisition Information on the economic cost of invasions in all the Southeast Asian countries (Brunei, Cambodia, East Timor, Indonesia, Laos, Malaysia, Myanmar, Philippine, Singapore, Thailand and Vietnam) was extracted from the InvaCost database (Diagne et al. 2020b; Angulo et al. 2021) concerning the global costs of invasive species, based on published literature, enabling comprehensive quantification of costs associated with invasive species at various spatio-temporal scales. The latest version of the database, as well as a summary of the whole procedure used to build and update it, can be directly accessed at https://doi.org/10.6084/m9.figshare.12668570. Briefly, the data in Inva- Cost were collected following (i) a series of literature searches using the Web of Science platform (https://webofknowledge.com/), Google Scholar database (https://scholar. google.com/) and the Google search engine (https://www.google.com/) and (ii) tar- geted searches through contacting experts and stakeholders to request potentially un- published and/or publicly unavailable documents containing cost information. All the retrieved costs were standardised in an up-to-date currency (2017 USD), while also taking into account an inflation factor (Diagne et al. 2020b). We performed descrip- tive analyses of a subset of this database, by filtering data (‘Official_country’ column) to exclusively ascertain invasion costs in each country. Cost calculation and description We considered the total costs of invasions by amalgamating the recorded raw costs (column ‘Cost_estimate_per_year_2017_USD_exchange_rate’) per year from our subset. Due to the variability of temporal scales of cost estimates in InvaCost, we annu- alised the data, based on the difference between the “Probable_starting_year_adjusted” and “Probable_starting_year_adjusted” columns using the "summarizeCosts" function of the ‘invacost’ package (v.0.3-4) in R (v.4.0.2) (Leroy et al. 2020). Each expanded entry thus corresponded to a single year for which costs were available following this
Invasive species in Southeast Asia                       137

expansion process (i.e. costs spanning multiple years were divided amongst those same
years). The resulting costs attributed to recorded species were examined according to
different descriptive fields of the database (an updated description of these descriptive
fields is openly available at https://doi.org/10.6084/m9.figshare.12668570):

     i. Method_reliability: illustrating the perceived reliability of cost estimates, based
on the type of publication and method of estimation. Estimates in peer-reviewed pub-
lications or official reports or with documented, repeatable and/or traceable methods
were designated as “High reliability”; all other estimates were designated as “Low reli-
ability” (Diagne et al. 2020b);
     ii. Implementation: referring to whether the cost estimate was actually realised in
the invaded habitat (“Observed”) or whether it was only predicted to occur (“Potential”);
     iii. Type_of_cost_merged: grouping of costs according to the categories: (a)
“Damage-Loss” referring to damages or losses incurred by invasion (e.g. costs for dam-
age repair, resource losses, medical care), (b) “Management” comprising control-relat-
ed expenditure (for example monitoring, prevention, management, eradication) and
money spent on education and maintenance costs, (c) “Diverse/Unspecified” includ-
ing mixed damage-loss and management costs (cases where reported costs were not
clearly distinguished amongst cost types);
     iv. Impacted_sector: the activity, societal or market sector that was impacted by
the cost (Suppl. material 2); note that individual cost entries not allocated to a sin-
gle sector were classified under "Mixed" in the “Impacted_sector” column. A detailed
summary of all descriptors can be found in Suppl. material 1 (see also Diagne et al.
2020b) and the final dataset in Suppl. material 2.

Temporal dynamics and cost extrapolations

To investigate the temporal dynamics of invasion costs, we used the "summarizeCosts"
function implemented in the R package ‘invacost’ (Leroy et al. 2020). With this meth-
od, we calculated the observed cumulative and average annual costs covering the pe-
riod for which costs were recorded, displaying the changes in invasion costs over time.
     As cost information for invasive alien species in Singapore, which we used as an
example, was limited (three species; see Results for more details), we also extrapolated
potential costs for a few additional known invasive species present in Singapore, but
which had recorded costs outside Singapore. For this, we used the most recent compre-
hensive list of alien animal species in Singapore (n = 142; Yeo and Chia 2010). With
this information, we first estimated the mean annual cost of the species listed in Yeo and
Chia (2010) outside Singapore (at the “country” scale) that was available in InvaCost,
assuming the InvaCost database contained recorded cost information for Singapore over
the same period (1975–2015). We then applied a correction factor that considers the
cost difference between the average costs of all invasive alien species in Singapore and
the average costs of all invasive alien species outside Singapore (excluding extreme val-
138 Phillip J. Haubrock et al. / NeoBiota 67: 131–152 (2021)
ues, i.e. the upper and lower 12.5% when implementing the correction factor to cost
data). The corrected mean cost of each of these species was then summed to obtain an
additional cost of biological invasions not directly available from records in Singapore.
Southeast Asia and national comparisons
Given Singapore is an economic centre, we compared the available cost information of
Singapore – in terms of cost entries and number of recorded species (Liu et al. 2021) – to
other available information on invasive alien species costs in Southeast Asian countries
recorded in InvaCost (via the aforementioned data processing methods). Furthermore,
we compared invasion cost entries with other countries worldwide using a linear regres-
sion, based on import value (collected from the International Trade Centre (https://
www.trademap.org/tradestat/Country_SelProduct_TS.aspx) to (i) see how the lack of
available data can affect the estimated economic costs and (ii) examine the relationship
between trade volume and economic activities with the cost recording of invasive spe-
cies. We focused on the 50 countries ranking highest in import value, but with recorded
data in InvaCost. Further, we collected the data of species that have been introduced in
all countries in Southeast Asia (see Results for more details) from the Global Alien Spe-
cies First Records Database (Seebens et al. 2018; accessed in June 2020).
Finally, we examined the relationships between invasion costs (observed and high
reliability costs only) and (i) land area and (ii) human population size using linear re-
gressions (log-transformed) and examined how Singapore compared to other countries
globally and in Southeast Asia particularly. Land area and population size per country
were obtained using 2020 data from worldometer (https://www.worldometers.info/
world-population/population-by-country/).
Results
Costs across taxa, types and sectors in Singapore
Cost data originated from seven records from six different published sources (n = 34
expanded entries). The recorded costs were found to have occurred after 1975 and
amounted to US$ 1.720 billion in total (Figure 1).
At the taxonomic level, cost estimates were available for species from two families,
Culicidae (n = 6 estimates) and Corvidae (n = 1). Within Culicidae, Aedes spp. drove all
of the recorded costs, with four records attributed to A. aegypti alone and two as a combi-
nation of A. aegypti and A. albopictus. Although A. albopictus is native to Singapore, it was
not possible to separate joint cost estimates, which accounted for < 0.05% of total Culi-
cidae costs. For Corvidae, the single cost estimate was associated with Corvus splendens.
The overall estimated cost was mainly caused by Aedes spp. with a total of US$
1.72 billion split between damage-losses (US$ 1.14 billion) and management costs
(US$ 578.01 million). For C. splendens, the single cost estimate reached US$ 765.24Invasive species in Southeast Asia 139
Figure 1. Relative proportions of known alien species present and recorded costs in Singapore as of 2010
(Yeo and Chia 2010), alongside type categorisations for reported costs.
thousand and concerned costs attributed to control-related management efforts (Fig-
ure 2a). With respect to the impacted sector, all Aedes spp. costs were associated with
a combination of impacts on authorities-stakeholders, health and public and social
welfare. The single recorded costs for C. splendens impacted authorities-stakeholders
(Figure 2b). The reported economic costs were associated with terrestrial systems alone
and, thus, no costs were documented in aquatic invasions.
From a methodological point of view, all reported costs were classified as “Ob-
served”, i.e. considered as actually occurring and not based on predictions or extrapola-
tions from outside the invaded area. Every documented Aedes spp. cost was obtained
from accessible peer-reviewed literature and thus deemed “High reliability”. Conversely,
the single cost estimate of C. splendens was deemed to be of “Low reliability” (Figure 2c).
Accordingly, more than 99.9% of costs were deemed “High reliability”.
Temporal cost accumulations, extrapolations and correlations in Singapore
Costs for invasive species were recorded between 1975 and 2014. These costs tended
to increase over time, both in terms of reported costs (1975–1994: n = 2; 1995–2014:
n = 32), but also average annual costs (1975–1994: US$ 1.66 million per year; 1995–
2014: US$ 80.24 million per year), with an annual average cost total of US$ 41.91
million across the entire period (Suppl. material 3).
Comparing the costs of recorded species in Singapore with their average annual
costs per country outside of Singapore, after excluding extreme values (removing 25%
extreme values, i.e. the top and bottom 12.5%), costs and expenditure in Singapore
were around three times lower than those in the rest of the world. From the 142 species
recorded in Yeo and Chia (2010), only an additional 11 were recorded in the InvaCost
database (Suppl. material 4). Applying the average annual monetary cost discrepancy140 Phillip J. Haubrock et al. / NeoBiota 67: 131–152 (2021)
(a) (b) (c)
Cost type Cost sector Reliability
2 2 2
0.0010 0.0010 0.0010
0.0005 0.0005 0.0005
1 1 1
0.0000 0.0000 0.0000
Corvus Corvus Corvus
0 0 0
Aedes Corvus Aedes Corvus Aedes Corvus
Figure 2. Total costs generated by the two genera of invasive species in Singapore with available cost
estimates considering a cost type b impacted sector and c reliability of cost estimations.
Table 1. Comparison of recorded invasive alien species and their costs amongst countries in Southeast Asia.
Proportions of species with reported costs, relative to numbers of known reported alien species originating from
the Global Alien Species First Records Database (Seebens et al. 2018; accessed in June 2020), are also displayed.
Southeast Recorded species Database Total cost in US$ Species Proportion of recorded
Asian country entries billion (2017 value) reported established alien species
Brunei 1 (Aedes aegypti) 1 0.007 - -
Cambodia 1 (Aedes aegypti) 7 0.208 10 10%
East Timor 1 (Aedes aegypti) 1 0.004
Indonesia 2 (Aedes aegypti; Rattus sp.) 5 3.406 75 2.7%
Laos 1 (Aedes aegypti) 1 0.054 10 10%
Malaysia 4 (Aedes aegypti; Aedes albopictus, Mus 10 2.673 36 5.6%
musculus, Rattus norvegicus)
Myanmar 3 (Aedes aegypti, Mus musculus, Rattus 3 0.152 15 6.7%
norvegicus)
Philippines 3 (Aedes aegypti; Pomacea canaliculata; 10 3.169 70 4.3%
Sternochetus frigidus)
Singapore 3 (Aedes aegypti; Aedes albopictus; 7 1.718 142 2.6%
Corvus splendens)
Thailand 4 (Aedes aegypti; Aedes albopictus, Mus 13 5.176 45 4.4%
musculus, Rattus norvegicus)
Vietnam 1 (Aedes aegypti) 6 0.327 20 5%
as a correcting factor to the average annual costs of the 11 invasive species, using the
InvaCost data from outside Singapore, resulted in an additional projected annual aver-
age cost of US$ 22.33 million per year and a total of US$ 893.13 million additional
costs considering the period 1975–2015.
Southeast Asia and national comparisons
The monetary impact of invasions recorded in Southeast Asia totalled US$ 16.89 bil-
lion between 1960 and 2020. Amongst these, Singapore ranked fifth relative to other
countries in terms of reported costs, with two recorded invasive alien species and seven
recorded cost entries in InvaCost. Notably, Brunei had the lowest number of recordedInvasive species in Southeast Asia 141
Figure 3. Recorded costs and species for Southeast Asian countries.
entries (1), species (1) and costs (US$ 6.7 million), while Thailand had the highest costs
(US$ 5.2 billion) and most recorded entries (13) according to InvaCost (Table 1), sug-
gesting considerable spatial heterogeneity in the region (Figure 3). In countries where
lists of known invasive alien species were available (Liu et al. 2021), all had reported
costs for 10% or less of known invasive alien species, with Singapore having the lowest
proportion of aliens with costs (< 3%).
We further identified a significant correlation between trade volume and the num-
ber of recorded entries in InvaCost (Suppl. material 5). When the number of records
from Singapore is related to the volume of trade imports (Figure 4), which has been
shown to be strongly related to cost entries (Haubrock et al. 2021b; Kourantidou et al.
2021), the relationship highlights a number of entries 40 times lower than expected.
The under-reporting of cost entries in Singapore was considerably more apparent than
other high-ranking Southeast Asian countries (i.e. amongst top 50 globally in terms of
imports), with Thailand, Vietnam, Malaysia and Indonesia also having fewer records
than expected based on imports, but the Philippines having more cost records than
expected (Figure 4).
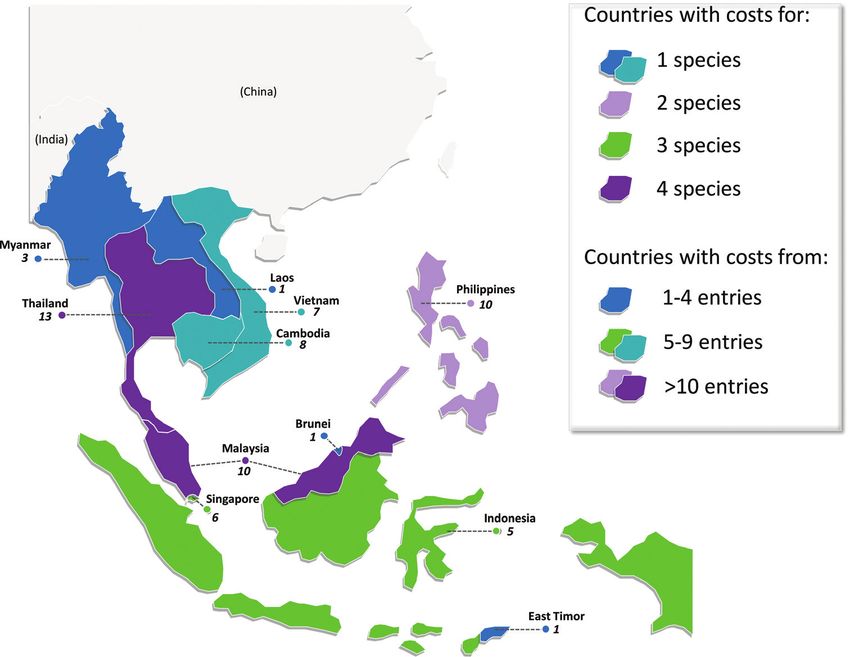
Considering all countries, invasion costs related significantly positively to both
land area and population size (Supplement 5). When compared to other countries
with costs, Singapore displayed considerably greater costs relative to those variables,
even relative to other Southeast Asian nations which mostly clustered together (Figures142 Phillip J. Haubrock et al. / NeoBiota 67: 131–152 (2021) Figure 4. Relationship between the import value and the number of records in InvaCost, focusing on the 50 countries ranking highest in both GDP and import values, but with recorded data in InvaCost. Note that all variables are displayed on a ln-scale. Singapore shows a large deficit of records related to expecta- tions from its import value. 5a, b). Indonesia, Myanmar and Vietnam (and Laos in the case of surface area) had lower invasion costs than expected, based on surface area and human population. Discussion The recorded invasion costs in Singapore over the past 40 years have reached US$ 1.72 billion in total which represents about ⁵⁄₆ of the Ministry of the Environment and Water Resources (S$ 2.83 billion; US$ 2.12 billion), ⅔ of the Ministry of Trade and Industry (S$ 3.68 billion; US$ 2.76 billion) or more than ⅓ of the Ministry of National Developments (S$ 4.8 billion; US$ 3.67 billion) annual budgets in 2017 (https://www.singaporebudget. gov.sg). Despite these costs being high, our study shows that the available entries in the da-
Invasive species in Southeast Asia                                143

Figure 5. Relationships between invasion costs and a land area and b human population of countries.
Note that variables are presented on a ln-scale. Each node represents an individual country with costs in
InvaCost, while Singapore is highlighted.

tabase were highly fragmentary, with the majority of documented alien animal species in
Singapore being absent from the cost estimation (Yeo and Chia 2010). This further puts
into perspective overall costs that are already surprisingly high for such a small area, espe-
cially when actual costs are expected to be more numerous and thus overall higher than
the few recorded costs. Indeed, we show not only that Singapore has few cost entries, but
also that it has about 40 times fewer than expected from its trade volume. Contrastingly,
comparisons, based on costs relative to land area and human population size, evidenced
considerably higher costs in Singapore pro rata, based on those variables, with costs com-
parable to countries approximately 600-times larger and 10-times more populous. These
trends were even more marked when compared to relationships amongst other Southeast
Asian countries, which were more in line with the global cost pattern.
     The very few recorded costs were linked principally to the human health sector and
mainly driven by mosquitoes, with large incurred costs listed for healthcare and their
control. This is mostly related to costs arising from limiting the risk of infectious human
diseases, such as Zika, dengue or chikungunya, which are caused by pathogens, vectored
principally by A. aegypti and A. albopictus, as well as losses through direct healthcare
costs (Beltrame et al. 2007; Zammarchi et al. 2015). Indeed, mosquitoes are considered
as a severe problem in Singapore, underlined by the considerable costs on control and
the medical field (Carrasco et al. 2011). These total costs relating to human health in
Singapore are significant, considering previous estimation of annual costs on human
health and environment in the entirety of Southeast Asia (US$ 1.85 billion; US$ 1.4–
2.5 billion per year) estimated by Nghiem et al. (2013). Moreover, our extrapolations
for species known to be present in Singapore, but with no reported costs there, indicated
further economic impacts summing to US$ 893.13 million over 1975–2014. Although
this figure has to be taken with caution, it underlines the magnitude of potentially oc-
curring costs which are not accounted for in published literature. These numbers are still
144 Phillip J. Haubrock et al. / NeoBiota 67: 131–152 (2021)
likely underestimated (Diagne et al. 2021), given that these additional costs stem from
just 11 of the 142 known animal invaders in Singapore that were available in InvaCost,
with plant species missing entirely. Indeed, information on plant invasions in Singapore
and, particularly, with regard to their monetary impacts, are scarce (Meyer 2000), with
Yeo and Chia (2010) listing only relatively few invasive examples, such as the water
hyacinth Eichhornia crassipes, which entered Singapore’s waterways and proliferated to
a damaging extent. As such, most invaders lack cost information at the Singapore scale,
yet also internationally. Nevertheless, this lack of information, although striking, is nei-
ther surprising nor different from what is found in similar studies elsewhere. First, we
showed that this is a general pattern in the region, with Singapore amongst the coun-
tries with most cost entries in Southeast Asia. Second, national or regional studies on
the economic costs of biological invasions outside this region also consistently reported
only between 2% and 10% of invasive alien species having recorded costs, for example,
Argentina (Duboscq-Carra et al. 20201), Asia (Liu et al. 2021), Australia (Bradshaw
et al. 2021), France (Renault et al. 2021), Germany (Haubrock et al. 2021c), Mexico
(Rico-Sánchez et al. 2021) and United Kingdom (Cuthbert et al. 2021a).
In the context of Southeast Asia, this national bias is even more pronounced; amidst
differences in economic activities amongst countries (note that Singapore has the high-
est GDP per capita in Southeast Asia), the lack of cost information for invasive alien
species more broadly across Southeast Asian countries is striking. Singapore had the
lowest proportion of known invasive alien species with reported costs, while all South-
east Asian countries had costs for 10% or below in terms of listed invasive alien species.
This is also noteworthy in an all-Asia context (Liu et al. 2021), as shown by a lack of
cost information in, for example, South Korea (only one ‘Unspecified’ record), Saudi
Arabia (no records), Turkey (no records), Thailand (only records considering A. aegypti
and A. albopictus) and Iran (no records), which are all amongst the 10 countries with the
highest GDP in Asia (International Monetary Fund 2019; https://www.imf.org/). This
suggests that lower economic wealth is likely not to be a determinant of how biological
invasions – and their monetary costs – are documented (Nghiem et al. 2013).
Regarding the overall cost estimation, it is possible to overestimate costs if one as-
sumes that the costs repeatedly occurring over time are repeated for a longer duration
than it actually occurs (if total duration is not reported). To stay conservative, we assigned
a single duration year for cost entries for which such information was missing and the
cost was potentially ongoing. Furthermore, it is possible that the annual monetary bur-
den increased over the years due to frequent descriptions of new invaders. In addition, the
spatial scale for estimating costs in InvaCost reflect ‘site’ and/or ‘country’ level estimates,
meaning that the national burden could be higher as some ‘regional’ costs may not have
specified specific countries. Additionally, we show that the relatively large number of al-
ien species present in Singapore (see Yeo and Chia 2010) potentially contributes further
costs exceeding those that were recorded in InvaCost. However, one should consider that
a) Yeo and Chia (2010) presented detailed information only for animals, excluding plants
and microbes in this assessment; and b) the difficulties in quantifying certain types of
economic impact – especially concerning ecosystem services and the many forms of dam-
age that occur indirectly (Spangenberg and Settele 2010). For all these reasons, it couldInvasive species in Southeast Asia 145
be assumed that the presented costs may represent potentially a massive underestimation
of the real economic costs of biological invasions in Singapore and Southeast Asia.
Our work also reveals a considerable taxonomic bias in the reported economic
impacts of the 142 reported alien animal species in Singapore. The weighting of costs
towards taxa in the database does not reflect the ‘true’ taxonomic composition of alien
species in Singapore. Freshwater fishes and reptiles together make up the majority of
alien species in this country (61%) (Yeo and Chia 2010), but no cost data were found
for any of these taxa here. Yet, Yeo and Chia (2010) present anecdotal information that
several non-native plant species (e.g. the South American water hyacinth, Eichhornia
crassipes) are likely to have necessitated regular management at various scales, sometimes
at considerable (yet unquantified) financial cost. This information, however, mostly
relied on Wee and Corlett (1986), who, although most likely being outdated, listed 34
potentially invasive plant species present in Singapore. Nevertheless, these two accounts
together are only about one quarter of the 648 species listed by GRIIS (Kwek et al.
2020), underlining the gap of cost reporting for invasive species in Singapore.
Whilst we cannot exclude that some existing cost data may have not been captured
by the InvaCost database, this taxonomic discrepancy should be discussed. Singapore
has a history of freshwater species introductions (Yeo and Chia 2010; Ng et al. 2010;
Liew et al. 2012; Ng and Yeo 2012; Kwik et al. 2013; Ng et al. 2015, 2016a, b). Acci-
dental releases/escapes aside, key drivers of intentional releases can often be cultural (e.g.
for aesthetic, recreational or religious reasons; Yeo and Chia 2010). Usually, impacts on
aquatic habitats or native communities are less obviously perceived by the public and
authorities or are perceived as beneficial for local municipalities (Selge et al. 2011; Kil-
ian et al. 2012). This could partially explain the overall bias towards costs on terrestrial
habitats and the lack of information regarding aquatic habitats (Cuthbert et al. 2021b).
Yet, as Singapore and many other countries of Southeast Asia are (or include) islands
and, in many cases, have extensive and economically-important inland water systems, it
is striking that no cost exists here for aquatic invasions. Furthermore, birds are known
to be commonly released for religious purposes (Su et al. 2016); however the present
study contained costs for just one species, indicating additional knowledge gaps.
Given that management and control costs usually outweigh the costs of preven-
tion and surveillance (Leung et al. 2002), the presence of various introduction path-
ways in Singapore (Yeo and Chia 2010; Jaafar et al. 2012) raises the concern about
how economic costs are related to pathways (Liu et al. 2019). Indeed, this should be
evaluated for framing management policies by relevant stakeholders, because currently,
Singapore does not have specific management plans in place that address threats from
major invasive alien species, but has implemented various surveillance/monitoring
programmes (National Parks Board Singapore 2015).
Despite most of the economic costs in Singapore being related to the control
of invasive species and the costs of healthcare, it can be assumed that other dam-
age or losses have not yet been estimated. For example, similarly data-poor studies
found major costs for agriculture in Argentina or the UK (Duboscq-Carra et al. 2021;
Cuthbert et al. 2021a) or forestry in Sweden (Haubrock et al. 2021b). In each case,
it seemed clear that these trends were driven by few records, suggesting that a richer146 Phillip J. Haubrock et al. / NeoBiota 67: 131–152 (2021)
cost record might, in each case, reveal costs for other activity sectors, substantially
raising the overall estimates. In Southeast Asia, biological invasions could exert a very
significant toll on major economic sectors, such as forestry in Indonesia, agriculture
in Vietnam, fisheries in the Philippines or tourism in Thailand. In the case of many
invasive species, only with more costs being described can we get a better understand-
ing of the cost distribution for each descriptor. Furthermore, without information
on the financial pressures that invasive species apply to an economy, efforts to tackle
these, whether through prevention, surveillance or applied control and monitoring ef-
forts, might fail at an underestimated monetary value due to inadequate investments.
Given the likely underestimated costs identified for biodiversity-rich Southeast Asian
countries and illustrated with Singapore, alongside their rapidly growing population
densities, trade volumes and GDP, the need for effective invasive species management
and cost reporting is paramount.
Acknowledgements
The authors acknowledge the French National Research Agency (ANR-14-CE02-0021)
and the BNP-Paribas Foundation Climate Initiative for funding the InvaCost project
that allowed the construction of the InvaCost database. The present work was conduct-
ed following a workshop funded by the AXA Research Fund Chair of Invasion Biology
and is part of the AlienScenario project funded by BiodivERsA and Belmont-Forum
call 2018 on biodiversity scenarios. RNC is funded by a research fellowship from the
Alexander von Humboldt foundation. CD is funded by the BiodivERsA-Belmont
Forum Project “Alien Scenarios” (BMBF/PT DLR 01LC1807C). The authors also
acknowledge the constructive and helpful comments of the anonymous reviewers. Fur-
ther, the authors acknowledge Wen Xiong, Axel E. Rico-Sanchez and Anna Turbelin
for the translation of abstracts.
References
Angulo E, Diagne C, Ballesteros-Mejía L, Akulov EN, Dia CAKM, Adamjy T, Banerjee A-
K,Capinha C, Duboscq VG, Dobigny G, Golivets M, Heringer G, Haubrock PJ, Kir-
ichenko N, Kourantidou M, Liu C, Nuñez M, Renault D, Roiz D, Taheri A, Watari Y,
Xiong W, Courchamp F (2021) Non-English languages enrich scientific data: the exam-
ple of thecosts of biological invasions. Science of the Total Environment 775: e144441.
https://doi.org/10.1016/j.scitotenv.2020.144441
Bellard C, Genovesi P, Jeschke JM (2016) Global patterns in threats to vertebrates by bio-
logical invasions. Proceedings of the Royal Society B: Biological Sciences 283: e20152454.
https://doi.org/10.1098/rspb.2015.2454
Bradshaw CJ, Leroy B, Bellard C, Roiz D, Albert C, Fournier A, Courchamp F (2016) Massive
yet grossly underestimated global costs of invasive insects. Nature Communications 7: 1–8.
https://doi.org/10.1038/ncomms12986Invasive species in Southeast Asia 147
Bradshaw CJA, Hoskins AJ, Haubrock PJ, Cuthbert RN, Diagne C, Leroy B, Andrews L, Page
B, Cassey P, Sheppard AW, Courchamp F (2021) Detailed assessment of the reported eco-
nomic costs of invasive species in Australia. In: Zenni RD, McDermott S, García-Berthou
E, Essl F (Eds) The economic costs of biological invasions around the world. NeoBiota 67:
511–550. https://doi.org/10.3897/neobiota.67.58834
Courchamp F, Fournier A, Bellard C, Bertelsmeier C, Bonnaud E, Jeschke JM, Russell JC
(2017) Invasion biology: specific problems and possible solutions. Trends in Ecology and
Evolution 32: 13–22. https://doi.org/10.1016/j.tree.2016.11.001
Cuthbert RN, Dickey JW, Coughlan NE, Joyce PW, Dick JT (2019a) The Functional Response
Ratio (FRR): advancing comparative metrics for predicting the ecological impacts of inva-
sive alien species. Biological Invasions 1–5. https://doi.org/10.1007/s10530-019-02002-z
Cuthbert RN, Bacher S, Blackburn TM, Briski E, Diagne C, Dick JT, Haubrock PJ, Lenzner B,
Courchamp F (2020) Invasion costs impacts and human agency: Response to Sagoff 2020.
Conservation Biology 34(6): 1579–1582. https://doi.org/10.1111/cobi.13592
Cuthbert RN, Bartlett AC, Turbelin AJ, Haubrock PJ, Diagne C, Pattison Z, Courchamp F,
Catford JA (2021) Economic costs of biological invasions in the United Kingdom. In:
Zenni RD, McDermott S, García-Berthou E, Essl F (Eds) The economic costs of bio-
logical invasions around the world. NeoBiota 67: 299–328. https://doi.org/10.3897/neo-
biota.67.59743
Cuthbert RN, Pattison Z, Taylor NG, Verbrugge L, Diagne C, Ahmed DA, Leroy B, Angulo E,
Briski E, Capinha C, Catford JA, Dalu T, Essl F, Gozlan RE, Haubrock PJ, Kourantidou
M, Kramer AM, Renault D, Wasserman RJ, Courchamp F (2021b) Global economic costs
of aquatic invasive alien species. Science of the Total Environment 775: e145238. https://
doi.org/10.1016/j.scitotenv.2021.145238
Dana ED, Jeschke JM, García-de-Lomas J (2013) Decision tools for managing biological
invasions: existing biases and future needs. Oryx 48: 56–63. https://doi.org/10.1017/
S0030605312001263
Diagne C, Catford JA, Essl F, Nuñez MA, Courchamp F (2020a) What are the economic costs
of biological invasions? A complex topic requiring international and interdisciplinary ex-
pertise. NeoBiota 63: 25–37. https://doi.org/10.3897/neobiota.63.55260
Diagne C, Leroy B, Gozlan RE, Vaissière A-C, Assailly C, Nuninger L, Roiz D, Jourdain F, Jarić
I, Courchamp F (2000b) InvaCost, a public database of the economic costs of biological
invasions worldwide. Sci Data 7: e277. https://doi.org/10.1038/s41597-020-00586-z
Didham RK, Tylianakis JM, Hutchison MA, Ewers RM, Gemmell NJ (2005) Are invasive
species the drivers of ecological change?. Trends in Ecology and Evolution 20: 470–474.
https://doi.org/10.1016/j.tree.2005.07.006
Duboscq-Carra VG, Fernandez RD, Haubrock PJ, Dimarco RD, Angulo E, Ballesteros-Mejia
L, Diagne C, Courchamp F, Nuñez MA (2021) Economic impact of invasive alien species
in Argentina: a first national synthesis. In: Zenni RD, McDermott S, García-Berthou E,
Essl F (Eds) The economic costs of biological invasions around the world. NeoBiota 67:
329–348. https://doi.org/10.3897/neobiota.67.63208
Early R, Bradley BA, Dukes JS, Lawler JJ, Olden JD, Blumenthal DM, Sorte CJ (2016) Global
threats from invasive alien species in the twenty-first century and national response capaci-
ties. Nature Communications 7: e12485. https://doi.org/10.1038/ncomms12485148 Phillip J. Haubrock et al. / NeoBiota 67: 131–152 (2021)
Gren M, Isacs L, Carlsson M (2009) Costs of alien invasive species in Sweden. AMBIO: A
Journal of the Human Environment 38: 135–140. https://doi.org/10.1579/0044-7447-
38.3.135
Gurevitch J, Padilla DK (2004) Are invasive species a major cause of extinctions? Trends in
Ecology and Evolution 19(9): 470–474. https://doi.org/10.1016/j.tree.2004.07.005
Haubrock PJ, Pilotto F, Innocenti G, Cianfanelli S, Haase P (2021a) Two centuries for an
almost complete community turnover from native to non‐native species in a riverine eco-
system. Global Change Biology 27(3): 606–623. https://doi.org/10.1111/gcb.15442
Haubrock PJ, Turbelin AJ, Cuthbert RN, Novoa A, Taylor NG, Angulo E, Ballesteros-Mejia
L, Bodey TW, Capinha C, Diagne C, Essl F, Golivets M, Kirichenko N, Kourantidou M,
Leroy B, Renault D, Verbrugge L, Courchamp F (2020) Economic costs of invasive alien
species across Europe In: Zenni RD, McDermott S, García-Berthou E, Essl F (Eds) The
economic costs of biological invasions around the world. NeoBiota 67: 153–190. https://
doi.org/10.3897/neobiota.67.58196
Haubrock PJ, Cuthbert RN, Sundermann A, Diagne C, Golivets M, Courchamp F (2021)
Economic costs of invasive species in Germany. In: Zenni RD, McDermott S, García-
Berthou E, Essl F (Eds) The economic costs of biological invasions around the world.
NeoBiota 67: 225–246. https://doi.org/10.3897/neobiota.67.59502
Hiatt D, Serbesoff-King K, Lieurance D, Gordon DR, Flory SL (2019) Allocation of invasive
plant management expenditures for conservation: Lessons from Florida USA. Conserva-
tion Science and Practice e51. https://doi.org/10.1111/csp2.51
Hoffmann BD, Broadhurst LM (2016) The economic cost of managing invasive species in
Australia. NeoBiota 31: 1–1. https://doi.org/10.3897/neobiota.31.6960
Hulme PE, Pyšek P, Nentwig W, Vilà M (2009) Will threat of biological invasions unite the
European Union? Science 324: 40–41. https://doi.org/10.1126/science.1171111
Jaafar Z, Yeo DCJ, Tan HH, O’Riordan RM (2012) Status of estuarine and marine non-indig-
enous species in Singapore. Raffles Bulletin of Zoology Supplement No 25: 79–92.
Jones BA (2017) Invasive species impacts on human well-being using the life satisfaction index.
Ecological Economics 134: 250–257. https://doi.org/10.1016/j.ecolecon.2017.01.002
Kettunen M, Genovesi P, Gollasch S, Pagad S, Starfinger U, ten Brink P, Shine C (2009)
Technical support to EU strategy on invasive alien species (IAS) Institute for European
Environmental Policy (IEEP) Brussels, 44 pp.
Kilian JV, Klauda RJ, Widman S, Kashiwagi M, Bourquin R, Weglein S, Schuster J (2012) An
assessment of a bait industry and angler behavior as a vector of invasive species. Biological
Invasions 14: 1469–1481. https://doi.org/10.1007/s10530-012-0173-5
Kourantidou M, Cuthbert RN, Haubrock PJ, Novoa A, Taylor NG, Leroy B, Capinha C,
Renault D, Angulo E, Diagne C, Courchamp F (2021) Economic costs of invasive alien
species in the Mediterranean basin. In: Zenni RD, McDermott S, García-Berthou E, Essl F
(Eds) The economic costs of biological invasions around the world. NeoBiota 67: 427–458.
https://doi.org/10.3897/neobiota.67.58926
Kwek Yan C, Yeo Chong Jinn D, Chia C, Tan Tiang Wah H, Lim Kok Peng K, Heok Hui T,
Koh Siang T, Wong LJ, Pagad S (2020) Global Register of Introduced and Invasive Spe-Invasive species in Southeast Asia 149
cies - Singapore. Version 1.2. Invasive Species Specialist Group ISSG. Checklist dataset
accessed via GBIF.org [2021-02-14]
Kwik JTB, Kho ZY, Quek BS, Tan HH, Yeo DCJ (2013) Urban stormwater ponds in Sin-
gapore: potential pathways for spread of alien freshwater fishes. BioInvasions Records 2:
239–245. https://doi.org/10.3391/bir.2013.2.3.11
Leroy B, Kramer A, Vaissière A-C, Diagne C (in prep). invacost: INVACOST Database With
Methods To Analyse Invasion Costs. R package version 0.3-4.http://borisleroy.com/inva-
cost/Readme.html
Leung B, Lodge DM, Finnoff D, Shogren JF, Lewis MA, Lamberti G (2002) An ounce of
prevention or a pound of cure: bioeconomic risk analysis of invasive species. Proceedings
of the Royal Society of London Series B: Biological Sciences 269: 2407–2413. https://doi.
org/10.1098/rspb.2002.2179
Liew JH, Tan HH, Yeo DCJ (2012) Some cichlid fishes recorded in Singapore. Nature in Sin-
gapore 5: 229–236.
Liu X, Blackburn TM, Song T, Li X, Huang C Li Y (2019) Risks of biological inva-
sion on the belt and road. Current Biology 29: 499–505. https://doi.org/10.1016/j.
cub.2018.12.036
Liu C, Diagne C, Angulo E, Banerjee A-K, Chen Y, Cuthbert RN, Haubrock PJ, Kirichenko
N, Pattison Z, Watari Y, Xiong W, Courchamp F (2021) Economic costs of biological
invasions in Asia. In: Zenni RD, McDermott S, García-Berthou E, Essl F (Eds) The eco-
nomic costs of biological invasions around the world. NeoBiota 67: 53–78. https://doi.
org/10.3897/neobiota.67.58147
Lovell SJ, Stone SF, Fernandez L (2006) The economic impacts of aquatic invasive species: a re-
view of the literature. Agricultural and Resource Economics Review 35: 195–208. https://
doi.org/10.1017/S1068280500010157
Malcolm JR, Markham A (2000) Global warming and terrestrial biodiversity decline. WWF,
Washington.
Marbuah G, Gren IM, McKie B (2014) Economics of harmful invasive species: a review. Di-
versity 6: 500–523. https://doi.org/10.3390/d6030500
McConnachie MM, van Wilgen BW, Ferraro PJ, Forsyth AT, Richardson DM, Gaertner M,
Cowling, RM (2016) Using counterfactuals to evaluate the cost-effectiveness of controlling
biological invasions. Ecological Applications 26: 475–483. https://doi.org/10.1890/15-0351
National Parks Board Singapore (2015) Singapore 5th National Report to the Convention on
Biological Diversity (2010–2014).
Meyer JY (2000) Preliminary review of the invasive plants in the Pacific islands (SPREP Member
Countries). Invasive species in the Pacific: A technical review and draft regional strategy 85.
Ng HH, Tan HH, Yeo DCJ, Ng PKL (2010) Stingers in a strange land: South American fresh-
water stingrays (Potamotrygonidae) in Singapore. Biological Invasions 12: 2385–2388.
https://doi.org/10.1007/s10530-009-9663-5
Ng TH, Foon JK, Tan SK, Chan MKK, Yeo DCJ (2016b) First non-native establishment of the
carnivorous assassin snail Anentome helena (von dem Busch in Philippi 1847). BioInvasions
Records 5: 143–148. https://doi.org/10.3391/bir.2016.5.3.04You can also read