Satellite-derived products of solar and longwave irradiances used for snowpack modelling in mountainous terrain
←
→
Page content transcription
If your browser does not render page correctly, please read the page content below
Hydrol. Earth Syst. Sci., 24, 2083–2104, 2020
https://doi.org/10.5194/hess-24-2083-2020
© Author(s) 2020. This work is distributed under
the Creative Commons Attribution 4.0 License.

Satellite-derived products of solar and longwave irradiances
used for snowpack modelling in mountainous terrain
Louis Quéno1,2,z , Fatima Karbou1 , Vincent Vionnet1,3 , and Ingrid Dombrowski-Etchevers4
1 Univ. Grenoble Alpes, Université de Toulouse, Météo-France, CNRS,
CNRM, Centre d’Etudes de la Neige, 38000 Grenoble, France
2 WSL Institute for Snow and Avalanche Research SLF, Davos, Switzerland
3 Environmental Numerical Research Prediction, Environment and Climate Change Canada, Dorval, QC, Canada
4 CNRM, Université de Toulouse, Météo-France, CNRS, Toulouse, France
z Invited contribution by Louis Quéno, recipient of the EGU Cryospheric Sciences Outstanding Student Poster and PICO

Award 2017.

Correspondence: Louis Quéno (louis.queno@gmail.com)

Received: 14 September 2017 – Discussion started: 19 September 2017
Revised: 13 March 2020 – Accepted: 25 March 2020 – Published: 28 April 2020

Abstract. In mountainous terrain, the snowpack is strongly         snowpack modelling in mountains, when the error compen-
affected by incoming shortwave and longwave radiation. In          sations are solved.
this study, a thorough evaluation of the solar and longwave
downwelling irradiance products (DSSF and DSLF) derived
from the Meteosat Second Generation satellite was under-           1   Introduction
taken in the French Alps and the Pyrenees. The satellite-
derived products were compared with forecast fields from           Seasonal snowpacks are a key component of mountain hy-
the meteorological model AROME and with analysis fields            drological systems. Snow accumulation and ablation pro-
from the SAFRAN system. A new satellite-derived prod-              cesses set up the temporal evolution of the snow cover and its
uct (DSLFnew) was developed by combining satellite obser-          spatial distribution, controlling the snowmelt variability and
vations and AROME forecasts. An evaluation against in situ         timing, which govern the run-off in high-altitude catchments
measurements showed lower errors for DSSF than AROME               (e.g. Anderton et al., 2002; DeBeer and Pomeroy, 2017). The
and SAFRAN in terms of solar irradiances. For longwave ir-         evolution and spatial distribution of the snowpack in moun-
radiances, we were not able to select the best product due         tainous terrain depends on its energy budget, affected by the
to contrasted results falling in the range of uncertainty of the   surface radiative budget, the sensible and latent heat fluxes,
sensors. Spatial comparisons of the different datasets over the    and the ground heat flux (e.g. Armstrong and Brun, 2008).
Alpine and Pyrenean domains highlighted a better represen-         The meteorological conditions are the main factors control-
tation of the spatial variability of solar fluxes by DSSF and      ling the snow surface energy budget, with a key contribu-
AROME than SAFRAN. We also showed that the altitudinal             tion of the radiative components (Male and Granger, 1981).
gradient of longwave irradiance is too strong for DSLFnew          For example, Cline (1997) reported a contribution of 75 %
and too weak for SAFRAN. These datasets were then used             of net radiative fluxes in the energy for snowmelt over the
as radiative forcing together with AROME near-surface fore-        entire season at a continental mid-latitude alpine site of the
casts to drive distributed snowpack simulations by the model       Colorado Front Range (3517 m), while Marks and Dozier
Crocus in the French Alps and the Pyrenees. An evaluation          (1992) found a contribution between 66 % and 90 % at two
against in situ snow depth measurements showed higher bi-          alpine sites of the Sierra Nevada (2800 and 3416 m). There-
ases when using satellite-derived products, despite their qual-    fore, incoming shortwave (SW ↓) and longwave (LW↓) ra-
ity. This effect is attributed to some error compensations in      diative fluxes are amongst the most significant atmospheric
the atmospheric forcing and the snowpack model. However,           factors of the energy and mass budget of the snowpack, par-
satellite-derived irradiance products are judged beneficial for    ticularly during snowmelt periods. It is crucial to accurately

Published by Copernicus Publications on behalf of the European Geosciences Union.
2084          L. Quéno et al.: Satellite-derived products of solar and longwave irradiances used for snowpack modelling

represent them in numerical snowpack simulations, as recent          grid variability of incoming radiation within a 1◦ grid cell
works underlined the strong sensitivity of snowpack simula-          is the highest (Hakuba et al., 2013). In a perspective of dis-
tions to the radiative forcing (Raleigh et al., 2015; Lapo et al.,   tributed snowpack simulations at kilometric resolution, they
2015b; Sauter and Obleitner, 2015), together with crucial in-        are also consistent with the horizontal resolution of the other
put variables like precipitation and air temperature (Raleigh        atmospheric variables from NWP systems. LSA SAF irra-
et al., 2015; Günther et al., 2019).                                 diance products were proved to be valuable for plains (e.g.
   Several studies highlighted the benefits of distributed           Geiger et al., 2008b; Ineichen et al., 2009; Trigo et al., 2010;
snowpack simulations at the scale of mountain ranges, par-           Carrer et al., 2012; Moreno et al., 2013; Cristóbal and An-
ticularly in areas with scarce snow cover observations. Sim-         derson, 2013), with a significant positive impact when used
ulations of detailed snowpack models driven by Numerical             for simulations of the surface and soil temperatures, and soil
Weather Prediction (NWP) forecasts at kilometric resolu-             water content (Carrer et al., 2012) or evapotranspiration mod-
tion proved to describe satisfactorily the snowpack variabil-        elling (Ghilain et al., 2011; Sun et al., 2011). MSG satellite
ity within a mountain range (Quéno et al., 2016; Vionnet             data have already been used to derive incoming solar irradi-
et al., 2016), to describe the snow accumulation quantitative        ance over complex terrain in the Heliomont method (Stöckli,
distribution (Schirmer and Jamieson, 2015) and to provide            2013; Castelli et al., 2014), but at a much finer scale (100 m)
relevant high-resolution information for snowpack stability          than the scope of this study.
concerns (Bellaire et al., 2014; Horton et al., 2015). The ra-          The aim of the present study is to assess LSA SAF prod-
diative forcing of these simulations relies on NWP forecasts         ucts of SW↓ and LW↓ irradiances in the French Alps and the
of the SW↓ and LW↓ irradiances with no use of observa-               Pyrenees, and to compare them with kilometric-resolution
tions (in situ or from satellites). Vionnet et al. (2016) made       NWP forecasts and with a meteorological analysis system
a preliminary evaluation of SW↓ and LW↓ irradiance fore-             dedicated to mountainous terrain. We also test and discuss
casts by the NWP system AROME operating at 2.5 km res-               the potential of LSA SAF irradiance products to drive dis-
olution over France. Through comparisons to ground-based             tributed snowpack simulations in mountains. With regard to
measurements at two mountainous sites in the French Alps,            the existing literature on the subject, this article makes three
they showed an overestimation of SW↓ and an underestima-             original contributions: (i) in-depth evaluation of LSA SAF
tion of LW↓, linked to an underestimation of the cloud cover.        irradiance products in mountains, (ii) development and as-
   Satellite-derived estimates of SW↓ and LW↓ irradiances            sessment of a new LW↓ irradiance product to better capture
are an alternative to NWP-based irradiance datasets in moun-         the spatial variability of LW↓ irradiance in complex terrain,
tainous terrain. They are mostly based on satellite products of      and (iii) use of satellite-derived irradiance products at higher
cloud mask, which highly controls the incoming radiation in          spatial and temporal resolution than previous studies to drive
mountains (e.g. Sicart et al., 2016), and top-of-atmosphere          distributed snowpack simulations over large mountain areas.
reflectances. These satellite-based products could have a po-
tential added value for snowpack modelling since they are
available continuously and at a relatively high resolution in        2     Data and models
mountains, where in situ observations are rather scarce. This
approach has already been explored with the solar and long-          2.1    Study domain and period
wave surface irradiance data from NASA’s Clouds and the
Earth’s Radiant Energy System synoptic (CERES SYN; Ru-               The study focuses on two domains covering the French Alps
tan et al., 2015), which are satellite-derived estimates at 3 h      (Fig. 1a) and the French and Spanish Pyrenees (Fig. 1b). The
temporal resolution and 1◦ grid spacing (i.e. approximately          French Alps domain ranges from 43.125 to 46.875◦ N lati-
110 km at mid-latitudes). The quality of CERES SYN irradi-           tudes and from 4.5 to 8.5◦ E longitudes. This domain also in-
ances was found to be poorer at mountain stations than those         cludes a part of the mid-altitude mountain range of Jura. The
on plains (Hinkelman et al., 2015). The CERES SYN solar              Pyrenees domain covers the latitudes from 41.6 to 43.6◦ N
irradiance product was also evaluated by Lapo et al. (2017),         and the longitudes from −2.5 to 3.5◦ E. Hourly data, from
who found large biases over complex terrain. Hinkelman               1 August 2010 to 31 July 2014, including in situ measure-
et al. (2015) used CERES SYN irradiance products to drive            ments, satellite-derived irradiance products, meteorological
snowmelt simulations in complex terrain and found perfor-            models and snowpack simulations, were used.
mances in the range of empirical methods and observations.
In this study, we used the SW↓ and LW↓ irradiances from              2.2    Irradiance datasets
the Satellite Application Facility on Land Surface Analysis
(LSA SAF; Trigo et al., 2011), derived from Meteosat Sec-            Several irradiance datasets were used in this study: fore-
ond Generation (MSG) satellite data. These products have a           casts from the NWP model AROME, reanalyses from the
higher temporal frequency (30 min) and a higher spatial res-         SAFRAN analysis system, LSA SAF irradiance products de-
olution (3 km at nadir) and thus may be more adapted than            rived from remotely sensed observations and a hybrid LW↓
CERES SYN products to complex terrains, where the sub-               irradiance product based on a combination of LSA SAF algo-

Hydrol. Earth Syst. Sci., 24, 2083–2104, 2020                                      www.hydrol-earth-syst-sci.net/24/2083/2020/
L. Quéno et al.: Satellite-derived products of solar and longwave irradiances used for snowpack modelling                  2085

Figure 1. Domains of study: (a) the French Alps and (b) the Pyrenees, with AROME topography at 2.5 km resolution. Red dots: SW↓
stations; blue dots: SW↓ and LW↓ stations; black lines: SAFRAN massifs.

rithms with AROME forecasts. An in situ observation dataset       the SW scheme from Fouquart and Bonnel (1980) and the
was built up for validation in mountains.                         LW scheme from Mlawer et al. (1997).
                                                                     In this study, we built a continuous atmospheric forcing
                                                                  dataset to drive snowpack simulations using hourly AROME
2.2.1   NWP system: AROME                                         forecasts issued from the 00:00 UTC analysis time, from
                                                                  +6 to +29 h, extracted on a regular latitude–longitude grid
                                                                  with a 0.025◦ resolution over the period and domains of the
AROME (Application of Research to Operations at
                                                                  study (Sect. 2.1, Fig. 1), similarly to Quéno et al. (2016) and
MEsoscale) is the meso-scale NWP system of Météo-
                                                                  Vionnet et al. (2016). Besides incoming shortwave and long-
France (Seity et al., 2011), operating over France since De-
                                                                  wave irradiances, 2 m temperature and humidity as well as
cember 2008 at 2.5 km grid spacing (1.3 km since 2015;
                                                                  10 m wind speed and ground-level precipitation (amount of
Brousseau et al., 2016). It is a spectral and non-hydrostatic
                                                                  rainfall and snowfall) are part of the AROME forcing. The
model. The physics and data assimilation schemes are de-
                                                                  variable heights correspond to the heights of the diagnostic
tailed in Seity et al. (2011). In particular, AROME uses
                                                                  variables provided by AROME.
the radiation parameterizations from the European Cen-
tre for Medium-Range Weather Forecasts (ECMWF), with

www.hydrol-earth-syst-sci.net/24/2083/2020/                                    Hydrol. Earth Syst. Sci., 24, 2083–2104, 2020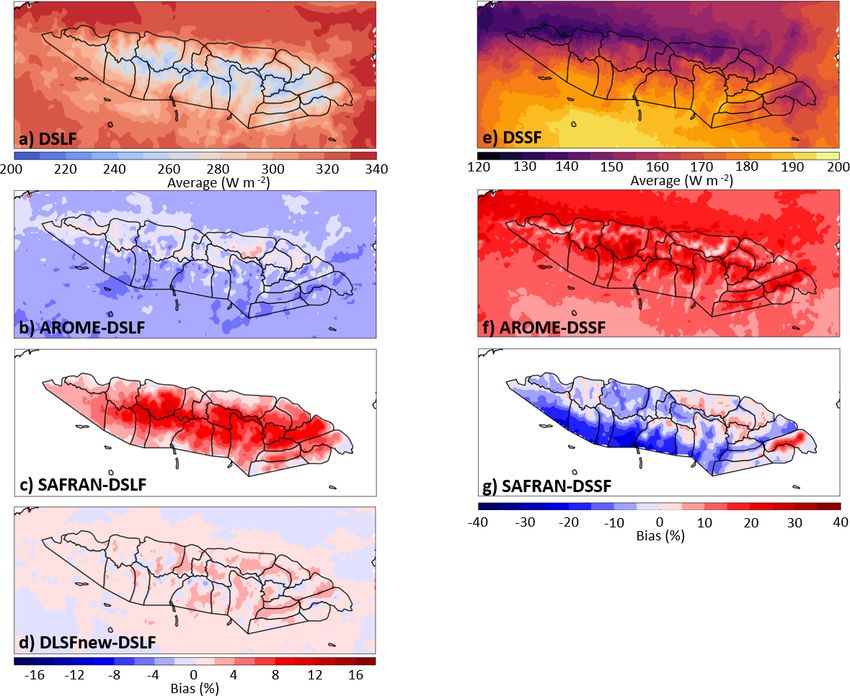
2086         L. Quéno et al.: Satellite-derived products of solar and longwave irradiances used for snowpack modelling

2.2.2   Analysis system: SAFRAN                                   erated every 30 min, covering the MSG full disc with a 3 km
                                                                  resolution at nadir. They have been operationally dissemi-
SAFRAN (Système d’Analyse Fournissant des Renseigne-              nated since September 2005 (http://landsaf.ipma.pt, last ac-
ments Atmosphériquesà la Neige; Analysis System Pro-              cess: 20 April 2020). DSSF and DSLF are fully consistent as
viding Atmospheric Information to Snow; Durand et al.,            they are based on the same satellite observations.
1993, 2009a, b) is a meteorological analysis system devel-
oped to provide hourly estimation of meteorological param-          – SW↓ irradiance: DSSF
eters required to drive land surface models. SAFRAN out-              The algorithm to estimate the DSSF is described in de-
puts are available per 300 m altitude steps within moun-              tail by Geiger et al. (2008b). The MSG/SEVIRI cloud
tainous regions called “massifs”. There are 23 massifs in             mask (Derrien and Le Gléau, 2005) identifies clear-
the French Alps and 23 massifs in the French and Span-                sky and cloudy-sky situations. Two separate algorithms
ish Pyrenees (Fig. 1), defined for their climatological ho-           are then applied. In the clear-sky method, derived from
mogeneity. SAFRAN reanalyses take a preliminary guess                 Frouin et al. (1989), the effective transmittance of the at-
from the global NWP model ARPEGE (from Météo-France,                  mosphere is parameterized using the total column water
15 km grid spacing projected on a 40 km grid; Courtier et al.,        vapour content (TCWV) forecast by the European Cen-
1991) combined by optimal interpolation with available ob-            tre for Medium-Range Weather Forecasts (ECMWF)
servations from automatic weather stations, manual obser-             Integrated Forecasting System (IFS), the ozone amount
vations carried out in the climatological network and in ski          from the Total Ozone Mapping Spectrometer clima-
resorts, remotely sensed cloudiness and atmospheric upper-            tology, a constant visibility and the surface albedo
level soundings. In particular, the incoming shortwave and            taken from the LSA SAF albedo product (Geiger et al.,
longwave fluxes are computed with the radiation scheme                2008a). In the cloudy-sky method, derived from Gau-
from Ritter and Geleyn (1992), using as first guess vertical          tier et al. (1980) and Brisson et al. (1999), the top-
profiles of temperature and humidity from ARPEGE fore-                of-atmosphere reflectance observed by MSG/SEVIRI is
casts, atmospheric soundings; a guess of cloudiness based on          used in addition to the former set of variables to apply
the analysed vertical humidity profile; and a cloud mask de-          a simple physical model of radiative transfer. Contrary
tected by satellite (Derrien et al., 1993).                           to the Heliomont solar irradiance product also derived
   In this study, we used SAFRAN reanalyses from 1 Au-                from MSG data (Stöckli, 2013; Castelli et al., 2014),
gust 2010 to 31 July 2014. For comparisons to in situ irra-           the DSSF is not down-scaled over complex terrain, and
diance observations, the reanalyses were interpolated at the          thus not corrected for local topography effects. The tar-
exact elevation of the stations, through a weighted mean of           get accuracy of the DSSF is 10 % or 20 W m−2 for val-
SAFRAN reanalyses at the two closest elevation levels in the          ues lower than 200 W m−2 (Trigo and Viterbo, 2009).
massif considered. For La Pesse station in Jura (Fig. 1a),
                                                                    – LW↓ irradiance: DSLF
the extension of SAFRAN to mid-altitude French massifs
                                                                      The algorithm to estimate the DSLF is described in de-
(Lafaysse et al., 2013) was used. For Carpentras station, on
                                                                      tail by Trigo et al. (2010). It consists of a modified ver-
a plain (Fig. 1a), the SAFRAN-France extension (Quintana-
                                                                      sion of the bulk parameterization of Prata (1996), ini-
Seguí et al., 2008) was considered. For distributed compar-
                                                                      tially developed for clear skies only. It relies on a formu-
isons and for the atmospheric forcing of distributed snow-
                                                                      lation of the effective emissivity and temperature of the
pack simulations, the reanalyses at massif-scale in the French
                                                                      atmospheric layer above the surface, using the TCWV,
Alps and in the Pyrenees were interpolated over the 0.025◦
                                                                      2 m temperature (T2 m ) and 2 m dew point (Td2 m ) fore-
grid of the AROME forcing, within SAFRAN massifs, simi-
                                                                      cast by the ECMWF IFS. The formulation parameters
larly to Quéno et al. (2016) and Vionnet et al. (2016), follow-
                                                                      are calibrated for clear-sky and overcast conditions in-
ing the method described in Vionnet et al. (2012).
                                                                      dependently. The MSG/SEVIRI cloud mask (Derrien
                                                                      and Le Gléau, 2005) is thus the only observation used,
2.2.3   LSA SAF products
                                                                      to distinguish clear-sky and cloudy-sky situations. In
                                                                      the case of partly cloudy situations, the average of both
The LSA SAF is a project supported by the European Organ-
                                                                      terms is taken. The DSLF can therefore be described
isation for the Exploitation of Meteorological Satellites (EU-
                                                                      more accurately as a longwave irradiance parameteriza-
METSAT) and a consortium of European National Meteoro-
                                                                      tion using satellite observations of the cloud mask rather
logical Services, with the purpose of using remotely sensed
                                                                      than a satellite product. The DSLF is not down-scaled
data to determine land surface variables (Trigo et al., 2011).
                                                                      over complex terrain, and thus not corrected for local
In particular, it provides estimates of the downward surface
                                                                      topography effects. The target accuracy of the DSLF is
shortwave flux (DSSF) and the downward surface longwave
                                                                      10 % (Trigo and Viterbo, 2009).
flux (DSLF), derived from the Spinning Enhanced Visible
and Infrared Imager (SEVIRI) radiometer on board the MSG
geostationary satellite (Schmetz et al., 2002). They are gen-

Hydrol. Earth Syst. Sci., 24, 2083–2104, 2020                                  www.hydrol-earth-syst-sci.net/24/2083/2020/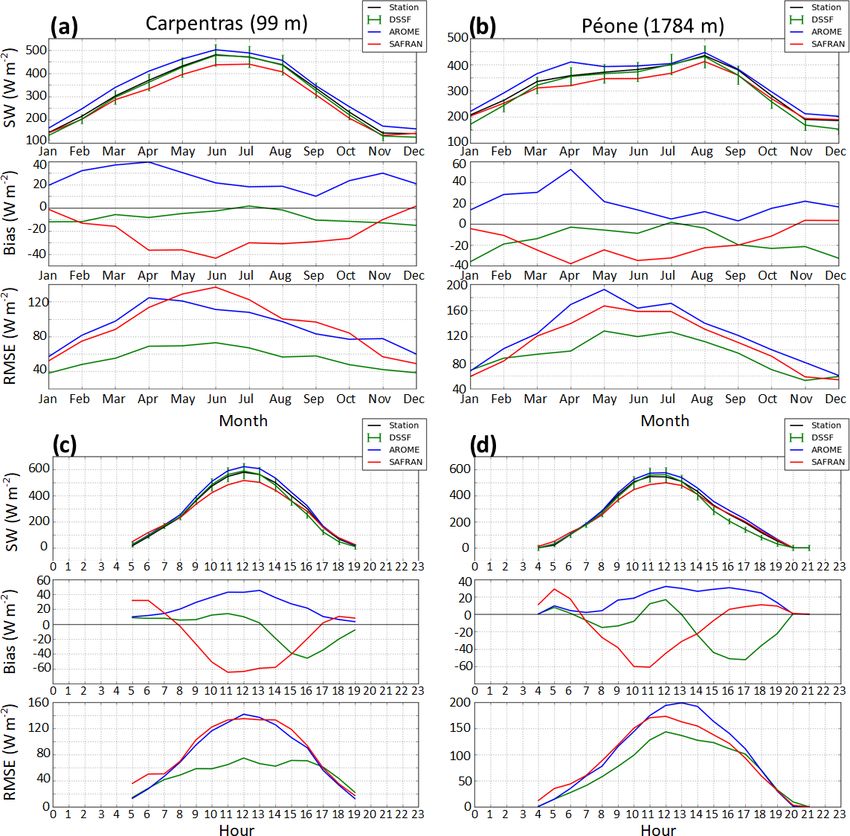
L. Quéno et al.: Satellite-derived products of solar and longwave irradiances used for snowpack modelling                  2087

2.2.4   New DSLF product using AROME forecasts                    erence station for SW↓ and LW↓ measurements in France.
                                                                  These stations and their characteristics are listed in Table 1.
The DSLF relies on the ECMWF IFS forecasts of TCWV,                  Irradiance measurements are scarce in mountainous ter-
T2 m and Td2 m . These atmospheric variables have a strong        rain and their quality is often lower than plain measure-
dependence on altitude and a strong spatial variability in        ments, due to the difficulty of maintaining these stations and
mountainous terrain. The 16 km horizontal resolution of the       the possible occurrence of frost or snow on the sensors in
ECMWF IFS hardly represents this spatial variability in the       winter (Lapo et al., 2015a). The pyranometers from Météo-
Alps and the Pyrenees, despite a constant lapse rate applied      France network (Kipp & Zonen CM5, CM6B and CM11)
for grid elevation correction. Consequently, we developed a       meet the quality standards of the World Meteorological Or-
new DSLF product using the same algorithm (Trigo et al.,          ganization (WMO, 2014) and hence an uncertainty of hourly
2010) depending on the cloud mask (Derrien and Le Gléau,          total SW↓ irradiance of ±10 % (Leroy and Leches, 2014).
2005), but replacing ECMWF forecasts with AROME fore-             Due to their altitude, the maintenance may not be systemati-
casts at 2.5 km resolution, which provides a finer representa-    cally weekly so that uncertainties of ±10 % are probably too
tion of the topography. Air temperature and dew point were        optimistic. The station of Carpentras, on a plain, is equipped
taken at 20 m above the ground in the archive of the AROME        with the pyranometer Kipp & Zonen CM21 and the pyrge-
operational forecast. This height corresponds approximately       ometer Kipp & Zonen CG4. This station is a reference station
to the height of the first prognostic level in the operation      for radiation measurements, as it is part of the Baseline Sur-
version of AROME over the period 2010–2014 (Seity et al.,         face Radiation Network (BSRN; Ohmura et al., 1998): the
2011). The use of AROME also implies a better agreement of        uncertainties are ±3 % for SW↓ and ±5 % for LW↓. At Col
the atmospheric forecast resolution (2.5 km) with the cloud       de Porte where the pyranometer Kipp & Zonen CM14 and
mask and final product resolution (3 km).                         the pyrgeometer Kipp & Zonen CG4 undergo regular main-
   The new product was generated on the exact same grid           tenance, Morin et al. (2012) reported total uncertainty on the
as DSLF, in order to enable direct comparisons, so AROME          order of ±10 % (including site-dependent uncertainties). The
forecasts were interpolated over the LSA SAF grid through         AWSs of Bassiès (Szczypta et al., 2015), Argentière glacier
a closest-neighbour method (similar grid spacing). The pos-       and Saint-Sorlin glacier (data from GLACIOCLIM pro-
sible altitude difference between AROME grid points and           gram, https://glacioclim.osug.fr, last access: 20 April 2020)
LSA SAF grid points was mitigated thanks to a vertical tem-       have Kipp & Zonen CM3 pyranometers and CG3 pyrgeome-
perature gradient of −6.5 K km−1 according to the Interna-        ters, classified as moderate quality after WMO’s standards
tional Standard Atmosphere, similarly to the method applied       (WMO, 2014), for which the manufacturer reports a daily
to ECMWF IFS forecasts. The algorithm was applied to the          total accuracy of ±10 %. The uncertainties have not been es-
new DSLF on the LSA SAF grid over the domains of study            timated at these stations. They are possibly higher than 10 %
(Fig. 1), from 1 August 2010 to 31 July 2014. Hereafter, this     because of the difficulty of maintaining AWSs in complex
product is referred to as DSLFnew.                                environments, particularly in winter. WMO (2014) indicates
                                                                  uncertainties up to ±20 % for hourly totals for this kind of
                                                                  instruments. The results at these stations are indicative for
2.2.5   In situ irradiance observations                           high altitudes but shall be considered carefully. Table 1 sum-
                                                                  marizes the measurement uncertainties at each station.
To assess the distributed irradiance datasets, ground mea-           SW↓ and LW↓ irradiances from LSA SAF products,
surements of SW↓ and LW↓ were extracted from the Météo-           AROME forecasts and SAFRAN reanalyses were evaluated
France station network and additional automatic weather           using these in situ measurements. The altitude of the grid
stations (AWSs). Stations with altitude higher than 1000 m        points associated with each station is reported in Table 1. Bi-
were selected. As elevation influences incoming radiation         ases and root mean square errors (RMSEs) were computed in
(Oliphant et al., 2003), stations were not used for evaluation    absolute and relative values (with the mean of observations
if the difference between the station elevation and the eleva-    as reference). To account for topographic shading on irra-
tion of the four closest AROME and LSA SAF grid points            diance in situ measurements, a topographic mask was com-
was higher than 300 m. As elevation differences up to 300 m       puted with a 5◦ interval size after a 25 m resolution digital
may have an influence on the comparisons, the altitudes of        elevation model (DEM) of IGN (French National Institute
the grid points associated with each station are listed in Ta-    of Geographical and Forest Information) and applied to the
ble 1 and should be kept in mind when analysing the eval-         SW↓ irradiance products at all stations except Andorre and
uation statistics. The resulting observation database, repre-     Envalira, because the DEM of IGN was only available on
sented in Fig. 1, includes 14 mountain SW↓ stations (8 in the     the French territory. The SW↓ irradiance products were only
French Alps, 1 in Jura and 5 in the Pyrenees) and 4 moun-         evaluated when the sun was above the horizon, or when the
tain LW↓ stations (3 in the French Alps and 1 in the Pyre-        observed value was higher than 20 W m−2 at Andorre and
nees). An additional station located on a plain at Carpentras     Envalira stations (to discard periods when the sun is masked
(Fig. 1) has been included in the database since it is the ref-

www.hydrol-earth-syst-sci.net/24/2083/2020/                                    Hydrol. Earth Syst. Sci., 24, 2083–2104, 2020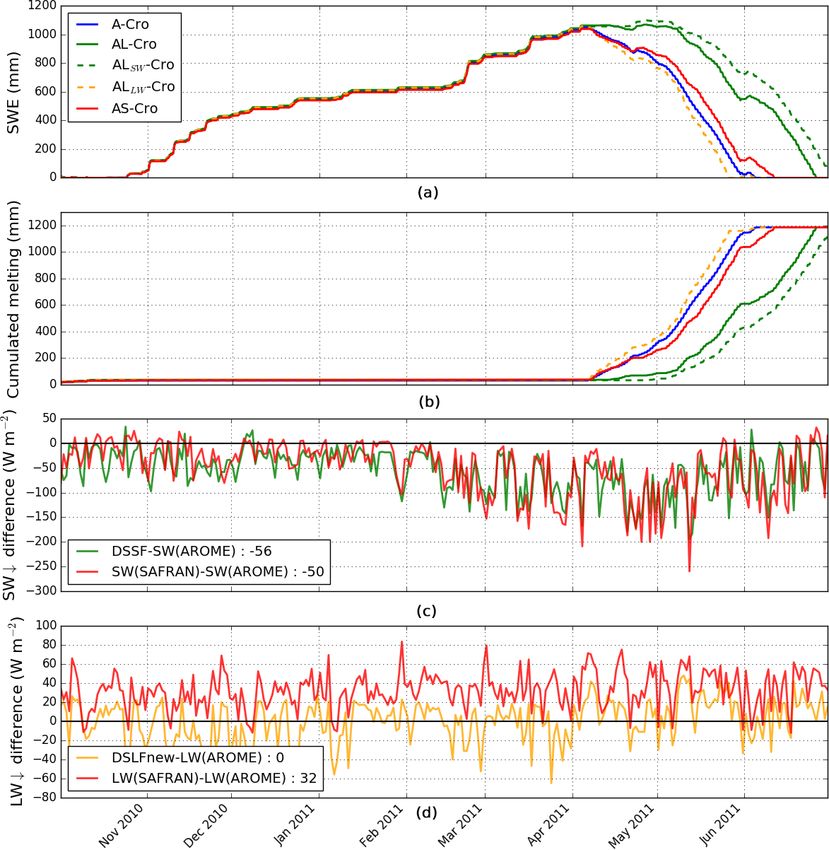
2088 L. Quéno et al.: Satellite-derived products of solar and longwave irradiances used for snowpack modelling
by the terrain). The LW↓ irradiance products were evaluated
best metrics are given in bold. The mountain range of each station is indicated by A (Alps), J (Jura) or P (Pyrenees). Asterisks indicate official uncertainties which seem too optimistic.
of hourly SW↓ observations (N), mean observation, bias and RMSE for DSSF, AROME and SAFRAN computed when the sun is not masked, from 1 August 2010 to 31 July 2014. The
Table 1. List of ground stations, associated mountain range, altitude of the observation, altitude of the associated LSA SAF and AROME grid points, measurement uncertainties, number
Saint-Sorlin glacier (A)
Envalira (P)
Argentière glacier (A)
Péone (A)
Aston (P)
Bassiès (P)
Col des Saisies (A)
Iraty Orgambide (P)
Col de Porte (A)
Villar-St-Pancrace (A)
St-Jean-St-Nicolas (A)
La Pesse (J)
Andorre (P)
Lus-la-Croix-Haute (A)
Carpentras (plains)
(mountain range)
Station
by day and night.
2.3 Snowpack datasets
The impact of the different irradiance datasets on distributed
snowpack simulations is assessed using the snowpack model
Crocus with different atmospheric forcings. These simula-
±20 %
±10 %∗
±20 %
±10 %∗
±10 %∗
±20 %
±10 %∗
±10 %∗
±10 %
±10 %∗
±10 %∗
±10 %∗
±10 %∗
±10 %∗
±3 %
SW↓
Uncertainties
tions are compared to in situ measurements of snow depth.
±20 %
X
±20 %
X
X
±20 %
X
X
±10 %
X
X
X
X
X
±5 %
LW↓
2.3.1 Snowpack model: Crocus
Snowpack simulations driven by different irradiance datasets
were performed with the detailed snow cover model Cro-
2700 m
2550 m
2470 m
1784 m
1781 m
1650 m
1633 m
1427 m
1325 m
1310 m
1210 m
1133 m
1105 m
1059 m
99 m
Obs.
cus (Brun et al., 1992; Vionnet et al., 2012) coupled with
the ISBA land surface model within the SURFEX simulation
platform (Masson et al., 2013), to fully simulate the inter-
LSA SAF
Altitude
2611 m
2577 m
2511 m
1754 m
1660 m
1785 m
1595 m
1354 m
1310 m
1412 m
1197 m
1131 m
1073 m
1040 m
actions between snowpack and soil. SURFEX/ISBA–Crocus
88 m
(called Crocus hereafter) simulates the evolution of the snow-
pack physical properties along its stratigraphy, under given
2581 m
2394 m
2694 m
1704 m
1753 m
1714 m
1643 m
1246 m
1284 m
1521 m
1315 m
1119 m
1385 m
1081 m
atmospheric forcing data (temperature and specific humidity
ARO.
99 m
at a given height above the surface, wind speed at a given
height above the surface, SW↓ and LW↓ irradiance, solid
10 637
11 565
16 873
13 859
11 850
16 149
12 011
13 293
15 576
13 616
18 239
9755
4740
7499
6020
and liquid precipitation).
N
The simulations were carried out over the French Alps and
Pyrenees domains (Fig. 1), on the AROME regular latitude–
Mean SW↓
(W m−2 )
longitude grid at 0.025◦ resolution (Sect. 2.2.1) from 1 Au-
430
370
394
330
325
378
355
273
392
445
408
297
378
360
322
gust 2010 to 31 July 2014. The effects of aspect and slope
on incoming solar irradiance were not taken into account,
because the snowpack is simulated over flat terrain, and the
−43 (−10 %)
−60 (−15 %)
−17 (−4 %)
−28 (−8 %)
−18 (−6 %)
–10 (–3 %)
–13 (–4 %)
–33 (–7 %)
–13 (–3 %)
–8 (–2 %)
–8 (–2 %)
interactions with the vegetation and the parameterization of
16 (5 %)
18 (4 %)
0 (0 %)
8 (2 %)
fractional snow cover were not activated, because the eval-
DSSF
uation observations are located in flat and open fields. This
SW↓ bias (W m−2 )
configuration has already been used in Vionnet et al. (2016)
–3 (–1 %)
85 (23 %)
61 (19 %)
29 (11 %)
96 (24 %)
61 (14 %)
38 (13 %)
79 (21 %)
78 (22 %)
24 (6 %)
33 (8 %)
15 (4 %)
19 (6 %)
36 (9 %)
25 (8 %)
and Quéno et al. (2016).
ARO.
Except for incoming radiative fluxes, the atmospheric
forcing of the snowpack simulations was built with AROME
forecasts (Sect. 2.2.1). The radiative components of the forc-
−112 (−25 %)
−44 (−10 %)
−47 (−13 %)
−61 (−15 %)
−42 (−11 %)
−36 (−9 %)
−21 (−6 %)
−13 (−3 %)
−24 (−7 %)
ings were extracted from the different irradiance datasets:
−7 (−2 %)
–8 (–2 %)
–6 (–2 %)
34 (10 %)
16 (4 %)
3 (1 %)
(a) AROME irradiance forecasts (simulations named A-Cro
SAFR.
hereafter), (b) SAFRAN irradiance reanalyses (simulations
named AS-Cro hereafter), (c) DSSF and DSLFnew (simu-
lations named AL-Cro hereafter), (d) DSSF and AROME
146 (34 %)
120 (32 %)
100 (30 %)
140 (43 %)
138 (37 %)
107 (30 %)
110 (40 %)
125 (28 %)
117 (31 %)
116 (32 %)
173 (44 %)
134 (34 %)
LW↓ irradiance (simulations named ALSW -Cro hereafter),
99 (24 %)
85 (29 %)
58 (18 %)
and (e) DSLFnew and AROME SW↓ irradiance (simulations
DSSF
named ALLW -Cro hereafter). In order to include DSSF and
SW↓ RMSE (W m−2 )
DSLFnew products in AROME forcing, the interpolation on
161 (37 %)
157 (42 %)
177 (45 %)
139 (42 %)
176 (54 %)
179 (47 %)
146 (41 %)
136 (50 %)
202 (52 %)
167 (38 %)
140 (34 %)
129 (44 %)
169 (45 %)
174 (48 %)
the AROME grid was made to minimize the effect of ele-
96 (30 %)
vation difference on the incoming radiative fluxes. Among
ARO.
the four nearest LSA SAF grid points, the grid point with
the minimum altitude difference with AROME grid point
165 (42 %)
128 (33 %)
153 (35 %)
132 (36 %)
125 (38 %)
163 (50 %)
163 (43 %)
132 (37 %)
121 (44 %)
191 (43 %)
146 (36 %)
130 (44 %)
155 (41 %)
140 (39 %)
99 (31 %)
was chosen. Similarly to Hinkelman et al. (2015), SW↓ ir-
SAFR.
radiances were not modified, whereas a vertical gradient of
−29 W m−2 km−1 (Marty et al., 2002) was applied to LW↓
Hydrol. Earth Syst. Sci., 24, 2083–2104, 2020 www.hydrol-earth-syst-sci.net/24/2083/2020/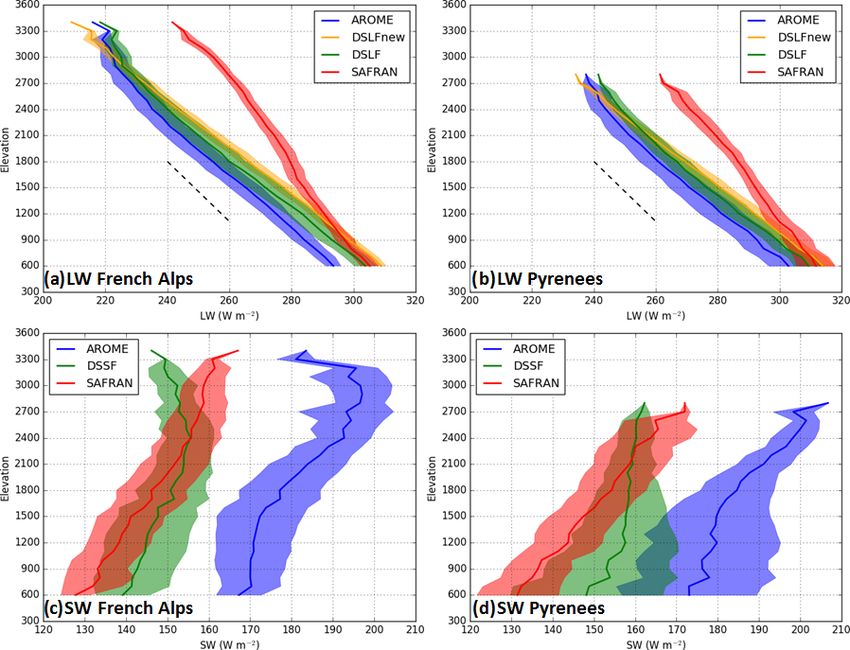
L. Quéno et al.: Satellite-derived products of solar and longwave irradiances used for snowpack modelling                   2089

Figure 2. Bias and RMSE of SW↓ irradiance products (DSSF in green, AROME in blue, SAFRAN in red) compared to stations organized
by domain (a), range of altitude (b) and all stations (c).

irradiances to mitigate the remaining differences in altitude.    3     Evaluation of irradiance products over the Alps and
The different simulations are summarized in Table 2.                    the Pyrenees

2.3.2   In situ snowpack observations
                                                                  3.1    Comparisons with in situ measurements
To assess the quality of Crocus simulations, an observational
dataset of snow depth measurements was constituted in the         The SW↓ error statistics for all stations are listed in Ta-
French Alps and the Pyrenees, within SAFRAN massifs.              ble 1. For most stations, DSSF shows the lowest biases with
Only stations with less than 150 m elevation difference to the    an underestimation of SW↓. Biases are also mostly negative
model topography were selected, in order to use the same          for SAFRAN, while AROME exhibits strong positive biases
dataset as Quéno et al. (2016) and Vionnet et al. (2016). This    at most of the stations. DSSF exhibits the lowest RMSE at
dataset contains a total of 172 stations (89 in the French Alps   almost all stations. For all products, the lowest RMSE is
and 83 in the Pyrenees) with daily manual measurements at         reached at Carpentras on the plain. These metrics are sum-
ski resorts (at 06:00 UTC) and daily automatic measurements       marized in Fig. 2. The distinction by domain (French Alps
by ultra-sonic sensors at high-altitude sensors, as described     and Pyrenees) shows that the three products have very sim-
in detail in Vionnet et al. (2016) for the French Alps and in     ilar RMSE over both domains, which highlights the consis-
Quéno et al. (2016) for the French and Spanish Pyrenees.          tency of these error statistics. The distinction by range of al-
                                                                  titude (1000–1500, 1500–2000, > 2000 m) shows increasing
                                                                  RMSE with altitude for DSSF, while RMSE are higher but
                                                                  more constant for AROME and SAFRAN. The increasing
                                                                  RMSE of DSSF is mainly due to stronger negative biases at

www.hydrol-earth-syst-sci.net/24/2083/2020/                                     Hydrol. Earth Syst. Sci., 24, 2083–2104, 2020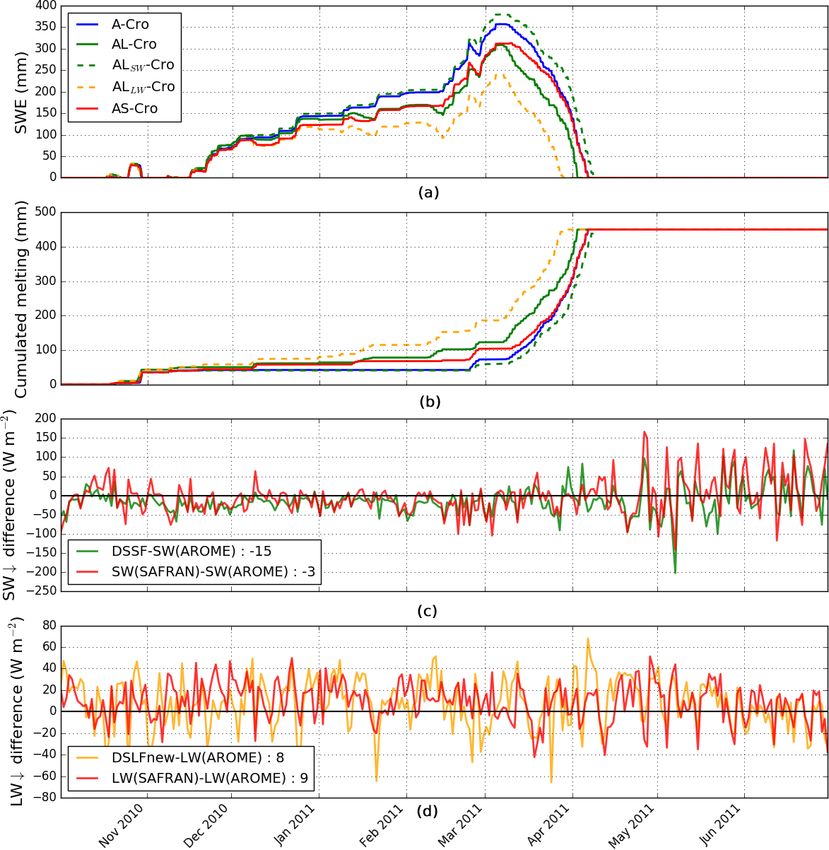
2090          L. Quéno et al.: Satellite-derived products of solar and longwave irradiances used for snowpack modelling

Table 2. Characteristics of the snowpack simulations.

               Simulation names                          A-Cro    AS-Cro     AL-Cro       ALSW -Cro     ALLW -Cro
               Atmospheric forcing (except irradiance)                        AROME
               SW↓ forcing                               AROME    SAFRAN     DSSF    DSSF               AROME
               LW↓ forcing                               AROME    SAFRAN     DSLFnew AROME              DSLFnew

Figure 3. Bias and RMSE of LW↓ irradiance products (DSLF in green, DSLFnew in orange, AROME in blue, SAFRAN in red) compared
to each station (a) and all stations (b).

high altitudes (−39 W m−2 above 2000 m against −8 W m−2              Figure 3 shows the biases and RMSEs of the different
between 1000 and 1500 m). SAFRAN biases are negative at           datasets of incoming LW↓ (DSLF, DSLFnew, AROME and
all altitudes while AROME biases are positive at all altitudes.   SAFRAN) at the five LW↓ stations and the overall error
Overall, DSSF exhibits the best performance with a relative       statistics. In this figure, stations are ordered by altitude. In
bias of −4 % and a relative RMSE of 33 %. SAFRAN has a            mountains, DSLF, DSLFnew and AROME have a negative
relative bias of −7 % and a relative RMSE of 40 %. Finally,       bias, while SAFRAN bias tends to increase with altitude. At
AROME exhibits the strongest relative bias (+12 %) and the        low elevation (Carpentras), the best performance is in favour
highest relative RMSE (43 %).                                     of DSLFnew with a bias of +4 W m−2 (+1 %) and a RMSE
                                                                  of 16 W m−2 (5 %), which falls within the range of uncer-

Hydrol. Earth Syst. Sci., 24, 2083–2104, 2020                                   www.hydrol-earth-syst-sci.net/24/2083/2020/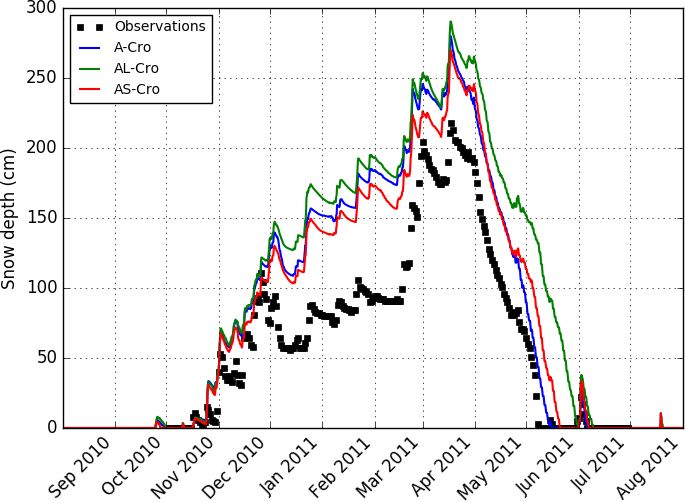
L. Quéno et al.: Satellite-derived products of solar and longwave irradiances used for snowpack modelling                       2091

Figure 4. Mean yearly cycles of SW↓ irradiance products (DSSF in green, AROME in blue, SAFRAN in red), ground measurements (in
black), bias and RMSE over the 2010–2014 period at (a) Carpentras and (b) Péone. Mean daily cycles of the same products, bias and RMSE
over the 2010–2014 period at (c) Carpentras and (d) Péone.

tainties of the sensor. At three mountain stations (Col de           mation of LW↓ by DSLF, DSLFnew and AROME. The per-
Porte, Bassiès and Argentière glacier), the lowest bias and          formance of LSA SAF products and models is also clearly
RMSE are reached by SAFRAN, while AROME has the                      better in terms of LW↓ than SW↓, because of lower biases
lowest RMSE at the Saint-Sorlin glacier. Overall, AROME              and RMSE.
exhibits the strongest negative relative bias (−6 %) and the            The yearly cycles of SW↓ irradiances are illustrated at
highest relative RMSE (12 %). DSLF and DSLFnew have                  Carpentras for reference (Fig. 4a) and at Péone mountain sta-
equivalent error statistics with a relative bias of −3 % and         tion (Fig. 4b). They show higher RMSE in spring and sum-
a relative RMSE of 11 %. Finally, SAFRAN has a relative              mer for each dataset, the lowest RMSE for DSSF and the
bias of +1 % and a relative RMSE of 11 %. These global               highest RMSE for AROME during the whole year, except in
error statistics are close to the sensor uncertainties in moun-      December and January when the three products have equiv-
tains, which does not enable “best product” to be chosen.            alent RMSEs. This trend was found to be similar at all sta-
However, some trends are identified, such as an underesti-           tions. No specific trend was observed for the bias. The SW↓

www.hydrol-earth-syst-sci.net/24/2083/2020/                                        Hydrol. Earth Syst. Sci., 24, 2083–2104, 2020
2092 L. Quéno et al.: Satellite-derived products of solar and longwave irradiances used for snowpack modelling
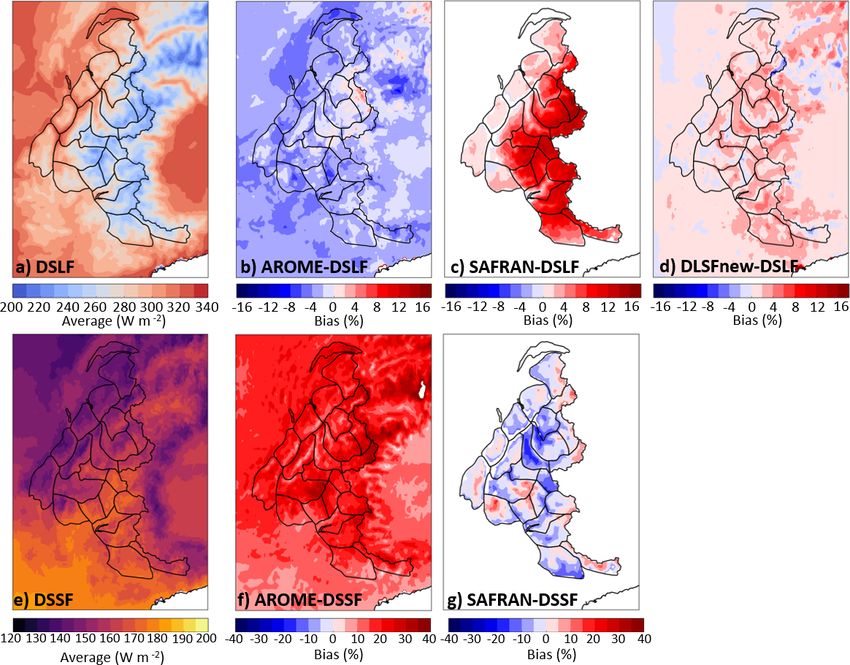
Figure 5. (a) Average of the DSLF from 1 August 2010 to 31 July 2014 in the French Alps, and relative difference with the DSLF
for (b) AROME, (c) SAFRAN and (d) DSLFnew. (e) Average of the DSSF, and relative difference with the DSSF for (f) AROME
and(g) SAFRAN.
daily cycles (Fig. 4c for Carpentras and Fig. 4d for Péone) central range of the Pyrenees (Fig. 6a). AROME presents
show a lower RMSE for DSSF in the middle of the day. The a moderate negative bias as compared to the DSLF, both
SAFRAN cycle is not marked enough (positive biases in the in the Alps (Fig. 5b) and in the Pyrenees (Fig. 6b), while
morning and evening, negative biases in the middle of the SAFRAN presents a strong positive bias, particularly in the
day). AROME overestimates SW↓ all the time. DSSF repre- highest areas of the Alps (Fig. 5c) and the Pyrenees (Fig. 6c).
sents the diurnal cycle well, with an underestimation in the DLSFnew presents a slight positive bias over most of the
afternoon. These trends were also highlighted at the other domains, except over the highest peaks where the bias is
mountain stations. The study of the daily and yearly cycles slightly negative (Figs. 5d and 6d).
of LW↓ irradiances did not indicate any particular trend for The DSSF exhibits a lower correlation with the topogra-
metrics following the month or the hour (not shown). phy (Figs. 5e and 6e). For given sky conditions, the SW irra-
diance increases with the elevation as the atmospheric trans-
3.2 Spatial comparisons of the distributed products missivity increases. But the annual mean of the DSSF fol-
lows more regional patterns of cloud cover than elevation
Spatial comparisons of the different irradiance products were patterns. For example, in the French Alps, Fig. 5e shows a
carried out over the two domains. DSSF and DSLF were north-west–south-east gradient of increasing DSSF: south-
taken as references. The spatial distributions of their an- eastern massifs are often shielded by north-western massifs
nual mean computed using data from 1 August 2010 to in the most frequent case of west and north-west disturbed
31 July 2014 and the differences with the other irradiance flows. A similar gradient of precipitation was shown in Du-
products are shown in Fig. 5 for the French Alps and in Fig. 6 rand et al. (2009b). The heterogeneity of DSSF is even more
for the Pyrenees. marked in the Pyrenees (Fig. 6e) where the west–east chain
The DSLF exhibits a strong correlation with the altitude, acts as an orographic barrier to the prevailing northwester-
with a decreasing LW irradiance towards the highest ele- lies coming from the Atlantic Ocean (Quéno et al., 2016).
vations, i.e. the east of the French Alps (Fig. 5a) and the A clear discontinuity appears between the French Pyrenees,
Hydrol. Earth Syst. Sci., 24, 2083–2104, 2020 www.hydrol-earth-syst-sci.net/24/2083/2020/L. Quéno et al.: Satellite-derived products of solar and longwave irradiances used for snowpack modelling 2093 Figure 6. (a) Average of the DSLF from 1 August 2010 to 31 July 2014 in the Pyrenees, and relative difference with the DSLF for (b) AROME, (c) SAFRAN and (d) DSLFnew. (e) Average of the DSSF, and relative difference with the DSSF for (f) AROME and (g) SAFRAN. where the clouds are often blocked, and the Spanish Pyre- Table 3. Mean altitudinal LW↓ gradient for AROME, SAFRAN, nees are often affected by Foehn wind and resulting clear DSLF and DSLFnew in the French Alps and the Pyrenees. sky conditions. The lowest DSSF values are found in the western part of the French Pyrenees, while the eastern part AROME SAFRAN DSLF DSLFnew is more sunny due to the abating Atlantic influence and a French Alps −29 −21 −31 −36 Mediterranean climate. AROME presents a strong positive Pyrenees −31 −23 −32 −37 bias (Figs. 5f and 6f), locally higher than 30 % over the high- est peaks, and still higher than 15 % in many plain areas. The SAFRAN bias is very variable from one massif to another (Figs. 5g and 6g). A strong negative bias for SAFRAN can the Pyrenees. As a reference, the altitudinal gradient for an- be noticed in the south-western massifs of the Spanish Pyre- nual LW↓ means of −29 W m−2 km−1 found by Marty et al. nees (Fig. 6g), highlighting a poor representation of the oro- (2002) in the Swiss Alps is plotted in dashed lines, while Ta- graphic blocking as already noticed in Quéno et al. (2016). ble 3 lists the mean altitudinal gradient for each dataset in The dependence of the different irradiance products on the both domains. All datasets present a steady decrease in LW↓ altitude was further explored with the study of altitudinal gra- with altitude and are close to each other below approximately dients. Figure 7 represents the vertical evolution of the LW↓ 1200 m. For higher elevations, SAFRAN annual mean value and SW↓ averaged over the SAFRAN massifs of the French is significantly stronger than AROME, DSLF and DSLFnew, Alps and the Pyrenees by steps of 100 m of elevation over due to a lower vertical gradient (Table 3). We showed in the whole study period, together with the associated standard Sect. 3.1 that AROME, DSLF and DSLFnew had a negative deviations. bias at the four mountain stations. This effect may come from The strong dependency of LW↓ irradiance on altitude is a vertical gradient that is too strong (Table 3). DSLFnew is confirmed in Fig. 7a for the French Alps and Fig. 7b for larger than AROME and DSLF at all altitudes below approx- www.hydrol-earth-syst-sci.net/24/2083/2020/ Hydrol. Earth Syst. Sci., 24, 2083–2104, 2020
2094          L. Quéno et al.: Satellite-derived products of solar and longwave irradiances used for snowpack modelling

Figure 7. Vertical evolution by steps of 100 m: LW↓ products (a) in the French Alps and (b) in the Pyrenees, and SW↓ products (c) in the
Alps and (d) in the Pyrenees, averaged over SAFRAN massifs from 1 August 2010 to 31 July 2014, with LSA SAF in green, AROME in
blue, SAFRAN in red, DSLFnew in orange. The envelopes represent the mean ± the standard deviation. The dashed black line represents the
climatological LW↓ vertical gradient of −29 W m−2 km−1 from Marty et al. (2002).

imately 2900 m in the French Alps (Fig. 7a) and 2200 m in             ilar values for SW↓ (Fig. 7c and d). This spatial variability
the Pyrenees (Fig. 7b). It gets lower at the highest altitudes        at a given altitude is particularly marked at low- and mid-
due to a stronger vertical gradient. The stronger vertical gra-       altitudes (< 1800 m) in the Pyrenees for AROME and DSSF,
dient of DSLFnew compared to DSLF is the confirmation                 reflecting a good representation of the strong climate het-
that the use of forecasts of higher resolution for the algorithm      erogeneity between French and Spanish foothills. SAFRAN,
takes the topography into account more. The excessive ver-            which gives homogeneous analyses for each massif, does not
tical gradient may originate from the cold bias of AROME              account for the spatial variability within the massif as is the
near-surface temperatures, enhanced with the altitude (Vion-          case for AROME and DSSF.
net et al., 2016), leading to a strong underestimation of the
fluxes by DSLFnew at the highest altitudes.
   In terms of SW↓ irradiance, Fig. 7c and d highlight that           4   Impact of the irradiance products on snowpack
AROME fluxes are significantly stronger than SAFRAN and                   simulations
DSSF at all altitudes. SAFRAN is marked by an increase
in incoming SW↓ fluxes with altitude, while AROME and                 Snowpack simulations were performed over four winters
DSSF present a more variable evolution, and particularly a            from 2010 to 2014 to assess the impact of the different ir-
decrease in the fluxes at the highest altitudes in the Alps           radiance datasets as radiative forcing. Table 4 summarizes
(Fig. 7c). This decrease may reflect the more frequent pres-          the bias and RMSE for the three simulations (A-Cro, AL-Cro
ence of clouds blocked by the highest peaks. Furthermore,             and AS-Cro) compared at 172 stations of the French Alps and
these figures underline a weaker dependency of SW↓ irra-              the Pyrenees over the period. The error statistics are aggre-
diance with altitude than LW↓ irradiance. Indeed, the stan-           gated by domain and elevation range. As shown by Vionnet
dard deviation of LW↓ at a given altitude is small com-               et al. (2016) and Quéno et al. (2016), A-Cro overestimates
pared to the total variation of the mean LW↓ with altitude            the snow depth, with marked RMSE. This is due to several
for all products (Fig. 7a and b), whereas they can reach sim-         different reasons, further discussed in Sect. 5.3. The use of

Hydrol. Earth Syst. Sci., 24, 2083–2104, 2020                                        www.hydrol-earth-syst-sci.net/24/2083/2020/
L. Quéno et al.: Satellite-derived products of solar and longwave irradiances used for snowpack modelling 2095
Table 4. Bias and root mean square error (RMSE) of snow depth at 172 stations of the French Alps and the Pyrenees over the period 2010–
2014 for simulations A-Cro, AL-Cro and AS-Cro. The best metrics are given in bold.
Domain and Bias (cm) RMSE (cm)
elevation range A-Cro AL-Cro AS-Cro A-Cro AL-Cro AS-Cro
French Alps 38 43 29 62 72 59
< 1800 m 31 29 24 52 53 49
[1800, 2200 m) 26 26 12 58 66 59
≥ 2200 m 61 80 53 79 99 72
Pyrenees 55 70 51 89 106 88
< 1800 m 66 72 59 97 105 91
[1800, 2200 m) 46 63 43 85 105 86
≥ 2200 m 57 78 56 87 109 89
DSSF and DSLFnew as radiative forcing (AL-Cro) increases
the bias and the RMSE in the French Alps and the Pyre-
nees. On the contrary, the use of SAFRAN radiative forc-
ing (AS-Cro) gives a lower bias and RMSE in both massifs.
The highest biases and RMSE are reached at high altitudes
(≥ 2200 m) by AL-Cro, because of the marked underestima-
tion of DSSF and DSLFnew at these elevations. The use of
SAFRAN irradiances (AS-Cro) tends to reduce the biases of
A-Cro, particularly at the lowest elevations where the higher
LW↓ increases the melting during the whole season. Above
1800 m, the RMSE is not reduced by the use of SAFRAN
irradiances (except above 2200 m in the Alps), because the
higher LW↓ enhances the melting in winter and the lower
SW↓ reduces the melting in spring, which increases the dis-
persion around the annual bias.
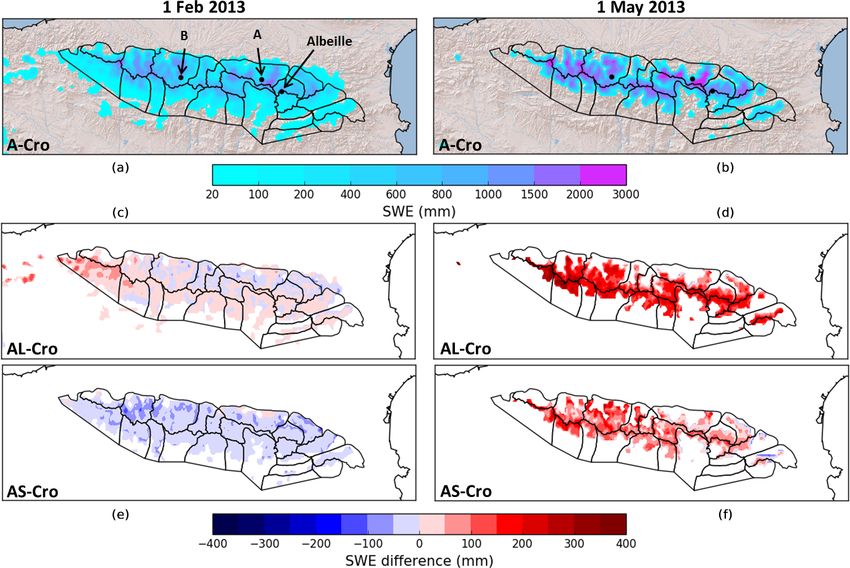
Figure 8 provides an example of snow depth evolution Figure 8. Snow depth evolution at Albeille station (2195 m, French
at Albeille station in the French Pyrenees (2195 m; location Pyrenees) during winter 2010–2011: observations in black, A-Cro
shown in Fig. 9) during one year (2010–2011), as observed simulation in blue, AL-Cro in green, AS-Cro in red.
and simulated in the three configurations. The behaviour of
the models at this station is typical of most of the stations.
The three simulations overestimate the snow depth. AL-Cro sents the SWE (snow water equivalent) simulated by A-Cro
presents the strongest positive bias during the whole season, taken as a reference on 1 February 2013 during the accumu-
because of lower values of LW↓ and SW↓. On the contrary, lation period and on 1 May 2013 during the melting period,
AS-Cro exhibits a lower overestimation than the other sim- and the differences between AL-Cro, AS-Cro and this ref-
ulations during all of the accumulation period (until mid- erence at the same dates. The differences with AL-Cro are
March approximately). It can be explained by the values of generally between −50 and +50 mm on 1 February 2013.
SAFRAN LW↓ irradiance, which are higher than the other AS-Cro exhibits lower SWE values at this date, due to its
datasets. In winter, SW↓ irradiances are low and the snow higher LW↓ irradiance. However, on 1 May 2013, both sim-
albedo is high: their contribution to the surface energy bud- ulations exhibit higher SWE values than A-Cro almost every-
get is much lower than in spring. Thus, LW↓ irradiances have where, with differences mostly higher than 200 mm, locally
a higher relative contribution during the accumulation pe- reaching 400 mm, due to lower SW↓ irradiances.
riod. However, during the melting period (from mid-March The impact of the radiative forcing on SWE simulations
to mid-May here), the contribution of SW↓ irradiances is was further studied at two grid points in the French Pyre-
the highest, due to higher extra-terrestrial solar fluxes, longer nees: one at low altitude (point A, 1359 m) and one at high
days and lower snow albedo: because of their higher SW↓, altitude (point B, 2459 m), both located in Fig. 9. Con-
A-Cro simulations melt faster than AS-Cro, which reduces trary to snow depth, comparing SWE simulations enables
their bias. the study of the impact of the different radiative forcing
These trends can also be observed when looking at maps datasets on the snowpack mass balance with no additional
of spatially distributed snowpack simulations. Figure 9 repre- uncertainty on snow compaction. Figure 10 represents the
www.hydrol-earth-syst-sci.net/24/2083/2020/ Hydrol. Earth Syst. Sci., 24, 2083–2104, 20202096 L. Quéno et al.: Satellite-derived products of solar and longwave irradiances used for snowpack modelling Figure 9. Snow water equivalent simulated by A-Cro (a, b) on 1 February 2013 (a, c, e) and 1 May 2013 (b, d, f) over the Pyrenees. Differences between the SWE simulated by AL-Cro (c, d) and AS-Cro (e, f) with A-Cro at the same dates. Points A and B and Albeille station are indicated by black dots. simulated SWE and cumulated melting at point A during noted for AL-Cro: the lower SW↓ is not counterbalanced by the winter season 2010–2011, together with the difference the slightly higher LW↓. The peak SWE is shifted by almost in irradiance with AROME as reference. The same evolu- 1 month compared to A-Cro. Therefore, it leads to marked tions at point B are represented in Fig. 11. The relative differences in terms of cumulated melting: on 1 June 2011, impact of DSSF and DSLFnew is represented in dashed the cumulated melting for A-Cro reaches 1149 mm, i.e. al- lines (simulations ALSW -Cro and ALLW -Cro, as defined most the double of AL-Cro (613, and 433 mm for ALSW - in Table 2). At point A, melting occurs during the win- Cro). The simulation mixing DSSF and DSLFnew irradi- ter. Consequently, AS-Cro and ALLW -Cro simulations lead ances (AL-Cro) is very close to the DSSF-only simulation to lower values of SWE than A-Cro, since they both ex- (ALSW -Cro). Overall, the effect of DSSF prevails at high al- hibit higher LW↓ than AROME (+8 W m−2 for DSLFnew titude leading to a later end of the snow cover, while the effect and +9 W m−2 for SAFRAN). Thus, on 15 February 2011, of DSLFnew prevails at low altitude leading to an earlier end the cumulated melting is more than doubled for AL-Cro of the snow cover. (104 mm, and 154 mm for ALLW -Cro) compared to A-Cro (42 mm). The lower SW↓ of DSSF compared to AROME (−15 W m−2 ) implies very limited SWE differences to A- 5 Discussion Cro in the heart of the winter (same cumulated melting for A-Cro and ALSW -Cro on 15 February 2011). Similarly, the 5.1 Quality of irradiance datasets in mountainous lower SW↓ of SAFRAN (−3 W m−2 ) cannot compensate the terrain higher LW↓ during the winter. The simulation using both DSSF and DSLFnew irradiances (AL-Cro) is intermediate We presented an overview of the quality of several irradiance between both curves (ALLW -Cro and ALSW -Cro). At high datasets through an in-depth assessment of the irradiance altitude (Fig. 11), the melting period starts at the beginning fields in mountainous terrain. In terms of SW↓ irradiances, of April. Thus, there are no differences between all simu- DSSF exhibits the best metrics in mountains, particularly be- lations until then, despite strong differences in the radiative low 2000 m. Above 2000 m, its RMSE is similar to SAFRAN forcing. Snow melts slightly more slowly with SAFRAN ra- and AROME, due to a strong negative bias. AROME presents diative forcing, the lower SW↓ being counterbalanced by the systematic and large overestimations of SW↓ irradiances, higher LW↓. A marked difference in the melt timing can be contrarily to SAFRAN’s tendency to underestimate them. Hydrol. Earth Syst. Sci., 24, 2083–2104, 2020 www.hydrol-earth-syst-sci.net/24/2083/2020/
L. Quéno et al.: Satellite-derived products of solar and longwave irradiances used for snowpack modelling                           2097

Figure 10. (a) Snow water equivalent simulated by A-Cro (blue), AL-Cro (green), ALSW (dashed green), ALLW (dashed orange) and AS-
Cro (red) from 1 October 2010 to 30 June 2011 at point A in the Pyrenees (1359 m, Fig. 9). (b) Cumulated melting represented with the same
colours. (c, d) Mean daily irradiance differences with AROME for DSSF (green), DSLFnew (orange) and SAFRAN irradiances (red).

The spatial variations of SW↓ irradiances are better repre-            SW↓) at plain stations. For DSSF, we showed in this study
sented in DSSF and AROME than in SAFRAN. In terms of                   a bias of −14 W m−2 and a RMSE of 117 W m−2 (Fig. 2),
LW↓ irradiances, the obtained errors are comparable and it             while for plains, Geiger et al. (2008b), Ineichen et al. (2009)
is difficult to identify the best product. The use of forecasts at     and Cristóbal and Anderson (2013) reported biases of +2,
higher spatial resolution to compute DSLFnew enhances the              +5 and −5 W m−2 respectively, and RMSE of 87, 103 and
topographic dependence, which limits the underestimation of            65 W m−2 respectively. The higher RMSE in mountains may
LW↓ irradiance at low and mid-altitudes found with DSLF                partly be explained by higher mean values. For DSLF, we
but strengthens the negative bias at high altitude. The result-        showed in this study a bias of −8 W m−2 and a RMSE of
ing altitudinal gradient is probably too strong. It may orig-          32 W m−2 (Fig. 3), while for plains, Trigo et al. (2010) and
inate from the cold bias of AROME near-surface tempera-                Ineichen et al. (2009) reported biases of +3 and −11 W m−2
tures, enhanced with the altitude (Vionnet et al., 2016), which        respectively, and RMSE of 25 and 29 W m−2 respectively.
leads to a strong underestimation of the fluxes by DSLFnew             The error statistics for mountains are close to those for plains
at the highest altitudes.                                              and lie within the range of uncertainty of LW↓ sensors in
   Several studies evaluated LSA SAF irradiance products               mountains (Table 1). Thus, the performance of LSA SAF
at hourly time steps (when the sun is above the horizon for            irradiance products remains satisfactory compared to previ-

www.hydrol-earth-syst-sci.net/24/2083/2020/                                          Hydrol. Earth Syst. Sci., 24, 2083–2104, 2020
2098          L. Quéno et al.: Satellite-derived products of solar and longwave irradiances used for snowpack modelling

Figure 11. (a) Snow water equivalent simulated by A-Cro (blue), AL-Cro (green), ALSW (dashed green), ALLW (dashed orange) and AS-
Cro (red) from 1 October 2010 to 30 June 2011 at point B in the Pyrenees (2459 m, Fig. 9). (b) Cumulated melting represented with the same
colours. (c, d) Mean daily irradiance differences with AROME for DSSF (green), DSLFnew (orange) and SAFRAN irradiances (red).

ous evaluations of these products on plains, even though they             These results suggest that LSA SAF satellite-derived esti-
generally do not reach the target accuracy (Sect. 2.2.3), de-          mates of SW↓ and LW↓ irradiances are suitable to drive dis-
rived from reference plain stations.                                   tributed snowpack simulations in mountainous terrain. DSLF
   Hinkelman et al. (2015) similarly evaluated the CERES               can be replaced by DSLFnew up to mid-altitudes (2200 m
SYN products at mountain stations for 3 h averages. In terms           approximately), where the performance is improved. These
of SW↓ irradiance, they showed biases between −13 and                  products constitute beneficial alternatives to NWP and anal-
+51 W m−2 and RMSE between 93 and 162 W m−2 . In                       ysis systems in complex terrain.
terms of LW↓ irradiance, they showed biases between
−17 and +31 W m−2 and RMSE between 24 and 40 W m−2 .                   5.2   Limitations due to the topographical influence on
Despite a coarser spatial resolution, the obtained irradiance                radiation
errors are similar to those of LSA SAF products, but they are
reduced by the 3 h average. Reaching a similar performance             Limitations to the use of kilometric-resolution irradiance
at hourly time steps can then be considered as an improve-             products in complex terrain arise from the high topograph-
ment. The shorter time step of LSA SAF products also en-               ical influence on incoming radiation. These limitations are
ables a finer representation of the SW↓ diurnal cycle.                 tackled here following three axes: (i) limitations of satellite-

Hydrol. Earth Syst. Sci., 24, 2083–2104, 2020                                         www.hydrol-earth-syst-sci.net/24/2083/2020/
You can also read