Farmers' use weather & forecast information - in the Western Australian wheatbelt
←
→
Page content transcription
If your browser does not render page correctly, please read the page content below
Farmers’ use
of

weather & forecast
information
in the Western Australian
wheatbelt

Report to the Bureau of Meteorology

Myrtille Lacoste

Marit Kragt

2018
This work was funded by the Bureau of Meteorology (BoM) of the Australian Government through the
Royalties for Regions program of Western Australia, as part of a larger project to estimate the benefits
of Doppler radar investments in the Western Australian wheatbelt. This work was conducted at the
University of Western Australia (UWA), School of Agriculture and Environment, Department of
Agricultural and Resource Economics, under the supervision of Dr Marit Kragt.

For more information:
           UWA project investigator       Dr Myrtille Lacoste     myrtille.lacoste.ag@gmail.com
           UWA project supervisor         Dr Marit Kragt          marit.kragt@uwa.edu.au
           BoM regional director WA       Mike Bergin             mike.bergin@bom.gov.au

The author thanks all the farmers who contributed their time to this study, as well as the six industry
experts consulted for their advice and three anonymous reviewers for their comments.

This report can be cited as:
Lacoste M. & Kragt M. (2018) Farmers’ use of weather and forecast information in the Western Australian
           wheatbelt. Report to the Bureau of Meteorology. Department of Agricultural and Resource
           Economics, The University of Western Australia: Perth.

Copyright © The University of Western Australia 2018.
This report is published under a Creative Commons Attribution 4.0 International Licence.

______________________________________
ART

EXECUTIVE SUMMARY
  & RECOMMENDATIONS                                  p. 1

1. INTRODUCTION                                      p. 4

2. MATERIAL & METHODS                                p. 14

3. RESULTS                                           p. 20

  3.1 Farming characteristics                   p. 22

  3.2 Products used                             p. 26

  3.3 Impacts on farming practices              p. 38

  3.4 Farmers’ views                            p. 47

4. CONCLUSIONS                                       p. 51

APPENDIX                                             p. 54

                            Farmers’ use of weather & forecast information WA   2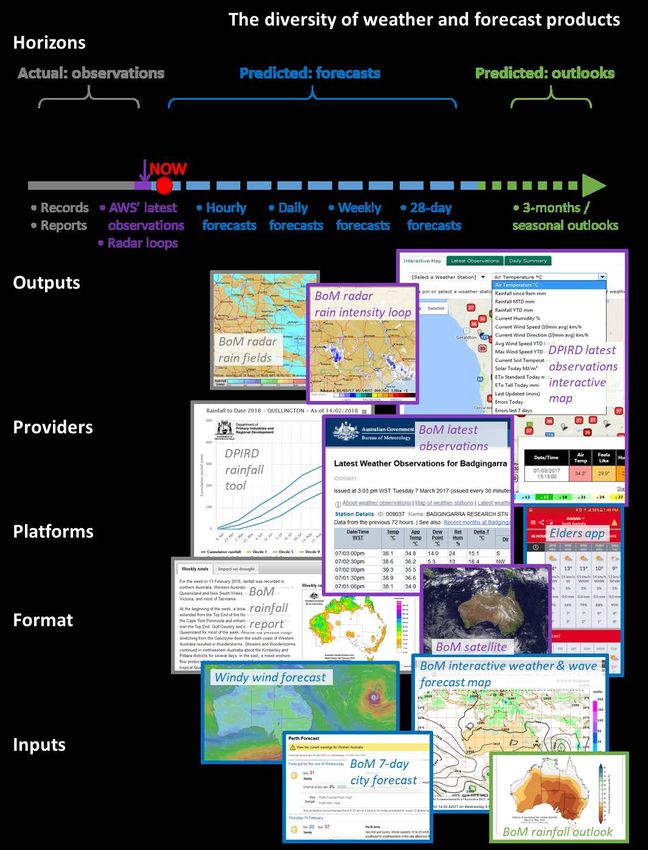
Executive summary & recommendations
Evaluating the economic benefits from investments in weather and forecast
information is hindered by a lack of knowledge about how broadacre farmers use this
information. It remains unclear which weather and forecast products farmers use, and
which features are considered most important. Little is also known about how the
available weather and forecast information impacts the management decisions of
farmers, for instance how different forecast horizons impact farming practices along
the year.
This study is the first to address these gaps. Primary data from 51 farmers was collected
using detailed interviews in 3 locations of the Western Australian wheatbelt between
July and October 2017.
Major results and recommendations included:
• The majority of farmers interviewed expressed great confidence in the
competence of the Bureau of Meteorology (BoM) and considered that,
overall, forecasts skills have greatly improved along the years. Confidence
in forecast was very high for forecasts up to 4 days. A large proportion of farmers
acknowledged the difficulties of achieving reliable predictions at longer horizons.
BoM should continue current activities. Levels of trust are high, demonstrating
the overall adequacy and broad scale relevance of BoM activities and outputs
to the broadacre industry.
• Most farmers accessed multiple weather and forecast products; half
provided by BoM, half by third-parties. The main eight products, representing
70% of all main sources of information mentioned, were: BoM’s radar, Elders’ app,
BoM’s 1 to 7-day forecasts, WillyWeather, Weather Zone, BoM’s MetEye, OCF via
AWN, and BoM’s 4-day agricultural forecasts. Farmers’ choices were justified by ease-
of-use, performance, requirements for specific features, and the need to
build an ‘overall picture’ by comparing several perspectives.
If one of BoM’s objectives is to improve the delivery of information, there is
scope for improvement. Some key products such as MetEye are trusted and
comprehensive, but cumbersome. Generally, the differences and overlaps
among the myriad of products offered by BoM are unclear.
1 Farmers’ use of weather & forecast information WA
The BoM website is well used, however the smartphone app market is almost
entirely dominated by third-parties. To compete, BoM strategic directions
regarding the development of products must take into account the successful
features of third-party products, notably with regards to platform format (e.g.
concise, convenient, interactive) and market positioning (e.g. niche features
such as wind mapping). Promising avenues to increase the market share
among farmers also include developing apps with an easily customisable
dashboard to monitor current observations (e.g. for spraying), and radar
integration with other services such as cadastral maps, farm grain flows, or
planning software.
Another opportunity for BoM would be to develop a product comparing the
historical and local performances of various forecast products, highlighting
differences in data sources and model providers.
• Lack of awareness limited the use of many products, most notably those
produced by BoM and DPIRD for extension and decision support purposes.
A large proportion of farmers are not aware of flagship products such as
MetEye, radar rainfields or weather-related decision tools which should be
more clearly promoted.
The myriad of products provided on the BoM website could be re-organised,
perhaps adding a “product map”, and keeping in mind that MetEye does not
currently represent a central ‘go-to’ platform for most farmers.
Farmers would benefit from workshops summarising and explaining all types
of weather and forecast products available (including third-parties and their
differences with BoM products). Such workshops would also represent the
opportunity for BoM to gather further feedback on desirable product features.
However, outreach activities must consider that farmers are time-poor, which
explains the success of meteorological weather segments (on-the-go in tractors)
versus time-requiring presentations - both in-person or online.
• Farmers’ overall access to weather and forecast information was not explained by
their age, technological level, farm size, mobile coverage or location. Farmers who
were younger, used more up-to-date technologies, or whom benefited from better
mobile coverage were not accessing weather and forecast information more than
others. This suggests that farmers’ need for weather and forecast information is such
that is overrides many other factors (such as personal preferences or the farm
technological level).
There is no need to accommodate products or target activities toward a
particular segment of the agricultural population.
Farmers’ use of weather & forecast information WA 2
• Generally, farmers had greater confidence in short-range forecasts,
which impacted their practices more than long-term forecasts. The shorter
the predicted forecast horizon, the more confidence farmers have in its reliability and
accuracy, and the more that forecast influences their decisions. The practices most
impacted by weather conditions and forecasts were general planning, spraying
and sheep management; the least was harvesting. Impacts on seeding and fertiliser
application varied greatly, with distinct farmer profiles identified (notably, one group
relied heavily on forecasts while another disregarded all related information).
Studies investigating the impacts of improved forecasts on farmers’ decisions
must take into account this heterogeneity, as well as realistic scopes for
improvement, or risk over-estimating potential benefits. Weather and forecast
information is critical to farming overall; however, differences exist, between
practices and within the farming population. For instance, avoidable harvest
weather-related losses could be reduced by improved 2-3 week forecasts but are
low anyway; spraying and sheep management are currently near optimum;
forecasts at seeding time have limited relevance for two-thirds of cropping
programs (pre-decided early seeding or waiting for sufficient rainfall);
pragmatic farm constraints override some forecast benefits for a proportion of
the farming population (fertilising logistics, harvest labour shortage,
machinery capacity at seeding).
The weather and forecast information generated by the Bureau of Meteorology are
well-regarded and extremely useful to broadacre farmers in the wheatbelt. Access to
this information, directly via BoM or third-party products, is an essential component
of the organisation and functioning of current farming systems. Nevertheless, in
addition to enhancing the accuracy and reliability of long-term forecasts, there is
scope for improvements in terms of delivery (products format, accessibility,
awareness).
Monitoring weather conditions and assessing forecasts impacts on most farmers’
decisions. The (perceived) performance of the forecasts varies with forecast horizons,
which influences the relative importance placed on these forecasts by farmers.
Currently, shorter-term forecasts (under a few days) are largely sufficient for
spraying and sheep management. However, for harvesting decisions, farmers would
need improved 2-3 week forecasts. Impacts on seeding and fertilising also require
medium as well as long-term forecast horizons and are more complex. They vary
across the farming population, with other factors such as pragmatic farm constraints
overriding the role of weather forecasts in many instances.
3 Farmers’ use of weather & forecast information WA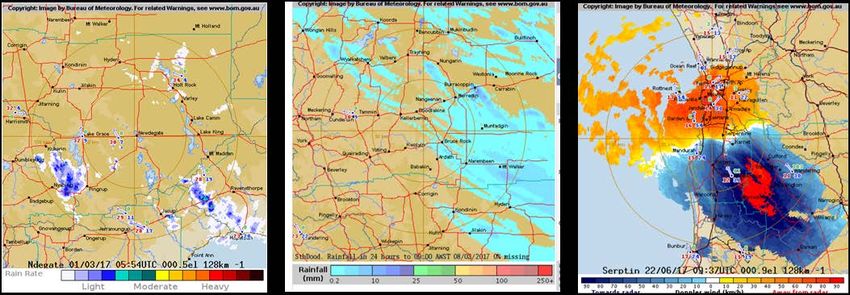
1. Introduction
   An enduring lack of information
   about the influence of weather
   and forecast information on
   farmers’ practices

            Farmers’ use of weather & forecast information WA   4
Current knowledge and challenges regarding the use of
weather and forecast information by farmers

Providing weather and forecast information to the community is the object of much
investment and effort, most of which is carried out by the government through the research
and development of meteorological models, technologies, and outreach activities. In Western
Australia, a key target for the resulting products and services is the farming population of the
wheatbelt. This 200,000 km2 region is located in the south-east region of the state and is
dominated by rainfed grain and livestock farms.

Understanding how weather and forecast information is used by farmers, and the benefits they
gain from improved weather information, is necessary to adequately inform future
investments. To date however, appraisals rely on the informal opinions of industry
professionals, without evidence obtained through scientific investigation. The objective of this
study is to address this gap in knowledge, which endures in Australia and in broadacre
agriculture internationally.

The questions addressed in this study include:
      • Through which products and services do farmers obtain weather and forecast
       information (Fig.1)?
      • How often do farmers use weather and forecast information?
      • Are some groups of farmers accessing this type of information more than others?
      • Which decisions on farm are influenced by weather and forecast information?
      • What is the extent of these impacts?
      • How do different types of information, such as different forecast horizons, impact
       farmers’ decisions?

5   Farmers’ use of weather & forecast information WA
Fig.1 Examples of the myriad of products available that provide weather and forecast information. Some
products are specifically designed for farmers, such as BoM’s agricultural 4-day forecasts, or third-party apps
produced by private rural services companies. AWS: Automatic Weather Stations. BoM: Bureau of Meteorology.
DPIRD: Department of Primary Industries and Rural Development (formerly DAFWA, Dpt. of Agriculture Western Australia).

                                                Farmers’ use of weather & forecast information WA      6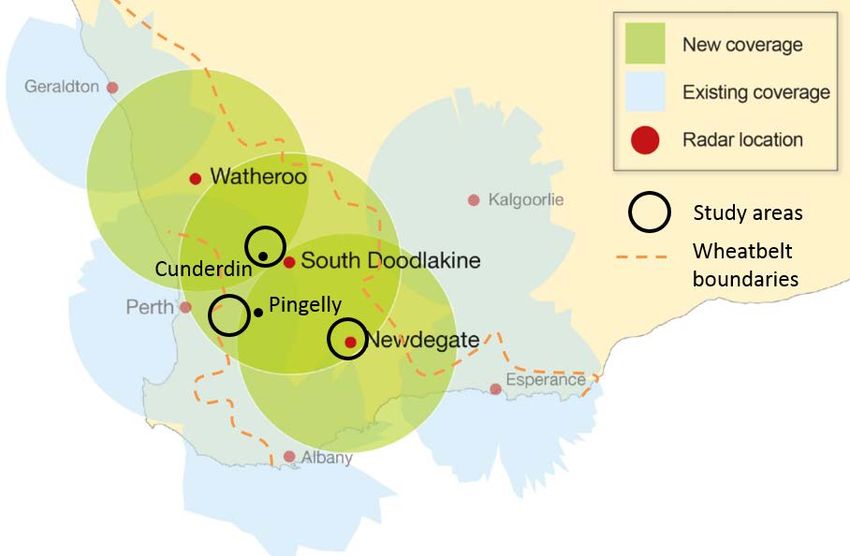
The importance of weather and forecast information to
Australian broadacre agriculture

The Western Australian wheatbelt is one of Australia’s main grain growing regions. Over ten
million tons of grains are produced by about 4,000 rainfed broadacre farms, which includes a
third of the country’s wheat tonnage (ABARES, 2016). Together with livestock products, this
amounts to an approximately five billion dollar industry (ABS, 2016). Any productivity gain is
therefore expected to result in large economic benefits.

Weather forecasts are assumed to be important for productivity by improving farmers’
decisions, notably by allowing them to conduct more accurate and timely operations
(Changnon, 2007; Yates et al., 2016). This appears particularly justified across the Australian
southern grainbelt where weather conditions constitute key production factors. Notably, low
water availability and extreme variability in annual and seasonal rainfall are considered the
most important limitations to grain yields (Hochman et al., 2013; Sprigg et al., 2014). In
addition, weather variability has increased with a changing climate (Pook et al., 2012; Raut et
al., 2014).

A historical focus on determining farmers’ decision-making
processes rather than practices

The overall importance of forecast and weather information to farmers has led the government
and the scientific community to produce a variety of weather-related products and services to
help farmers make better informed decisions. However, there is almost no information on
which products farmers use, and the extent to which the relayed weather and forecast
information impacts their practices. These gaps in knowledge are not unique to the Australian
broadacre agriculture. Concerns are evident in other countries such as the U.S. where
researchers and governments services thrive to better reach out to farmers (Changnon, 2007).

Evidence of these concerns is represented by the great interest there has been in
understanding how farmers’ decision-making processes help them to adjust their operations
according to climatic information. In Australia, research has specifically investigated how
broadacre farmers integrate scientific information and advice, to elucidate the thought
processes leading to management decisions (McCown et al., 2012). Subsequently,
recommendations have been made to increase the adoption of decision support tools, some of

7   Farmers’ use of weather & forecast information WA
them weather-related (Hochman, 2009; Hochman & Carberry, 2011). For instance, it is now
understood that farmers usually integrate several sources of information in a progressive,
adjustable process. However, other key aspects remain undocumented: which products and
services farmers use; whether there are variations in use across the farming population; what
is the relative impact of weather and forecast information on farming practices. In Australia,
the lack of evidence about the accessibility and use of forecasts by farmers has been recognised
(Yates et al., 2016). Even the usefulness for farmers of long-term seasonal forecasts remains
little informed, in spite of the large amount of literature produced by the international
scientific community on related questions (Klemm & McPherson, 2017). Exceptions exist in
the United States, where Takle et al. (2014) drew an overall “climate decision cycle” for corn,
and Crane et al. (2010) provided an abundance of insights about farmers decision processes
from detailed case studies. In both cases however, quantitative data was lacking to generalise
results, and the above questions were not answered. Otherwise, the most relevant information
about farmers’ use of forecast information has relied on survey data collected in the 1980s-
2000s (Changnon, 2004; Artikov et al., 2006; Hu et al., 2006; Frisvold & Murugesan, 2013).
Whilst the insights gained from these surveys about the drivers of farmers’ behaviour are still
valuable, practices have likely evolved, along with demographic changes and technology
progresses in rural areas. There is therefore a need to investigate current farmer use of weather
and forecast information, and how that use affects their farm practices.

Current work using farmers’ practices relies on assumptions
rather than actual data

Reviewers have highlighted the enduring lack of information about farmers’ use of weather
and forecast information (Kusunose & Mahmood, 2016). Studies that model farmers’ decision-
making rely on assumptions about farmers’ use of weather information. Rather than
documenting actual practices, such studies address potential needs. Hypothetical practices
and changes in managements are typically based on anecdotal evidence from industry
professionals (Garbrecht et al., 2010; Ghahramani & Moore, 2016) or based on ‘commonly
accepted’ knowledge, such as farmers’ tactical adjustments as the year unfolds (Petersen &
Fraser, 2001). Other studies include parameters to represent risk aversion (Asseng et al.,
2012a), or to account for variations in behaviour through scenario and sensitivity analyses
(Asseng et al., 2012b). Behaviour can also be ignored altogether using “perfect knowledge”
simulations (Moeller et al., 2008), or replaced by optimised decision scenarios (Shafiee-Jood
et al., 2014).

                                       Farmers’ use of weather & forecast information WA   8
These varied approaches generally gravitate around one major assumption, with one major consequence: weather and forecast information must be important to farmers and their decisions, therefore improvements in forecasting capability must result in great benefits. However, the presence of meteorological information does not necessarily correlate with value for the intended end-users (Leviäkangas, 2009). This could be the case in Australia, where discrepancies remain between business cases that expect large returns on technology investments (e.g. GHD, 2013; AEC, 2014; ESS, 2014), and anecdotal observations reporting mediocre interest from farmers (McCown et al., 2009; Hochman & Carberry, 2011). To avoid repeating this pitfall, documenting farmers’ practices and the way in which weather information plays a role in shaping farming practices is a pre-requisite to any economic evaluation effort. The challenges in documenting the use of weather and forecast information by farmers Whilst forecast and weather information appears essential to Australian broadacre farmers, assessing how this information is used is challenging. The large number of production practices and the diversity of farming circumstances in the wheatbelt complicates the question. Weather and forecast information can potentially impact land allocation decisions, tactical operations, input management, and even marketing strategies, all complicated by landscape and social considerations. Timing of seeding, managing fertiliser and pesticides application, and reducing livestock losses are considered particularly important in the Western Australian context (Pook et al., 2009; Asseng et al., 2010; Asseng et al., 2012b; Bell et al., 2013; Burton, 2014; Lacoste et al., 2016, 2018). In the present study, these challenges were addressed by using a mixed method methodology based on in-depth interviews with farmers. An iterative process permitted to gather detailed yet representative information about a broad range of relevant aspects, and the collection of quantitative data was informed by qualitative information. Such approaches remain rare in Australian agricultural studies (Lacoste et al., 2017), in spite of their potential to investigate complex topics that include human elements (Tashakkori & Teddlie, 2010; Plano Clark & Ivankova, 2016). The next section details the methods used, before presenting results in 4 themed sections: (i) farming characteristics, (ii) products used, (iii) impact on practices, and (iv) farmers views. 9 Farmers’ use of weather & forecast information WA
References

ABARES. (2016). Agricultural commodity statistics 2016. Canberra: Australian Bureau of Agricultural
     and Resource Economics and Sciences (ABARES).

ABS. (2016). Value of Agricultural Commodities Produced, Australia, 2014-15. Canberra: Australian
       Bureau of Statistics.

AEC. (2014). Technology in Agriculture, Department of Agriculture and Food - Final Report. Perth: AEC
       Group Pty Ltd.

Artikov, I., Hoffman, S. J., Lynne, G. D., Pytlik Zillig, L. M., Hu, Q., Tompkins, A. J., Hubbard, K. G.,
        Hayes, M. J. & Waltman, W. (2006). Understanding the Influence of Climate Forecasts on
        Farmer Decisions as Planned Behavior. Journal of Applied Meteorology and Climatology, 45,
        1202-1214.

Asseng, S., Dray, A., Perez, P. & Su, X. (2010). Rainfall–human–spatial interactions in a salinity-prone
        agricultural region of the Western Australian wheat-belt. Ecological Modelling, 221(5), 812-
        824. doi:10.1016/j.ecolmodel.2009.12.001

Asseng, S., McIntosh, P. C., Wang, G. & Khimashia, N. (2012a). Optimal N fertiliser management based
        on    a    seasonal    forecast.   European     Journal     of   Agronomy,      38,   66-73.
        doi:10.1016/j.eja.2011.12.005

Asseng, S., Thomas, D., McIntosh, P., Alves, O. & Khimashia, N. (2012b). Managing mixed wheat–sheep
        farms     with     a    seasonal      forecast.   Agricultural    Systems,    113,   50-56.
        doi:10.1016/j.agsy.2012.08.001

Bell, L. W., Moore, A. D. & Kirkegaard, J. A. (2013). Evolution in crop–livestock integration systems
         that improve farm productivity and environmental performance in Australia. European
         Journal of Agronomy. doi:10.1016/j.eja.2013.04.007

Burton, R. J. (2014). The influence of farmer demographic characteristics on environmental behaviour:
        a      review.      Journal       of    Environmental      Management,        135,     19-26.
        doi:10.1016/j.jenvman.2013.12.005

Changnon, S. A. (2004). Changing uses of climate predictions in agriculture: implications for prediction
      research, providers, and users. Weather and forecasting, 19(3), 606-613.

Changnon, S. A. (2007). The Past and Future of Climate-Related Services in the United States. Journal
      of Service Climatology, 1(1), 1-7.

Crane, T. A., Roncoli, C., Paz, J., Breuer, N., Broad, K., Ingram, K. T. & Hoogenboom, G. (2010).
       Forecast Skill and Farmers’ Skills: Seasonal Climate Forecasts and Agricultural Risk
       Management in the Southeastern United States. Weather, Climate, and Society, 2(1), 44-59.
       doi:10.1175/2009wcas1006.1

ESS. (2014). Western Australia radar network, costs and benefits: Environmental Systems & Services
        Weather Tech Pty Ltd.

Frisvold, G. B. & Murugesan, A. (2013). Use of Weather Information for Agricultural Decision Making.
        Weather, Climate, and Society, 5(1), 55-69. doi:10.1175/wcas-d-12-00022.1

Garbrecht, J. D., Zhang, X. C., Schneider, J. M. & Steiner, J. L. (2010). Utility of seasonal climate
       forecasts in management of winter-wheat grazing. . Applied Engineering in Agriculture, 26(5),
       855‐866.

                                         Farmers’ use of weather & forecast information WA   10
Ghahramani, A. & Moore, A. D. (2016). Impact of climate changes on existing crop-livestock farming
systems. Agricultural Systems, 146, 142-155. doi:10.1016/j.agsy.2016.05.011
GHD. (2013). Orana Region Organisation of Councils - Weather Radar Project. Dubbo: GHD.
Hochman, Z. (2009). Re-inventing model-based decision support with Australian dryland farmers. 4.
Yield Prophet® helps farmers monitor and manage crops in a variable climate. Crop & Pasture
Science.
Hochman, Z. & Carberry, P. S. (2011). Emerging consensus on desirable characteristics of tools to
support farmers’ management of climate risk in Australia. Agricultural Systems, 104(6), 441-
450. doi:10.1016/j.agsy.2011.03.001
Hochman, Z., Carberry, P. S., Robertson, M. J., Gaydon, D. S., Bell, L. W. & McIntosh, P. C. (2013).
Prospects for ecological intensification of Australian agriculture. European Journal of
Agronomy, 44, 109-123. doi:10.1016/j.eja.2011.11.003
Hu, Q., Pytlik Zillig, L. M., Lynne, G. D., Tomkins, A. J., Waltman, W. J., Hayes, M. J., Hubbard, K. G.,
Artikov, I., Hoffman, S. J. & Wilhite, D. A. (2006). Understanding Farmers’ Forecast Use from
Their Beliefs, Values, Social Norms, and Perceived Obstacles. Journal of Applied Meteorology
and Climatology, 45, 1190-1201.
Klemm, T. & McPherson, R. A. (2017). The development of seasonal climate forecasting for agricultural
producers. Agricultural and Forest Meteorology, 232, 384-399.
doi:10.1016/j.agrformet.2016.09.005
Kusunose, Y. & Mahmood, R. (2016). Imperfect forecasts and decision making in agriculture.
Agricultural Systems, 146, 103-110. doi:10.1016/j.agsy.2016.04.006
Lacoste, M., Lawes, R., Ducourtieux, O. & Flower, K. (2016). Comparative agriculture methods capture
distinct production practices across a broadacre Australian landscape. Agriculture, Ecosystems
& Environment, 233, 381-395. doi:10.1016/j.agee.2016.09.020
Lacoste, M., Lawes, R., Ducourtieux, O. & Flower, K. (2017). Methods to Study Agricultural Systems. In
Lichtfouse, E. (Ed.), Sustainable Agriculture Reviews (Vol. 25). Cham: Springer.
Lacoste, M., Lawes, R., Ducourtieux, O. & Flower, K. (2018). Assessing regional farming system
diversity using a mixed methods typology: the value of comparative agriculture tested in
broadacre Australia. Geoforum, 90 183–205. doi:10.1016/j.geoforum.2018.01.017
Leviäkangas, P. (2009). Valuing meteorological information. Meteorological Applications, 16(3), 315-
323. doi:10.1002/met.122
McCown, R. L., Carberry, P. S., Dalgliesh, N. P., Foale, M. A. & Hochman, Z. (2012). Farmers use
intuition to reinvent analytic decision support for managing seasonal climatic variability.
Agricultural Systems, 106(1), 33-45. doi:10.1016/j.agsy.2011.10.005
McCown, R. L., Carberry, P. S., Hochman, Z., Dalgliesh, N. P. & Foale, M. A. (2009). Re-inventing
model-based decision support with Australian dryland farmers. 1. Changing intervention
concepts during 17 years of action research. Crop and Pasture Science, 60(11), 1017.
doi:10.1071/cp08455
Moeller, C., Smith, I., Asseng, S., Ludwig, F. & Telcik, N. (2008). The potential value of seasonal
forecasts of rainfall categories—Case studies from the wheatbelt in Western Australia's
Mediterranean region. Agricultural and Forest Meteorology, 148(4), 606-618.
doi:10.1016/j.agrformet.2007.11.004
Petersen, E. H. & Fraser, R. W. (2001). An assessment of the value of seasonal forecasting technology
for Western Australian farmers. Agricultural Systems, 70, 259–274.
11 Farmers’ use of weather & forecast information WAPlano Clark, V. L. & Ivankova, N. V. (2016). Mixed Methods Research: A Guide to the Field. Thousand
Oaks: SAGE Publications, Inc.
Pook, M., Lisson, S., Risbey, J., Ummenhofer, C. C., McIntosh, P. & Rebbeck, M. (2009). The autumn
break for cropping in southeast Australia: trends, synoptic influences and impacts on wheat
yield. International Journal of Climatology, 29(13), 2012-2026. doi:10.1002/joc.1833
Pook, M. J., Risbey, J. S. & McIntosh, P. C. (2012). The Synoptic Climatology of Cool-Season Rainfall in
the Central Wheatbelt of Western Australia. Monthly Weather Review, 140(1), 28-43.
doi:10.1175/mwr-d-11-00048.1
Raut, B. A., Jakob, C. & Reeder, M. J. (2014). Rainfall Changes over Southwestern Australia and Their
Relationship to the Southern Annular Mode and ENSO. Journal of Climate, 27(15), 5801-5814.
doi:10.1175/jcli-d-13-00773.1
Shafiee-Jood, M., Cai, X., Chen, L., Liang, X.-Z. & Kumar, P. (2014). Assessing the value of seasonal
climate forecast information through an end-to-end forecasting framework: Application to U.S.
2012 drought in central Illinois. Water Resources Research, 50(8), 6592-6609.
doi:10.1002/2014wr015822
Sprigg, H., Belford, R., Milroy, S., Bennett, S. J. & Bowran, D. (2014). Adaptations for growing wheat in
the drying climate of Western Australia. Crop and Pasture Science. doi:10.1071/cp13352
Takle, E. S., Anderson, C. J., Andresen, J., Angel, J., Elmore, R. W., Gramig, B. M., Guinan, P., Hilberg,
S., Kluck, D., Massey, R., Niyogi, D., Schneider, J. M., Shulski, M. D., Todey, D. & Widhalm, M.
(2014). Climate Forecasts for Corn Producer Decision Making. Earth Interactions, 18(5), 1-8.
doi:10.1175/2013ei000541.1
Tashakkori, A. & Teddlie, C. (2010). Sage handbook of mixed methods in social & behavioral research.
Thousand Oaks: Sage.
Yates, D., Vervoort, R. W., Minasny, B. & McBratney, A. (2016). The history of using rainfall data to
improve production in the grain industry in Australia - from Goyder to ENSO. Crop and
Pasture Science, 67(5), 467. doi:10.1071/cp15053
Farmers’ use of weather & forecast information WA 1213 Farmers’ use of weather & forecast information WA
2. Material &
   methods

   In-depth interviews
   across 3 study areas:
   51 respondents, 37 farms

            Farmers’ use of weather & forecast information WA   14
Overview and rationale
The practices of farmers regarding the use of weather and forecast information were
investigated along three lines:
(i) What sources of information farmers use and why
(ii) How that information impacts farming practices
(iii) What factors impact the use of weather and forecast information, most notably:
- farm characteristics (e.g. farm size, enterprise mix, technological level)
- farmer characteristics (e.g. age, experience, opinions and perceptions)
To achieve this, an exploratory approach based on detailed interviews was used that allowed
answering two challenges:
• The complexity of the topic: this study involved decision-making processes, that are
typically influenced by multiple factors.
• The lack of prior research: very limited research had been conducted on the topic.
Whilst other studies may have made assumptions about farmers’ use of weather
information and consulted experts, no existing research could inform what data was
most important to collect.
The exploratory methodology used here was based on mixed methods principles, i.e.
combining quantitative and qualitative methods using detailed interviews. Emphasis was
placed on:
• Covering a broad range of topics, including promoting discussion to identify areas of
interest that could not be anticipated earlier because of lack of prior information.
• Contextualising quantitative data with qualitative information.
• Using a representative sample of the farming population by actively reducing biases
(random selection of farms rather than using listings, cold-calling recruitment to
limit respondent self-selection, one-on-one interviews to avoid peer-pressure).
The interview design was approved by the Human Research Ethics committee of UWA
(RA/4/1/9051). The Participant Information Form is provided in Appendix A.
15 Farmers’ use of weather & forecast information WALocations and respondent recruitment
Respondents were sought from three locations chosen in relation to the Doppler radars
(Fig.2):
• South-West Pingelly, that had radar coverage for several years from the Serpentine
radar;
• Newdegate, and Cunderdin near Doodlakine, that had radar coverage for one and
half a year, respectively.
These locations were chosen to capture the impacts of the new Doppler radars (data not
presented here).
Data was collected during July-October over one week of fieldwork for Pingelly, one week of
fieldwork for Newdegate (both face-to-face interviews), and two weeks of interviews for
Cunderdin (phone interviews). For all three locations, farms were identified while driving in
the studied area (scouting) or based on recommendation from previous respondents (snow-
balling), and selected at random. Farmers were recruited directly by knocking on doors,
without prior appointment (cold-calling). The response rate was 100%.
Fig.2 Radar coverage and fieldwork locations. The radars in Newdegate (installed September 2016),
South Doodlakine (February 2017), and Watheroo (April 2017) are part of the most recent investments
in weather and forecast technology in the Western Australian wheatbelt and include Doppler
technology. Prior to their construction, there was limited to no radar coverage in the central
wheatbelt. A study area covered by the Serpentine radar near Perth (installed in 2008, upgraded to
Doppler in 2014) was included in the study to ensure the data collected in Newdegate and Cunderdin
reflected established practices.
Farmers’ use of weather & forecast information WA 16Interview design
Prior to designing the interview guidelines, an understanding of potential benefits was gained
through the literature review (see introduction), and was further informed through
consultations with six industry experts (two agronomy consultants, two grower group
coordinators, two researchers from UWA and CSIRO). However, considering the lack of
information on actual benefits, reliance on pre-existing assumptions was kept minimal.
Instead, the interviews were designed to cover a wide range of potentially relevant aspects,
using a flexible in-depth, semi-structured format. The interview guidelines were further
refined during the first interviews in Pingelly. Table 1 lists the topics addressed in the
interviews; the final guidelines are provided in Appendix B.
Interviews lasted between 20 minutes to 1 hour; typically longer in Pingelly (refining questions
and investigating potential areas of interest), and shorter in Cunderdin (focus on most
important aspects). A situation of saturation occurred after 25 interviews (achieved during
fieldwork at Newdegate), at which point no new important information was uncovered
through exploration. An additional 20 interviews were conducted in order: (i) to be more
representative of the wheatbelt diversity by including a third location where farming situations
were known to be different (more cropping in Cunderdin than in Pingelly and Newdegate); (ii)
to ensure sufficient respondent numbers to avoid issues related to very small samples (e.g.
over-representation of rare situations); and (iii) to ensure sufficient data would be collected
for quantitative analysis.
Table 1. Progression of semi-structured interviews with farmers.
Topic discussed Questions Variables and factors
investigated
1. Farm
Land use Total arable, cropped, sheep Farming system (farm
type)
Workforce Full-Time Equivalents required on the farm: manager, family Farming system (farm
incl. semi-retired parents, full-time employees size)
Machinery Width of seeder and harvester, renewal strategy Machinery capacity
Technological level index
Manager Age, experience, management emphasis if any Age, experience (years)
Management emphasis
17 Farmers’ use of weather & forecast information WA2. Technology
Coverage Area with sufficient mobile phone reception In-field mobile access
Technologies Degree of reliance on computer for office work; collection and Technological level index
use of field data (e.g. yield mapping, variable rate); moisture
probes; farm network setup; degree of interest in further
investing and developing these tools
3. Products
Main sources Among all that is available, main weather and forecast Main sources: product
information products and tools used nature and numbers
Reason for Reasons for using these sources and not others Reasons
choices Opinion of BoM
Frequency of Acknowledging that access likely depends on the season and Avidity profile (relative
access the activities, typical frequency of accessing these products interest)
Specific Government (BoM and DPIRD) products and services related to Uses and reasons
products weather and forecasts, radio, TV Reasons for (not) use
Radar features Use of features, impact on overall management and on very Specific feature uses
short-term forecast confidence (Newdegate & Cunderdin Management change*
only) Confidence/risk change*
4. Practices
Seeding Start date, shift duration, capacity situation Forecast confidence
(land/labour/equipment constrains), seeding plan strategy Relative impact of
(relative importance of past and forecasted rainfall), impact of weather conditions and
forecast and radar forecasts on practices
Harvest Impact of forecast and of radar on weather-related losses, Farm constrains
constraints
Spraying Average total spending /ha/year*, area sprayed under sub- Seeding: Forecast profiles
optimal conditions*, area re-sprayed*, estimated related yield Spraying: Indicator
loss*, loss of chemical tanks*, impact of forecast and radar,
use of indicators (latest observations)
Fertilising Average total spending /ha/year*, impact of forecast and radar,
strategy details
Sheep Impact of forecast and radar on weather-related losses
Others Any other aspects weather-related (e.g. extreme events,
insurance) impacted by forecast and radar
5. Opinions
Future What would invest in, what are the gaps, what to do or improve Gaps
investments next (technologies, extension…)
Own interest Read online about weather and climate (events, Specific product uses
interpretation…) for own interest
Forecast Own impression of overall forecast performance along the Perception of forecast skill
performance years improvement
Opinion of BoM
* not presented in this report
Farmers’ use of weather & forecast information WA 1819 Farmers’ use of weather & forecast information WA
3. Results

       Farmers’ use of weather & forecast information WA   20
Sample overview
A total of 45 interviews were conducted involving 57 people (84% male). Most interviews were
conducted one-on-one, however family members sometimes joined in and contributed
precisions. Answers were therefore collected for 51 respondents across 37 farms. All
respondents were engaged in farming activities, with 80% of the sample represented by
managers (all males, average age: 49), and the remainder mainly consisting of family members
(18%: wife, parent, son; 2%: employee).
Results structure
The next sections present the main results of the study, organised in 4 themes:
• Sample characteristics: the sample and the regions studied are presented, as well as
important variables for which no impact on farmers’ use of weather and forecast
information was found.
• Weather products used: the main sources of information used by farmers, as well as
an investigation of specific product and services.
• Impact on practices: relative impact (actual and potential) on the main activities of
farmers.
• Farmers views: results about farmers opinions and perception that provided a suited
conclusion to the results of this study
21 Farmers’ use of weather & forecast information WA3.1 Farming
characteristics
No impact detected from
major structural farm variables
Farmers’ use of weather & forecast information WA 22Agricultural profiles
The agricultural systems present in the three study areas were similar in size (spanning
2,000–12,000 ha) and enterprise mix. Most farms implemented a combination of cropping
and livestock enterprises with overall very similar practices: one crop a year sown in April-
May and harvested in October-December; rotations mostly involving wheat, barley, canola,
lupin and volunteer pastures; livestock mainly represented by sheep, and rarely by cattle.
Overall, 14% of farms specialised in livestock, 22% in crops, and 65% were mixed farms.
The main dissimilarities regarded the distribution of farm sizes and the relative importance of
crops and livestock enterprises (Fig.3). These likely reflect geographical attributes. In hilly and
wetter Pingelly, livestock activities covered half the land used, with most farms under 4,000
ha. In the mostly flat and heavy-textured land surroundings Newdegate, livestock was slightly
less prominent but farms were almost twice larger. In the undulating sandplains dominating
Cunderdin, the distribution of farm size was similar to that of Pingelly with a reverse enterprise
emphasis (over 80% of the used land cropped), and with nearly half the farms in the sample
fully specialising in cropping.
Pingelly, South-East Newdegate Cunderdin, North-West
(long-term radar coverage) (recent radar coverage) (recent radar coverage)
14 000 14 000 14 000
Used area, including non-arable (ha)
"Large" "Huge"
12 000 "Huge" 12 000 3.5-6 FTE 12 000
>7 FTE >5 FTE
10 000 10 000 10 000
8 000 8 000 8 000
"Large"
6 000 6 000 6 000 2.5-3 FTE
"Large" "Standard"
2.5-4 FTE "Standard"
4 000 4 000 2 FTE 4 000
1.5-2 FTE
2 000 "Standard" 2 000 2 000
"Small"
2 FTE 1 FTE
0 20 40 60 80 100 0 20 40 60 80 100 0 20 40 60 80 100
Machinery width, average seeder & harvester (feet)
Location Farms Respondents Farm types: Livestock specialists Mixed crop/livestock Cropping specialists
Pingelly 11 16 Cropped area (% used): < 25% 30-85% 100%
Newdegate 13 18
Cunderdin 13 17 . Farm sizes: Defined jointly by area, machinery capacity, and the amount and nature of the
Total 37 51 workforce (i.e. family/employees; FTE = Full-Time Equivalent)
Fig.3 Comparing farming systems. In spite of differences between regions, farming businesses can be
compared using relative “farm size” and “farm type” criteria. These criteria were found to reflect
differences in structure and functioning in the Cunderdin regions that are likely to apply to other
regions in the Australian wheatbelt (for more information see Lacoste (2018), referenced in the
Introduction). For instance, “Large” and “Huge” “Cropping specialists” are more likely to invest in
recent technologies and have more time to dedicate to other activities such as, potentially, sourcing
weather and forecast information. However, no differences were found between farm sizes and the
use of weather and forecast information. The only exception was “Cropping specialists”, who are using
more spraying indicators than “Mixed farmers”; the smallest farmers were also found to not use much
weather and forecast information, however this was explained by low computer literacy rather than
farming system characteristics (see next sections 3.2).
23 Farmers’ use of weather & forecast information WAStandard farm and farmer characteristics have limited impact
Farm characteristics were investigated for their potential impact on farmers’ use of weather
and forecast information. This was justified by (i) the hypothesis that farms equipped with
more modern technology may have been more likely to make greater use of information
technologies, including that related to weather and forecast; and (ii) previous findings
regarding farm type and farm size impacting farmer’s practices and level of equipment (Fig.3).
This study confirmed that the greater the area cropped, the greater the technological level of
the farm was (Fig.4). However, no impact of location, farm type, cropped area,
technological levels, or mobile coverage on the overall use of weather and forecast
information could be found.
It is possible that the sample was too small to identify the impact of farm structural
characteristics, or that confounding factors exist that were not identified. However, sample
size did not prevent the identifications of other strong relationships, suggesting that sample
size was not an issue (Fig.4). A more likely explanation is that there is, indeed, no or little
impact of farm characteristics on that use. This is probably because weather and forecasts are
so important in farming that related information overhauls major structural differences.
Cropped
12 000 R²
R2==0.53
0.53
area (ha)
Fig.4 Farm characteristics: cropped area
10 000
strongly correlates to technological level.
This index integrates machinery renewal
8 000 strategy (purchase type and turnover
speed), computer reliance, and precision
6 000 agriculture equipment. Larger farmers who
emphasise cropping over livestock activities
4 000 are commonly thought to have greater
reliance on modern technologies. The
2 000
relationship was verified here, however no
links with the use of weather and forecast
information was found (Fig.5).
0 2 4 6 8 10
Low High
Technological level (0-10)
Farmers’ use of weather & forecast information WA 24There are two important implications of these findings:
• When building models, forecasts benefits should not be presumed to be mostly relevant
to farmers who are larger, crop larger areas, or are equipped with more modern
technology.
• Reliance on technologies and on information are not necessarily correlated.
A common hypothesis is that larger, crop-dominant farms make more use of
technologies and information. Structural farm characteristics were found to be
indeed related to the technological level of farms, however no relationship with the
use of weather and forecast information was found.
A likely explanation is that this information is of such importance for farmers that it
overhauls the diversity of farming situations: it is relevant and useful to all or, at least,
a great majority.
25 Farmers’ use of weather & forecast information WA3.2 Products used
• “Avidity” for weather & forecast information
• Main sources & reasons
• Use of specific products
• Latest observations for spraying
Farmers’ use of weather & forecast information WA 26Overview Respondents were asked how often they typically accessed weather and forecast information, which products they commonly used, and why they choose to use these. Answers to these open-ended questions permitted to assess the “avidity” for weather and forecast information (i.e. keenness and interest), what are the main products used by farmers, and the reasons underlying these choices. Following this, yes/no questions were asked about specific products or features to gather additional information. Finally, farmers were asked yes/no questions about which latest observations they use for spraying decisions. Avidity The importance of weather and forecast information to farmers was confirmed, with the vast majority of respondents (88%) accessing it frequently (Fig.5a). In facts, almost 60% of respondents accessed this type of information “more than required” i.e. typically several times a day, and 20% declared themselves “addicted” (self-confessed “weather-enthusiast”, “weather is my business”, “always, always look at it”, etc.). How often information was accessed was highly correlated with the number of sources consulted. Most farmers accessed several products on a regular basis, on average four- five different products (Fig.5a). Nearly all these main sources were online-based products accessed via computers, smartphones, and tablets. No relationship between variables such as farm size, cropping emphasis, technological level or age with farmers’ avidity for weather and forecast information was found (Fig.5b-e). Although farmers who accessed such information the least were among the oldest in the sample (Fig.4b), it appeared that their limited access was not because of age but because of low computer literacy. These farmers typically relied on personal observations or other members of the farming business. The great majority of farmers access weather and forecast information frequently, through several online products. Farmers who did not use weather and forecast information represented a minority and typically lacked basic computer skills. Age had no impact: older farmers accessed this information as much as younger farmers. 27 Farmers’ use of weather & forecast information WA
12 a) R² = 0.48
sources
mainsources
Sample average
10
Respondents with no or
products used as main
very low computer literacy
8
6 Respondents: n=51
ofproducts
across 37 farms
Number of
Number 4
2
00
0 1 2 3 4 5
Very rare Seldom As required High Very high
Very rare
Very rare Seldom As required
SeldomofStandard High
High Very high
Very high
Frequency access (1-5, jittered)
Frequency of access
Frequency (jittered)
of access (jittered)
100 b) R2 < 0.1 c) R2 < 0.1
14,000
12,000
80
Farm size (ha used)
10,000
Age (years)
60
8,000
40 6,000
4,000
20
2,000
00 00
0 2 4 6 8 10 0 2 4 6 8 10
Avidity (1-10) Avidity (1-10)
d) R2 < 0.1
e) R2 < 0.1
100 10
Cropping emphasis (% ha used)
Technological level (0-10)
80 8
60 6
40 4
20 2
00 00
0 2 4 6 8 10 0 2 4 6 8 10
Avidity (1-10) Avidity (1-10)
Fig.5 “Avidity” for weather and forecast information. This index assessing keenness and interest
consists of the addition of the following two (standardised) variables: frequency of access and number
of products (a). The high correlation between these two variables indicates that, generally, the more
frequently farmers access information, the more sources they consult. The relationship did not change
when omitting respondents with low computer literacy (R2 reduced to 0.35). “As required” is typically
defined as “almost every day during the growing season, several times a day at spraying and whenever
else needed, and less often in summer”. No relationship was identified between avidity and other
variables (b-e).
Farmers’ use of weather & forecast information WA 28Main information sources When asked what they mainly used to access weather and forecast information, farmers named 2 to 11 different products. From all 47 respondents, this resulted in a total of 231 answers gathered, distributed over 20 products, half of which provided by the government (Fig.6). The vast majority of respondents (85%) consulted a variety of products from BoM and third-party platforms (4-5 products on average per respondents). All the respondents accessed radar imagery as well as daily and weekly forecasts, from various sources. On the other hand, automated weather stations and seasonal outlooks were seldom mentioned as main sources. In Fig.6, the “population share” and the “market share” differ due to respondents using a different number and set of products each. For instance, the radar was mentioned by almost everyone, however many other products were named as well, reducing its relative importance: the radar is used by all but represents only one source of information among many others. Fig.6b also highlights that there is not one consistent pattern of use: a few farmers only use BoM products, most combine them with third-parties, which vary as well since farmers’ preferred apps vary. For instance, government products do not have much presence at all in the “weather app market”, which is currently dominated by Elders. 29 Farmers’ use of weather & forecast information WA
a) "Population share"                                     b) "Market share"
                              Respondents' use of products                     Relative importance of products (how often
                                 (% respondents, n=47)                        each was mentionned across the 231 answers
                          0     20      40       60        80       100            collected from the 47 respondents)
             Radar
             Elders
    1-7d forecasts 1
    WillyWeather *                                                          16%                                 11%
    WeatherZone *                                                                                                     *
           MetEye
     OCF via AWN 2
            Others
Agric. 4d forecasts 3
                      4                                                                   7%               7%               6%           2
   Weather maps                                                                                        *
                      5
         GFS (U.S.)
       Oz Forecast *                                                        11%
           Yr (Nor.)                                                                  1
                                                                                                                4
                                                                                          5%
 Seasonal outlook
                                                                                                                           *         5
            Others                                                                                 3
           Satellite
                      6
     DPIRD's AWS                                                                                                               6
   Met VUW (N.Z.)                                                           8%
                                                                                          5%
       BoM's AWS 6                                                                                                                       6
                                                                                      *                                    Other

                                                                           Overall:
 At least 1 product:
      BoM / DPIRD                                                           49%
                                                                                                                                    9%
   others, national                                                        Bureau of Meteorology        40%
  others, internatl.                                                       (BoM)
                                                                                                                                   DPIRD

                *   Primarely accessed via apps on mobile phones rather than websites on computers
                1   Daily and 7-day forecasts, town and district based
                2   OCF (Operational Consensus Forecasts) provided by BoM but accessed via AWN (AustralianWeatherNews.com)
                3   BoM "Water and the Land - For Agriculture and Natural Resources Management", mainly 4-day forecast maps
                4   BoM "Weather maps": forecasts, synoptic and barometric charts, poles, oceans
                5   GFS (Global Forecast System) mainly accessed via noaa.org and wxmaps.org
                6   AWS (Automatic Weather Stations): past observations

Fig.6 Farmers’ main sources of weather and forecast information. The 47 respondents named 2 to
11 products each, spanning a variety of government webpages, third-party mobile phone apps, and
even international model outputs. A point system was used to reflect the relative importance of each
product: 1 most often, sometimes 0.5 when a source was mentioned but specified not being used as
much, or 2 for products strongly emphasised as being the main source of information. Results are
displayed here in two ways: a) uses within the population and b) relative importance of each product
among all those mentioned. For instance, almost a quarter of farmers mentioned the agricultural
forecasts produced by BoM, however these only represented 5% of all the products used.

                                                      Farmers’ use of weather & forecast information WA                   30
Reasons for using information source Respondents provided one to three reasons supporting their multiple product choices (Fig.7). The main reasons were ease of use and performance. Ease of use mostly referred to the convenience of compact formats that condense all required information while avoiding unnecessary details (e.g. the all-on-one-screen format of the Oz Forecast app and the simplicity of the Elders app). BoM products typically scored low on that criteria compared to third-parties. Many respondents who mentioned ease of use as a reason often specified they had no time to look and compile information themselves, and therefore required quick solutions. Performance referred to accuracy and reliability. In most cases, the local relevance of BoM was highlighted, but not always. Although most farmers were aware that third-party products source their data mainly from BoM, many highlighted discrepancies and varying performances outputs for their area. Two other reasons explained why most farmers use multiple products. One was the requirement for specific features, for instance the percentage likelihood of OCF outputs, the live wind maps of WillyWeather, the combined 48-hour and 28-day forecasts of Elders, or the global outputs provided by GFS. The second reason was to compare several perspectives for respondents to build their own “whole picture” of their local weather and forecast. As with performance, variations between products were highlighted to justify this. Lastly, a smaller proportion of farmers did not actively choose products, relying instead on websites coming up first in search engines, apps pre-installed on their devices (e.g. WeatherZone), or recommendations (e.g. WillyWeather or Windy). These respondents echoed many others who mentioned difficulties in finding products on the BoM websites, relying on products they had bookmarked a long time ago without further or recent investigation. 31 Farmers’ use of weather & forecast information WA
Fig.7 Farmers’ reasons for choosing their main sources of information. Answers were quantified in two
ways. a) Major reason: the primary reason mentioned by respondents. b) Relative importance scores: 10
points were distributed between answers for each respondent (e.g. when two answers given: 8 points for
the main reason, 2 points for the minor one, 0 for the others not mentioned). Averaged importance scores
are low as most respondents gave only one to three responses, and must therefore be understood
relatively to each other.

 Farmers accessed a variety of products from the Bureau of Meteorology and third-
 parties. Their reasons to prefer some products over others included ease of use,
 perceived performance, specific features, and the need to compare different outputs.

 It was notable that farmers knew weather data is sourced from BoM, yet they
 considered there is great discrepancies in forecasts. This is symptomatic of either mis-
 perceptions about performances, or of important differences in data integration and
 outputs between platform providers.

 To better suit and inform farmers’ choices, BoM could consider providing:
 - more information about the range of products and features available to farmers
 - evidence of product accuracy and reliability, and comparisons of forecast
 performance across products

                                         Farmers’ use of weather & forecast information WA   32
Specific products and services
Additional questions were asked to further inform farmers’ use of specific products
(considered main sources of information or not), with a focus on:
• Products relevant to the project: Doppler radar features (Fig.8) and BoM extension
activities
• Products more broadly related to long-term government-funded initiatives: e.g. MetEye,
BoM’s app, weather-related initiatives from DPIRD (formerly DAFWA, Department of
Agriculture of Western Australia), automated weather stations
• Seasonal outlooks, because of considerable interest from the international research
community
• Non-online products, i.e. radio and television, because these had been little mentioned in
earlier responses
• The overall interest for more meteorological information available online.
a) Rain rates b) Rainfields c) Doppler wind
Fig.8 Radar imagery. Examples of a) Rain rates: dynamic qualitative output representing rainfall intensity;
b) Rainfields: quantitative outputs based on rain rates calibrated with on-the-ground weather stations;
c) Doppler wind: dynamic output representing speed and direction of wind relative to the radar position.
Although all respondents accessed rain rate loops, less than 50% accessed rainfields and only a quarter had
accessed the Doppler wind imagery, mainly because being unaware of these features (Fig.9).
33 Farmers’ use of weather & forecast information WAYou can also read