Googling Fashion: Forecasting Fashion Consumer Behaviour Using Google Trends - MDPI
←
→
Page content transcription
If your browser does not render page correctly, please read the page content below
$
     £ ¥€
            social sciences
Article
Googling Fashion: Forecasting Fashion Consumer
Behaviour Using Google Trends
Emmanuel Sirimal Silva 1, * , Hossein Hassani 2 , Dag Øivind Madsen 3                 and Liz Gee 4
 1    Centre for Fashion Business and Innovation Research, Fashion Business School, London College of Fashion,
      University of the Arts London, 272 High Holborn, London WC1V 7EY, UK
 2    Research Institute of Energy Management and Planning, University of Tehran, Tehran 1417466191, Iran;
      hassani.stat@gmail.com
 3    Department of Business, Marketing and Law, School of Business, University of South-Eastern Norway,
      Bredalsveien 14, 3511 Hønefoss, Norway; dag.oivind.madsen@usn.no
 4    Centre for Fashion Business and Innovation Research, Fashion Business School, London College of Fashion,
      University of the Arts London, 272 High Holborn, London WC1V 7EY, UK; l.gee@fashion.arts.ac.uk
 *    Correspondence: e.silva@fashion.arts.ac.uk

 Received: 22 February 2019; Accepted: 29 March 2019; Published: 4 April 2019

 Abstract: This paper aims to discuss the current state of Google Trends as a useful tool for fashion
 consumer analytics, show the importance of being able to forecast fashion consumer trends and
 then presents a univariate forecast evaluation of fashion consumer Google Trends to motivate more
 academic research in this subject area. Using Burberry—a British luxury fashion house—as an
 example, we compare several parametric and nonparametric forecasting techniques to determine
 the best univariate forecasting model for “Burberry” Google Trends. In addition, we also introduce
 singular spectrum analysis as a useful tool for denoising fashion consumer Google Trends and apply a
 recently developed hybrid neural network model to generate forecasts. Our initial results indicate
 that there is no single univariate model (out of ARIMA, exponential smoothing, TBATS, and neural
 network autoregression) that can provide the best forecast of fashion consumer Google Trends for
 Burberry across all horizons. In fact, we find neural network autoregression (NNAR) to be the
 worst contender. We then seek to improve the accuracy of NNAR forecasts for fashion consumer
 Google Trends via the introduction of singular spectrum analysis for noise reduction in fashion data.
 The hybrid neural network model (Denoised NNAR) succeeds in outperforming all competing models
 across all horizons, with a majority of statistically significant outcomes at providing the best forecast
 for Burberry’s highly seasonal fashion consumer Google Trends. In an era of big data, we show the
 usefulness of Google Trends, denoising and forecasting consumer behaviour for the fashion industry.

 Keywords: Google Trends; fashion; forecast; neural networks; singular spectrum analysis; big data

1. Introduction
     The emergence of big data and advances in big data analytics led to the creation of Google Trends
(Choi and Varian 2012), a tool and source for analysing big data on web searches across the globe.
Given that 70% of luxury purchases are estimated to be influenced by online interactions (D’Arpizio
and Levato 2017), Google Trends has the potential to play a pivotal role in the developments of big data
in fashion. Fashion consumers are actively using Google, looking for ideas, finding the best designs,
and buying with a tap (Boone 2016). In 2016 alone, Google was receiving more than 4 million search
queries per minute from 2.4 billion internet users and was processing 20 petabytes of information per
day (Wedel and Kannan 2016). Data analytics on such online behaviour lets Google predict the next
big fashion trend (Bain 2016) with Google’s Online Retail Monitor indicating that in 2018, fashion has

Soc. Sci. 2019, 8, 111; doi:10.3390/socsci8040111                                 www.mdpi.com/journal/socsci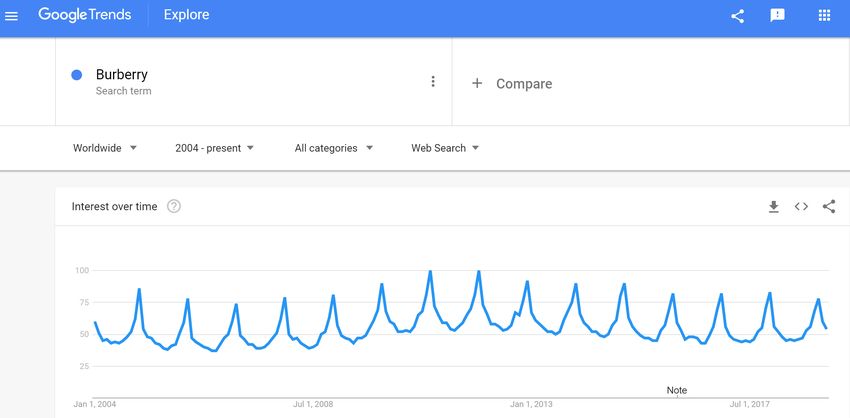
Sustainability 2019, 11, x FOR PEER REVIEW 2 of 24
Soc. Sci. 2019, 8, 111 2 of 23
lets Google predict the next big fashion trend (Bain 2016) with Google’s Online Retail Monitor
indicating that in 2018, fashion has seen the highest growth in searches, boosted by overseas shoppers
seen the highest
(especially growth
from the EU) in searches,
seeking boosted
access to UKby overseas
brands shoppers
online (Jahshan(especially
2018). Suchfrom the EU)
trends seeking
are positive
access
for thetofashion
UK brands onlinein
industry (Jahshan
the UK2018).
whichSuch
is trends are positive
experiencing for the fashion
considerable industry
uncertainty in the
with UK
Brexit
which
looming is experiencing
on the horizon. considerable uncertainty with Brexit looming on the horizon.
Google Trends
Trendsisisa good
a good example of how
example big data
of how can be
big data canexploited and visualised
be exploited in a user-friendly
and visualised in a user-
style. The term big data itself struggles to find a universal definition and it can mean different
friendly style. The term big data itself struggles to find a universal definition and it can mean different things
to different
things peoplepeople
to different (Marr (Marr
2015; 2015;
Hassani and Silva
Hassani 2015b).
and Silva Nevertheless,
2015b). most
Nevertheless, researchers
most agree
researchers on
agree
building
on buildingupon the three
upon defining
the three dimensions
defining of Bigof
dimensions Data
Big(3Vs)
Dataas introduced
(3Vs) by Laney
as introduced by(2001):
Laneyvolume,
(2001):
variety
volume,and velocity.
variety Figure 1 below
and velocity. Figuresummarises the 3Vs tothe
1 below summarises give
3Vsthe
to reader
give theanreader
indication on how big
an indication on
data
how was initially
big data wasthought tothought
initially be expanding. Today, the definition
to be expanding. Today, the of big data hasofevolved
definition big data(much like the
has evolved
size
(muchof big
likedata which
the size of has
big only
data gotten
which bigger as predicted
has only by Varian
gotten bigger 2014) and
as predicted bynow
Varianincludes
2014) 5Vs,
and with
now
additional
includes 5Vs, Vs being veracity (which
with additional accounts
Vs being for(which
veracity the quality of thefor
accounts data)
the and value
quality of (which
the data) accounts
and valuefor
analytics on data)for
(which accounts (Hassani
analyticsand
onSilva
data)2018).
(Hassani and Silva 2018).
Figure 1. The 3Vs of big data (Soubra 2012).
It
It is
is no
no secret
secret that
that Google
Google Trends
Trends are are increasingly
increasingly influencing
influencing business
business decision-making
decision-making in in aa
variety of industries (see, for example, Yu et al. 2019; Siliverstovs and Wochner
variety of industries (see, for example, Yu et al. 2019; Siliverstovs and Wochner 2018; Zhang et al. 2018; Zhang et al.
2018)
2018) given
given its ability to
its ability act as
to act as aa leading
leading indicator
indicator forfor forecasting
forecasting keykey variables
variables of interest. The
of interest. The fashion
fashion
industry too can benefit from the exploitation of Google Trends for forecasting
industry too can benefit from the exploitation of Google Trends for forecasting fashion variables, fashion variables, from
predicting future purchase decisions, to determining the effectiveness of marketing
from predicting future purchase decisions, to determining the effectiveness of marketing campaigns campaigns and
forecasting online
and forecasting consumer
online brandbrand
consumer engagement. Moreover,
engagement. there isthere
Moreover, a needis for morefor
a need conclusive research
more conclusive
which evaluates whether big data in the form of Google Trends can help predict
research which evaluates whether big data in the form of Google Trends can help predict actual actual sales for fashion
sales
brands. Whilst
for fashion finding
brands. the answer
Whilst findingtothe this problem
answer is beyond
to this problemthe is
scope
beyondof our
theresearch,
scope ofthere is reason
our research,
to believe
there that this
is reason could that
to believe be the
thiscase,
couldsince evidence
be the suggests
case, since that Google
evidence suggestssearches can predict
that Google searchesother
can
types of economic activity such as real estate sales and prices (Wu and Brynjolfsson
predict other types of economic activity such as real estate sales and prices (Wu and Brynjolfsson 2015), exchange
rates
2015),(Bulut
exchange2018), UK (Bulut
rates cinema2018),
admissions
UK cinema (Handadmissions
and Judge (Hand
2011), stock market
and Judge volatility
2011), stock(Hamid
market
and Heiden 2015), inflation expectations (Guzman 2011) and tourist arrivals
volatility (Hamid and Heiden 2015), inflation expectations (Guzman 2011) and tourist arrivals (Bangwayo-Skeete and
Skeete 2015). In addition, there could be several alternate research avenues
(Bangwayo-Skeete and Skeete 2015). In addition, there could be several alternate research avenues which are waiting to
be explored
which not onlytofrom
are waiting a fashion not
be explored design,
onlybuying
from aand merchandising
fashion design, buyingperspective, but also from
and merchandising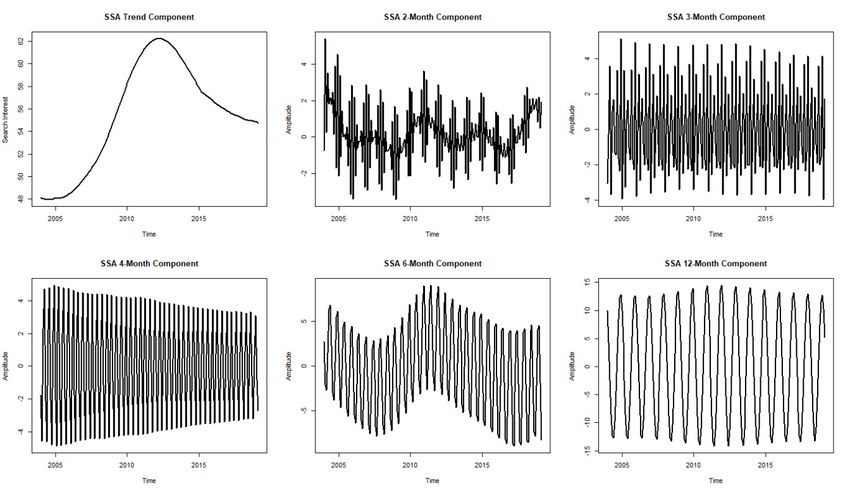
Soc. Sci. 2019, 8, 111                                                                               3 of 23

 a fashion management perspective (see, for example, Madsen 2016), particularly in evaluating the
 success of marketing and social media campaigns.
      We subscribe to Gordon’s (2017) view that Google Trends can be a metric for online consumer
 behaviour, as more than 75% of the world’s internet searches are conducted on Google (Net Market
 Share 2019). Therefore, we believe that the fashion industry should consider relevant Google Trends as
‘fashion consumer Google Trends’ which according to McDowell (2019) can enable brands to identify
 consumer patterns and profit from them. Here, it is worthwhile to define Google Trends for the reader.
 In brief, as one of the largest real time datasets currently available (Rogers 2016), recording Google
 search data from 2004 to present (Choi and Varian 2012), Google Trends allows one to gauge consumer
 search interest in brands. However, instead of the raw level of queries for a given search term, it is
 important to note that Google Trends reports the query index, which begins with a query share (Choi
 and Varian 2012):

                         Total query volume for search term in a given geographic location
                               Total number of queries in that region at a point in time

     In other words, its normalised nature (which enables more accurate comparisons over time)
means that Google Trends will always show the search interest on a topic as a proportion of all searches
on all topics on Google at that time and location (Rogers 2016). Data quality is another important
consideration, and Google Trends seeks to improve the quality of its data by excluding searches made
by very few people, duplicate searches and special characters (Google 2019; Choi and Varian 2012).
Furthermore, the query share based approach to computing Google Trends has its benefits in a world
where big data and data mining have been marred by privacy issues and concerns (Hassani et al. 2014,
2016a). The data aggregation underlying Google Trends ensures the output is anonymised and thus no
individual is identified personally (Rogers 2016).
     The motivations for this research (and its importance) stems from several existing studies. Firstly,
Jun et al. (2018) notes that the purpose of big data utilisation is now shifting from monitoring towards
forecasting, and thereby, indicating the importance of predictive analytics and forecasting for the future.
Secondly, the increase in ‘research shopping’, whereby consumers are seen accessing information
via one channel and purchasing through another channel (Verhoef et al. 2007; Bradlow et al. 2017),
adds more importance to the potential of fashion consumer Google Trends to be a useful fashion
analytics tool. Thirdly, as LaValle et al. (2011) points out, organisations are interested in what is likely
to happen next, and forecasting is a tool which can provide this information. However, the emergence
of big data brings about its own challenges for generating accurate forecasts (Hassani and Silva 2015b).
Fourthly, Wedel and Kannan (2016) assert that trend forecasting is vital for companies to be able to
identify changes in the environment and set up defences to retain market share. Furthermore, the
fashion industry currently benefits from big data trend forecasts and analytics through popular and
well reputed services by WGSN and Edited. As discussed later, Google Trends has the potential to
complement these existing platforms. To this end, Google Trends can indicate consumer sentiment
towards a brand, and has the ability to extrapolate this to potential purchasing behaviour that can help
brands plan more effectively.
     Thus, our interest lies in understanding the benefits of Google Trends for fashion analytics and
identifying the possibility of forecasting such online consumer trends into the future so that more
productive managerial and marketing decisions can be made. Accordingly, the aim of this paper is
to determine whether there exists a single univariate forecasting model which can predict fashion
consumer Google Trends across both short and long run horizons. The following objectives are put
forward to help achieve this aim. (1) Identify the uses of Google Trends for predicting fashion consumer
behaviour and the need for forecasting same, (2) analyse parametric and nonparametric univariate
time series models at forecasting fashion consumer Google Trends and (3) evaluate the importance of
signal extraction and denoising for fashion analytics.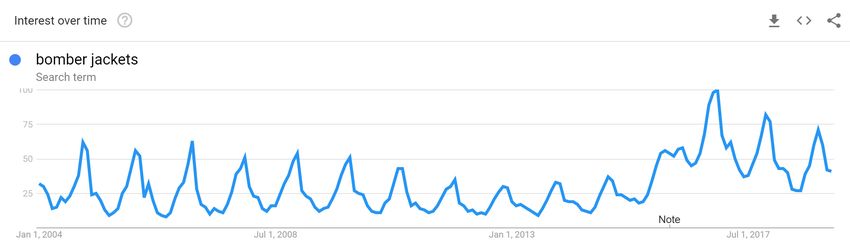
Soc. Sci. 2019, 8, 111 4 of 23
Accordingly, this study has several contributions; the first of which it is the initial attempt at
forecasting Google Trends for fashion. Secondly, this paper marks the introductory application of the
Denoised Neural Network Autorgression (DNNAR) model of Silva et al. (2019), which incorporates
Sustainability 2019, 11, x FOR PEER REVIEW 4 of 24
Singular Spectrum Analysis (SSA) (Broomhead and King 1986a, 1986b) and the Trigonometric Box–Cox
ARMA trend seasonal (TBATS) model for improving the accuracy of
Cox ARMA trend seasonal (TBATS) model for improving the accuracy of forecasts in the fashion
forecasts in the fashion industry.
This industry.
contribution is important
This contribution as Bradlow
is important et al. (2017)
as Bradlow points
et al. (2017) out that
points new
out that newresearch
researchinsights
insights arise
either from new data, new methods or some combination of the two.
arise either from new data, new methods or some combination of the two. Thirdly, the forecastThirdly, the forecast evaluation
presented herewith
evaluation compares
presented five compares
herewith popular and five powerful
popular and univariate
powerfultime series analysis
univariate time series and forecasting
analysis
and forecasting
techniques coveringtechniques covering
both parametric both
and parametric and
nonparametric nonparametric
models. Sectionmodels.
4 providesSection
more 4 provides
detail around
more detail of
the importance around
each the importance
chosen model,ofwhat eachthey
chosen do model,
and how whattheythey
aredoused
and in
how they
this are used
study. in
Fourthly, to
this study. Fourthly, to the best of our knowledge this is the first academic paper
the best of our knowledge this is the first academic paper to take stock of the status of Google Trends to take stock of the
status of Google Trends as a useful analytical tool for the fashion industry, not only by summarising
as a useful analytical tool for the fashion industry, not only by summarising the latest examples from
the latest examples from the industry, but also by presenting several additional examples of our own.
the industry, but also by presenting several additional examples of our own.
The remainder of this paper is organised as follows. Section 2 presents a concise review of the
The remainder
status of Google Trendsof this aspaper is organised
an analytical tool inasthe follows.
fashion Section
industry2and presents
providesa concise review
some insights onof the
status
how it could be more useful in future; we also refer to the need for statistical models and accurate on
of Google Trends as an analytical tool in the fashion industry and provides some insights
howforecasting
it could beofmore fashion useful in future;
consumer Google we also refer
Trends throughto the need for statistical
the examples. models
Section 3 focuses and accurate
entirely on
forecasting of fashion
introducing the data, consumer Google
whilst Section Trends
4 briefly through
introduces thethe examples.
forecasting Section
models. 3 focuses
Section entirely on
5 is dedicated
for the forecast
introducing the data, evaluation which is
whilst Section followed
4 briefly by a discussion
introduces in Section models.
the forecasting 6. The paper
Sectionconcludes in
5 is dedicated
Section 7 by pointing out the key findings and limitations of our research.
for the forecast evaluation which is followed by a discussion in Section 6. The paper concludes in
Section 7 by pointing out the key findings and limitations of our research.
2. Googling Fashion
2. Googling Fashion
2.1. How is the Fashion Industry Exploiting Google Trends?
2.1. How Boone
is the Fashion Industry
(2016) asserts Exploiting
that Google Google
Trends Trends?
can also show which styles really catch on with
shoppers when search patterns and geographic factors driving the biggest fashion trends in 2016
Boone (2016) asserts that Google Trends can also show which styles really catch on with shoppers
were analysed. For example, Figure 2 below shows Google Trends for bomber jackets which grew
when297%
search patterns and geographic factors driving the biggest fashion trends in 2016 were analysed.
YoY in the UK and 612% YoY in the US and illustrated the shift towards genderless fashion
For example, Figure
(Boone 2016). In 2addition,
below shows Google
fashion Trendscan
companies fortrack
bomber jackets
Google whichtogrew
searches 297%
identify YoY in the UK
purchasing
and 612% YoYand
decisions in the US and
swiftly meetillustrated
that demand the(Hastreiter
shift towards genderless
2016). Given the fashion (Boone
increasing 2016). within
competition In addition,
fashion companies
the industry, suchcan track Google
analytics can givesearches toor
any brand identify
retailer purchasing decisions
a clear competitive and swiftly
advantage meet
in terms of that
more(Hastreiter
demand efficient resource
2016).allocations
Given theand minimising
increasing waste.
competition within the industry, such analytics can
give any brand or retailer a clear competitive advantage in terms of more efficient resource allocations
and minimising waste.
Figure 2. Google
Figure 2. Googlesearch
searchtrends
trends for bomberjackets
for bomber jacketsinin
UKUK and
and USUS (Boone
(Boone 2016).
2016).
There is also
There evidence
is also evidenceofofsome
somefashion
fashion brands lookinginto
brands looking into exploiting
exploiting Google
Google Trends
Trends to their
to their
advantage
advantage for enhancing
for enhancing consumer
consumer engagement
engagement viavia improvedonline
improved onlineconsumer
consumerexperiences.
experiences. One
One such
such is
example example
Miinto,is aMiinto,
leadinga leading Norwegian
Norwegian fashion
fashion retailer
retailer that that created
created a fun
a fun nostalgia-basedquiz
nostalgia-based quizusing
Google Trends to enable consumers to be fashion forward (Armstrong 2016). Google and and
using Google Trends to enable consumers to be fashion forward (Armstrong 2016). Google Zalando
Zalando teamed up to create Project Muze to exploit the data in Google’s Fashion Trends report using
teamed up to create Project Muze to exploit the data in Google’s Fashion Trends report using Neural
Neural Networks for creating designs based on users’ interests (Think with Google 2017). Whilst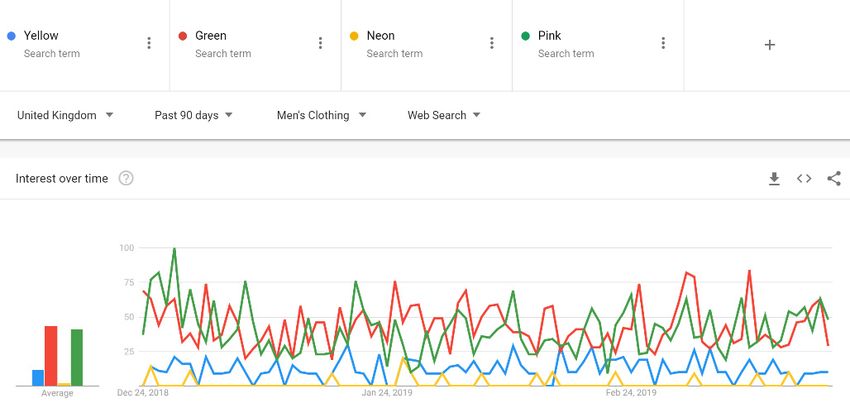
Soc. Sci. 2019, 8, 111                                                                                   5 of 23

Networks for creating designs based on users’ interests (Think with Google 2017). Whilst some
have criticised the process (see for example, Perez (2016)), there is potential for further research and
development to improve the outputs from such novel use of big data analytics.
     The lack of academic research into Google Trends as a viable analytical tool for the fashion
industry is indeed worrying for an industry which is valued at 3 trillion USD and 2% of the world’s
GDP (Fashion United 2019). The relative neglect of Google Trends in the context of the fashion industry
is surprising since research using Google Trends has increased dramatically in the last decade with
lucrative applications in IT, communications, medicine, health, business and economics (Jun et al.
2018). It is our hope that the topics covered in this paper would motivate more academic research into
fashion consumer Google Trends and its value for decision-making.

2.2. How Can Google Trends Help Strategic Fashion Management & Marketing Decisions?
      In addition to presenting selected examples of how the fashion industry can benefit from
analytics based on fashion consumer Google Trends for making more productive and strategic fashion
management and marketing decisions, we also use this subsection to highlight the importance and
utility of being able to forecast fashion consumer Google Trends accurately into the future.

2.2.1. Identifying Seasonal Patterns in Demand
     The see-now, buy-now trend was expected to flatten out the seasonal peaks in the fashion industry
via cruise collections and trans-seasonality. For example, in 2016, the luxury fashion house Burberry
launched its entirely straight-to-consumer collection as it aimed to create a seasonless fashion calendar,
breaking all the rules at the London Fashion Week (Brown 2016; Rodulfo 2016; Cusick 2016). However,
evidence suggests that fashion remains highly seasonal (for example, the most recent retail sales
patterns in UK, as visible via the Office for National Statistics too supports this view). This could
partly be due to the see-now, buy-now trend failing to become an industry standard as some early
adopters such as Tom Ford found it backfired, whilst the Kering Group has so far resisted the model
(Reuters 2018). Smith (2018) found, from Edited asserts, that there is growing need to understand
the shifting seasonality of apparel. Whilst there is a plethora of evidence in academia indicating the
importance of seasonality in fashion demand (Nenni et al. 2013), Thomassey (2014) correctly notes
that not all fashion products have a seasonal demand (as continuity lines have year-round demand).
Nonetheless, a considerable number of items are impacted by seasonality and thus, seasonality should
beSustainability
   incorporated  2019,into
                       11, x FOR PEERforecasting
                             fashion  REVIEW     systems.                                           6 of 24

     To this end, fashion consumer Google Trends could indicate consumers’ seasonality in demand
        From this example, it is evident that the fashion industry could benefit through the application
for any given product and clearly show changes in seasonal demand patterns. Figure 3 considers
  of statistical signal processing models which have the capability of extracting seasonal variations in
Google web search patterns for ‘bomber jackets’, which not only show that there is a seasonal demand,
  data and providing insights and seasonal forecasts into the future. Moreover, the data in Figure 3
but also that the seasonal demand patterns have changed considerably over time. For example, there is
  appears to be nonstationary over time and would therefore benefit from the application of
a diminishing
  nonparametric    seasonal
                       models, demand   from
                                 which do  not2004 up until
                                               assume       December 2013, which is followed by the seasonal
                                                      stationarity.
demand shifting upwards prior to illustrating a downward sloping trend as visible.

      Figure 3. Google Trends for bomber jackets (January 2004–February 2019) (Data Source: Google Trends,
         Figure 3.2019).
      1 February   Google Trends for bomber jackets (January 2004–February 2019) (Data Source: Google
         Trends, 1 February 2019).

   2.2.2. Competitor Analysis
       Gone are the days when luxury brands viewed online as a “mass market” (Deloitte 2018). With
   e-commerce expected to account for 36% of global fashion retail sales by 2020 (Meena 2018), all brands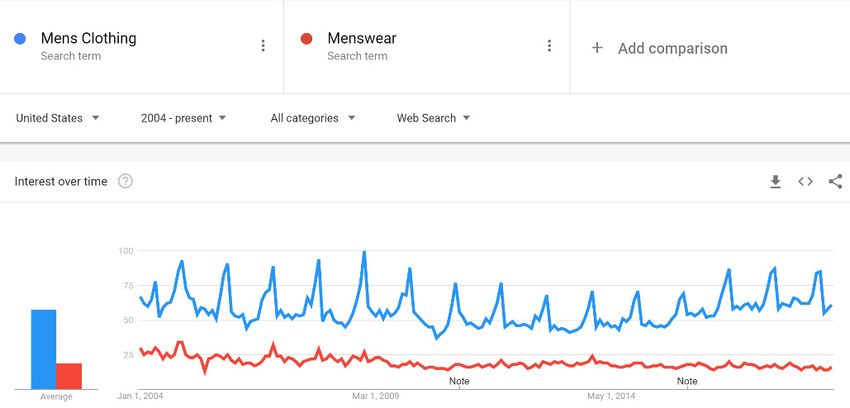
Soc. Sci. 2019, 8, 111 6 of 23
If a fashion company could find evidence of a significant positive correlation between its historical
sales for a product and consumer interest in the said product, as indicated via fashion consumer
Google Trends, then it is reasonable to assume that Google Trends could serve as a potential indicator
for changes in future sales. It is noteworthy that Boone et al. (2017) found evidence of Google Trends
improving sales forecasts. Therefore, it would be useful if fashion brands can accurately forecast future
seasonality movements in fashion consumer Google Trends, enabling better decisions on what to stock,
when to stock and how much to stock, in addition to using consumer trends to determine when to
reduce and increase the price points from a marketing perspective. Hastreiter (2016) supports the view
that tracking Google searches could be useful for identifying purchasing decisions and that acting
upon such analytics to swiftly meet the growing demand could strengthen top lines through value
realisation which enables removal of discount traps and more full price sales.
From this example, it is evident that the fashion industry could benefit through the application of
statistical signal processing models which have the capability of extracting seasonal variations in data
and providing insights and seasonal forecasts into the future. Moreover, the data in Figure 3 appears to
be nonstationary over time and would therefore benefit from the application of nonparametric models,
which do not assume stationarity.
2.2.2. Competitor Analysis
Gone are the days when luxury brands viewed online as a “mass market” (Deloitte 2018).
With e-commerce expected to account for 36% of global fashion retail sales by 2020 (Meena 2018),
all brands are focused on getting their digital footprint right. Moreover, recent reports indicate that
consumers are increasingly choosing online shopping over the high street (BBC 2019). This preference
is understandable as online shopping enables quick and easy price comparisons and ensures that
physical journeys are not wasted, as retailers may not always carry full stock of sizes and colours in
every store. As consumers demand better shopping experiences, luxury brands are exploiting the web
to provide personalised shopping experiences (Deloitte 2018) with global investments in improving
luxury online shopping now topping 1 billion USD (Gallhagher 2017). Fashion consumer Google
Trends has the potential to help brands assess the success of their online marketing campaigns and
enable identification of key competitors through brand search trend analysis (Willner 2017). In addition,
analysts can also compare performance based on specific products.
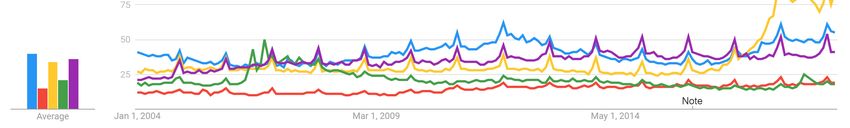
For example, Gucci was reported to be the most popular Google search for fashion brands in 2017
with Louis Vuitton coming in at number two (Bobila 2017), this trend appears to be continuing in 2019
(see, Figure 4). Such insights are useful for fashion brands as it shows them the effectiveness of their
online marketing campaigns and websites in terms of engaging the consumer. In addition, brands
can easily identify who their key competitors are, and this can enable them to study their competitors’
approaches to engaging the consumer online and improve upon their existing approaches. The simple
example in Figure 4 also clearly illustrates how, except for Gucci, Louis Vuitton and Chanel, the other
luxury brands considered here are struggling to get their online footprint set right. Interestingly, the
trends shown here continue in terms of image, news, Google Shopping and YouTube searches online.
However, it is important to remember that high search trends are not always a good thing. It is
imperative that managers and analysts understand the underlying cause of emerging trends (Bradlow
et al. 2017). For example, Figure 5 below shows worldwide fashion consumer Google Trends for the
search term “Dolce & Gabbana”. The peak popularity for the fashion brand in November 2018 is far
from positive as this coincides with its disastrous marketing campaign featuring a Chinese woman
struggling to eat pizza and other Italian foods with chopsticks (Hall and Suen 2018). Therefore, it is
advisable that peaks in Google Trends are always cross-checked with research into other information
surrounding brands to ensure it is a positive gain as opposed to one which is fuelled by negative media.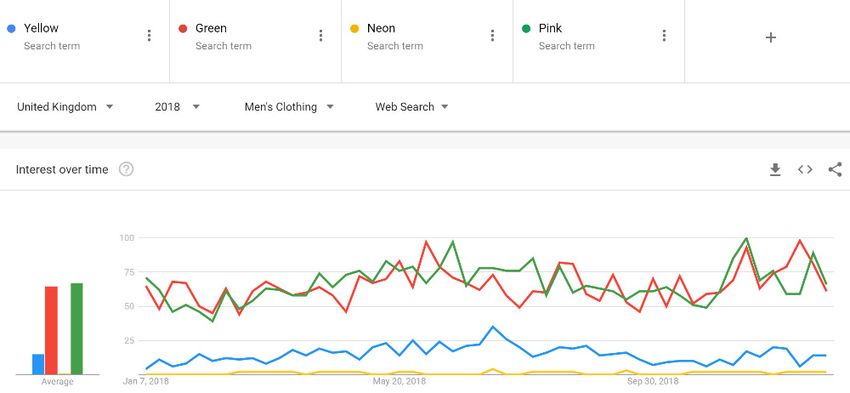
looking at in-depth
Such predicting the future
analysis of competition
of fashion based
consumer on historical
Google Trends datadata. This is for
is useful because outliers
forecasting could
models
be removed
looking via time series
at predicting analysis
the future models which
of competition basedenable denoising;
on historical this
data. would
This ensureoutliers
is because the forecasts
could
being
be generated
removed are more
via time seriesrealistic
analysisand accounts
models forenable
which negative press. Those
denoising; this interested
would ensure in anthe
example of
forecasts
a denoised time series whereby signal processing was used to remove an outlier are referred
being generated are more realistic and accounts for negative press. Those interested in an example of to
Hassani et al. (2018, Figure 5).
a denoised time series whereby signal processing was used to remove an outlier are referred to
Soc. Sci. 2019, 8, 111 7 of 23
Hassani et al. (2018, Figure 5).
Figure 4. Google Trends for selected luxury fashion brands (January 2004–February 2019) (Data
Figure 4. Google Trends for selected luxury fashion brands (January 2004–February 2019) (Data Source:
Source: Google
Figure 4. Trends,
Google 20 for
Trends February 2019).
selected luxury fashion brands (January 2004–February 2019) (Data
Google Trends, 20 February 2019).
Source: Google Trends, 20 February 2019).
Figure5.5.Google
Figure GoogleTrends forfor
Trends “Dolce & Gabbana”
“Dolce overover
& Gabbana” the past
the 12 months.
past (Data (Data
12 months. Source:Source:
GoogleGoogle
Trends,
12Trends,
March12 2019).
March 2019).
Figure 5. Google Trends for “Dolce & Gabbana” over the past 12 months. (Data Source: Google
Trends, 12 March 2019).
Such in-depth analysis of fashion consumer Google Trends data is useful for forecasting models
2.2.3. Identifying Brand Extension Opportunities
looking at predicting the future of competition based on historical data. This is because outliers could
2.2.3.Brand
Identifying Brand
extension, Extension
a popular Opportunities
and fundamental
be removed via time series analysis models whichluxury
enablebrand marketing
denoising; strategy
this would (Eren-Erdogmus
ensure the forecasts
et al. 2018)
being Brand refers to
extension,
generated the
are more launching
a popular
realisticandof a new product
andfundamental under
accounts for luxury
negative an
brand existing brand
marketing
press. name.
strategyin
Those interested Investing in new
(Eren-Erdogmus
an example of a
products
et al. 2018)
denoised within
refers
time the
series fashion
to the industry
launching
whereby a can
newbe
signalofprocessing a costly
product affair.
under
was used toan Fashion
existing
remove brands
an brand
outliernow
are have
name. the to
Investing
referred option
in new
Hassaniof
analysing
products fashion
within
et al. (2018, Figure 5). consumer
the fashion Google
industry Trends
can be for
a the
costlyproducts/sectors
affair. Fashion they
brands plan
nowon expanding
have the into,
option to
of
understand
analysing the consumer
fashion consumer demand/sentiment
Google Trends for towards the said product
the products/sectors they or sector.
plan onFor example,into,
expanding Figure
to
6 below
2.2.3. shows
Identifying fashion
Brand consumer
Extension Google Trends
Opportunities for smart watches. It
understand the consumer demand/sentiment towards the said product or sector. For example, Figureis evident that the consumer
6interest
below
Brand
in smartfashion
shows watchesconsumer
is increasing
extension, a popular and
overTrends
Google time and
fundamental for issmart
luxury
also becoming
watches.
brand
more seasonal
It is evident
marketing
in demand.
that
strategy
Such
the consumer
(Eren-Erdogmus
information can give confidence to decision makers about investing in new products and show the
etinterest in smart
al. 2018) refers watches is increasing
to the launching of a over
new time
productand under
is also becoming
an existingmorebrand seasonal
name. in demand.inSuch
Investing new
best period for launching said investments in their brands.
information can give confidence to decision makers about investing in new products and show the
products within the fashion industry can be a costly affair. Fashion brands now have the option of
Solankifor
best period (2018) discusses
launching saidthe importance
investments inof plus-size
their brands. as a growing fashion sector, and notes how
analysing fashion consumer Google Trends for the products/sectors they plan on expanding into,
Google Trends
Solanki not discusses
(2018) only shows thean increasingofnumber
importance plus-size of as
searches, but fashion
a growing also thatsector,
the term
andreached
notes how its
to understand the consumer demand/sentiment towards the said product or sector. For example,
peak popularity in UK in June 2018. Another example is presented by Young
Google Trends not only shows an increasing number of searches, but also that the term reached its (2018) with regard to
Figure 6 below shows fashion consumer Google Trends for smart watches. It is evident that the
peak popularity in UK in June 2018. Another example is presented by Young (2018) with regard to
consumer interest in smart watches is increasing over time and is also becoming more seasonal in
demand. Such information can give confidence to decision makers about investing in new products
and show the best period for launching said investments in their brands.
Solanki (2018) discusses the importance of plus-size as a growing fashion sector, and notes how
Google Trends not only shows an increasing number of searches, but also that the term reached its
peak popularity in UK in June 2018. Another example is presented by Young (2018) with regard to the
future of vegan fashion; she discusses Google Trends as a tool which can indicate the future for this
Sustainability
Sustainability
Soc. 2019,
Sci. 2019, 2019,
8, 11, xx FOR
11111, FOR PEER
PEER REVIEW
REVIEW 88 of
of 2423
24
8 of
the future of vegan fashion; she discusses Google Trends as a tool which can indicate the future for
this particular
particular sector.
sector. Overall,
Overall, it is evident
it is evident thatability
that the the ability to accurately
to accurately forecast
forecast such such
trendstrends intofuture
into the the
futureon
based based on historical
historical fashionfashion
consumer consumer
GoogleGoogle
TrendsTrends data
data can be can be of utmost
of utmost importance
importance for
for fashion
fashion brands to develop better and more successful brand extension
brands to develop better and more successful brand extension strategies. strategies.
Figure 6.6.Google
Figure GoogleTrends forfor
Trends smart watches
smart (January
watches 2004–February
(January 2019).2019).
2004–February (Data(Data
Source: Google
Source: Trends,
Google
20 February
Trends, 2019). 2019).
20 February
2.2.4. Identifying Better Marketing Terms
2.2.4. Identifying Better Marketing Terms
Fashion marketing and advertising are more complex today than ever before, with consumers
Fashion marketing and advertising are more complex today than ever before, with consumers
demanding ethical advertising and use of appropriate language (Bae et al. 2015). As Forni (2018)
demanding ethical advertising and use of appropriate language (Bae et al. 2015). As Forni (2018)
asserts, when marketing fashion online, the failure to understand the need for geographical language
asserts, when marketing fashion online, the failure to understand the need for geographical language
changes can be detrimental. Fashion consumer Google Trends can help fashion brands ensure they
changes can be detrimental. Fashion consumer Google Trends can help fashion brands ensure they
are
areusing
using the the most
most appropriate
appropriate terms
terms online
online forfor marketing
marketing andand search
search engine
engineoptimisation
optimisationininthe the
countries
countries in in which
which they
they operate. For example,
operate. For example, Figure
Figure77 below
belowshows
showsthe thefashion
fashionconsumer
consumerGoogleGoogle
Trends for two product categories in two different markets (i.e., United States
Trends for two product categories in two different markets (i.e., United States and United Kingdom).and United Kingdom).
This
Thisexample
example illustrates
illustrates that
that using the term
using the term ‘Men’s
‘Men’s Clothing’
Clothing’as asopposed
opposedto to‘Menswear’
‘Menswear’on ona abrand’s
brand’s
websites
websitesor oreven
even offline
offline marketing campaigns is
marketing campaigns is likely
likelyto
toattract
attractmore
moreengagement
engagementfrom fromthe theconsumer
consumer
in
in the United States. On the other hand, it also shows that using the term ‘Men’s Clothing’ ininthe
the United States. On the other hand, it also shows that using the term ‘Men’s Clothing’ the
United
UnitedKingdom
Kingdommarketmarketwill have
will a completely
have a completely different effecteffect
different as theasterm
the ‘Menswear’
term ‘Menswear’is moreispopular.
more
The abilityThe
popular. to analyse
ability fashion consumer
to analyse fashionGoogle
consumerTrends by country
Google Trendsadds more value
by country addsasmore
it enables
valuebrands
as it
to personalise their websites according to the consumer search interests in any
enables brands to personalise their websites according to the consumer search interests in any given given country across
the globe.across
country Once theagain, being
globe. ableagain,
Once to forecast
beingthese
able tofashion consumer
forecast Googleconsumer
these fashion Trends accurately into the
Google Trends
future can help
accurately into improve
the futuresearch engine
can help optimisation
improve for fashion
search engine brands.for fashion brands.
optimisation
Figure 7. Cont.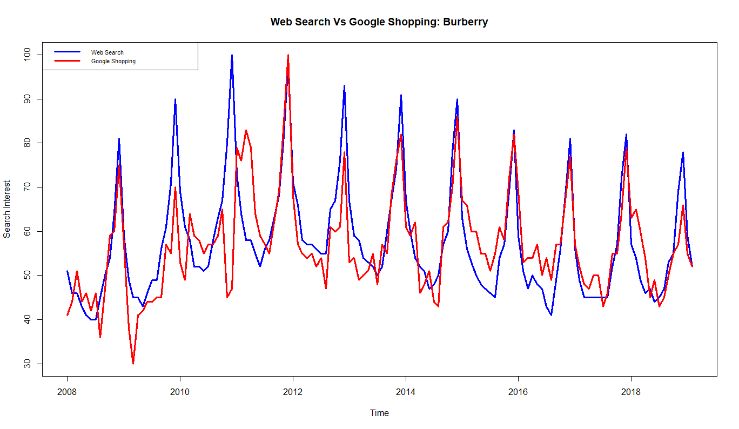
Soc. Sci. 2019, 8, 111                                                                                               9 of 23
  Sustainability 2019, 11, x FOR PEER REVIEW                                                                       9 of 24

                                                                                                                        .
      Figure 7. Google Trends for different product categories in USA and UK (January 2014–March 2019).
        Figure 7. Google Trends for different product categories in USA and UK (January 2014–March 2019).
      (Data Source: Google Trends, 24 March 2019).
        (Data Source: Google Trends, 24 March 2019).
3. Data
  3. Data
Burberry Google Trends
  Burberry Google Trends
      The choice of Burberry as the data set of interest for this study was influenced by several factors.
         The choiceisof
First, Burberry         Burberry
                       one          as thehighest
                           of the UK’s    data setprofile
                                                      of interest for this but
                                                              exporters,   study  was influenced
                                                                                supply               by severalresulting
                                                                                           chain disruptions       factors.
  First,Brexit
from      Burberry   is one of to
                are expected    theadd
                                     UK’s  highestinprofile
                                         millions              exporters,
                                                        extra trade  costsbut
                                                                            for supply     chainhouse
                                                                                 this fashion    disruptions
                                                                                                         (Rovnickresulting
                                                                                                                      2019).
  from    Brexit are  expected   to add  millions    in  extra trade  costs  for this  fashion  house   (Rovnick
Accordingly, there is a need for more data analytics into this brand to help improve its profitability via           2019).
  Accordingly,
more   lucrative there   is a allocations.
                   resource   need for more      data analytics
                                            Secondly,             into this
                                                          as evidenced   in brand    to helpplot
                                                                            the seasonal      improve    its profitability
                                                                                                  in Figure   8, Burberry
  via  more    lucrative  resource   allocations.   Secondly,     as evidenced     in the   seasonal
appears to be struggling in terms of increasing and maintaining online consumer interest in the        plot  in Figure   8,
                                                                                                                     brand
  Burberry    appears   to be  struggling   in  terms   of increasing   and   maintaining    online  consumer
name. Thus, there is need for further analysis and forecasting of future online behavioural trends for             interest
  in the brand
Burberry    so that name.   Thus, there
                     the management      canisputneed   for further
                                                   in place   a series analysis
                                                                       of actionsand     forecastingitsofonline
                                                                                    for improving          futurefootprint
                                                                                                                    online
  behavioural
and               trends for to
     be better positioned      Burberry
                                  compete sowith
                                               that other
                                                     the management
                                                            luxury fashioncanbrands.
                                                                                put in Thirdly,
                                                                                          place a Burberry
                                                                                                   series of actions
                                                                                                               believesfor
                                                                                                                         in
  improving its online footprint and be better positioned to compete with other luxury fashion brands.
the importance of digital innovation and sees ‘online’ as the first access point to its brand (Burberry
  Thirdly, Burberry believes in the importance of digital innovation and sees ‘online’ as the first access
2018a). Therefore, Google Trends-based analytics has the potential to help the brand ensure its online
  point to its brand (Burberry 2018a). Therefore, Google Trends-based analytics has the potential to
content remains highly relevant to its consumers. For example, Burberry (2018a) states the brand
  help the brand ensure its online content remains highly relevant to its consumers. For example,
wishes to personalise online homepages, and fashion consumer Google Trends-based analytics can
  Burberry (2018a) states the brand wishes to personalise online homepages, and fashion consumer
help the brand in identifying the most popular product categories and terminology for any given
  Google Trends-based analytics can help the brand in identifying the most popular product categories
market (see Section 2.2.4). Fourthly, as a brand, Burberry has recently demonstrated its willingness to
  and terminology for any given market (see Section 2.2.4). Fourthly, as a brand, Burberry has recently
change for the better and become more sustainable. For example, in July 2018 Burberry was called out
  demonstrated its willingness to change for the better and become more sustainable. For example, in
for burning millions of its products to protect its brand (BBC 2018). Swift to act, by September 2018
  July 2018 Burberry was called out for burning millions of its products to protect its brand (BBC 2018).
Burberry announced that it will stop the practice of destroying unsaleable products and the use of
  Swift to act, by September 2018 Burberry announced that it will stop the practice of destroying
real fur, and work towards reusing, repairing, donating or recycling their unsaleable goods (Burberry
  unsaleable products and the use of real fur, and work towards reusing, repairing, donating or
2018b; Hanbury 2018; Bain 2018). Thus, Burberry is a brand to watch, and is a brand that is responsive
  recycling their unsaleable goods (Burberry 2018b; Hanbury 2018; Bain 2018). Thus, Burberry is a
to the consumers’ needs and wants.
  brand to watch, and is a brand that is responsive to the consumers’ needs and wants.
      The data considered within the forecast evaluation was extracted through Google Trends and
relates to monthly web search history for the search term “Burberry” as recorded worldwide from
January 2004–February 2019. The chosen time period is influenced by the availability of data and the
fact that longer time horizons can capture the historical trends and changes in seasonal variations
visible in time series. Analysing such detailed information should enable forecasting models to
generate more accurate parameters for modelling and forecasting future consumer trends. However, it
should be noted that depending on the objective of the forecasting exercise, the use of shorter time
series can be more useful under certain scenarios. For example, if a fashion company does not wish to
rely on a nonparametric forecasting model, then analysing shorter time series can be a better option as
longer time series are more likely to be nonstationary over time (Bradlow et al. 2017).
Soc. Sci. 2019, 8, 111 10 of 23
Sustainability 2019, 11, x FOR PEER REVIEW 10 of 24
Figure 8. Seasonal plot of “Burberry” Google Trends (January 2012–December 2018). (Data Source:
Figure Trends,
Google 8. Seasonal plot of “Burberry”
10 February 2019). Google Trends (January 2012–December 2018). (Data Source:
Google Trends, 10 February 2019).
Figure 9 shows the time series plot for Burberry’s fashion consumer Google Trends. The peak in
The data
consumer considered
trends has remained within the forecast
constant evaluation
over time and occurswas extracted
in December through
annualyGoogle Trendswith
coinciding and
relates to monthly
Christmas, web search
but interestingly, historyinterest
consumer for theinsearch termalways
the brand “Burberry” as recorded
declines during theworldwide
start of the from
new
January 2004–February 2019. The chosen time period is influenced by the
year. We also plot the seasonal changes in consumer trends over the last seven years as an example availability of data and the
fact that longer time horizons can capture the historical trends and changes
(Figure 8). This shows how consumer interest in Burberry has declined each season as recorded via in seasonal variations
visible Trends
Google in time(with
series.
theAnalysing
exception such
of 2018 detailed
which isinformation
slightly bettershould
thanenable forecastingupon
2017). Moreover, models to
closer
generate more accurate parameters for modelling and forecasting future consumer
inspection, it is evident that there are constant shifts in seasonality in terms of Burberry’s fashion trends. However,
it should be
consumer notedTrends
Google that depending
over time.onFor theexample,
objectivethe of the forecasting
occurrence exercise,
of troughs the between
vary use of shorter
June, time
July
series can be more useful under certain scenarios. For example, if a fashion
and August resulting in varying amplitudes. It will be interesting to see how the forecasting models company does not wish
to rely onatacapturing
perform nonparametric
these forecasting
minute, yetmodel, then analysing
very important changes.shorter time series can be a better option
as longer time series
As visible (Figure are9),more likely
the data is to be nonstationary
highly seasonal yetover fairlytime (Bradlow
stationary et al.was
(there 2017).
no evidence of
Figure 9 shows the time series plot for Burberry’s fashion consumer
seasonal unit roots based on the Osborn–Chui–Smith–Birchenhall (Osborn et al. 1988) test for Google Trends. Theseasonal
peak in
unit roots) over this time period. In terms of the vertical axis in Figure 9 and the figures that follow,with
consumer trends has remained constant over time and occurs in December annualy coinciding the
Christmas,
numbers but interestingly,
shown represent search consumer
interestinterest
relative in
to the brand always
the highest point on declines during
the chart for thethegiven
startregion
of the
newtime.
and year.AWe also
value of plot
100 isthetheseasonal changes for
peak popularity in consumer
the term. Atrendsvalue ofover the lastthat
50 means seven
the years
term isashalf
an
example
as popular. (Figure
A score8).ofThis shows
0 means how
there was consumer
not enough interest
data forin Burberry
this term. has declined each season as
recorded via Google Trends (with the exception of 2018 which is slightly better than 2017). Moreover,
upon closer inspection, it is evident that there are constant shifts in seasonality in terms of Burberry’s
fashion consumer Google Trends over time. For example, the occurrence of troughs vary between
June, July and August resulting in varying amplitudes. It will be interesting to see how the forecasting
models perform at capturing these minute, yet very important changes.
As visible (Figure 9), the data is highly seasonal yet fairly stationary (there was no evidence of
seasonal unit roots based on the Osborn–Chui–Smith–Birchenhall (Osborn et al. 1988) test for
seasonal unit roots) over this time period. In terms of the vertical axis in Figure 9 and the figures that
follow, the numbers shown represent search interest relative to the highest point on the chart for theSustainability 2019, 11, x FOR PEER REVIEW 11 of 24
given region and time. A value of 100 is the peak popularity for the term. A value of 50 means that
Soc. Sci. 2019, 8, 111 11 of 23
the term is half as popular. A score of 0 means there was not enough data for this term.
Figure9.9.Google
Figure GoogleTrends
Trendsfor
for“Burberry”
“Burberry” (January
(January 2014–February 2019). (Data
2014–February 2019). (DataSource:
Source:Google
GoogleTrends,
Trends,
(10 February 2019).
(10 February 2019).
4. Forecasting Models
4. Forecasting Models
At the outset, it is noteworthy that the forecasting exercise is recursive (i.e., within each horizon
At the outset, it is noteworthy that the forecasting exercise is recursive (i.e., within each horizon
of interest, the models re-estimate parameters by remodelling the historical data with each new
of interest, the models re-estimate parameters by remodelling the historical data with each new
observation that is introduced). This process continues until all required forecasts are computed) and
observation that is introduced). This process continues until all required forecasts are computed) and
considers horizons of 1, 3, 6 and 12 months ahead. At each horizon, we compute N − h + 1 forecasts,
considers horizons of 1, 3, 6 and 12 months ahead. At each horizon, we compute N − h + 1 forecasts,
where N = 60, and h refers to the forecasting horizon of interest. The accuracy of the out-of-sample
where N = 60, and h refers to the forecasting horizon of interest. The accuracy of the out-of-sample
forecasts are evaluated via the Root Mean Squared Error (RMSE) and Ratio of the RMSE (RRMSE)
forecasts are evaluated via the Root Mean Squared Error (RMSE) and Ratio of the RMSE (RRMSE)
criteria. Those interested in the formulae for the RMSE and RRMSE are referred to Silva et al. (2019)
criteria. Those interested in the formulae for the RMSE and RRMSE are referred to Silva et al. (2019)
and references therein. In what follows, we provide concise introductions to the forecasting models
and references therein. In what follows, we provide concise introductions to the forecasting models
used in this paper.
used in this paper.
4.1. Autoregressive Integrated Moving Average (ARIMA)
4.1. Autoregressive Integrated Moving Average (ARIMA)
The Box and Jenkins (1970) ARIMA model is one of the most popular and frequently used
The Box and Jenkins (1970) ARIMA model is one of the most popular and frequently used
parametric time series analysis and forecasting models (Silva et al. 2019). As a parametric model,
parametric time series analysis and forecasting models (Silva et al. 2019). As a parametric model,
ARIMA is bound by the assumptions of normality and stationarity of the residuals and linearity.
ARIMA is bound by the assumptions of normality and stationarity of the residuals and linearity.
Whilst such assumptions are unlikely to hold in the real world, for univariate forecast evaluations, it
Whilst such assumptions are unlikely to hold in the real world, for univariate forecast evaluations, it
is widely accepted that ARIMA should be considered as a benchmark forecasting model (Hyndman
is widely accepted that ARIMA should be considered as a benchmark forecasting model (Hyndman
2010). Moreover, ARIMA has previously been adopted in studies looking at forecasting variables of
2010). Moreover, ARIMA has previously been adopted in studies looking at forecasting variables of
interest
interestininthe fashion
the fashionindustry, forfor
industry, example,
example,Wong
Wongandand
GuoGuo(2010), Yu etYu
(2010), al.et
(2012) and Liu
al. (2012) andetLiu
al. (2013).
et al.
However, in contrast to the aforementioned papers, here, we rely on an automated
(2013). However, in contrast to the aforementioned papers, here, we rely on an automated and and optimised
algorithm
optimisedfor ARIMA,for
algorithm which is popularly
ARIMA, which isreferred to asreferred
popularly ‘auto.arima’, and is accessible
to as `auto.arima’, and freely via the
is accessible
forecast package in R. Those interested in details of the theory underlying ‘auto.arima’ are
freely via the forecast package in R. Those interested in details of the theory underlying `auto.arima’ referred to
Hyndman and Athanasopoulos (2018).
are referred to Hyndman and Athanasopoulos (2018).
4.2. Exponential Smoothing (ETS)
4.2. Exponential Smoothing (ETS)
In brief, ETS forecasts are weighted averages of past observations, where a higher weight is
In brief, ETS forecasts are weighted averages of past observations, where a higher weight is
assigned
assignedtotothethemore
morerecent
recent record
record with
with overall
overall exponentially
exponentially decaying weights (Hyndman
decaying weights (Hyndman andand
Athanasopoulos
Athanasopoulos2018).
2018).The
Thedevelopment
development of of the
the ETS
ETS technique is closely
technique is closely associated
associatedwith
withthe
thework
workofof
Brown (1959), Holt (1957) and Winters (1960), whilst its performance in a fashion context was previously
evaluated through the work of Fumi et al. (2013). In this paper, we rely on the nonparametric,
automated ETS algorithm found within the forecast package in R. Instead of replicating informationSoc. Sci. 2019, 8, 111 12 of 23
surrounding the 30 ETS formulae evaluated as part of the modelling process, we refer those interested
in details of the theory underlying ETS to Hyndman and Athanasopoulos (2018).
4.3. Trigonometric Box–Cox ARMA Trend Seasonal Model
The TBATS model was developed by De Livera et al. (2011) for handling complex seasonal
patterns. Given the earlier discussion around the importance of seasonality in fashion, it is
useful to evaluate the performance of this model at forecasting fashion consumer Google Trends.
Also noteworthy is that this application is the initial application of TBATS for forecasting in fashion.
In brief, TBATS is an exponential smoothing state space model with Box–Cox transformation, ARMA
error correction and Trend and Seasonal components, for which the detailed theoretical foundation
can be found in Hyndman and Athanasopoulos (2018). Once again, we rely on the automated TBATS
algorithm provided via the forecast package in R.
4.4. Neural Network Autoregression (NNAR)
Neural networks represent a nonparametric forecasting model made available as an automated
algorithm via the forecast package in R. The feed-forward neural network model with one hidden
layer is denoted by NNAR (p, P, k)m , where p refers to lagged inputs, P takes a default value of 1 for
seasonal data (as is the case here), k refers to nodes in the hidden layer and m refers to a monthly
frequency. Those interested in the theory are referred to Hyndman and Athanasopoulos (2018), whilst a
discussion around the impact of seasonality on neural network forecasts can be found in Silva et al. (2019).
Interestingly, there have been several applications of varying Neural Network models for forecasting in
fashion research (Au et al. 2008; Sun et al. 2008; Yu et al. 2011; Xia et al. 2012; Kong et al. 2014).
4.5. Denoised Neural Network Autoregression (DNNAR)
The DNNAR model was introduced in Silva et al. (2019) as a solution to the issues identified with
the NNAR model when faced with seasonal time series. In brief, the DNNAR model is a nonparametric
hybrid model which combines the denoising capabilities of singular spectrum analysis (Sanei and
Hassani 2015) with the power of NNAR forecasting to produce superior forecasts. This paper marks
the introductory application of the DNNAR model as a useful and viable option for forecasting in
the fashion industry. We believe the application of the DNNAR model can be useful in this context
because, as Choi and Varian (2012) asserts, the sampling method used to calculate Google Trends
varies somewhat from day-to-day, thus creating a sampling error which contributes to additional noise
in the data. Given that noise refers to random components which cannot be forecasted, it makes sense
to reduce noise levels in fashion consumer Google Trends via the use of a denoising algorithm.
5. Empirical Results
In this section, we present the findings from our attempts at forecasting fashion consumer Google
Trends using a variety of univariate time series analysis and forecasting models. Table 1 below reports
the out-of-sample forecasting results from the forecasting exercise. The first observation is that there
is no single model that can forecast fashion consumer Google Trends for “Burberry” best across all
horizons. We find forecasts from ARIMA outperforming all competing models at h = 1 month-ahead,
whilst forecasts from the TBATS model outperforms the competing forecasts at h = 3 months-ahead.
In the long run, i.e., h = 6 and 12 months-ahead, we find ETS forecasts to be more accurate than those
from ARIMA, TBATS and NNAR models.
The NNAR model is seen to be the worst performer at forecasting fashion consumer Google
Trends for “Burberry” across all horizons. Figure 10 shows a time series plot of the best and worst
performing forecasts at h = 1 month-ahead. In relation to the ARIMA model, the NNAR model fails
at forecasting the peaks in search trends accurately (in addition to the problems with forecasting
troughs accurately). Therefore, these initial findings indicate that if a fashion company wishes to
forecast fashion consumer Google Trends for “Burberry” using univariate models, then they wouldYou can also read