Mobile Phone Data for Urban Climate Change Adaptation: Reviewing Applications, Opportunities and Key Challenges - MDPI
←
→
Page content transcription
If your browser does not render page correctly, please read the page content below
sustainability

Article
Mobile Phone Data for Urban Climate Change
Adaptation: Reviewing Applications, Opportunities
and Key Challenges
Sébastien Dujardin 1, * , Damien Jacques 2 , Jessica Steele 3,4 and Catherine Linard 1
 1    Geography Department, University of Namur, Rue de Bruxelles, 61, 5000 Namur, Belgium;
      catherine.linard@unamur.be
 2    Dalberg Data Insights, Place du Champ de Mars 5, 1050 Brussel, Belgium; Damien.Jacques@dalberg.com
 3    Geography and Environmental Sciences, University of Southampton, University Road, Building 44,
      Southampton SO17 1BJ, UK; steele.jessica@gmail.com
 4    The Flowminder Foundation, Roslagsgatan 17, SE-11355 Stockholm, Sweden
 *    Correspondence: sebastien.dujardin@unamur.be

 Received: 11 December 2019; Accepted: 13 February 2020; Published: 18 February 2020

 Abstract: Climate change places cities at increasing risk and poses a serious challenge for adaptation.
 As a response, novel sources of data combined with data-driven logics and advanced spatial modelling
 techniques have the potential for transformative change in the role of information in urban planning.
 However, little practical guidance exists on the potential opportunities offered by mobile phone data
 for enhancing adaptive capacities in urban areas. Building upon a review of spatial studies mobilizing
 mobile phone data, this paper explores the opportunities offered by such digital information for
 providing spatially-explicit assessments of urban vulnerability, and shows the ways these can help
 developing more dynamic strategies and tools for urban planning and disaster risk management.
 Finally, building upon the limitations of mobile phone data analysis, it discusses the key urban
 governance challenges that need to be addressed for supporting the emergence of transformative
 change in current planning frameworks.

 Keywords: mobile phone data; adaptation; vulnerability; urban planning; climate change; disaster
 risk management; governance

1. Introduction

1.1. Climate Change Adaptation, Urban Planning, and Vulnerability Assessments
      Climate change places cities at increasing risk and poses a serious challenge for adaptation.
Limiting warming to 1.5 ◦ C above pre-industrial levels will require transformative systemic change,
enhanced institutional capacities, and increased capability to integrate scientific, technological, and
social dimensions [1]. In the absence of adequate international responses, cities urgently need to develop
innovative adaptation approaches for tackling the impacts of climate change in urban areas [2,3].
However, the capacity of cities and associated governance systems to deal with climatic extremes and
variability needs to be revisited [4–6]. In particular, the way current urban planning strategies integrate
assessments of populations vulnerable to climate-related hazards have to be put into the perspective of
a 1.5◦ C warmer world and rapidly changing climatic conditions.
      Indeed, although current formal planning tools (e.g., land-use plans, zoning regulations) do
consider environmental change, natural hazards and phenomena that are influenced by climate change
(e.g., floods, coastal storms or sea level rise), these often tend to be static and operate within the old logic
of a conditionally-programmed planning approach [6,7]. For instance, national household censuses

Sustainability 2020, 12, 1501; doi:10.3390/su12041501                        www.mdpi.com/journal/sustainability
Sustainability 2020, 12, 1501 2 of 17
allow identifying the most vulnerable population groups and exposed settlements [8–10]. These, in
turn, allow for quantifying the population sizes and causal mechanisms behind human vulnerability
to climate risks. However, such an approach means that answers on how to plan for climate change
are pre-defined by population trends and climatic conditions observed in the past. This is problematic
since these are changing rapidly. As Fuchs, et al. [11] highlight, current strategic and regulatory tools
of formal planning often fail in practice to strengthen urban adaptation, since these plans are too static
for rapid climatic, population, and land use changes.
Besides, estimates from censuses carry several important limitations for applications in urban
planning. First, due to the uncertain nature of most climate-related hazard events, survey data
regarding pre-and post-event population distribution patterns is extremely difficult to collect, analyse,
and compile [12]. Second, longitudinal censuses are not always undertaken at the same period of the
year at each follow-up round due to logistical difficulties of data collection. This biases vulnerability
assessments when urbanization is growing at fast rates or when significant seasonality exists in climatic
events. Consequently, spatially-explicit population changes across multiple temporal scales are difficult
to assess and limit the application of census-based population maps in urban planning.
1.2. Mobile Phone Data for Urban Climate Change Adaptation
Against this background, novel sources of data have a potential for transformative change in the
role of information in urban planning as we are currently moving towards greater data abundance for
the support of decision-making [13]. Data from mobile phones in particular are increasingly promoted
as an innovative tool in human geography and social sciences research [14,15]. Mobile phones now
have an extremely high penetration rate in the most urbanized areas of the world. According to the
World Bank [16], mobile phone access and use have reached 104 subscriptions per 100 people in 2017
globally; Low-and Middle-Income Countries (LMIC) reached 100 mobile cellular subscriptions per
100 people at the same period. This provides a unique opportunity to analyse the spatio-temporal
distribution of mobile phone calls geo-located to the tower level. Each time a subscriber makes a phone
call, a call detail record (CDR) is generated in the system of the Mobile Network Operator (MNO).
However, little guidance exist in the literature on the potential role of mobile phone data for
urban climate change adaptation, especially the provision of more dynamic vulnerability assessments.
Building upon CDRs, empirical urban studies on smart cities have provided new analytical insights
into population dynamics, mobility patterns, social networks, and socio-demographics. Yet, such types
of big data combined with data-driven logics and advanced spatial modelling techniques have the
potential for improving adaptation in urban systems affected by climate change. Mobile phone data
can be highly valuable in order to overcome the limitations of census-based population estimations
when it is used to evaluate population size and density in a region or city at risk from hazard events,
based on the number of phone users in the coverage area of each cellular tower [17]. From an urban
planning perspective, mobile phone data can also help to develop promising applications that support
the elaboration of innovative formal planning strategies and tools.
Nonetheless, as important as improving the accuracy of vulnerability assessments is the need
to recognise the underlying urban governance issues surrounding the use of mobile phone data in
urban planning and disaster risk management. This implies the need to reflect upon the capacity
of city authorities and wider governance systems to set-up new strategies and data management
protocols that support inclusive and evidence based planning and the appropriate use of available
technology. Responding to this agenda requires further analysis of the multiple types of knowledge
needed in urban climate change adaptation for assessing risk and to capture the potential underlying
issues arising across multi-stakeholders networks belonging to both the scientific and non-scientific
domains. While cities report awareness and will for changing how they manage climate-related
risks [18], researchers often fail to reflect upon the key challenges surrounding the use of mobile phone
data analysis for changing planning frameworks, especially when research outcomes are meant to
support decision-making or triggering far-reaching changes in city governance.Sustainability 2020, 12, 1501 3 of 17
1.3. Aim and Structure of the Paper
On the basis of a state of the art literature review, this paper aims at studying how research using
spatially and temporally detailed data from mobile phone operators can support urban climate change
adaptation. Its specific goal is two-fold: (i) to review current applications of mobile phone data and
explore potential opportunities for providing more dynamic vulnerability assessments, and (ii) to
highlight the key challenges for urban governance underlying the integration and operationalization of
such type of assessments in current planning frameworks. The analytical starting point of this research
is the Methods for the Improvement of Vulnerability Assessment in Europe (MOVE) framework [7],
since it proposes an integrative conceptual framework to systematically assess adaptation, risk and
vulnerability in the context climate change and natural hazards. Therefore, in Section 2, we present a
perspective on adaptation outlining the key dimensions and factors that need to be addressed when
addressing climate risks in urban environments. Section 3 describes the nature of a mobile network
operator infrastructure and mobile phone data features. Then, Section 4 focuses on analysing how
mobile phone data can support vulnerability assessments and improve adaptive capacities in by
integrating these assessments into current planning frameworks. Section 5 provides the key limitations
of mobile phone data for urban adaptation research, and Section 6 discusses the key challenges for urban
governance in order to set-up new planning frameworks that support inclusive and evidence-based
planning and the appropriate use of available technology. Finally, Section 7 concludes the paper.
2. A Perspective on Urban Climate Change Adaptation
The perspective on urban climate change adaptation emphasized here seeks to outline the
importance of cities in L-MICs as major hotspots of risk. Adapting these cities to climate-related risks
implies substantial challenges, as well as opportunities, determined by the specificities that urban
agglomerations encompass [19]. Currently undergoing substantial urbanization, cities in L-MICs are
considered as the most at risk from climate change impacts [20]. Besides, they are both the driver and
the most impacted by global environmental change [6]. The main challenge relates to the size, density
and fast urbanization of coastal cities [21], which are frequently at the epicentre of hazard events and
typically have inadequate or non-existent data infrastructures [17]. Mobile phone data can thus play a
key role for adaptation in these cities as conventional sources of data are often patchy, out-of-date,
or sometimes non-existent [17,19]. Likewise, the poorest urban communities should be the focus of
modelling efforts as they are among the most vulnerable to climate change [22].
In Figure 1, we adapted the MOVE framework [7] in order to study how research using spatially
and temporally detailed data from mobile phone operators can support urban climate change adaptation
within cities in L-MICs (see Section 4 below). Adaptation is frequently conceived as the management
of climate-related risks. Within the field of urban studies, risk assessment frameworks support this
approach to adaptation, where reducing risks from extreme weather events acts to lessen the severity
of shocks to urban systems [23]. Vulnerability, in turn, is often more contested. Yet, Birkmann, et al. [7]
introduced an integrative framework that allow for identifying the most important factors to address
when assessing human vulnerability to climate change. Among the key factors of vulnerability
analysed in this paper are the exposure of an urban area to climate-related hazards; the susceptibility
of the urban system or community exposed; and its resilience or response capacity.
Yet, planning approaches also need to deal more effectively with the processes and types of
knowledge needed to improve adaptive capacities, instead of focusing solely on the adjustment of
physical structures and the built environment [24]. Consequently, urban adaptation is defined here
as the capacity of local authorities (city governors, administrations), businesses (including mobile
phone network operators) and residents (individuals, urban communities), and associated structures
and systems (formal and informal) to prepare for and moderate potential harm from climate change
hazards and exploit any emerging opportunities. More specifically, within this study, urban adaptation
refers to the ways strategies and tools applied or available for use in current planning frameworks canSustainability 2020, 12, 1501 4 of 17
Sustainability 2020, 12, x FOR PEER REVIEW 4 of 16
frameworks
change cantochange
in order in order touse
make appropriate make appropriate
of the use of the offered
available technology available technology
by mobile phone offered by
data and
mobilethe
lessen phone data and
constraints lessen
faced by the constraints
cities faced
to intervene by cities to intervene in vulnerability.
in vulnerability.
Figure 1. Framing adaptation, risk and vulnerability (adapted from [7]). The figure shows the multiple
Figure 1. Framing adaptation, risk and vulnerability (adapted from [7]). The figure shows the multiple
components of climate change adaptation. Risk results from the interactions between hazard events
components of climate change adaptation. Risk results from the interactions between hazard events
and vulnerability. Improved governance and adaptive capacity reduce risks.
and vulnerability. Improved governance and adaptive capacity reduce risks.
This conceptual framework clarifies how climate risks are dependent on the extent to which
This conceptual framework clarifies how climate risks are dependent on the extent to which a
a city or urban population is exposed to a hazard event, the susceptibility of different systems
city or urban population is exposed to a hazard event, the susceptibility of different systems (e.g.,
(e.g., socio-economic, ecological, institutional), and city resilience or response capacity at any time.
socio‐economic, ecological, institutional), and city resilience or response capacity at any time.
Vulnerability is associated with places were populations and urban communities live, even though
Vulnerability is associated with places were populations and urban communities live, even though
these may not experience a harmful hazard. Reducing vulnerability and improving adaptive capacity
these may not experience a harmful hazard. Reducing vulnerability and improving adaptive capacity
hence can help to reduce risk. Hazards are the weather and climate events that a city may experience
hence can help to reduce risk. Hazards are the weather and climate events that a city may experience
(e.g., floods, heat waves, fire, storms). These are the core elements of the urban adaptation agenda.
(e.g., floods, heat waves, fire, storms). These are the core elements of the urban adaptation agenda.
The vulnerability of urban populations, infrastructures and the built environment is thus viewed
The vulnerability of urban populations, infrastructures and the built environment is thus viewed as
as a state that can be monitored using mobile phone data analysis. Yet, surveying the potential
a state that can be monitored using mobile phone data analysis. Yet, surveying the potential role of
role of mobile phone data for adaptation within cities involves a comprehensive understanding of
mobile phone data for adaptation within cities involves a comprehensive understanding of each
each framework components. While mobile phone data offers a wide range of potential applications
framework components. While mobile phone data offers a wide range of potential applications for
for studying the hazard and vulnerability components, the potential role of mobile phone data for
studying the hazard and vulnerability components, the potential role of mobile phone data for
improving current planning frameworks needs also to be analysed by focusing on the governance and
improving current planning frameworks needs also to be analysed by focusing on the governance
adaptation interventions components.
and adaptation interventions components.
Within the next two sections, we first detail the specificities of mobile phone data and then
Within the next two sections, we first detail the specificities of mobile phone data and then
systematically analyse each framework components as to identify opportunities from mobile phone
systematically analyse each framework components as to identify opportunities from mobile phone
data for the support of vulnerability assessments and the improvement of adaptive capacities.
data for the support of vulnerability assessments and the improvement of adaptive capacities.
3. Mobile Phone Data
3.1. Elements of Mobile Network Operator Infrastructure
A mobile phone network is a radio network of individual cells served by Base Transceiver
Stations (BTS). The BTS is responsible for transmitting and emitting radio communications betweenSustainability 2020, 12, 1501 5 of 17
3. Mobile Phone Data
3.1. Elements of Mobile Network Operator Infrastructure
A mobile phone network is a radio network of individual cells served by Base Transceiver Stations
(BTS). The BTS is responsible for transmitting and emitting radio communications between the network
infrastructure and the mobile devices. It consists of a piece of equipment lying underneath an antenna
tower, generally accommodating three antennas each covering a 120-degree sector. The antenna
coverage constitutes the finest spatial granularity provided by mobile phone data. Antenna towers
may be separated by hundreds of meters in urban and suburban areas to a few kilometres in sparsely
populated areas. The coverage of one particular antenna depends on its technical characteristics
(power, orientation, technology, etc.) and the BTS density.
Each communication between two mobile phone users generates metadata stored in the Call
Detail Records (CDR), a database used by the MNO for billing purpose. CDRs typically include the
BTS location of the caller and recipient as well as a timestamp and the call duration. However, the
information stored in CDRs depends first on each MNO as no standardised structure exists (e.g.,
whether long calls are chunked into multiple CDRs) [25]. It is worth mentioning that contrary to
what the term suggests, CDRs are also generated in the case of text messaging and data consumption
(sometimes stored in separate data files).
Selecting a data source for analysis is a trade-off between spatial resolution, temporal resolution,
and data accessibility [26]. CDRs provide information at the highest spatial resolution but are
event-based. Therefore, data are only available when the user makes a call (or send an SMS, use data).
Yet, CDRs are stored offline and are therefore easily accessible. This facilitated access explains why
these are, by far, the data most frequently used by researchers in the academia. These are also the data
we are referring to in this paper when mentioning mobile phone data.
3.2. Mobile Phone Data Features
Conceptually, CDRs can be described as a geospatial, dynamic, weighted and directed network
(Figure 2A). In case of call data, the network is formed by SIM cards (nodes) calling each other (links).
The links are directed from the caller to the recipient and the duration of calls weights each link.
The network changes over time depending on the dynamic of the phone interactions between users.
Finally, each node is geolocated in the vicinity of one antenna from where the call is initiated and
received. By neglecting the geospatial dimension and aggregating (e.g., by taking the sum) the total call
duration or the number of calls between each pair of users over a given period, a static representation
of the CDRs network can be obtained (Figure 2B). Likewise, the spatial trajectory, i.e., time series of
active antennas, of each user is obtained by only keeping the geospatial dimension (Figure 2C). As a
point of interest, CDRs are collected on the fly and potentially accessible in near real-time, a significant
asset for emergency response.received. By neglecting the geospatial dimension and aggregating (e.g., by taking the sum) the total
call duration or the number of calls between each pair of users over a given period, a static
representation of the CDRs network can be obtained (Figure 2B). Likewise, the spatial trajectory, i.e.,
time series of active antennas, of each user is obtained by only keeping the geospatial dimension
(Figure 2C).
Sustainability As12,a 1501
2020, point of interest, CDRs are collected on the fly and potentially accessible in6 near
of 17
real‐time, a significant asset for emergency response.
Figure 2. Schematic representations of Call Detail Records (CDRs) data. Letters (A–D) represent SIM
cards (∼individuals), numbers (1–8) represent antenna coverage approximated by a Voronoï tessellation,
and arrows represent call direction (head) and duration (width). (A) geo-spatial, dynamic, directed
weighted network (here weights are call duration), (B) static, directed weighted network (over t to t + 2
period), and (C) dynamic trajectories of SIM cards.
3.3. Types of Mobile Phone Data Information
The main type of information contained in raw CDRs can be broadly classified into four categories:
population dynamic, mobility, social network, and socio-demographics.
The combination of both spatial and temporal dimension provide valuable information for dynamic
population mapping and the analysis of human activities. The most straightforward application of
CDRs is the estimation of the number of people at a specific place and time. Using census as calibration
data, accurate estimations of the population can be obtained during night-time [17]. In addition, the
temporal signature of BTS activity can be used to define land use patterns. This method has been
applied in urban areas to make the distinction, between residential, business, industrial and leisure
areas among others [27–29].
A spatial trajectory of each mobile phone users can be computed from raw CDRs and use as input
for mobility analyses (Figure 2C). The quality of the inference of such an approach depends on the
frequency of the user activity revealing (e.g., in Figure 2C, the mobility of user D will be better predicted
than user A). Users tend to place most of their calls in short bursts [30], followed by long periods
with no call activity during which information about the user’s location is lacking. However, despite
their temporal sparseness and spatial coarseness, CDRs still offer great insights into the movement
patterns of individuals and communities [31]. A typical application of mobility analysis with CDRs
is the computation of origin-destination matrices at different temporal scales. It allows identifying
different mobility dynamics such as daily commuting and long-term migration.
The call/text network topology (e.g., local density of the network and its connectivity) [32] allow
to better understand human social network. To that end, mobile phone data were used to empirically
study complex sociological processes at large scale. Combining cell phone data with survey responses,
Saramäki, et al. [33] showed that individuals communicate mostly with a small number of people and
that this person’s social signature remain similar over time even when the identity of the individualsSustainability 2020, 12, 1501 7 of 17
involved changed. Mobile phone data have also been used to infer social capital in agricultural market
in Senegal [34].
Finally, a number of socio-demographic factors (e.g., age, gender, ethnicity, language) are expected
to shape the behaviour of mobile phone users. Among others, features such as the volume of calls [35]
or the radius of gyration [36] have been shown to be correlated with wealth and poverty indices.
For this specific objective, it is worth mentioning that data from CDRs are often complemented by
consumption data such as volume and frequency of recharges, a more direct estimator of income [35,37].
4. Mobile Phone Data for Vulnerability Assessments
Building upon a state of the art literature review of spatial studies on mobile phone data, this section
analyses several empirical case studies focusing on how mobile phone data can support vulnerability
assessments and improve adaptive capacities in the context of climate change and natural hazards.
It provides the necessary details for understanding the main opportunities offered by mobile phone
data, while referring to the corresponding literature for further technical and methodological details.
4.1. City’s Spatio-Temporal Exposure
Mobile phone data can support the assessment of city exposure to climate risks by describing the
extent to which a ‘unit of exposure’ or ‘element at risk’ in a city (e.g., a residential neighbourhood)
falls within the geographical range of a hazard event. CDRs, in particular, can picture the spatial
and temporal patterns inherent to exposure by revealing both the locations and intensities of human
activities and the mobility patterns of populations either within or across cities.
The MIT SENSEable City Lab was among the first research group to make a significant contribution
to the field of mobile phone data analyses in urban contexts [38]. Focusing on the cities of Graz and
Milan [39], the authors developed an innovative approach that explored urban forms alongside the use
of mobile phones across the city. Analyses highlighted the relationship between human activities and
urbanization patterns. They applied several advanced statistical methods in order to extract phone
call densities representing the city’s heartbeat. Based on the spatio-temporal signatures of mobile
phones showing the intensity of mobile phone traffic [38], they provided dynamic visualizations of the
cities [40].
Such a type of application of mobile phone data can offer new opportunities for urban planning
by providing innovative, dynamic tools to plan and manage the exposure of a city to climate risks.
As responses to climate risks requires information regarding how many people are located in any
disaster risk-prone area, the same type of modelling exercise should further be extended to assess
the real-time exposure of specific urban populations to climate-related hazards. Csáji, et al. [41] have
shown a strong relationship at a county level between population estimates based on mobile phone data
and census data, showing a correlation of 0.92. This indicates that it is possible to accurately estimate
the size of populations exposed to climate risks based on mobile phone activity at an aggregated level.
Deville et al. [17], however, demonstrated later on that urban areas are also characterized by different
levels of population density during the course of a day and the year. For instance, they showed that
residential areas tend to be more populated during night-time, while commercial and business districts
often become more populated during daytime.
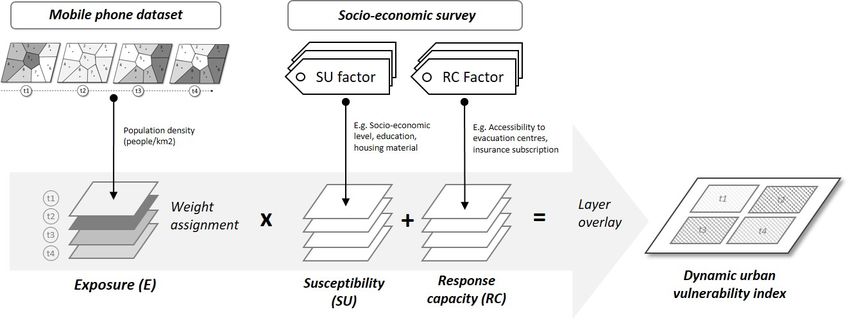
In practice, these populations estimates could be used to add a dynamic component to traditional
social vulnerability assessments. For instance, multi-temporal population distribution maps at several
key time periods (night-time, daytime, working days, holidays) can serve as a weighting factor against
susceptibility and response capacity information coming from other data sources (e.g., socio-economic
surveys) (see Figure 3). A dynamic vulnerability index can then be created and integrated into cities’
strategies for addressing climate risks. The main advantage compared to traditional census-based
vulnerability assessments is to reflect population presence, absence and movements across each unit of
exposure at higher spatial and temporal resolutions. This can drive both short-time supply or demandmaps at several key time periods (night‐time, daytime, working days, holidays) can serve as a
weighting factor against susceptibility and response capacity information coming from other data
sources (e.g., socio‐economic surveys) (see Figure 3). A dynamic vulnerability index can then be
created and integrated into cities’ strategies for addressing climate risks. The main advantage
compared2020,
Sustainability to traditional
12, 1501 census‐based vulnerability assessments is to reflect population presence,
8 of 17
absence and movements across each unit of exposure at higher spatial and temporal resolutions. This
can drive both short‐time supply or demand of emergency responses and long‐term development
of emergency responses and long-term development planning strategies in the space-time continuum
planning strategies in the space‐time continuum of any potential incident area. These aspects are
of any potential incident area. These aspects are explicitly discussed in the next three sections.
explicitly discussed in the next three sections.
Figure3.3.Schematic
Figure Schematic representation
representation of example
of one one example of phone
of mobile mobiledata
phone data application
application for the
for the elaboration
elaboration of a dynamic vulnerability index (DUVI). The index takes the form of: DUVI
of a dynamic vulnerability index (DUVI). The index takes the form of: DUVI = E * (E+SU) where: = E * (E+SU)
where: urban population’s spatio‐temporal exposure (E) is captured by mobile phone data
urban population’s spatio-temporal exposure (E) is captured by mobile phone data and the elaboration and the
elaboration of multi‐temporal population distribution maps at the scale of urban neighbourhoods;
of multi-temporal population distribution maps at the scale of urban neighbourhoods; susceptibility
susceptibility
(SU) and response(SU)capacity
and response capacity (RC)
(RC) information information
is extracted fromis extracted from socio‐economic
socio-economic surveys
surveys and weighted
and weighted
against exposure against exposure
in a typical in a typical
GIS-based GIS‐based
vector vector overlay analysis.
overlay analysis.
4.2. City Resilience and Response Capacity
Cities and urban communities may be lacking resilience and response capacity due to limitations in
terms of access to information about population distributions (exposure), characteristics (susceptibility),
and conditions before and after a disaster. Hence, as CDRs are potentially accessible in near real-time,
having the information regarding how many people can potentially be exposed in any disaster
risk-prone area can help to improve a city preparedness and response capacity. For instance, using
calling behaviour from 5.1 million Grameenphone users in two cities from Bangladesh, Lu, et al. [42]
investigated mobility patterns and anomalies in calling frequency during the cyclone Measham in
May 2013. By analysing urban population movements before, during and after a hazard event, this
type of study can be a significant asset for (i) pre-event risk reduction, (ii) in-time coping, and (iii)
post-event responses.
• Pre-event risk reduction
Anomaly detection of the spatio-temporal patterns of exposed populations can be utilized in an
urban disaster risk reduction and management framework, including for issuing early warning signals
(e.g., sending SMS alerts to all registered mobile phones located within the disaster risk-prone area).
Within the field of crisis management, several studies show the utility of proactive crowd-sourcing in
order to deliver timely information about the status of a city [43–45]. From the perspective of disaster
risk reduction, the analytical technique can help urban authorities to capture population trends before
the event occurs and to evaluate in near real-time whether the existing condition of urban populations
deviate from the usual conditions at any specific time and space in the city [46]. Such a use of mobile
phone data can play a crucial role in pre-event risk reduction as it helps for better understanding the
extent to which a city or urban population will suffer harm or experience losses before the occurrence
of climate-related hazards.
• In-time coping
Mobile phone data further provide potentially successful applications for in-time coping because
it allows for the modelling of human behaviour when exposed to uncertain conditions [47], includingSustainability 2020, 12, 1501 9 of 17
cyclones or typhoon events, flash floods, fires, and landslides. Bagrow, et al. [48] for instance studied
how mobile phone users respond to different types of emergency by analysing real-time changes in
communication behaviours. They showed there is a match between between communication spikes
and the spatio-temporal location of emergencies. Using mobility data derived from CDRs over larger
time periods, Lu, et al. [49] analysed the movements of two million SIM card holders before and after
the 2010 earthquake in Haiti. They found that one-fifth of Port-au-Prince’s residents left the capital city
by nor more than three weeks after the disaster event. They also showed that the trajectory of people
leaving the region hit by the earthquake strongly correlates with people’ mobility patterns in normal
conditions. For coping strategies during disaster events, these findings can benefit city’s response
capacity as they show that population movements during disasters are much more predictable than
previously thought and strongly influenced by people’s social network.
• Post-event response
Another application that greatly benefits from mobile phone data is the organization by local
authorities of post-event responses following a disaster. The sudden impact of climate-related hazards
can lead to the important displacement of large population groups, especially when important damages
to shelters and livelihoods occur and long-term reconstruction efforts are needed [50]. Displaced
populations then become even more vulnerable and much in need for support, which can be responded
using population movements estimations derived from mobile phone data analysis. In Bangladesh,
Lu, et al. [12] observed an increase of users moving to the major neighbourhood city beginning
approximately two days after the cyclone made landfall and continuing throughout the remaining one
and a half months. The increase in absolute value reached approximately 50,000 additional SIM card
holders moving into the city within the six weeks of the cyclone. This allowed for estimating both
inter- and intra-urban population changes in post-disaster situations. For neighbourhoods receiving
migrants, it contributed providing a sampling frame for conducting a needs assessment survey and
direct the necessary resources for intervention.
4.3. Urban Population Susceptibility
Mobile phone data can help to measure the susceptibility (or fragility) of the urban population
exposed by characterizing the type of population groups at risk. This application can be viewed as a
complementary (if not alternative) data source to information collected from traditional census surveys
(see example in Figure 3).
Mobile phone activity (number of calls, when and where) can provide precious information on the
user’s socio-demographic profile, and thus help evaluating the predisposition of the urban population
at risk to suffer harm from climate-related hazards. Poverty in particular can have negative impacts on
the baseline resilience of an urban system and its population groups, thereby undermining successful
adaptation [51,52]. In this regard, the assessment of poverty prevalence, is another major recent
development of mobile phone data. Blumenstock [53] showed how an individual’s historical record
of mobile phone use can infer his/her socio-economic levels using CDRs. Pokhriyal and Jacques [54]
and Steele, et al. [55] both explored this topic further by proposing Bayesian frameworks to combine
disparate data sources (typically mobile phone and Earth Observation data) for improved poverty
prediction and mapping.
Although the relationship between mobility and socio-economic levels may vary among cities [56],
mobility indicators derived from mobile phone data (e.g., radius of gyration, number of activity
locations, activity entropy, travel diversity) can play a pivotal role in characterizing the type of
population at risk. Jiang, et al. [57] for instance pointed that population can be grouped into three main
clusters (workers, non-workers, and students), which may refined into sub-clusters describing activity
types (e.g., home, work, school, transportation, shopping, recreation, entertainment, religion, etc.).
Other studies have identified tourist flows [58] and the presence of foreigners at specific locations [59,60].
Most recently, Xu, et. al. [61] combined information on human mobility from mobile phone data withSustainability 2020, 12, 1501 10 of 17
social-network connections and people’s socio-economic status in order to depict dynamics of human
segregation, which also suggest here that seemingly homogeneous urban populations groups are not
equally at risk to suffer harm from climate-related hazards.
4.4. Adaptive Capacity
The applications detailed above provide the foundation for innovative, evidence-based planning
strategies oriented towards specific urban population groups depending on their mobility patterns,
socio-economic levels, activity types, or even segregation levels. Within the literature, however, these
findings are neither combined or compared, nor put into perspective with a climate-sensitive urban
planning. While providing recommendations on the potential utility of research outcomes, authors
always fail in practice to provide guidance on how such a type of information can be integrated into
current planning frameworks, offering limited opportunities for enhancing cities’ adaptive capacity
in the long term. Within this section, we highlight how cities can enhance their adaptive capacity by
changing the current static planning approaches and frameworks.
Mobile phone data can be viewed as a potential knowledge base and background information
that can be utilised for developing more dynamic urban planning strategies and tools. For instance,
poverty prevalence and socio-economic levels estimates can help prioritizing development objectives
and orient poverty policies within a city. In particular, formal planning strategies can be revised to
incorporate information from mobile phones as a basis for the elaboration or revision of strategic
planning tools (e.g., strategic development plans, disaster risk reduction and management plans) or
regulatory oriented tools (e.g., land use plans, zoning regulations).
Typically, local development plans currently rely upon ‘natural hazard maps’ (e.g., landslide and
flood hazard map) and census-based population maps for restricting developments from risk-prone
areas. Yet, these only provides a static picture of risk since these cannot be updated on a regular basis.
In this case, high-resolution spatio-temporal data from mobile phones can be used to identify which
population group is susceptible, when, and where within specific disaster risk-prone areas. Likewise,
insightful knowledge from dynamic vulnerability assessments, together with climate-related hazard
information such as typhoon or cyclone landfall trajectories forecasts, can provide new perspectives
for the elaboration of Disaster Risk Reduction and Management (DRRM) plans. Depending on the
specific vulnerability of each population group, different types of emergency plans tailored to local
needs can be set up.
Besides, dynamic information from mobile phone data can be used to amend current
regulatory-oriented tools by integrating information on the intensity of urban population activities
and the actual use of lands at risk from climate-related hazards. Land-use categories within cities
are not necessarily well-defined in a way that the same specific area may have multiple functions
at different time periods. For instance, Louail, et al. [62] recently captured the dynamic properties
of 31 Spanish urban areas by defining an urban dilatation index. This index measures the average
distance between individuals and shows how distances evolve during the days, allowing them to
highlight different types of city structures based on the spatial mixing between activities and land
uses. For urban planning, this points towards the possibility of new, quantitative, and multi-temporal
classifications of disaster risk-prone zones where concentrations of populations and the size, bulk,
and placement of buildings may be regulated in accordance with different restrictions or protection
needs/standards specific to the dynamic properties of risk-prone areas.
5. Limitations for Urban Adaptation Research
Researchers and end users should be aware of important issues that may prevent or reduce the use
of mobile phone data in vulnerability assessments and adaptive urban planning. A distinction between
technical and selection biases can be made, i.e., issues can be associated with the mobile network
operator infrastructure itself and/or the (non-) exhaustivity of the population it covers. Depending on
the application, the impact of these bias should be evaluated carefully by the researcher.Sustainability 2020, 12, 1501 11 of 17
People generating CDR data have selected themselves as data generators through their activity,
introducing a ‘selection bias’. First, while the penetration of mobile phone is very high across the globe,
some socio-demographic groups (typically young children, senior, and poor people) are still left out
of the analysis when considering mobile phone metadata. For instance, the adoption base in Africa
has been more traditionally skewed towards a wealthier, educated, urban and predominantly male
population [63,64]. Additionally, one SIM card does not necessarily correspond to one person. Within
L-MICs, this is frequent that someone owns different SIM cards to be able to switch between mobile
carrier’s network depending on promotional campaigns. Phone sharing is also a common practice
among the poorest.
Technical issues can generate different types of missing data. MNOs suffer occasional downtime
during which data are not recorded (missing data). Then, antenna coverages are generally approximated
by means of a Voronoï tessellation because antenna power and orientation are often not communicated
by the MNO. This assumes that mobile phones always connect to the closest antenna. However,
dozens of factors play a role in the decision of the system to assign a specific cell to a phone (e.g., signal
strength, atmospheric conditions, terrain in hilly areas, traffic overload, maintenance schedule). It is,
therefore, possible that a person at the same location, making five successive phone calls, will connect
to five different antennas. Finally, CDR data are always limited to one country and due to technical
challenges, the cross-border movements are difficult to capture. This is an important limitation for large
scale post-disaster migration studies because population displacements can take place across borders.
6. Key Urban Governance Challenges
Current applications and potential opportunities offered by mobile phone data are thus
unparalleled for both understanding population characteristics and dynamics in time-sensitive
disaster situations, and supporting the elaboration of long-term urban planning strategies and tools.
However, the drive towards planning and managing the city via this type of information may also
promote a technocratic, top down mode of urban governance, which assumes that any aspect of a city
can be measured, monitored, and treated as a technical problem that can be solved based solely on
technical solutions [65]. This poses a concern for urban governance in the sense that, using mobile
phone data for urban adaptation should also be considered as a vehicle for promoting the improvement
of planning systems, institutional functioning, and data management protocols themselves [6,24].
This section highlights some of the key challenges for urban governance when mobilizing the big data
analytics described in Section 4.
First, cities have been involved in the process of institutionalizing climate change mitigation and
adaptation within their structures. Among these are the establishment of dedicated climate units in
city administrations, either within a specific relevant department (e.g., natural resources management
office or environment office) or as a cross-sector organization (e.g., mayor’s office) [66]. Yet, using
mobile phone data among an exclusively centralised setting calls for paying greater attention to the
social control mobile phone data offers [67], the potential limitations of standardized data management
protocols in some urban settings [65], as well as the over-reliance on a single mode of operationalization
in urban planning and disaster risk management.
In disaster situations for instance, using this technology for sorting population groups can be
clearly problematic. Using mobile phone data for post-event responses requires different levels of
interventions from the researcher or analyst to the decision-maker and rescue unit. This results in
the possibility of provoking significant social conflicts within the city depending on who decides
what to do, when and where. Hence, using mobile phone data for the identification, prioritization,
and implementation of vulnerability interventions becomes critical because not all options will be
possible owing to constraints such as insufficient local human and material resources, limited capacity
of urban governance institutions, and lack of political power among city authorities. For this specific
reason, mobilizing mobile phone data in urban planning should be the opportunity for renegotiatingSustainability 2020, 12, 1501 12 of 17
who has access to what type of information and how to organize decision making with the multiple
stakeholders involved in both disaster situations and long-term strategic planning processes.
Second, developing innovative urban planning strategies tools based on big data analytics requires
a strong uptake of scientifically-derived, expert knowledge. Yet, while fine-grained information on
local vulnerabilities might be derived from mobile phone data, a comprehensive approach to urban
adaptation also call for considering a multiplicity of knowledge types in urban adaptation [68,69].
However, the selection bias is more than just a limitation in lacking sample representativeness for
analysis, but it also raises a critical issue related to the uneven distribution of mobile phones across
the city and within urban communities. Although marginalized communities with restricted access
to mobile phone technology will not be subject to some potential privacy issues, their voices will
be missing in vulnerability assessments and subsequent contingency plans. This will result in the
implementation of exclusive panning processes where the most marginalised communities are not
given the opportunity to shape the elaboration of planning strategies and disaster risk reduction plans,
or benefit from shared information on potential risks or future resource allocation decisions.
Besides, the lack of qualitative information in CDRs cannot provide information on the actual
cause of anomalies in mobile phone activity. Because of the nature of CDRs, conclusions often rely
upon correlations, of which causal relationships remain uncertain [70]. For instance, an anomaly in
phone call intensity detected by a tower being switched off can be caused either by a specific extreme
weather event, or by a technical power outrage in the city. Making sense of big data thus requires
improved participation and the mediation of different knowledge types for developing long-term
formal planning strategies and tools. Meeting this challenge first requires greater data exchange and
cross-stakeholders cooperation across city residents, government agencies, MNOs, researchers, and
potential end-user organisations. For vulnerability assessments, this means opening up new spaces for
sharing the variety of complementary knowledge of stakeholders on how to deal with hazards and
environmental changes experienced in the past [71]. For adaptive capacity and the improvement of
planning frameworks, this calls for identifying data management protocols, commitments, and capacity
building needed in local governments for handling mobile phone data, design databases, statistical
methods, and vulnerability indicators. Overall, a multi-level cooperation will help identifying how
new types of indicators can be aggregated and disaggregated across spatial scales and make resulting
insights actionable across different levels of planning organisations.
Most critically, combining expert and local knowledge will require a shift in focusing solely on big
data analytics towards the co-creation of a shared knowledge base for action by all stakeholders, not
just for the purpose of research or evidence-based planning at the level of city authorities. This means
reflecting upon who can engage in what planning framework (strategic/normative tools) in developing
new planning strategies and tools. Besides, it requires enquiring about how such type of approach
will shift power relations from corporations towards local practitioners and governments, or even city
residents. Even though most of these challenges are fundamentals of basic urban planning and good
urban governance, these requirements should remain central for researchers seeking to embrace the
transformative potential of mobile phone data in urban adaptation.
7. Conclusions
Mobile phone data can serve a variety of functions. In this paper we specifically explored the
perspective of urban planning and showed how such data are extremely useful, mainly because their
high spatio-temporal resolution have the potential for supporting transformative climate change
adaptation pathways within cities from L-MICs. As a main outcome of this review, it can be concluded
that the continued use of data from mobile phone operators should be supported as it provides valuable
information for urban adaptation. We used the MOVE framework [7] as starting point, because it
provides a comprehensive framework of the multiple components of adaptation in the context of
climate change and natural hazard. Specifically, it helped in analysing the potential ways cities maySustainability 2020, 12, 1501 13 of 17
benefit from mobile phone data information in order to both assess their vulnerability and improving
their adaptive capacity with the development of more dynamic strategies.
In a nutshell, mobile phone data allow for the analysis of urban population activities and
mobility patterns at high spatial and temporal resolutions. This can result in fruitful applications for
vulnerability assessments and support changes in current planning frameworks. More specifically,
these applications relate to: (a) exposure, as CDRs allow for a precise spatial modelling of both
population density and human mobility in cities at a temporal resolutions ranging from a yearly to
an hourly periodicity; (b) urban population susceptibility, as mobile phone data analyses can help
supporting the characterization of the type of population groups at risk, and thus its predisposition to
suffer harm from climate-related hazards; (c) city resilience and response capacity, as mobile phone data
can provide the precise knowledge on populations distributions needed for pre-event risk reduction,
in-time coping, and post-event response measures; and (d) adaptive capacity as dynamic information
from mobile phone data can be integrated as part of formal planning strategies and tools that support
long-term vulnerability interventions within cities.
Considering these potential applications, there is clearly a delicate balance to be maintained as
new forms of technologies are mobilized for urban adaptation. Technologies such as mobile phone
data is a main asset for better addressing the vulnerability of urban communities and managing climate
risks in a continuous manner, thereby overcoming the limitations of static planning approaches based
on population estimations from census data. However, this paper also showed the critical challenge for
urban governance related to the need for completing mobile phone data with the multiplicity of other
knowledge types that come at play when addressing climate-related risk within cities. In other words,
mobile phone data have to be viewed as a means (not an end) for better urban governance, thereby
offering the opportunity to reappraise the principles guiding the elaboration of planning strategies
and tools that often solely rely on big data and scientifically-derived, expert knowledge. When using
mobile phone data for addressing climate risks, both aspects should be considered in order to achieve
long lasting change in cities’ institutional and structural frameworks, and support the emergence
transformative urban adaptation pathways.
In this sense, this paper provided initial thoughts on the potential opportunities and key challenges
for urban adaptation offered by mobile phone data for investigating climate change adaptation in
the field of urban studies. In order to follow that road further, future research should address the
challenge of better understanding how different planning cultures can support the development of
more dynamic planning strategies and tools and identify the type of planning system that offer the
best conditions for supporting changes in current planning frameworks.
Author Contributions: All authors have read and agree to the published version of the manuscript.
Conceptualization, S.D., D.J., J.S., and C.L.; methodology S.D. and C.L.; formal analysis, S.D., D.J., C.L.;
writing—original draft preparation, S.D., D.J.; writing—review and editing, S.D. and D.J.; visualization, S.D. and
D.J.; supervision, C.L.; funding acquisition for publication in this journal, C.L.
Funding: This research was funded by BELSPO (Belgian Federal Science Policy Office) grant number
(REACT/SR/00/337) as part of the STEREO III program.
Conflicts of Interest: The authors declare no conflict of interest.
References
1. De Coninck, H.; Revi, A.; Babiker, M.; Bertoldi, P.; Buckeridge, M.S.; Cartwright, A.; Dong, W.; Ford, J.;
Fuss, S.; Hourcade, J.-C.; et al. Strengthening and Implementing the Global Response. In Global Warming
of 1.5◦ C. An IPCC Special Report on the Impacts of Global Warming of 1.5◦ C Above Pre-Industrial Levels and
Related Global Greenhouse Gas Emission Pathways, in the Context of Strengthening the Global Response to the Threat
of Climate Change, Sustainable Development, and Efforts to Eradicate Poverty; Masson-Delmotte, V., Zhai, P.,
Pörtner, H.-O., Roberts, D., Skea, J., Shukla, P.R., Pirani, A., Moufouma-Okia, W., Péan, C., Pidcock, R., et al.,
Eds.; Springer: Berlin/Heidelberg, Germany, 2018. (In Press)Sustainability 2020, 12, 1501 14 of 17
2. Hedger, M.; Moench, M.; Dixit, A.; Kaur, N.; Anderson, S. Approaches to Planning for Climate Change: Bridging
Concepts and Practice for Low Carbon Climate Resilient Development; Institute of Development Studies: Brighton,
UK, 2011; p. 39.
3. Wamsler, C. Cities, Disaster Risk and Adaptation; Routledge: London, UK, 2014.
4. Davoudi, S.; Crawford, J.; Mehmood, A. Climate Change and Spatial Planning Responses. In Planning
for Climate Change: Strategies for Mitigation and Adaptation for Spatial Planners; Davoudi, S., Crawford, J.,
Mehmood, A., Eds.; Earthscan: London, UK, 2009; pp. 7–18.
5. Lankao, P.R. Urban Areas and Climate Change: Review of Current Issues and Trends; Institute for the Study of
Society and Environment, National Center for Atmospheric Research: Boulder, CO, USA, 2008.
6. Birkmann, J.; Garschagen, M.; Setiadi, N. New challenges for adaptive urban governance in highly dynamic
environments: Revisiting planning systems and tools for adaptive and strategic planning. Urban Clim. 2014,
7, 115–133. [CrossRef]
7. Birkmann, J.; Cardona, O.D.; Carreño, M.L.; Barbat, A.H.; Pelling, M.; Schneiderbauer, S.; Kienberger, S.;
Keiler, M.; Alexander, D.; Zeil, P. Framing vulnerability, risk and societal responses: The MOVE framework.
Nat. Hazards 2013, 67, 193–211. [CrossRef]
8. Ignacio, J.A.F.; Henry, S. Assessing the vulnerability of populations at high risk to coastal river flooding in
the Philippines. In From Social Vulnerability to Resilience: Measuring Progress towards Disaster Risk Reduction.
Publication Series of UNU-EHS No. 17/2012; Cutter, S.L., Corendea, C., Eds.; UNU-EHS: Bonn, Germany, 2013;
pp. 78–92.
9. Cutter, S.L.; Boruff, B.J.; Shirley, W.L. Social vulnerability to environmental hazards. Soc. Sci. Q. 2003, 84,
242–261. [CrossRef]
10. Boruff, B.J.; Cutter, S.L. The environmental vulnerability of Caribbean island nations. Geogr. Rev. 2007, 97,
24–45. [CrossRef]
11. Fuchs, R.; Conran, M.; Louis, E. Climate change and Asia’s coastal urban cities: Can they meet the challenge?
Environ. Urban. Asia 2011, 2, 13–28. [CrossRef]
12. Lu, X.; Wrathall, D.J.; Sundsøy, P.R.; Nadiruzzaman, M.; Wetter, E.; Iqbal, A.; Qureshi, T.; Tatem, A.;
Canright, G.; Engø-Monsen, K. Unveiling hidden migration and mobility patterns in climate stressed regions:
A longitudinal study of six million anonymous mobile phone users in Bangladesh. Glob. Environ. Chang.
2016, 38, 1–7. [CrossRef]
13. Miller, H.J. The data avalanche is here. Shouldn’t we be digging? J. Reg. Sci. 2010, 50, 181–201. [CrossRef]
14. Arribas-Bel, D. Accidental, open and everywhere: Emerging data sources for the understanding of cities.
Appl. Geogr. 2014, 49, 45–53. [CrossRef]
15. Miller, H.J.; Goodchild, M.F. Data-driven geography. GeoJournal 2015, 80, 449–461. [CrossRef]
16. World Bank. World Development Indicators. Mobile Cellular Subscriptions. Available online: https:
//data.worldbank.org/indicator/IT.CEL.SETS.P2 (accessed on 3 January 2019).
17. Deville, P.; Linard, C.; Martin, S.; Gilbert, M.; Stevens, F.R.; Gaughan, A.E.; Blondel, V.D.; Tatem, A.J. Dynamic
population mapping using mobile phone data. Proc. Natl. Acad. Sci. USA 2014, 111, 15888–15893. [CrossRef]
18. Pelling, M.; Leck, H.; Pasquini, L.; Ajibade, I.; Osuteye, E.; Parnell, S.; Lwasa, S.; Johnson, C.; Fraser, A.;
Barcena, A.; et al. Africa’s urban adaptation transition under a 1.5◦ climate. Curr. Opin. Environ. Sustain.
2018, 31, 10–15. [CrossRef]
19. Cinnamon, J.; Schuurman, N. Confronting the data-divide in a time of spatial turns and volunteered
geographic information. GeoJournal 2013, 78, 657–674. [CrossRef]
20. Garschagen, M.; Hagenlocher, M.; Comes, M.; Dubbert, M.; Sabelfeld, R.; Lee, Y.J.; Grunewald, L.;
Lanzendörfer, M.; Mucke, P.; Neuschäfer, O. World Risk Report 2016; United-Nations University: Bonn,
Germany, 2016.
21. Garschagen, M.; Kraas, F. Urban climate change adaptation in the context of transformation: Lessons from
Vietnam. In Resilient Cities; Springer: Berlin/Heidelberg, Germany, 2011; pp. 131–139.
22. Buckee, C.O. Protect privacy of mobile data. Nature 2014, 514, 35. Available online: https://www.nature.com/
articles/514035c#supplementary-information (accessed on 17 February 2020). [CrossRef]
23. Rosenzweig, C.; Solecki, W.D.; Hammer, S.A.; Mehrotra, S. Climate Change and Cities: First Assessment Report
of the Urban Climate Change Research Network; Cambridge University Press: Cambridge, UK, 2011.
24. Birkmann, J.; Garschagen, M.; Kraas, F.; Quang, N. Adaptive urban governance: New challenges for the
second generation of urban adaptation strategies to climate change. Sustain. Sci. 2010, 5, 185–206. [CrossRef]You can also read


