NAVAL POSTGRADUATE SCHOOL
←
→
Page content transcription
If your browser does not render page correctly, please read the page content below
NAVAL
          POSTGRADUATE
             SCHOOL
            MONTEREY, CALIFORNIA

                      THESIS

MALWEBID–AUTODETECTION AND IDENTIFICATION
OF MALICIOUS WEB HOSTS THROUGH LIVE TRAFFIC
                  ANALYSIS

                              by

                        Tony Nichols

                         March 2013
Thesis Co-Advisors:                              Robert Beverly
                                                 Geoffrey Xie

     Approved for public release; distribution is unlimited
THIS PAGE INTENTIONALLY LEFT BLANK
Form Approved
                     REPORT DOCUMENTATION PAGE                                                                                                   OMB No. 0704–0188
The public reporting burden for this collection of information is estimated to average 1 hour per response, including the time for reviewing instructions, searching existing data sources, gathering
and maintaining the data needed, and completing and reviewing the collection of information. Send comments regarding this burden estimate or any other aspect of this collection of information,
including suggestions for reducing this burden to Department of Defense, Washington Headquarters Services, Directorate for Information Operations and Reports (0704–0188), 1215 Jefferson
Davis Highway, Suite 1204, Arlington, VA 22202–4302. Respondents should be aware that notwithstanding any other provision of law, no person shall be subject to any penalty for failing to
comply with a collection of information if it does not display a currently valid OMB control number. PLEASE DO NOT RETURN YOUR FORM TO THE ABOVE ADDRESS.

1. REPORT DATE (DD–MM–YYYY) 2. REPORT TYPE                                                                                          3. DATES COVERED (From — To)
 1–4–2013                                             Master’s Thesis                                                                2012-06-01 – 2013-03-15
4. TITLE AND SUBTITLE                                                                                                  5a. CONTRACT NUMBER

                                                                                                                       5b. GRANT NUMBER
 MalWebID–Autodetection and Identification of Malicious Web Hosts
 Through Live Traffic Analysis
                                                                                                                       5c. PROGRAM ELEMENT NUMBER

6. AUTHOR(S)                                                                                                           5d. PROJECT NUMBER

                                                                                                                       5e. TASK NUMBER

 Tony Nichols
                                                                                                                       5f. WORK UNIT NUMBER

7. PERFORMING ORGANIZATION NAME(S) AND ADDRESS(ES)                                                                                  8. PERFORMING ORGANIZATION REPORT
                                                                                                                                       NUMBER
 Naval Postgraduate School
 Monterey, CA 93943

9. SPONSORING / MONITORING AGENCY NAME(S) AND ADDRESS(ES)                                                                           10. SPONSOR/MONITOR’S ACRONYM(S)

 Department of the Navy                                                                                                             11. SPONSOR/MONITOR’S REPORT
                                                                                                                                        NUMBER(S)

12. DISTRIBUTION / AVAILABILITY STATEMENT

 Approved for public release; distribution is unlimited

13. SUPPLEMENTARY NOTES
 The views expressed in this work are those of the author and do not reflect official policy or position of the Department of
 Defense or the U.S. Government.
14. ABSTRACT

 This thesis investigates the ability for recently devised packet-level Transmission Control Protocols (TCP) transport classifiers
 to discover abusive traffic flows, especially those not found via traditional methods, e.g., signatures and real-time blocklists.
 Transport classification is designed to identify hosts considered to be part of abusive infrastructure without deep packet
 inspection. A particular focus is to understand the applicability of such methods to live, real-world network traffic obtained
 from the Naval Postgraduate School campus enterprise network. This research evaluates both how consistent and how
 complimentary transport traffic classification is with known blocklists. In particular, the system has a 97.8% average accuracy
 with respect to blocklist ground-truth, while also correctly identifying 94% of flows to abusive hosts unknown to the blocklists
 as verified through manual sampling.
15. SUBJECT TERMS

 Network Security, Malicious Activity, Abusive Infrastructure
16. SECURITY CLASSIFICATION OF:       17. LIMITATION OF                                           18. NUMBER 19a. NAME OF RESPONSIBLE PERSON
a. REPORT    b. ABSTRACT c. THIS PAGE     ABSTRACT                                                    OF
                                                                                                      PAGES
                                                                                                             19b. TELEPHONE NUMBER (include area code)
 Unclassified Unclassified Unclassified                                       UU                           81
   NSN 7540-01-280-5500                                                                                                                                  Standard Form 298 (Rev. 8–98)
                                                                                                                                                         Prescribed by ANSI Std. Z39.18
                                                                                                       i
THIS PAGE INTENTIONALLY LEFT BLANK

                 ii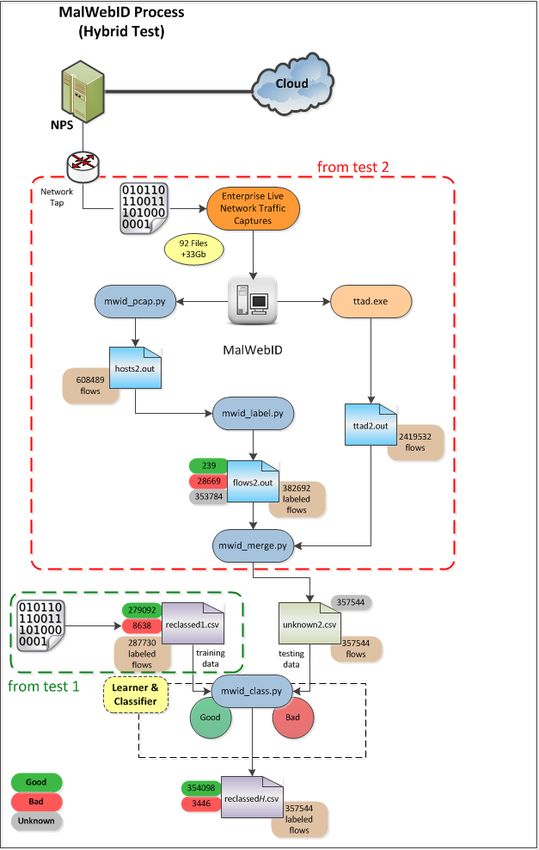
Approved for public release; distribution is unlimited

MALWEBID–AUTODETECTION AND IDENTIFICATION OF MALICIOUS WEB
           HOSTS THROUGH LIVE TRAFFIC ANALYSIS

                                  Tony Nichols
                   Lieutenant Commander, United States Navy
                           B.S., University of Phoenix

                       Submitted in partial fulfillment of the
                          requirements for the degree of

              MASTER OF SCIENCE IN COMPUTER SCIENCE

                                      from the

                     NAVAL POSTGRADUATE SCHOOL
                              March 2013

    Author:                     Tony Nichols

    Approved by:                Robert Beverly
                                Thesis Co-Advisor

                                Geoffrey Xie
                                Thesis Co-Advisor

                                Peter J. Denning
                                Chair, Department of Computer Science

                                         iii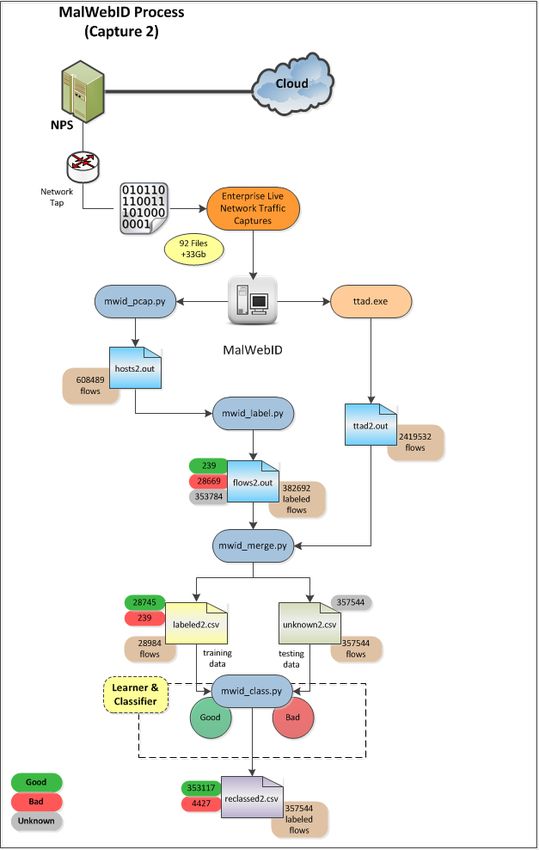
THIS PAGE INTENTIONALLY LEFT BLANK

                iv
ABSTRACT
This thesis investigates the ability for recently devised packet-level Transmission Control Pro-
tocols (TCP) transport classifiers to discover abusive traffic flows, especially those not found
via traditional methods, e.g., signatures and real-time blocklists. Transport classification is
designed to identify hosts considered to be part of abusive infrastructure without deep packet
inspection. A particular focus is to understand the applicability of such methods to live, real-
world network traffic obtained from the Naval Postgraduate School campus enterprise network.
This research evaluates both how consistent and how complimentary transport traffic classifi-
cation is with known blocklists. In particular, the system has a 97.8% average accuracy with
respect to blocklist ground-truth, while also correctly identifying 94% of flows to abusive hosts
unknown to the blocklists as verified through manual sampling.
vTHIS PAGE INTENTIONALLY LEFT BLANK
viTable of Contents
1 Introduction 1
1.1 Significance of Work to the DoD . . . . . . . . . . . . . . . . . . . . 2
1.2 Scope . . . . . . . . . . . . . . . . . . . . . . . . . . . . . . . 3
1.3 Goals . . . . . . . . . . . . . . . . . . . . . . . . . . . . . . . 3
1.4 Results . . . . . . . . . . . . . . . . . . . . . . . . . . . . . . 4
1.5 Thesis Organization . . . . . . . . . . . . . . . . . . . . . . . . . 4
2 Background 7
2.1 Prior Work . . . . . . . . . . . . . . . . . . . . . . . . . . . . . 7
2.2 Machine Learning / Supervised Classifiers . . . . . . . . . . . . . . . . 12
2.3 Classification Techniques . . . . . . . . . . . . . . . . . . . . . . . 13
2.4 Real-time Blackhole List and Alexa . . . . . . . . . . . . . . . . . . . 16
3 Methodology 19
3.1 Overview . . . . . . . . . . . . . . . . . . . . . . . . . . . . . 19
3.2 Packet Captures . . . . . . . . . . . . . . . . . . . . . . . . . . . 22
3.3 Programmatic Functions . . . . . . . . . . . . . . . . . . . . . . . 23
3.4 RBS and Alexa . . . . . . . . . . . . . . . . . . . . . . . . . . . 27
3.5 Flow Feature Labeling . . . . . . . . . . . . . . . . . . . . . . . . 28
4 Results 29
4.1 Testing . . . . . . . . . . . . . . . . . . . . . . . . . . . . . . 29
4.2 Testing Sets . . . . . . . . . . . . . . . . . . . . . . . . . . . . 30
4.3 Hybrid Testing . . . . . . . . . . . . . . . . . . . . . . . . . . . 40
4.4 Sampling Analysis. . . . . . . . . . . . . . . . . . . . . . . . . . 41
vii4.5 Classification Examples. . . . . . . . . . . . . . . . . . . . . . . . 49
5 Conclusion and Future Work 55
5.1 Conclusion . . . . . . . . . . . . . . . . . . . . . . . . . . . . . 55
5.2 Key Results . . . . . . . . . . . . . . . . . . . . . . . . . . . . 56
5.3 Future Work . . . . . . . . . . . . . . . . . . . . . . . . . . . . 57
5.4 Summary . . . . . . . . . . . . . . . . . . . . . . . . . . . . . 59
viiiList of Figures
Figure 3.1 MalWebID Flow Process. . . . . . . . . . . . . . . . . . . . . . . . . 21
Figure 3.2 Example Traffic Features Extracted by TTAD. . . . . . . . . . . . . . 24
Figure 4.1 MalWebID Programmatic Flow for Capture 1. . . . . . . . . . . . . . 32
Figure 4.2 MalWebID Programmatic Flow for Capture 2. . . . . . . . . . . . . . 35
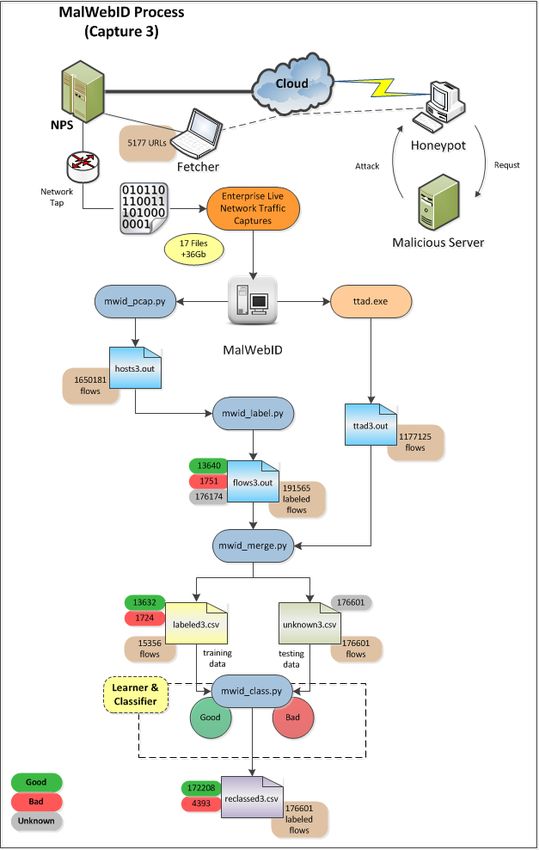
Figure 4.3 MalWebID Programmatic Flow for Capture 3. . . . . . . . . . . . . . 37
Figure 4.4 MalWebID Programmatic Flow for Capture 4. . . . . . . . . . . . . . 38
Figure 4.5 MalWebID Programmatic Flow for Hybrid Test. . . . . . . . . . . . . 40
Figure 4.6 Flow Labeling Conflicts . . . . . . . . . . . . . . . . . . . . . . . . . 48
Figure 4.7 Test 1 - Conflict Percentages . . . . . . . . . . . . . . . . . . . . . . . 52
Figure 4.8 Test 2 - Conflict Percentages . . . . . . . . . . . . . . . . . . . . . . . 52
Figure 4.9 Test 3 - Conflict Percentages . . . . . . . . . . . . . . . . . . . . . . . 53
Figure 4.10 Test 4 - Conflict Percentages . . . . . . . . . . . . . . . . . . . . . . . 53
ixTHIS PAGE INTENTIONALLY LEFT BLANK
xList of Tables
Table 2.1 Supervised Learning Feature Model . . . . . . . . . . . . . . . . . . . 13
Table 3.1 MalWebID Program Process . . . . . . . . . . . . . . . . . . . . . . . 19
Table 3.2 Packet Captures . . . . . . . . . . . . . . . . . . . . . . . . . . . . . . 22
Table 3.3 Transport Traffic Analysis Daemon (TTAD) Transport Traffic Features . 24
Table 3.4 Transmission Control Protocol (TCP) Header Information . . . . . . . 25
Table 3.5 Fetcher Processed Uniform Resource Locators (URLs) . . . . . . . . . 26
Table 3.6 Processed Capture Details . . . . . . . . . . . . . . . . . . . . . . . . 27
Table 4.1 Composition of labeled.csv and unknown.csv Files . . . . . . . . . . . 31
Table 4.2 Test One - Prediction Accuracy . . . . . . . . . . . . . . . . . . . . . . 33
Table 4.3 Test One - Confusion Matrix . . . . . . . . . . . . . . . . . . . . . . . 33
Table 4.4 Test Two - Prediction Accuracy . . . . . . . . . . . . . . . . . . . . . . 34
Table 4.5 Test Two - Confusion Matrix . . . . . . . . . . . . . . . . . . . . . . . 34
Table 4.6 Test Three - Prediction Accuracy . . . . . . . . . . . . . . . . . . . . . 36
Table 4.7 Test Three - Confusion Matrix . . . . . . . . . . . . . . . . . . . . . . 36
Table 4.8 Test Four - Prediction Accuracy . . . . . . . . . . . . . . . . . . . . . 39
Table 4.9 Test Four - Confusion Matrix . . . . . . . . . . . . . . . . . . . . . . . 39
Table 4.10 Hybrid Test (1 and 2) - Prediction Accuracy . . . . . . . . . . . . . . . 41
Table 4.11 Hybrid Test - Confusion Matrix . . . . . . . . . . . . . . . . . . . . . 41
xiTable 4.12 Fetcher - Manual Sample Confusion Matrix . . . . . . . . . . . . . . . 43
Table 4.13 Fetcher - Manual Sample Results . . . . . . . . . . . . . . . . . . . . . 43
Table 4.14 Test 1 - Manual Sample Confusion Matrix . . . . . . . . . . . . . . . . 43
Table 4.15 Test 1 - Manual Sample Results . . . . . . . . . . . . . . . . . . . . . 43
Table 4.16 Test 2 - Manual Sample Confusion Matrix . . . . . . . . . . . . . . . . 44
Table 4.17 Test 2 - Manual Sample Results . . . . . . . . . . . . . . . . . . . . . 44
Table 4.18 Hybrid Test - Manual Sample Confusion Matrix . . . . . . . . . . . . . 45
Table 4.19 Hybrid Test - Manual Sample Results . . . . . . . . . . . . . . . . . . 45
Table 4.20 Test 3 - Manual Sample Confusion Matrix . . . . . . . . . . . . . . . . 45
Table 4.21 Test 3 - Manual Sample Results . . . . . . . . . . . . . . . . . . . . . 46
Table 4.22 Test 4 - Manual Sample Confusion Matrix . . . . . . . . . . . . . . . . 46
Table 4.23 Test 4 - Manual Sample Results . . . . . . . . . . . . . . . . . . . . . 46
Table 4.24 Conflict Percentages . . . . . . . . . . . . . . . . . . . . . . . . . . . 49
xiiList of Acronyms and Abbreviations
ACC Accuracy
CA Classification Accuracy
CDF Cumulative Distribution Function
CIO Chief Information Officer
C&C Command and Control
CV Cross Validation
DBL Domain Block List
DNS Domain Name Service
DNSBL Domain Name System Block Lists
DoD Department of Defense
DON Department of Navy
DOS Denial of Service
FN False Negative
FP False Positive
IG Information Gain
IP Internet Protocol
MAP Maximum A-posteriori Probability
MWID Malicious Website Identification
NPS Naval Postgraduate School
PBL Policy Block List
PII Personally Identifiable Information
PPV Positive Predictive Value
RBL Real-time Blackhole List
SENS Sensitivity
xiiiSORBS Spam and Open Relay Blocking System
SBL Spamhaus Block List
SMTP Simple Mail Transfer Protocol
STC Spatial-Temporal Correlation
TCP Transmission Control Protocol
TN True Negative
TP True Positive
TTAD Transport Traffic Analysis Daemon
URL Uniform Resource Locator
XBL Exploits Block List
xivAcknowledgements
First and foremost, I must thank my loving wife, Michelle, who has sacrificed the most these
past two years. Her unwavering patience, understanding, and unconditional support were cru-
cial to me making it through this program and finishing the studies for my degree. Words can
never begin to describe my gratitude for everything she has done and continues to do for me.
I would like to express my sincere gratitude and appreciation to my thesis advisors, Dr. Robert
Beverly and Dr. Geoffrey Xie. Your expertise and exceptional level of knowledge are unpar-
alleled! I can not begin to thank you both enough for your constant encouragement, patience,
keen technical insight, and the superb guidance you provided me toward making this thesis
possible. Thank you!
xvTHIS PAGE INTENTIONALLY LEFT BLANK
xviCHAPTER 1:
Introduction
In today’s advanced digital age of high-tech sophisticated and integrated networking systems,
one consistent peril that most organizations and common computer users face is “abusive” in-
frastructure. Despite the concerted efforts of industry and academia, the threats posed by abu-
sive sites remain a constant problem. This thesis explores a technique to discern hosts that
support abusive web infrastructure by discovering differentiating characteristics of their traf-
fic flows. In particular, TCP-level flow statistics can reveal hosts that are both congested and
poorly provisioned–features that this work shows are frequently associated with abusive sys-
tems. Importantly, the approach in this thesis is privacy preserving, allowing deployment in
new domains, while being complimentary to existing abusive traffic detection methods.
Abusive infrastructure on the network consists of systems that function subversively to assist
and/or advance malicious or illegal activities in various forms. Abusive infrastructure can in-
clude, but is not limited to, web sites that cater to, sponsor, or actively participate in supporting
various forms of malicious content. Thus, abusive infrastructure commonly includes botnets
and complicit service providers who may produce abusive traffic that includes email spam,
malware, scam hosting, denial of service, scanners, etc. Underscoring the impact of abusive
traffic, in 2010, more than 89% of all email messages on the Internet were attributed to spam.
Furthermore, about 88% of these spam messages were sent with the help of botnets [1].
Much time and effort continues to be expended toward methods of limiting or negating the im-
pact of malicious type activities that occur throughout the Internet. Existing methods, some of
which are covered in Chapter 2, have been developed and used to deter abusive traffic. Unfor-
tunately, many deployed techniques are often circumvented by adversaries who quickly adapt
by evading detection/blocking methods, or by developing new schemes designed to go unde-
tected. Thus, despite significant advances in technology and methodology, malicious activities,
and resulting abusive traffic, remain prevalent. Not only is abusive traffic a constant source of
frustration, it can have potentially more serious consequences when used to subvert security
policies and carry out malicious acts aimed at harming systems or the data they store.
Being able to identify abusive traffic, especially traffic not previously identified, at an early
stage to block its ingress into critical information systems infrastructure, and have the ability
1to block egress from a specific system or user that is bound for an abusive infrastructure, is the
primary goal of this research.
1.1 Significance of Work to the DoD
Within the Department of Defense (DoD), unsolicited bulk email, for example, spam, phishing,
or spoofing, is a constant source frustration and economic burden. According to the Department
of Navy (DON) Chief Information Officer (CIO), the protection of vital DON networks and in-
formation, given the popularity of malware and cyber terrorism, continues to be a challenge. In
his report in 2009, the CIO goes on to indicate that each month the DON blocks approximately
9 million spam messages and detects more than 1,200 intrusion attempts, while blocking an
average of 60 viruses monthly before they can infect the Navy and Marine Corps network [2].
The particular burden that is placed upon Naval organizations comes in the form of wasted man
hours, which is the time, effort and money spent to eliminate this type of email. The time spent
toward remediation efforts of systems that have become infected, as a result of the execution
of a malicious link within the unsolicited email or the visit to a malicious web site, can vary
greatly depending on the particular infection and method of deployment. This is even more
so a challenge for those units, for example, the Navy, where limited bandwidth and satellite
connectivity is the primary means of connectivity for communications and networking, both
tactical and non-tactical. Spam ties up crucial limited bandwidth and network resources, as
spam adds to the total cost of network operations. Spam has and continues to be disruptive in
that it can contribute to network mail server crashes or Denial of Service (DOS).
Navy information systems that become compromised as the result of malware or malicious
activities can lead to anything from the minor inconvenience associated with a temporary loss
of service to a major catastrophe with systems being impacted for long periods of time. Like
many organizations, the Navy relies on these information systems to a great extent and cannot
adequately perform many of its mission sets when critical information systems are rendered
inoperable.
Though Navy information systems, like other armed services and government agencies, have
networks internal to the specific organization, they are still connected to the Internet. This
in turn opens up vulnerabilities that any malicious entity might attempt to exploit. Even the
common user offers up a level of vulnerability through the websites he may visit or a particular
spam email that happen to have arrived in their inbox. All of these threaten to compromise the
2integrity, availability, and accessibility of our networks and critical information systems.
In serious cases involving compromised systems, not only can the system be rendered unavail-
able, it is also possible that the malicious activities would involve data exfiltration and loss of
official use only or Personally Identifiable Information (PII).
The impact of abusive infrastructure is not confined to spam. Compromised hosts may also
contribute to scam hosting infrastructure, including web and Domain Name Service (DNS)
capabilities, or may directly participate in harvesting sensitive data or sending attack traffic.
1.2 Scope
In our research, we will concentrate on conducting transport analysis on real-world active net-
work traffic and apply recently devised packet-level TCP transport classifiers to discover abusive
traffic flows, especially those not found via traditional methods, e.g., blocklists. Through trans-
port analysis methods, we will gain a better understanding of the real-world performance of our
classifier, improve upon both the classifier and fine tune existing methods, and seek to develop
new analysis techniques to identify and expose malicious web hosts.
Malicious Website Identification (MWID) or MalWebID is our collection of tools, programs,
and processes that have been developed to identify abusive web sites and infrastructure as part
of this thesis.
In particular, focusing on and understanding the practical, real-world performance of using
transport traffic features to identify malicious web sites found in live traffic streams, we aim
to introduce a novel approach to identifying abusive infrastructure. Our approach and use of
MWID’s technique may in fact help redefine how abusive infrastructure is identified and help
pave the way to better methods of blocking these types of sites.
1.3 Goals
Leveraging the research previously performed in the papers outlined in Chapter 2 and under-
standing the different approaches taken in identifying and combating malicious content, our
research will demonstrate a novel technique that utilizes the features of network traffic for de-
tecting and classifying abusive infrastructure. Our goals are to explore the following:
• Determine if it is possible to accurately detect and identify a malicious web host in real-
time, via an automated means, even when the malicious host is currently unknown or does
3not currently exist on any known “black list” or “block list”, which are both discussed in
Chapters 2 and 3.
• Introduce the MWID tool set and demonstrate its capabilities as a fast and efficient means
of collecting and analyzing live network traffic to accurately detect and identify malicious
or abusive infrastructures, all while preserving privacy.
• Determine if our technique of transport traffic analysis can provide a mechanism to help
aid existing host-based security systems and provide an added layer to improve protection.
• Determine if new techniques or classification algorithms are required in order to produce
the overall Classification Accuracy (CA) to demonstrate the effectiveness of our approach
at correctly identifying and classifying malicious hosts.
1.4 Results
By conducting transport analysis on real-world “active” network traffic and applying the use of
recently devised packet-level TCP transport classifiers to discover abusive traffic flows, we are
able to provide the following contributions through the use of MWID:
1. present a fast and efficient (passive) tool that is able to run on a variety of systems, pri-
marily connected or installed at the core of a network, that will help augment existing
network security infrastructure by detecting abusive traffic and infrastructure.
2. then demonstrate the effective means of detecting abusive traffic through the statistical
analysis of key transport layer traffic features.
3. provide detailed analysis of our findings while working with live data captures, specifi-
cally an overall classification accuracy that exceeds 95 percent.
4. offer recommendations for future work.
This tool represents a step toward combating malicious and abusive infrastructure. With the
proper integration within a network’s security architecture, such as that of the DoD, MWID may
provide a viable means to help reduce the threat posed by many types of abusive infrastructure.
1.5 Thesis Organization
The remaining sections of this thesis are broken down into the following key chapters:
• Chapter 2 provides background information to tie in the scope and context of the problem.
We discuss previous research performed in the area of detecting and identifying abusive
infrastructure and perform a brief comparison of our work to that the previous work.
4• Chapter 3 provides a synopsis of our experiment methodology, detailing the steps that
were conducted during the research. Specifically:
– Phase I: Data Collection and Development
– Phase II: Testing and Refinement of Classifier
– Phase III: Evaluate Live Captures
– Phase IV: Test and Reevaluate Data Sets
• Chapter 4 provides a review and overall assessment of the results found during the re-
search and experiments.
• Chapter 5 provides a summary of conclusions and outline future work of importance in
stopping abusive infrastructure.
5THIS PAGE INTENTIONALLY LEFT BLANK
6CHAPTER 2:
Background
Over the past few years there has been a dizzying growth in the use of the Internet, primarily
in the area of of web services, including cloud computing, blogs, video services, and popular
social media sites. In December 2000, there were near 361 million Internet users and by the
end of December 2012, there were over 2.4 billion users, which equates to a 566% increase in
Internet users [3].
Unfortunately, systems connected to the Internet are constantly in danger and run the risk of
exposure to malicious acts, which include phishing, malware, and scams, all of which pose a
reoccurring threat.
While seemingly able to manifest in a variety of different forms, attacks can cause problems
ranging from a simple inconvenience to something more severe, such as extracting sensitive
personal data or the permanent deletion of data. Considering the negative impact that malicious
activity has and continues to have on our networks and information systems, a great deal of
work has taken place within academia related to detecting abusive infrastructure and thwarting
its ability to adversely impact critical computing infrastructure.
2.1 Prior Work
Considering the enormous efforts that have been expended toward combating abusive infras-
tructure, significant progress has been made in the field, to include traffic content monitoring,
detecting and documenting abusive networks, and identifying abusive communications patterns.
Specific research that has had the greatest influence on this thesis are in the area of auto-learning
of Simple Mail Transfer Protocol (SMTP) TCP transport-layer features for spam [4], trans-
port traffic analysis of abusive infrastructure [5], exploiting transport-level characteristics of
spam [6], and BotMiner [7], and more recently BotFinder [8]. Some key areas of interest are
summarized here.
2.1.1 Transport Traffic Analysis
Recent work by Nolan on transport traffic analysis of abusive infrastructure [5] investigated a
passive analysis technique to identify discriminating features of abusive traffic, using per-packet
7TCP header and timing features, to identify congestion, flow-control, and other key flow char-
acteristics. Because abusive infrastructure is often poorly connected, or connected to residential
networks, these characteristics were used to identify links that are typically associated with that
of an abusive infrastructure. The passive approach shown in his research did not rely on ei-
ther content inspection, Command and Control (C&C) signatures, or that of sender reputation,
thus maintaining data privacy and facilitating wider potential deployment scenarios. Further,
the technique is complementary to other methods. The technique showed promise, in that he
achieved a classification accuracy up to 94% in detecting abusive infrastructure, with only a
3% false positive rate. Unfortunately, the results were limited in that they were inclusive only
of traffic captured in an experimental environment, and used Alexa as the source of legitimate
websites, rather than the true mix of traffic an enterprise or organization might experience.
This thesis builds upon Nolan’s work, where we perform live network traffic analysis with the
goal of identifying not only previously identified malicious hosts, which account for those that
have been identified and are currently on a blacklist, but more significantly identifying unknown
malicious hosts, those that have not been seen or previously documented, i.e., truly abusive hosts
that do not appear in any current blacklists.
Blacklists, also known as blocklists, are simply a list that consist of either Internet Protocol (IP)
addresses, host names, or a combination of both and have been determined by a variety of
means to be malicious in nature. i.e., IP addresses that are identified as generating spam can be
blacklisted and are blocked from being able to deliver email. In most circumstances, when an
IP address or host name is blacklisted, no notice is sent to the user or owner.
2.1.2 Auto-learning
Kakavelakis et al. introduces auto-learning using the transport-layer features, by developing an
application that performs transport traffic analysis aimed at the spam reception problem. The
auto-learning aspect is the process of building up the classification model based on exemplar
e-mail messages whose scores exceed certain threshold values [4]. They take their training data,
which consists of data that is clearly spam and clearly ham, and use the associated flow-features
to train Spamflow. Working off of the premise that for a spam campaign to be financially
viable, the host server must maximize its output of spam traffic. This in turn means that the
host machines produce an exorbitant amount of network traffic, which can then be identified
and disassociated from normal network traffic. Here, they design SpamFlow [6] as a plugin
to SpamAssassin, a well-known learning-based spam filter used to identify spam signatures.
8SpamFlow is a unique tool (analyzer) that listened on an interface and captured flows of data,
to then build features for each flow of traffic seen. For spammers, the properties of the feature
properties of the transport-layer prove to be different than that of normal user traffic and able to
be identified. Once these features are gathered and processed using an auto-learning classifier,
they were able to accurately identify and distinguish spam traffic from that of general use traffic,
with a greater than 95% accuracy rate.
This thesis uses the method performed by Kakavelakis et al. and Nolan, but as applied to
the problem of specifically identifying abusive infrastructure. Using statistical traffic signal
characterization as a discriminator for spam has proven to be effective. We believe that by
capturing specific traffic features from each tcp flow and conducting statistical analysis on those
features, previously labeled as good or bad, will show to be an effective tool at differentiating
between non-malicious and malicious and traffic, independent of content or location.
Building upon this previous work and recently developed packet-level TCP transport classifiers,
our research involves methods applied to live network traffic to discover not only “known” abu-
sive traffic flows, i.e., those in blacklists, but also those not found via traditional methods, i.e.,
hosts not in existing blacklists. To do this, we utilize a newly revised version of SpamFlow, now
known as TTAD, which is a crucial tool used in this research and necessary for successfully gen-
erating the feature vectors that are used for classifying traffic as either good or abusive/malicious
(bad). TTAD avoids performing content analysis, reputation analysis, and maintains privacy of
data, allowing for a deployment of the tool near the network core.
2.1.3 Malware Detection Systems
Tegeler et al. presented BOTFINDER, which is a newly devised malware detection mecha-
nism that is primarily based off of statistical network flow analysis [8]. In their implementation
of a unsupervised auto-learning tool, they perform a training phase on predefined known data
sets about bots. The BOTFINDER tool then creates models, which are based on the statistical
features found in the C&C communication. The C&C path is simply the channel by which mali-
cious software components are coordinated, primarily by a single source known as a Botmaster.
Through their analysis, they show that BOTFINDER is able to detect malware infections with
detection rates near 80%, based on traffic pattern analysis with no deep packet inspection.
There are some similarities to the work Tegeler et al. performed and the research performed
as part of this thesis. Of key note are the use of traffic features, which we rely on for our flow
9labeling, and the ability to perform the statistical analysis without the need for deep packet
inspection. This is another key advantage in our research, as we introduce the capability for
a fast and efficient means of collecting and analyzing live network traffic to accurately detect
and identify malicious or abusive infrastructures, all while preserving privacy (no deep packet
inspection necessary.)
2.1.4 Image Analysis
In the research conducted by Andersen et al. we are introduced to a technique called Spam-
scatter [9], which is used to characterize scam hosts and identify the infrastructure that supports
spam. The method proposed in this thesis would be able to identify the hosts of the scam sites.
These hosts may be serving or hosting multiple scams, being used to advertise spam, or serve
as a spam type server and prevent delivery.
In our approach, we gather specific traffic features from each HTTP request. We then perform a
statistical analysis to apply discriminators to the transport layer features, which aid in identify-
ing malicious or abusive infrastructure. Our approach, unlike Spamscatter, will not involve any
type of image analysis, and will rely on key traffic features to help identify the type of traffic.
2.1.5 Communications Patterns
Using clustering analysis of communication patterns [10] Gu et al. created a system that cap-
tures communication structure from network traffic, specifically dealing with bots. They created
BotSniffer, which uses Spatial-Temporal Correlation (STC) techniques that provide a means of
identifying bots without any prior knowledge of that bot or a botnet.
BotSniffer consists of two separate components, one of which is the monitor engine and the
second is the STC.
Combined with IDS like functionality, they use clustering of communication patterns to dif-
ferentiate between that of good hosts and malicious hosts. The monitor engine was placed at
the network edge or perimeter and performs several key functions. It would detect and log any
suspicious connection C&C protocol and response behaviors, which are forwarded to the STC
for group anaylsis. The STC engine processes two types of communication techniques (IRC
and HTTP) into specialize algorithms to perform there communications checks.
This research does not look at the communications structure of malicious activity or that of abu-
sive infrastruction and is focused on the properties of the traffic streams, ignoring the application-
10layer content and IP addresses to identifying abusive infrastructure. The important difference
enables our proposed technique to operate, without complete knowledge of the data or message,
either in the core or at the edge of the network.
2.1.6 Behavioral Analysis
RB-Seeker [11], introduced by Hu et al. is a tool that can detect compromised computers, which
are being used as a redirection or proxy server for a botnet, with a very high accuracy rate.
The RB-Seeker tool performs analysis on the behavioral attributes that are extracted from DNS
queries of the redirected domains. While this research does not look at any behavioral attributes,
prior work by Nolan [5] showed that many websites, not just abusive ones, use redirection in
order to control traffic flow, suggesting that such techniques alone may not be currently viable
to identify bots. Similar to RB-Seeker, this research looks at finding discriminatory attributes
of redirection, however; instead of cataloging DNS queries, we are concerned with transport
traffic features for each HTTP request.
2.1.7 Online Learning
In the research by Ma et al. they look at online learning techniques for detecting malicious
infrastructure by using features that are associated with URLs [12]. The problem they had to
overcome was the fact that URL features had no context or content. They looked at two different
feature sets, Lexical and Host-based, which contain URL information that is easy to obtain. The
Lexical features involve the appearance of the URL, where the address is not in a format that is
generally associated with that of a normal URL (i.e., www.google.com).
Their research involved a variety of features, including black-lists, heuristics, domain name
registration, host properties and lexical properties. Looking at a few of these key aspects, we
see that the black-lists they used were some of the same that we use in our research (SORBS,
Spamhaus, etc.). They used WHOIS to gather information on the sites registrar, registrant, and
dates. The host-based features they looked at provided information concerning the host web
site, such as where the malicious code is being hosted, who might own it, and how it is being
managed. The lexical features are simply tokens in the URL hostname plus the path, the length
of the URL and number of dots in the notation.
The describe their URL classification system as one that extracts URL source data, processes it
through a feature collection routine (extracting key features) and processing the combined URL
and features through their classifier, similar to the method we use to process our traffic flows.
11However, a key difference in the research by Ma et al. and our research, is that they are looking
at features of URLs and attempting to determine, based off of the features, whether the URL
is from an abusive site or not. Our approach is different in that, we extract 21 feature vectors
from the flows of traffic, process the flow host names and IP addresses separately to determine
labeling (good, bad or unknown), merge the two pieces of information together to process via
our learner/classifier model. We then demonstrate the ability to actively identify malicious
hosts, which have not previously been identified.
2.1.8 Signatures and Characteristics
Xie et al. looked at signatures and characteristics [13] which involved a spam signature gener-
ation by URL analysis and the development of a system, AutoRE, to identify and characterize
botnets automatically, which is based on mining spam URL data embedded in emails. This
thesis research is more involved than what Xie et al. was trying to accomplish with AutoRE.
We are looking at the behavior of network traffic and avoid content analysis, whereby we pre-
serve privacy. AutoRE only looked at the URL of a domain and disregards all other important
evidence that was discovered in the traffic flow.
By leveraging the research performed in the above papers and through better understanding
of the prior approaches and vantage points taken towards identifying and combating abusive
infrastructure, our approach outlined in this thesis will be unique and stand apart.
2.2 Machine Learning / Supervised Classifiers
Of the variety of different methods that have been devised to detect abusive infrastructure,
our research is based on supervised learning. In supervised machine learning, an algorithm
is sought that can learn from external data instances and is able to form a hypothesis, followed
by prediction about additional data that has no current label or classification [14]. This means
that by building a model of our labeled “known” data, our constructed classifier is then used to
assign labels to future “unknown” test data. If our data has known labels then the learning is
called supervised and conversely, in unsupervised learning the data has no labels. See table 2.1
for an example of supervised learning.
We use extracted transport traffic features as input to supervised learning algorithms (train-then-
test method). Specifically, Naïve Bayes and Tree Learner algorithms are used as our trainers,
processing our labeled data and then used to predict the labels for our set of unknown data types.
The complete methodology is outlined in chapter 3.
12Table 2.1: Supervised Learning Feature Model
Flow Feature1 Feature2 Featuren Classified
Data 1 xx xx xx GOOD
Data 2 xx xx xx BAD
Data 3 xx xx xx GOOD
Datan xx xx xx GOOD
2.3 Classification Techniques
We use two well-known supervised learning algorithms (classifiers) to process the data which
was extracted from the processed packet captures, Naïve Bayes and Decision Tree, which are
employed through the use third-party software [15].
2.3.1 Naïve Bayes
The Naïve Bayes classifier, often called the Bayesian classifier, is one that is probabilistic,
which generally has a short computational time for training [14], and estimates conditional
probabilities from our training data, then uses that to label any new instances of data.
The naïve assumption made by Bayes is that each feature is conditionally independent of the
other features, given a particular class variable. Bayes theorem is defined as [16]:
→
− →
−
→
− →
− P ( F = f |C = ck )P (C = ck )
P (C = ck | F = f ) = →
− →
−
P(F = f )
Label definitions:
• C = class variable
• ck = variable (“GOOD” or “BAD”) labeled for each individual flow
→
−
• F = feature vector
→
−
• f = flow vector
• f1 , ..., fn = attribute values
Next, we must apply the independence assumption with the following:
→
− →
− Y → − →
−
P ( F = f |C = ck ) = P ( Fi = fi |C = ck )
i
13Applying a decision rule [17], which is the Maximum A-posteriori Probability (MAP), we have:
c = classif y(f1 , f2 , ..., fn )
→
− →
−
= argmax (P (C = ck | F = f ))
k=(BAD,GOOD)
→
− →
− !
P ( F = f |C = ck )P (C = ck )
= argmax →
− →
−
k=(BAD,GOOD) P(F = f )
!
Y →
− →
−
= argmax P (C = ck ) P ( F = f |C = ck )
k=(BAD,GOOD) i
Here, the following applies:
• P (C = c) = prior probability
– ratio of examples belonging in a class (c) to the total examples
• Fi = number of vectors
• fi = vector value
• ck = particular class – conditional probability is the ratio of vectors with a value belonging
to a particular class to the total vectors belonging to a particular class
When dealing with continuous values, we must assume a normal distribution [18], which we
defined as:
→
− →
−
P ( F = f |C = ck ) = g(χi ; µi , ck , σi , ck )
1 (x−µ)2
g(χ; µX , σX ) = √ e− 2σ2
2πσ
In simplistic terms, it assigns the most likely classification to unlabeled data, based on the data’s
distinct features or characteristics. Despite often violating the conditional independence rule,
naïve Bayes generally performs quite well under a variety of problem sets.
14Key advantages of naïve Bayes:
• Handles quantitative and discrete data
• Handles missing values by ignoring the instance
• Fast and space efficient
• Not sensitive to irrelevant features
Disadvantages of naïve Bayes:
• If conditional probability is zero
• Assumes independence of features
Unfortunately, as we discovered during our testing, naïve Bayes did not perform as well as
the Decision Tree algorithm, often labeling data incorrectly, which may have been due to the
existence of multiple sets of the same data, resulting in numerous inconsistently labeled traffic
flows.
2.3.2 Decision Tree
The Decision Tree is a predictive model that maps observations about a particular piece of data
to conclusions about the data’s value. Using the traffic features for each flow of data in the
labeled.csv file, the Decision Tree creates a model that predicts the value of our data based on
those features. The manner in which a decision tree algorithm works makes it a kind of greedy
algorithm, because it uses a top-down recursive manner to determine the tree structure [19].
Decision trees uses information gain in order to build a tree from a list of classified examples,
evaluating each feature in the feature vector as follows:
• selects the best feature as the root
• creates a descendant node for each value of a different feature
• repeats recursively for each node
• ends when:
– vectors of a current node are of the same class
– no features remain
Using a decision tree, we are able to classify flows that have unknown attribute values by es-
timating the probability of the various possible results. For evaluating features and in order to
select the best feature, decision trees generally use attribute Information Gain (IG) [18]. With a
15set S of training examples, the IG of features A is:
X |Sv |
IG(A) = Entropy(S) − Entropy(Sv )
|S|
v∈V alues(A)
where:
c
X
Entropy(S) = − pi log2 pi
i=1
Consider a set of attribute A values, where:
• Sv = subset of S
• pi = ratio of the number of examples belonging to class i to the total number of examples
provided.
The goal is to simply maximize the IG of a selected attribute, done by minimizing the entropy
of Sv . However, IG unfortunately selects attributes with a large set of values and has to be
overcome. This can be accomplished by utilizing the information-gain ratio [20]. The following
formula is offered:
IG(A)
GR(A) =
IV (A)
where:
|A|
X |Si | |Si |
IV (A) = − log2
i=1
|S| |S|
For the testing we perform, the Decision Tree performed best, and was our main choice of
classifier algorithm.
2.4 Real-time Blackhole List and Alexa
In this section we discuss the individual Real-time Blackhole Lists (RBLs) and the Alexa Top
1 Million List, which we use in our labeling process in Chapter 3.
162.4.1 Spamhaus
The Spamhaus website provides us with several “realtime” spam-blocking databases that are
utilized in industry to combat spam sent via the Internet [21]. The key databases that we use
in this research are the Spamhaus Block List (SBL), Exploits Block List (XBL), Domain Block
List (DBL) and the Policy Block List (PBL).
Using Spamhaus, we process all of the flows from our captures, to include the fetcher data.
Any host names discovered currently listed on a Spamhaus blacklist was labeled as “BAD.”
Conversely, any host names that are not found on a blacklist but found on Alexa are labeled as
“GOOD.” As previously mentioned, in the event that we encounter a conflict where a host name
is listed on an RBL as malicious and the same host name appears on the Alexa top 1 million
list, it is defaulted to malicious or “BAD.”
2.4.2 Spam and Open Relay Blocking System (SORBS)
The SORBS site provides us with Domain Name System Block Lists (DNSBL), which are used
throughout industry to help identify and block spam email, to help prevent phishing attacks, as-
well-as combat other types of malicious email [22]. The lists, which is over 12 million hosts, are
maintained by IP address, to include those that are dynamically allocated, and can include any
email server that is suspected sending spam, has been hacked, has been hijacked, or suspected
of having any Trojan Horse infection.
2.4.3 ZEN
ZEN, a product under Spamhaus, combines all of the Spamhaus IP-based DNSBLs into a sin-
gle all encompassing comprehensive blocklist [21], containing the SBL, acSBLCSS, XBL and
PBL blocklists. This simply allows for greater efficiency and faster database querying for host
resolution.
2.4.4 Malware Domain
As the name suggests, the site provides a list of malicious domains that can be utilized to help
determine whether domain caters to malicious or abusive traffic [23]. The list of malicious hosts
was downloaded and referenced locally when performing our research, and checked weekly for
updates. The list would range in size, but generally contains approximately 1200 malicious
host names. Only during capture 2 were we able to resolve a single malicious host name from
Malware Domain.
172.4.5 PhishTank
PhishTank is a site dedicated to providing information about phishing that occurs throughout
the Internet [24]. Phishing is any fraudulent attempt to steal another individuals personal iden-
tifiable information. Like that of the malware domain list, we downloaded and referenced the
PhishTank list of malicious hosts locally during our research. The list was checked weekly for
updates. Generally, there were approximately 12000 hosts listed as malicious.
2.4.6 Alexa
We utilize the the Alexa Top 1 Million database as a foundation to measure and build a list
of non-malicious sites, for comparison in our research, though we understand that it is not a
certainty that all sites listed in Alexa are in fact non-malicious. It provides an important ground
truth as to hosts we consider non-malicious.
18CHAPTER 3:
Methodology
Malicious Website Identification (MWID) leverages recently devised packet-level TCP trans-
port classifiers to discover abusive traffic flows in live traffic, especially those not found via
traditional methods (e.g., RBLs). This chapter details the methodology employed in this thesis
to implement and test MWID. We first summarize the operation of MWID, then describe the
four real-world packet captures analyzed. Next, we explain the basic operation of the transport-
layer feature extraction and classification engine, as well as the use of a web site “fetcher”
program that, when combined with an operational honeypot, ensures that the packet captures
contain known abusive flows in addition to the user-generated traffic. Finally, we describe the
use of multiple white and block lists for obtaining other sources of ground-truth, which we will
use as a basis to understand the performance of MWID.
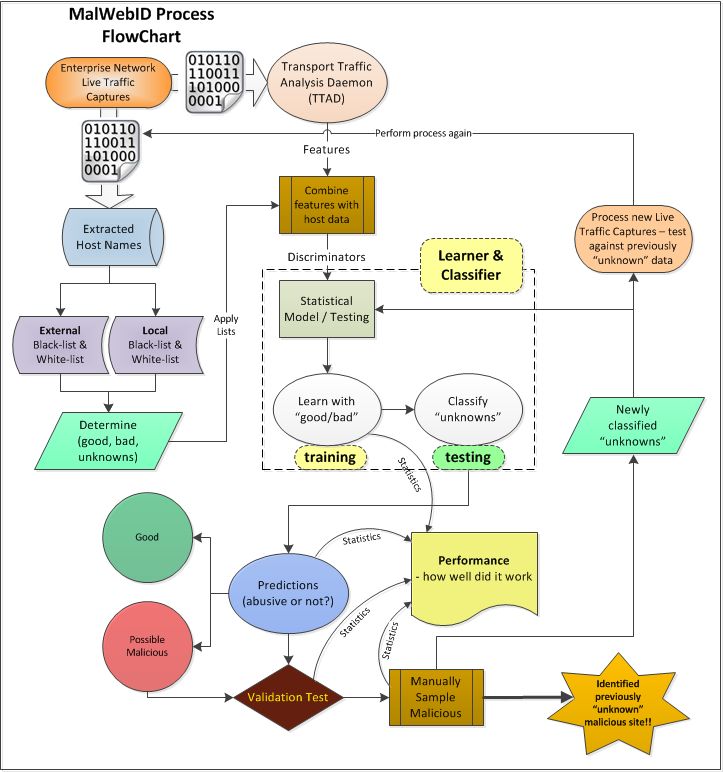
3.1 Overview
This section provides a high-level overview of the operation of the MWID system. Table 3.1
summarizes the various programs used to analyze the data, while figure 3.1 illustrates the overall
collection, processing and analysis work flow implemented by MWID.
Table 3.1: MalWebID Program Process
Program Input Output Description
ttad pcap.list ttad.out Extract per-flow traffic features from .pcap
mwid_pcap pcap.list hosts.out Extract per-flow HTTP host from .pcap
mwid_label hosts.out flows.out Label flows with RBL host and IP lookups
mwid_merge flows.out labeled.csv Merge flow and feature data
ttad.out unknown.csv
mwid_class labeled.csv reclassed.csv Classify unknown flows using RBL-based
unknown.csv training model
1. Using tcpdump, we capture multiple libpcap formatted traffic traces, several of which
exceed 24 hours in duration (§3.2):
• As part of several captures, we utilized our external honeypot to provide URLs that
are presumed to be malicious, for the purpose of injecting them into the capture. In
this way, we ensure that the flows contain traffic from malicious hosts and allows
for better classification performance testing.
19• Process each capture with ttad to accumulate per-flow traffic characteristics and
features (table 3.3)
– ttad.out file is created
• Process multiple .pcap files with mwid_pcap.py to extract per-flow TCP header,
HTTP application-layer host information, IP addresses, and TCP port numbers (ta-
ble 3.4)
– hosts.out file is created, which includes all .pcap data
2. Perform data labeling:
• Process the hosts.out file using mwid_label.py to determine proper classifica-
tion or label for each host flow. The labeling is accomplished by looking each host
name and associated destination IP address up on key RBL list sites (§2.4). For a
list of non-malicious sites, we utilize the Alexa Top 1 million list. Sites (by IP or
host name) discovered on an RBL are labeled as “BAD” and sites listed on Alexa
are labeled as “GOOD;” otherwise the flow is marked as “UNKNOWN” (§2.1).
– flows.out file is created
3. Perform data merge:
• Process the flows.out and ttad.out using mwid_merge.py to combine per-flow
traffic characteristics with that of the associated TCP header information
– labeled.csv file is created, which contains “GOOD” and “BAD” traffic flows
– unknown.csv file is created, which contains only “UNKNOWN” traffic flows
4. Classification:
• The labeled.csv file used as training data
• The unknown.csv file used as testing data
• Both files are processed using mwid_class.py, which invokes third-party soft-
ware [15] to perform statistical analysis on our training data to build a model. The
learned model then determines the label for each unknown data flow
– reclassed.csv file is created, where all unknown flows of data are labeled
5. Sampling:
• Given the reclassification results contained in reclassed.csv, manual sampling is
performed on randomly selected flows, with an even split between flows labeled
“GOOD” and “BAD.” A human uses a standard web browser to visit the sites and
determine whether it is in fact malicious or non-malicious. This necessary and time
critical step aids provides ground-truth to better assess the accuracy MWID. As
a majority of malicious sites are short-lived, we ensure that sampling occurs soon
20after obtaining data so that sites are visited while operational.
Figure 3.1: MalWebID Flow Process.
213.2 Packet Captures
We performed several live network packet captures, using a network tap on the Naval Postgrad-
uate School (NPS) enterprise network, over a period of seven months. This connection was
able to capture all inbound and outbound network traffic for the NPS Computer Science and
Operations Research Departments, but not the school as a whole. Three of our captures include
traffic generated by an automated program, the “fetcher,” that automatically pulls content from
web sites discovered by a honeypot. A honeypot is simply a computer system that has been set
up to appear as though it is part of a normal network, where it could contain some information
or data that would be useful to an intruder or attacker. However, the honeypot is actually an
isolated and monitored computer, used in this case for research to provide URL information
from sites that visit it.
We performed the captures on different days, with the requirement that captures were performed
during peak times, where we knew that a majority of users are accessing the network (i.e.,
weekdays vice weekends). Table 3.2 summarizes the captured data analyzed in this thesis.
Despite the capture timeframe, we found that some captures that ran longer, (i.e., 46hrs), did
not capture as much data as a capture that ran for a shorter period of time. This can be attributed
to several reasons, specifically the number of users and amount of utilization (traffic on the
network) during those particular time frames obviously play a critical role in that regard.
Table 3.2: Packet Captures
Capture Time Capture Kilo Mega Description
Number Period Duration Packets Bytes
Capture 1 20Sep12 10hrs 6475.6 4779.6 NPS users + injected URLs
Capture 2 28-29Nov12 46hrs 608.5 6805.9 NPS users only
Capture 3 07Mar13 24hrs 1650.2 3969.8 NPS users + injected URLs
Capture 4 08Mar13 24hrs 650.3 1985.2 NPS users + injected URLs
3.2.1 Capture 1
The first series of captures, conducted on 20SEP2012, incorporated the use of the Fetcher pro-
gram created by Nolan [5], which is used to “fetch” web addresses (hosts) that have been ex-
tracted from our external honeypot. See figure 4.1 for the overall flow process.
Once we initiate a packet capture session, we simultaneously use Fetcher to actively fetch or
visit the URLs that were acquired from the honeypot, which we consider to be malicious in
nature. In this test, we fetch 2,983 malicious URLs, the flows of which are mixed with the
22normal user traffic being captured at NPS. Though the honeypot URLs are initially considered
malicious, we further manually remove hostnames that are actually non-malicious (which can
occur when spammers utilize real URLs within spam messages). Table 3.5 provides details
associated with the URLs injected by Fetcher.
Considering that a majority of the traffic outbound from the NPS network is not destined for
abusive infrastructure, simply due to the nature of a military environment at the institution and
the expectations levied on those using the network resources, it was necessary to introduce a
variety of suspected malicious URLs to perform our analysis on. We utilize Fetcher for this
task. During our capture process, Fetcher initiates port 80 calls to each of the hosts previously
discovered from our honeypot, thus allowing that flow to be present in the capture. By utilizing
Fetcher, we have a much greater certainty of encountering malicious content than without. This
approach resulted in over 36GB of data to be used for our first series of tests. Additional details
regarding Fetcher and the data processed are discussed in section 3.3.3.
3.2.2 Capture 2
In our second set of packet captures, which ran for 46 hours (28-29Nov2012), we acquired over
33GB of data, spanning 92 saved .pcap files containing 608,409 hosts names and 2,419,532
individual flows of traffic. See figure 4.2 for the overall process flow.
For these captures, we did not want to introduce any additional URLs from our honeypot. The
decision to capture only NPS traffic was in order to evaluate our methods and have a baseline
test where we process only school traffic. This allows us analyze how well our classification
process works in our testing phase, when there is generally not a large amount of malicious
traffic.
Captures 3 and 4 will again introduce Fetcher injected URLs into the the capture process and
the data is provided in table 3.2.
3.3 Programmatic Functions
Here we detail the processes performed to extract flows from our packet captures and the pro-
grammatic functions of MWID’s specialized sub-routines (programs) that analyze and classify
the traffic flows. Table 3.1 is provided as a quick reference for the programs used and function-
ality of each.
233.3.1 Traffic Features
Once we have obtained our packet captures, we must then process each .pcap with our TTAD
program, which provides per-flow traffic characteristics and features. See table 3.3 for a detailed
list of the specific traffic features we utilize. Once the .pcap files are processed, we accumulated
distinct flows of traffic and output to ttad.out.
Table 3.3: TTAD Transport Traffic Features
Feature Description
pktsin Packets in from source and MTA
pktsout Packets out to source and MTA
rxmtin Retransmissions in from source and MTA
rxmtout Retransmissions out to source and MTA
rstsin TCP reset segments from source and MTA
rstsout TCP reset segments to source and MTA
finsin TCP segments with FIN bit set from source and MTA
finsout TCP segments with FIN bit set, to source and MTA
zrwn Number of times the receiver window went to zero
mrwn Minimum receiver window over flow life
avgrwn Average receiver window over flow life
initrcwn Initial receiver window
idle Maximum flow idle time
3whs RTT of the TCP three-way handshake
jvar Inter-packet arrival variance
rttv Per-segment RTT variance
tdur Flow duration (seconds)
wss TCP SYN window size
syn TCP SYN packet size
idf Do not fragment the IP bit
ttl Arriving IP time to live
An example output of the 21 distinct features that TTAD produces is provided in figure 3.2. All
values are comma separated.
Figure 3.2: Example Traffic Features Extracted by TTAD.
24You can also read