The Use of Learning Analytics to Support Improvements in Teaching Practice
←
→
Page content transcription
If your browser does not render page correctly, please read the page content below

The Use of Learning Analytics to
                           Support Improvements in
                                    Teaching Practice

iru.edu.au
Charles Darwin University / Flinders University / Griffith University / James CookwUniversity
                                                                                    iru.edu.au > /   1
La Trobe University / Murdoch University / Western Sydney University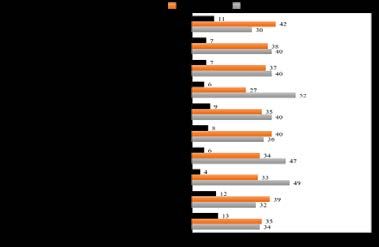
Authors:

                                               Deborah West                                 Flinders University
                                               Ann Luzeckyj                                 Flinders University
                                               Bill Searle                                  Charles Darwin University
                                               Danny Toohey                                 Murdoch University
                                               Richard Price		                              Flinders University

    To cite this publication:
    West, Luzeckyj, Searle, Toohey & Price (2018). The Use of Learning Analytics to Support Improvements in
    Teaching Practice. Innovative Research Universities. Melbourne, Australia.

    ISBN-13: 978-0-646-98756-9							                                                                                                          Published April 2018

2   < The Use of Learning Analytics to Support Improvements in Teaching Practice >
    Charles Darwin University / Flinders University / Griffith University / James Cook University / La Trobe University / Murdoch University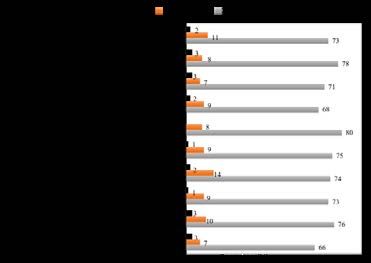
Table of Contents
The Use of Learning Analytics to Support Improvements in Teaching Practice...........................................................................................1
Executive summary..........................................................................................................................................................................................4
Introduction......................................................................................................................................................................................................6
Background literature......................................................................................................................................................................................6
Overview of the project...................................................................................................................................................................................9
Stage 1: Finding the baseline: Malaysian/Australian comparison.................................................................................................................9
    Methodology................................................................................................................................................................................................9
    Findings......................................................................................................................................................................................................10
        Interest in learning analytics................................................................................................................................................................10
        Each country is at a different stage of their learning analytics journey............................................................................................11
        Considerable variation in the use of LMS between Malaysia and Australia.....................................................................................12
    Discussion...................................................................................................................................................................................................15
Stage 2: Exploring teacher metrics................................................................................................................................................................16
    Methodology..............................................................................................................................................................................................17
    Findings of the focused literature review................................................................................................................................................18
    The CoI model............................................................................................................................................................................................19
    Findings of survey mapping to CoI...........................................................................................................................................................21
    Findings of the focus groups.....................................................................................................................................................................21
        What learning and teaching questions do teaching staff want answered?......................................................................................21
    Review of report visualisations scores and comments..........................................................................................................................23
    Review of transcripts from focus groups................................................................................................................................................24
    Discussion.................................................................................................................................................................................................25
Stage 3: Testing the metrics and case studies............................................................................................................................................27
    Case study methodology.........................................................................................................................................................................27
    Findings.....................................................................................................................................................................................................28
        Flinders Case Study 1: The Learning Analytics Community of Practice...........................................................................................28
        Flinders Case Study 2: Use of Learning Analytics in a Flipped Classroom
        Genetics, Evolution and Biodiversity (Dr Masha Smallhorn)............................................................................................................28
        Flinders Case Study 3: Learning Analytics for a First Year Psychology Research Methods Topic
        (Associate Professor Nathan Weber).................................................................................................................................................28
        Murdoch Case Study 1: Development of Learning Analytics at Murdoch University.....................................................................29
        Murdoch Case Study 2: Learning Analytics in a Multi-Mode IT Unit (Danny Toohey)....................................................................29
        Charles Darwin University Case Study 1: Institutional Development..............................................................................................29
        Charles Darwin University Case Study 2: Tertiary Enabling Program (Dr James Valentine)...........................................................30
        Charles Darwin University Case Study 3: Using analytics for decision making on grade boundaries (Dr Brian Phillips)..............30

                                                                                                                                                                            w iru.edu.au >             3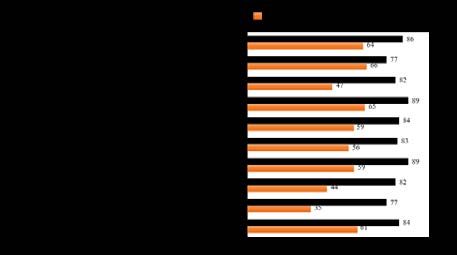
Summary and conclusion......................................................................................................................................................................30
     Identify the range of learning analytics functions available in partner institutions which are related to teaching practice....30
     Identify the ways in which learning analytics can be used to improve teaching..........................................................................30
     Develop a set of metrics based on learning analytics to improve teaching practice...................................................................31
     Test the set of metrics for improving teaching based on students’ retention, engagement and motivation............................31
References..............................................................................................................................................................................................33
Appendix 1: Report visualisations.........................................................................................................................................................36
     Definitions..........................................................................................................................................................................................36
     Personalised learning designer.........................................................................................................................................................36
     Active user block...............................................................................................................................................................................36
     Unit at a glance.................................................................................................................................................................................36
     Student at a glance...........................................................................................................................................................................36
     Early intervention clustering tool....................................................................................................................................................36
     Heat map...........................................................................................................................................................................................37
     Progress bar......................................................................................................................................................................................37
Appendix 2: Data points from the Australian Academic Survey ........................................................................................................38
Appendix 3: Data points from the Malaysian Academic Survey ........................................................................................................41

 4            < The Use of Learning Analytics to Support Improvements in Teaching Practice >
               Charles Darwin University / Flinders University / Griffith University / James Cook University / La Trobe University / Murdoch University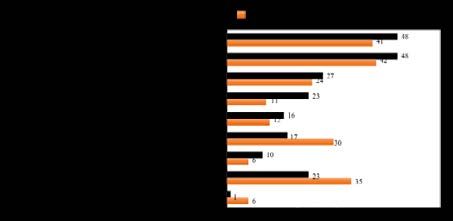
Executive Summary

The Use of Learning Analytics to Support Improvements        environments in Australia and Malaysia. The survey
in Teaching Practice is a joint Innovative Research          instrument had been trialled and tested in Australia
                                                             in 2014 as part of the Australian Government funded
Universities (IRU) and Malaysian Research Universities
                                                             project, Learning Analytics: Assisting Universities with
(MRUN) project. The project’s overall aim was to             Student Retention (West et al. 2015); a modified version
explore the use of learning analytics by teaching staff      of the same survey was subsequently used in Malaysia
to enhance improvements in teaching practice. The            in 2016. (As the survey was modified, Australian
                                                             project members provided advice and guidance to
project’s specific goals were to:
                                                             Malaysian colleagues to ensure comparability would
•    identify the range of learning analytics functions      be maintained.) Numerous similarities and differences
     related to teaching practice available in partner       were observed across the two countries.
     institutions                                            In Stage 2, the focus groups, the project focused on
                                                             the development of teacher metrics in an effort to
•    identify ways in which learning analytics can be        determine ways to use learning analytics to improve
     used to improve teaching practice                       teaching and learning. Two critical questions arose out
                                                             of Stage 1:
•    develop a set of metrics based on learning analytics
                                                             • Is the community of inquiry model (CoI) appropriate
     to improve teaching practice
                                                                as a conceptual framework within which to situate
•    test this set of metrics’ effectiveness for                the development of teacher metrics to support the
     improving teaching, based on students’ retention,          use of learning analytics to improve learning and
                                                                teaching outcomes?
     engagement and motivation.
                                                            • Can learning analytics impact on learning and
These goals were achieved in three stages:                     teaching outcomes across a variety of teaching
                                                              settings?
1.   duplicating surveys previously conducted in
     Australia in Malaysia to provide a comparison of       Focus groups were conducted with teaching staff in
                                                            Australia to explore their perspectives on learning
     development in the two countries
                                                            analytics and how they could see it being used in their
2.   conducting focus groups to explore teacher             teaching practice. Participants in the focus groups were
                                                            asked to note key questions they wanted answered
     requirements and views of visualisations
                                                            in relation to learning and teaching and to reflect on
3.   developing case studies to demonstrate how             what data they would find useful. (The focus groups
     learning analytics is being used by teachers in        in Malaysia are, however, still to be undertaken, so
                                                            data from those could not be included in the project
     partner institutions.
                                                            findings).
Each of these project stages includes a methodology,
                                                            Seven report visualisations from across the institutions
findings and implications for the next stage. The first
                                                            were also presented to focus group participants; each
two stages also included a literature review.
                                                            included a title and brief explanation. Participants
Stage 1 of the project used surveys with teaching           were asked to rate reports in relation to their potential
staff to explore and compare the learning analytics         usefulness.

                                                                                                  w iru.edu.au >   5
Stage 3, the final stage of the project, was originally • There was great variation in the knowledge
designed to develop and test teacher metrics. Due and skills of teaching staff in relation to their
to issues with timelines, institutional readiness and appreciation of learning analytics reports and
infrastructure, this stage was modified. Instead eight applications; however, teachers are more likely to
institutional case studies were developed, describing invest in learning about and using the reports if
how teachers are using the data available to them. there is a clear appreciation of the value offered by
the report.
Overall, the project produced several significant results:
These findings support the following actions and
• Learning analytics development must be
considerations regarding the use of learning analytics to
considered in context at multiple levels.
support staff in improving their teaching practice.
• There is considerable variation in terms of stages
• It is important to determine institutional readiness
of development and readiness which operates at
to gather, process and apply data from a broad
various levels.
range of sources and ensure teaching staff are
• The questions that most teaching staff currently included in discussions and decision making.
seek to answer are at the level of descriptive.
• A clear plan for learning analytics, focusing on
• The usefulness of any learning analytics report/ teaching and learning and taking into account
visualisation will be connected to the purpose of institutional readiness and context, needs to be
the report in relation to the role of the university developed and articulated to staff in a timely
teacher, their discipline and pedagogical approach manner.
as well as the learning and teaching lifecycle.
• In order to improve the take up and the use
• Teaching staff are most interested in reports of reports by teaching staff, the reports’ value
that can help improve student success (beyond will need to be made clear; they will also need
retention) and classroom analytics (data within the to be easy to access and use, and professional
teaching context) which can assist in understanding development will need to be provided.
student success.
Introduction
The Use of Learning Analytics to Support Improvements • identify the ways in which learning analytics can be
in Teaching Practice is a joint Innovative Research used to improve teaching
Universities (IRU) and Malaysian Research Universities
• develop a set of metrics based on learning analytics
(MRUN) project. The overall project aim was to explore
to improve teaching practice
the use of learning analytics to support improvements
in teaching practice; its specific goals were to: • test the set of metrics for improving teaching
based on students’ retention, engagement and
• identify the range of learning analytics functions
motivation.
available in partner institutions which are related to
teaching practice
6 < The Use of Learning Analytics to Support Improvements in Teaching Practice >
Charles Darwin University / Flinders University / Griffith University / James Cook University / La Trobe University / Murdoch UniversityIn order to achieve these goals, the project was 3. Developing case studies to demonstrate how
undertaken in three stages: learning analytics is being used by teachers in
partner institutions.
1. Duplicating surveys previously conducted in
Australia in Malaysia to provide a comparison of This report begins with a brief literature review to set
development in the two countries the scene and then presents the methodology, findings
and a discussion relevant to each stage of the project.
2. Conducting focus groups to explore teacher
It concludes with a general discussion which returns to
requirements and views of visualisations
the key goals and overall findings.
Background Literature
Learning analytics is defined as the ‘measurement, Much of the work in the sector to date has been
collection, analysis and reporting of data about focused on addressing student retention and, to a
learners and their contexts, for the purposes of lesser extent, student success, with a clear emphasis
understanding and optimising learning and the on ‘at risk’ students (Lawson et al. 2016; Marbouti et
environments in which it occurs’ (Siemens & Long al. 2016; Joksimović et al. 2015; Zacharis 2015). This
2011, p. 34). Learning analytics can take a variety of focus is probably the result of government drivers in
forms including dashboards, recommender systems, the countries leading learning analytics development.
predictive analytics, and alerts/warnings/interventions. Australia, the United States and the United Kingdom
Papamitsiou and Economides (2014) conducted a review are all seen as leaders in this field (Sclater et al.
of literature on learning analytics and educational data 2016), and all these countries have clear government
mining, identifying 40 key studies conducted between agendas regarding student retention. It is therefore
2008 and 2013. These studies explored various areas unsurprising that learning analytics development has
of use for learning analytics and data mining with most been motivated to determine how to identify and
investigating, ‘student/student behaviour modelling retain ‘at-risk’ students. While retention is an important
and prediction of performance, followed by increase of application of learning analytics, it shifts the focus
students’ and teachers’ reflection and awareness and to an issue prioritised most often by the institution
improvement of provided feedback and assessment rather than areas of teaching that teaching staff might
services’ and recommendation of resources (p. 53). consider a focus. Several studies have explored the
These issues have not changed since 2013. level of interest by teaching staff in the field of learning
analytics (e.g. Corrin et al. 2016; West et al. 2015).
Learning analytics provides scope to address concerns
related to a broad range of teaching and learning areas. These studies found that while teaching staff are
These areas include: retention and student success interested in the use of learning analytics, they
(Arnold & Pistilli 2012; de Freitas et al. 2015; Gašević often have little understanding of how it can be
et al. 2016); improvement of learning design, units, utilised or of what is available in their context (Corrin
courses and teaching practice (Dyckhoff et al. 2012; et al. 2016; West et al. 2015). Additionally, while
Haya et al. 2015; McKenney & Mor 2015; Persico & retention is of some interest, teaching staff tend to
Pozzi 2015; Toetenel & Rienties 2016); the development be more concerned with the broader issue of student
of personalised learning pathways; and student support success and how learning analytics can be used to
(Liu et al. 2017). However, the realisation of using improve learning and teaching within the ‘classroom’
learning analytics to their full potential in addressing environment.
these various teaching and learning areas has yet to be
fully achieved.
w iru.edu.au > 7et al. 2016; West et al. 2015; Greller & Drachsler
As the use of information technology has expanded 2012). Institutions which regularly utilise a range
in education, the traditional classroom environment of educational technologies (learning management
has evolved to include a range of modalities, from systems, online classrooms etc.) are therefore better
the traditional face-to-face approach to the use of placed to harness the affordances of learning analytics
information technology to ‘blend’ face to face and than those who do not. Additionally, institutional
online learning, through to fully online courses/ readiness is related to the idea that the more reliant
programs. This increased use of information technology an institution is on information technology the more
in higher education provides the foundation for the digital data it is likely to have, and consequently the
use of learning analytics, and teaching staff have begun more relevant and of greater value the processing and
using them to measure students’ engagement in online delivery of this data to stakeholders will be.
contexts (Beer et al. 2010). However, the use of learning
analytics to determine what students do as they learn In addition, learning analytics data and development
(and indeed all aspects of the use of learning analytics) can be seen to operate on several continua. First is
is variable across the sector (Atherton et al. 2017; Liu et the idea that data can be accessed and utilised from
al. 2015). one system (e.g. from either the student information
system (SIS) or the learning management system (LMS),
By definition, learning analytics relies on the use of independently of each other) to provide some insights,
digital data relating to students’ learning journeys. It is or it can integrate data from two systems (such as
therefore heavily dependent on the use of information the SIS and the LMS together), or it can be federated,
technology to collect the data in a useful format, drawing in data from multiple systems. The capacity
and preparedness for this varies considerably across to extrapolate more and greater insights is generally
institutions and countries (Sclater et al. 2016). This enhanced as the number of relevant data sources being
state of preparedness, often referred to as ‘institutional integrated is increased.
readiness’, is dependent in the first instance on
technological infrastructure and use, but is also The levels of complexity and sophistication in the data
connected to the culture of the institution, including processing, and the application involved, also have a
its strategy, policy frameworks and understanding significant effect on learning analytics outcomes. As
regarding learning analytics (JISC 2017; Colvin noted earlier, learning analytics can take a variety of
Figure 1: Analytics maturity curve (from Morgan & Duncan 2016)
8 < The Use of Learning Analytics to Support Improvements in Teaching Practice >
Charles Darwin University / Flinders University / Griffith University / James Cook University / La Trobe University / Murdoch Universityforms including dashboards, recommender systems, Analysis and Pedagogical Practice (SNAPP) (Dawson
predictive analytics, and alerts/warnings/interventions. 2010).
All of these have a purpose but some are able to
Alongside these advances, Garrison, with various
achieve their purpose with smaller data sets, while
colleagues and over a number of years (Garrison et al.
others require larger data sets in order to build
2001; Garrison & Anderson 2003; Garrison & Arbaugh
sophisticated, predictive models.
2007; Garrison et al. 2012), developed the CoI model
Figure 1, produced by Gartner (Morgan & Duncan for teaching in online contexts. The advantage of the
2016), shows a maturity curve for the field of data CoI model is its acknowledgement of the significance
analytics. of the social aspects of learning while also recognising
the importance of the particular roles played by both
The diagram should not be interpreted as suggesting
teachers and students.
that descriptive analytics, positioned as the lower,
beginning point of the diagram, are not as useful As recognised by the work of Garrison, his colleagues
as predictive analytics (positioned at the top of the and others (e.g. Corrin et al. 2016; Siemens et al. 2013;
diagram), as the use and value of each type of analytics West et al. 2015), it is imperative to advance learning
will depend on its overall purpose and context. In analytics in ways useful to teachers such that they
relation to learning and teaching in higher education, will actually engage in using them. As discussed by
each type of analytics indicated on the diagram will Keppell et al. (2015) the alignment of ‘pedagogical,
have a value and will speak to a different stage of technical and administrative issues remains a necessary
learning analytics development and will be relevant to condition of success in creating an engaging learning
different institutional audiences. environment’ (p. 6).
However, while work continues in the broader learning Data science work and progress in learning analytics,
analytics field, research and development in the area which is also important, must, therefore, be grounded
of learning and teaching interactions has remained in, and connected to, good pedagogical practice and
somewhat limited. Calls for research to focus on educational theory; otherwise, either group runs
what can be termed ‘classroom analytics’ have been the risk of moving forward in isolation. Additionally,
increasing (Siemens et al. 2013), though few studies all practitioners need to be mindful that all work in
report on the specific types of data and reports learning analytics may be either enhanced or limited
teachers would find useful. West et al. (2015) highlight by its developmental context, including organisational
that the majority of questions teaching staff want culture and infrastructure.
answered could be provided through the integration of
The literature review, overall, provided evidence for the
SIS and LMS data.
need to determine how learning analytics could best
The work by Corrin et al. (2016) also draws attention be used to further support teaching staff in ‘classroom’
to the key role of pedagogy in the design of learning contexts. This project was established to identify
analytics reports. Also, as online learning using ‘Web a means to determine the current ‘state of play’ of
2.0’ technologies has gained momentum, interest has learning analytics in IRU and MRN institutions and to
grown in considering pedagogical practices specifically determine how it might be better used to support and
related to supporting online teaching and learning. enhance teaching practice.
Acknowledging the importance of learning as a social
activity (i.e. not something that occurs in isolation),
the learning theory known as connectivism (Siemens
2004) was put forward as one that could support
online learning. However, as critiqued by Clarà and
Barberà (2013), connectivism was developed to support
Massive Online Open Courses (MOOCs) and ‘has mainly
been disseminated in a large number of blog posts
and articles on Internet sites (without peer-review
processes)’ (p. 198). Research into the networks and
interactions developed by students with their peers
has also progressed, with tools such as Social Network
w iru.edu.au > 9Overview of the Project
As noted above, the overall project aim was to explore • testing the set of metrics, based on student
the use of learning analytics to support improvements retention, engagement and motivation.
in teaching practice, with the specific goals of:
In order to achieve these goals, the project was
• identifying the range of learning analytics functions undertaken in three stages each with its own
available in partner institutions which are related methodology, findings and implications for the next
to teaching practice stage. The following section outlines each stage
separately and the summary integrates data from the
• identifying the ways in which learning analytics can
previous stages.
be used to improve teaching
• developing a set of metrics, based on learning
analytics, to improve teaching practice
Stage 1: Finding the baseline:
Malaysian/Australian comparison
The first stage of the project involved exploring and al. 2015), were used to gather a range of information.
comparing the learning analytics landscape in Australia Data collection in Australia had taken place in late 2014
and Malaysia. This stage was essential for gaining as part of this previous project, with 353 responses
understanding of the two countries readiness for to the academic survey. Initial discussions with the
learning analytics in terms of both infrastructure and Malaysian researchers indicated that these surveys
academic perspectives. could potentially be used to gather the same data in
Malaysia and support a comparison of results across
the two countries. The IRU institutions provided
Methodology practical support to their MRUN colleagues by checking
for consistency across the two surveys and offering
In order to undertake a comparison between the advice and guidance as required.
two countries, two surveys (one academic, one
institutional), initially developed for the Australian
Government funded project Learning Analytics:
Assisting Universities with Student Retention (West et
10 < The Use of Learning Analytics to Support Improvements in Teaching Practice >
Charles Darwin University / Flinders University / Griffith University / James Cook University / La Trobe University / Murdoch UniversityThe surveys were reviewed and amended by the project These similarities and differences are explored in more
team to clarify language, meaning and appropriateness detail below. It should be noted that a more in-depth
for the Malaysian context. They were then piloted in article on this comparison has been submitted for
Malaysia and further reviewed by a Malaysian expert publication and that the figures presented below are
panel. Reliability testing of the survey was undertaken duplicated in that article.
using a Rasch Model technique returning a Cronbach
Alpha (KR-20) value of 1.0, indicating that the survey
had a high level of reliability. The academic survey in
Malaysia yielded 224 responses. Interest in Learning Analytics
Although the surveys were distributed at different
Findings times, with the Australian survey conducted in 2014
and the Malaysian survey in 2016, a great deal of
Conducting the survey across two countries and
interest in learning analytics is evident across both
cultural contexts illustrated a number of similarities and
countries. Teaching staff were asked to indicate their
differences. These include:
level of involvement in particular learning analytics
• a great deal of interest in learning analytics across related activities: Figure 2 illustrates the varied
both countries activities in which they were involved.
• the two countries being at different stages of In both countries the highest percentage of responses
learning analytics development concerned using learning analytics to help with analysis
and decision making and reading about learning
• considerable differences between the two
analytics for personal professional development.
countries in the use of LMS
The greatest differences were around conducting
• differences in the ways in which institutional
formal research and/or publishing work on the
context and infrastructure influence the
topic of learning analytics, advocating the use of
expectations and understandings of staff and their
learning analytics to colleagues and none of the
capacity to use learning analytics
listed choices (i.e. other activities around learning
• variations in institutional capacity in meeting the analytics). Malaysian teaching staff indicated that they
needs, expectations and understandings of staff are conducting formal research and/or publishing
and their capacity to use learning analytics in learning analytics more than their Australian
• differences in ethical concerns, which were evident colleagues, while Australian teaching staff are more
across both countries, which may be a reflection often advocating the use of learning analytics and were
of institutional policies, understandings or cultural involved in more unlisted activities.
differences.
Figure 2: Types of learning analytics related activities in which Australian and Malaysian teaching staff indicated
involvement
w iru.edu.au > 11Discussions regarding learning analytics are also an staff in other areas. The discussions are relatively
indicator of interest in the topic. Figures 3a and 3b infrequent (with most occurring less than monthly)
illustrate the frequency of discussions and with whom across institutions in both countries, though teaching
they are held. It is evident that conversations in relation staff in Malaysia report having conversations more
to learning analytics occur at all levels, although they frequently.
occur less with institutional management than with
Figure 3a: Frequency and staff members with whom learning analytics is discussed (Malaysia)
Figure3b: Frequency and staff members with whom learning analytics is discussed (Malaysia) (cont.)
Each country is at a different stage of and more sustained focus on at-risk students and
retention in Australian institutions as a result of
learning analytics development government policies linked to widening participation.
As understanding and interest in the use of learning The differences in interest may also be linked to
analytics have developed, the way it is applied within perceptions regarding responsibilities, culture,
teaching and learning contexts has also grown and academic autonomy, perceptions of academic freedom
changed. and ethical considerations.
For example, as shown in Figure 4 below, Malaysian
teaching staff tended to show more interest in areas
of learning analytics relating to student retention and
success, while in Australia there was more variation in
interest regarding the topic.
The differences in interest may be related to a longer
12 < The Use of Learning Analytics to Support Improvements in Teaching Practice >
Charles Darwin University / Flinders University / Griffith University / James Cook University / La Trobe University / Murdoch UniversityFigure 4: Percentage distribution of Malaysian and Australian teaching staff interest in learning analytics
applications that can be linked to student retention and success (n varies)
Differences in the use of LMS support services is low in both countries. These results
influence the survey findings in terms of the usage and
between Malaysia and Australia relevance of learning analytics and may be indicative
Figure 5 (below) illustrates survey responses regarding of the stage of the learning analytics journey that each
access to sources of data relating to the students’ country is at, as well as of a greater focus on online
learning journey. In Australia teaching staff have more learning, reflected by the use of LMS in teaching and
access to data from the LMS than Malaysian colleagues, learning contexts in Australia.
who have more access to SIS data. Access to data
from the library, learning support services and student
Figure 5: Access to sources of data relating to the student journey
w iru.edu.au > 13Influence of institutional Variations in institutional
context and infrastructure capacity
When adopting learning analytics, stakeholders require Ways in which institutions can meet the needs and
appropriate infrastructure that allows relevant data expectations of teaching staff as well as support their
to be suitably captured, integrated and presented. It capacity to use learning analytics, include providing
also requires staff to have opportunities and access access to data and systems that allow staff to identify
to professional development so they may acquire the how their intended outcomes for students are being
skills and abilities to become competent in accessing, met and how students are using the resources provided
understanding and using learning analytics data. to them. In addition, institutions can provide access
The capacity for institutions to provide the support that and support to training and professional develop
adequately underpins learning analytics demonstrates opportunities that develop staff understanding,
the different stages of the learning analytics journey aptitude and confidence. Figures 6 and 7 indicate
experienced in each country reflected in questions the differences across Australia and Malaysia in staff
related to access to student data from the LMS or perceptions’ of institutional capacity to meet their
Student Information System (SIS) (discussed above and needs.
reflected in Figure 5); institutional capacity to meet
staff needs and expectations and understandings of
staff and their capacity to use learning analytics; and,
institutional infrastructure and questions related to
ethics (all discussed below).
Figure 6: Staff perceptions of institutional capacity to meet their needs (Malaysia)
Figure 7: Staff perceptions of institutional capacity to meet their needs (Australia)
It is evident from these results that staff in Malaysia and These findings may be an indicator that Australian
Australia have differing perceptions and expectations teaching staff are at a different part of the learning
regarding their institutions’ capacity to meet their analytics journey and therefore have different
needs regarding learning analytics. In Malaysia, expectations of their needs and the institutional
teaching staff rated the components of institutional capacity to meet those needs. Ethical considerations
capacity more highly (giving all seven a good/very good may also be linked institutional capacity as they
score) while their Australian counterparts rated the are linked to policies, understandings and cultural
same categories as poor/very poor. differences.
14 < The Use of Learning Analytics to Support Improvements in Teaching Practice >
Charles Darwin University / Flinders University / Griffith University / James Cook University / La Trobe University / Murdoch UniversityDifferences regarding ethical their ethical concerns and how they felt these might
influence their adoption and acceptability of learning
concerns analytics, specifically where it related to their teaching
The literature on ethics in learning analytics indicates practice. The responses indicate that ethical concerns in
that teachers’ views on this need exploration. Teaching Australia and Malaysia differ, as shown in Figures 8 and
staff were asked a number of questions regarding 9, below.
Figure 8: Concerns regarding ethics and learning analytics (Malaysia)
Figure 9: Concerns regarding ethics and learning analytics (Australia)
w iru.edu.au > 15Teaching staff in Malaysia indicate a high level of incorporate into data warehouses. The provision of
concern about ethical issues across all areas, while in teaching data involves several issues, including the level
Australia the responses varied more, depending on the of use of educational technology which can collect the
aspect of ethics broached. relevant interactions between students, teachers and
systems. Much of the teaching taking place occurs in
a face-to-face or ‘blended’ mode which limits the use
Discussion of learning analytics, as some important data is simply
not captured or not seen as a priority to capture. For
The results of these surveys make contributions to the some programs, primarily in the arts and humanities,
understanding of what is currently available in data the use of the LMS may be seen to be restricted to
systems, and the types of data and business questions administrative and communication purposes, again
that teaching staff feel would be useful. However, further limiting the opportunities for data collection.
the results also highlight several tensions in the
development of learning analytics capacity and usage. The findings of this study suggest that educational
These include balancing business needs and priorities technology is more widely used in Australian
with academic priorities and capacities to provide institutions, which tend to have a greater focus on
the information being requested. They also highlight blended and fully online educational approaches. Other
a tension regarding institutional capacity to build the data such as library access or access to support services
kind of more advanced predictive models which rely on is challenging as many institutions do not have systems
bigger data sets. in place to capture this in an electronic format which
can be subsequently integrated with other data sets.
For many institutions the focus is on the development
of learning analytics to address problems of student The second factor regarding data collection concerns
retention, which may or may not be related to the types institutional priorities on the integration of data.
of questions teaching staff would like to pursue (such Building data warehouses and ingesting data sets (even
as curriculum improvement). While it is acknowledged where they are available) presents significant challenges
that issues like curriculum design do contribute to regarding the preparation of data, integration systems,
retention, this is not necessarily the main contributor and building the appropriate analysis and visualisation
to attrition. In recent times institutions have generally elements. Preparing, integrating and presenting data
been looking for the ‘quick wins’ around retention, is costly and time consuming, and therefore requires
including investigating the demographics and behaviour institutions to prioritise its development. At this stage
patterns of students who are most likely to attrite and institutions have prioritised data integration relating
developing programs to support these students. to broader concerns such as finance, human resources,
teaching load and retention.
Whilst some improvements in retention have been
realised through these programs, they have often not Despite these challenges the survey respondents
yielded the rates of return (i.e. reduced attrition) that expressed a need for a broad range of descriptive
were originally hoped. Consequently, institutions are statistics, with some respondents also expressing
beginning to embrace a whole-of-institution approach interest in some metrics such as student grades, unit
to retention that involves looking at the results of readiness given prior learning, tasks/assessments which
institution-wide predictive models in conjunction with best predict final grade, and patterns of resource usage.
the analysis of data at the unit/classroom level for each However, the ability to build predictive models requires
of a student’s enrolled units, in order to gain a more ‘big’ data, but many institutions do not have enough
holistic view of a student’s risk profile. data available/collected for it to fit into this category.
Essentially, respondents indicated that they would like Currently, the main application of big data analytics
key teaching and learning data integrated with other within the higher education sector is the use of whole-
relevant data (such as demographic data or library of-institution predictive models regarding student
access) to be available to them to incorporate within retention rates. These models are typically developed
their analyses. However, this is often not available, or using machine learning approaches (such as decision
when it is, it is not in a form that can be readily utilised. trees, neural networks or support vector machines)
trained on several years of admissions, demographic,
This unavailability of data is mainly due to two grade, LMS activity and wireless logins data, for often in
factors: the collection of various data in digital form, the order of 100,000 students.
and the competing priorities institutions face when
making decisions regarding the choice of data sets to
16 < The Use of Learning Analytics to Support Improvements in Teaching Practice >
Charles Darwin University / Flinders University / Griffith University / James Cook University / La Trobe University / Murdoch UniversityIn contrast to this collection and manipulation of applications. However, most teaching staff suggest
big data, classroom analytics, which operate at the there is great value in being able to utilise descriptive
individual unit of study level, are unlikely to have the forms of data which do not require large data sets. The
required volume of data to build such models. Whilst in type of questions teaching staff would like to be able to
a relatively small number of units it is possible for there answer is explored further in Stage 2.
to be several hundred students enrolled per offering, In summary, Stage 1 found that teaching staff in both
for many institutions the average number of students Malaysia and Australia had strong interests in exploring
enrolled in a unit is typically much less. learning analytics and determining how it could be used
Even assuming little change occurs to the curriculum to improve teaching and learning. However, the findings
and learning design over a five-year period, this only also highlighted the different levels of understanding
yields a small number of training examples, which and development in thinking as well as institutional
is insufficient to build a reliable predictive model. capability and readiness. These results reinforce the
Consequently, whilst not impossible, modellers need stand-alone findings of the Australian study (West et
to develop greater capacity for using smaller data sets al. 2015), which drew attention to the critical role of
when building predictive models for classroom analytics context in learning analytics development.
Stage 2: Exploring teacher metrics
The second stage of the project focused on the based on three core elements: teacher presence,
development of teacher metrics. cognitive presence and social presence. These elements
are seen as interrelated and, of relevance to this
The work undertaken in Stage 1 raised two critical
project, together provide a framework that can be used
questions related to the broad development of teacher
to understand ‘the process of the complexities of online
metrics in this context. The first question concerns the
learning’ (see Garrison & Archer 2000; Anderson et al.
conceptual framework within which the development
2001; Garrison & Anderson 2003; Garrison & Arbaugh
of classroom analytics can take place, and the second
2007; Garrison et al. 2010).
to the potential impact of learning analytics. More
specifically: The second research question uses the CoI model to
explore the metrics that could be used by teaching staff
• Is the CoI model appropriate as a conceptual
to better understand learning and teaching processes,
framework within which to situate the
activities and course design. This is complicated by the
development of teacher metrics to support the
wide variety of settings where contemporary teaching
use of learning analytics to improve learning and
takes place, including: face-to-face, blended, online,
teaching outcomes?
external or distance education, most of which use
• Can learning analytics impact on learning and some form of learning management system or learning
teaching outcomes across a variety of teaching information technology to enable the achievement of
settings? learning outcomes. Investigation into the CoI model
The first question arises from the need to draw on allowed a clearer focus on how metrics could be useful
educational theory regarding learning analytics to teachers.
development as outlined above in the Background
literature section. The CoI (discussed at length below
in The CoI model section) is a conceptual framework
w iru.edu.au > 17Methodology Issues identified in the academic survey that were
further explored in Stage 2 were concerned with what
To answer the questions outlined above, Stage 2 of the aspects of learning analytics teaching staff saw as being
project first conducted a focused literature review to potentially useful to them in improving learning and
explore theoretical educational frameworks, drew on teaching outcomes; in particular, the questions they
insights from key questions in the academic surveys and would like to be able to answer, the reports, and the
conducted a series of focus groups. These processes data from which those reports were generated.
also provided scope for further verification and
exploration of the findings from Stage 1 (as discussed Focus groups were then conducted with teaching staff
above) in relation to the Stage 2 questions. in three Australian (IRU) universities to explore their
perspectives on learning analytics, and how they could
As noted above, and highlighted in Stage 1, the teaching see it being used in their teaching practice. (The focus
approach taken will have a critical influence on learning groups that were planned for Malaysian universities
analytics. The literature was revisited in an attempt are yet to be undertaken, so results from them are not
to explicitly identify specific teaching models which included in the findings.) Ethics approval to conduct
operationalise learning analytics in the classroom. The the focus groups was received via Charles Darwin
literature review was undertaken prior to the focus University’s Human Ethics committee, and the focus
groups and the summary of this work is presented groups were conducted during March and April 2017.
in the Findings of the focused literature review
section below. It is situated in this part of the report Participants were recruited via an email which was sent
to illustrate the developmental nature of thinking to all teaching staff in each institution inviting them to
regarding learning analytics, and to provide a specific attend a focus group to explore teachers’ views and
theoretical framework for the analysis of particular data requirements regarding learning analytics.
from the focus groups. A total of nine focus groups with 48 participants were
held across the three institutions, as shown in Table 1.
Table 1: Focus group participation
Participants came from a wide range of disciplines 2. A discussion where participants shared with each
including creative arts, business, education, health other the questions they had written down to
sciences, physical sciences, and IT, thus providing a explore ideas and the types of data that might be
good mix of views and insights into academic challenges required to answer those questions.
and teaching approaches.
3. An exercise where seven learning analytics reports/
The focus groups were conducted over 1.5 hours and visualisations were presented to participants, who
were facilitated by the project team members in their were then asked to grade the reports’ usefulness
own institutions. In order to provide some level of on a scale of 1 to 5, and to describe what
consistency the focus groups were structured with a enhancements to those reports might be useful.
set of questions and activities and followed the same An ongoing discussion was held during this exercise
process in each institution: to explore each report, its applications and the
reasons for giving the specific score to each report.
1. An exercise where participants were asked to write
down individually, on ‘sticky notes’, questions that 4. A discussion regarding what other reports teaching
they would like to be able to answer or have insight staff might see as useful.
to in relation to teaching/learning in their classes.
18 < The Use of Learning Analytics to Support Improvements in Teaching Practice >
Charles Darwin University / Flinders University / Griffith University / James Cook University / La Trobe University / Murdoch UniversityAll the focus groups were audio-recorded and then teaching, or are teaching in contexts which easily lend
transcribed. All participants were de-identified in the themselves to the collection of data.
process and the focus group findings are presented
In the second review of literature we deliberately
at an aggregate level both overall and by institution.
sought to identify material which specifically discussed
Further methodological elements are incorporated
the collection of data in classroom settings, as this
in the Findings sections below as the data set was
literature better responded to our goals of identifying
analysed in a variety of ways; it is best read within the
the ways learning analytics may be used to improve
context of the Findings of the focus groups, which is
teaching, and to develop a set of metrics based on
presented as a follow-on to the Findings of the focused
learning analytics to improve teaching practice. Studies
literature review.
which discuss pedagogical designs aligned with the use
of learning analytics were identified (Corrin et al. 2016;
Findings of the focused literature
Koh et al. 2016; Martin & Whitmer 2016; Toetenel &
review Rienties 2016; Rodriquez-Tirana et al. 2015) but few of
A further review of literature was undertaken to these discuss ways of capturing the complex elements
ascertain where practitioners and researchers were that address both teaching and learning activities.
developing links between learning analytics and
classroom practice. As the focus on online learning The Col Model
increased in the late 1990s, the need to identify In attempting to discuss the complexity related to
a suitable pedagogical practice that supported capturing data related to both teaching and learning
online learning and teaching increased. Numerous activities, Stage 2 of this project works at the
practitioners and researchers worked to develop a intersection of teaching and learning pedagogy/theory
suitable pedagogy to support online practice (Garrison and data science. The CoI model, which is based on a
& Anderson 2004; Laurillard 2002; Siemens 2005; social constructivist approach to learning and teaching,
Stephenson 2001). Garrison and Anderson (2004) was found to offer an effective and appropriate starting
recognised that online learning complicated the role of point.
teaching staff who became responsible for supporting
The CoI model for online learning has been developed
students to find ways of navigating ‘through this chaos,
over a number of years and is theoretically grounded
provide order and create the conditions to encourage a
in social constructivist models of learning and teaching
deep approach to learning’ (p. 17).
and learning community theory (see Garrison & Archer
Other early practitioners identified the missing 1999; Anderson et al. 2001; Garrison & Anderson 2003;
elements in learning theories in an attempt to Garrison & Arbaugh 2007; Garrison et al. 2010). The
determine how a new paradigm of learning might allow model, as delineated in Table 2, is based on three core
the capture and use of potentially unknown data to be elements, teacher presence, cognitive presence and
associated with the development of new knowledge. social presence, that are seen as interrelated and which
Siemens (2005), for example, argued that conventional ‘can provide order and parsimony to the complexities of
learning theories (such as behaviourism, cognitivism, online learning’ (Garrison & Arburgh 2007, p. 158).
and constructivism) were limited because they focused
Anderson et al. (2001 in Garrison et al. 2010) define
on the individual learner, rather than what was being
teacher presence as ‘the design, facilitation and
learned. He suggested that connectivism provides
direction of cognitive and social processes for the
an answer as it is ‘driven by the understanding that
purpose of realising personally meaningful and
decisions are based on rapidly altering foundations’
educationally worthwhile learning outcomes’ (p. 32).
(p. 5) and therefore offers a paradigm for learning in a
In essence, this summarises the role of the teacher in
digital age.
online learning from the curriculum design aspects
The focus on connectivism became particularly through to teaching activities and assessment.
significant as interest in learning analytics developed
Cognitive presence is related to the student’s learning
alongside the increasing reliance on teaching in
process and incorporates four key stages: ‘definition of
online contexts. Online teaching and learning
a problem or task; exploration for relevant information/
provides the opportunity to capture the interactions
knowledge; making sense of and integrating ideas;
between students and their learning, as it provides
and finally, testing plausible solutions’ (Garrison et al.
an environment for capturing data on what students
2010, p32). Social presence is defined as ‘the ability of
actually do as they learn. However, to date the missing
participants to identify with the community (e.g. course
elements for creating an effective environment where
of study), communicate purposefully in a trusting
data may be used to inform teaching and pedagogy
environment, and develop inter-personal relationships
remain elusive, as staff researching learning analytics
by way of projecting their individual personalities’
are often either not those at the ‘coal face’, engaged in
(Garrison 2009 in Garrison et al. 2012, p. 32).
w iru.edu.au > 19You can also read