TRANSFER STUDENT SUCCESS IN ALBERTA CASE STUDY: MACEWAN UNIVERSITY - Alberta Council on Admissions and Transfer
←
→
Page content transcription
If your browser does not render page correctly, please read the page content below
TRANSFER STUDENT SUCCESS
IN ALBERTA CASE STUDY:
MACEWAN UNIVERSITY
For the Alberta Council on Admissions and Transfer
June 14, 2018
ANDREW DRINKWATER
Director and Co-Founder

PATRICK LOUGHEED
Director and Co-Founder

LYNNE JAMIESON
Change Management Consultant

INFO@PLAID.IS

WWW.PLAID.IS

Transfer Student Success in Alberta – MacEwan University
June 14, 2018

Acknowledgements
This research has been supported by stakeholders from MacEwan University and the Alberta Council on
Admissions and Transfer (ACAT). The researchers extend our sincerest thanks to the many who have
been involved in this process, and to ACAT and the Government of Alberta for funding this research.
Specific individuals deserve special mention for their valuable contributions to this project.

From MacEwan University:

   •   Mike Sekulic, University Registrar
   •   Tony Norrad, Associate Registrar, Admissions
   •   David McLaughlin, Executive Director, Institutional Analysis and Planning

From the Alberta Council on Admissions and Transfer:

   •   Clare Ard, Articulation Manager
   •   Ann Marie Lyseng, Senior Manager, Learner Pathways

                                                                                                      2
Transfer Student Success in Alberta – MacEwan University
June 14, 2018

Executive summary
The Alberta Council on Admissions and Transfer (ACAT) contracted Plaid Consulting to perform a
comprehensive review of transfer student success metrics at MacEwan University. Plaid is a data and
analytics consulting agency focused on helping post-secondary institutions, councils, and governments
make data-informed decisions. This report is written from the perspective of MacEwan as a receiving
institution for transfer students. The three other reports Plaid completed will be accessible separately via
ACAT.

The high-level goal of the project is to begin addressing a gap in Alberta’s post-secondary system learner
pathway and mobility data: transfer of students between post-secondary institutions. While there is
current data on the mobility of students within the system, that data is limited to tracking student
enrolments at and between institutions. This project aims to improve the data available by beginning to
develop and analyze measures of post-secondary transfer student success. The project is focused on
measuring the success of post-secondary transfer students and how transfer students perform in
comparison to direct entry students.

This project looked at ways of measuring transfer student success at MacEwan University. The proposed
metrics for this report’s analysis were developed using a mixed methods approach that consisted of
    ● applying recommendations for best practices for methodology and parameters for analysis
        identified in the literature review,
    ● contextualizing the analysis within information gained from the environmental scan about
        MacEwan University, which included informal qualitative data in the form of conversations with
        targeted representatives from MacEwan, and
    ● focusing the report’s core analysis and conclusions on a regression analysis of quantitative
        MacEwan data that were based on targeted data metrics for analysis of transfer student success
        in comparison to direct entry students.

Prior research
The literature review highlighted a number of key points in regards to transfer student success. In the
Canadian context, studies have looked at Statistics Canada data in the form of the now inactive Youth in
Transition Survey and the ongoing Postsecondary Student Information System. These data illustrated
that reporting on student success from the perspective of an individual institution underreports progress
from a system perspective, because a single institution does not generally know whether a student
transferred and continued their studies elsewhere, or left the system altogether. In developing success
metrics that are fair to both transfer and direct entry students, it has been shown, when selecting key
performance indicators, that having consistent definitions and data collection across the system,
measuring results (both outcomes and outputs), measuring validity and reliability of data, and metrics,
and understandable and transparent performance indicators are important. Existing metrics of student
success are criticized for being overly focused on the traditional university learner: first-time, full-time,
degree seeking students. In response, the Integrated Post-secondary Education Data System (IPEDS),
from the US Department of Education, has recently created new definitions to better encompass both
part-time and non-first-time attendees.

The case study conducted for this report includes both part- and full-time students who were admitted
during the study period. Further filtering is done for particular metrics to ensure students had attended
long enough to achieve those metrics. For example, graduation rate at 100% of program length considers

                                                                                                                3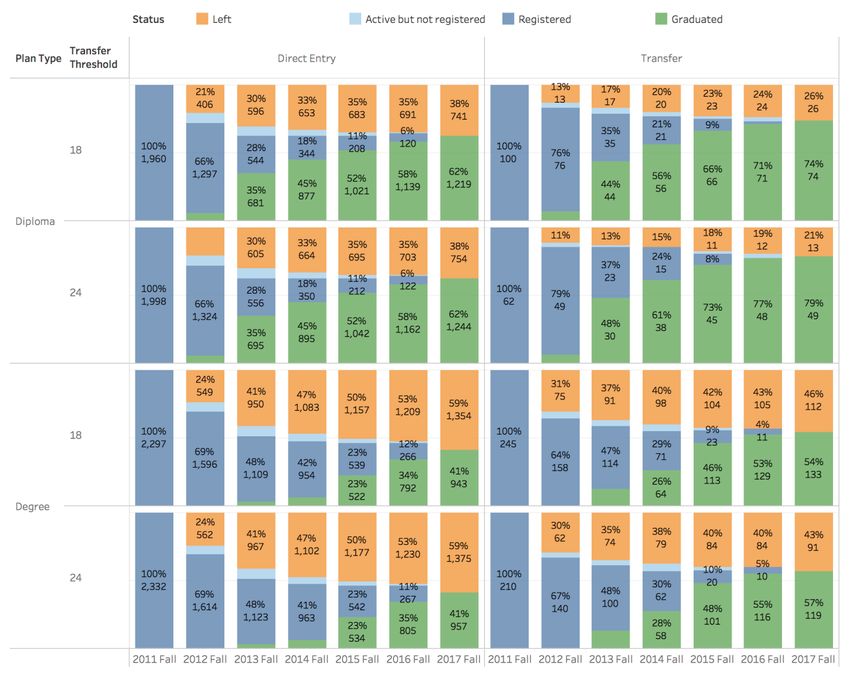
Transfer Student Success in Alberta – MacEwan University
June 14, 2018

the proportion of students who graduate within the expected program length (1 year for certificates, 2
years for diplomas, and 4 years for baccalaureate degrees). In turn, at least that number of years had to
have elapsed since the student was admitted.

This MacEwan University case study was conducted at a time that the landscape of postsecondary
education in Alberta is changing quickly: institutions that formerly were large sending institutions are now
completing institutions, changing the nature and dynamics of what it means to be a transfer student.
Findings from this report should be considered from the perspective of a snapshot in time when changes
are occurring. The case study performed focused on baccalaureate degree, diploma, and certificate
programs.

For this report, we categorize institutions according to Alberta's six sector model, which includes publicly
funded institutions in Alberta (Alberta Advanced Education, 2007). MacEwan University is categorized in
this way as a Baccalaureate and Applied Studies Institution. The other sectors are Comprehensive
Academic and Research Institutions, Polytechnical Institutions, Comprehensive Community Institutions,
Independent Academic Institutions, and Specialized Arts and Culture Institutions. Some post-secondary
institutions in Alberta are outside the six sector model, such as First Nations Colleges, but do participate
in Alberta’s Transfer and Pathways System and may have transfer students moving to MacEwan
University. Further definitions of these sectors are available in key terms.

Environmental scan
The environmental scan revealed that MacEwan has performed limited analysis on the success of
transfer students to date. This is for a variety of reasons including a new student information system,
more urgent analysis on other high priority groups of students, and the uncertainty associated with
whether transfer students will receive transfer credits towards a particular credential prior to graduation.

Additionally, at MacEwan, there is debate as to what the most appropriate definition of transfer is. Some
institutions have a long-defined and recorded basis of admission for post-secondary transfer, something
MacEwan has only recently reliably recorded. One method of defining a transfer student is based on the
whether a student received transfer credit (aligning with the provincial definition of transferability). Another
method is to view transfer as a basis of admission, where transfer students are those surpassing a certain
threshold of transfer credits awarded (at MacEwan, this is 18 transfer credits for diploma programs, and
24 transfer credits for degree programs). The case study in this report is based on the latter concept of
basis of admission as the definition for transfer. The environmental scan at MacEwan highlighted that
there is additional nuance within the notion of transfer that is not easily measured: incidental transfer,
where a student has taken courses in post-secondary, later decides to attend MacEwan, and happens to
get transfer credit for previous work; conversely, intentional transfer occurs when a student deliberately
takes transfer courses at another institution and fully intends to transfer to MacEwan as part of their plan.
The applicability of transfer credits towards a credential is another area where the definition of transfer
gets harder to fully define. For example, a student moving from a fine arts diploma at one institution to an
engineering degree at another institution may well get several transfer credits for fine arts, but will also
likely have to take enough courses in engineering in order to graduate, invariably leading to some of the
transfer courses not directly counting in the engineering degree.

                                                                                                               4
Transfer Student Success in Alberta – MacEwan University
June 14, 2018

Demographics and previous institution
The average age of direct entry students in this study was just under 23, while the average age of transfer
students was just over 24. Females represented about 65% of direct entry students, and 62-63% of
transfer students.

In terms of previous institution attended (for students with transfer credit), 38% (based on an admit type
threshold of 18 credits) to 40% (based on an admit type threshold of 24 credits) were from
Comprehensive Academic and Research Institutions, followed by 19% and 17% respectively from outside
Alberta, and 14% from Comprehensive Community Institutions. About 10% came from Baccalaureate and
Applied Studies Institutions, the majority of whom are students who are returning to MacEwan after
completing a previous credential.

Case study
The case study performed in this report analyzed metrics both with descriptive statistics and using
regression analysis. Descriptive statistics are summary level information about a particular group. The
descriptive statistics included in this case study are: time to completion, graduation rate, and average
credits over time. Regression analysis is used to estimate relationships among variables, with a focus on
a dependent variable (for example, GPA at graduation) and multiple independent variables (for example,
gender, academic program, and indigenous status). The regression analyses included in this case study
are: time to completion and grade point average at graduation. For more information on the metrics used,
please see key metrics.

As part of the case study, we created a proxy indicator to determine whether a student was a transfer
student or a direct entry student. Two proxies were used: 18+, and 24+ transfer credits awarded were
coded as transfer students. Those who fell below the proxy threshold (0-17 transfer credits and 0-23
transfer credits) were coded as direct entry students. The thresholds of 18 and 24 were chosen to
correspond with MacEwan’s use of 18 transfer credits to qualify as a transfer student to diploma
programs and 24 transfer credits to qualify as a transfer student to degree programs.

Additionally, in order to provide a balanced comparison, many metrics are divided into three versions: an
unadjusted model, where direct entry students and transfer students are compared directly from when
they started studying at the institution; a normalized to 24 credit model, where direct entry students with
between 24 and 30 credits completed at MacEwan are compared to transfer students with between 24
and 30 transfer credits - effectively from the start of second year for both; and a comparison normalized to
60 credits. By normalizing the data, we allow for a comparison from a common starting point, whereas
using time of admission gives transfer students an advantage because they have already completed
some work towards graduation. Normalizing the data in this way illustrates an important point: the lens
through which you view transfer student success changes the outcome metric.

Time to completion
The case study illustrated some key points: when we used unadjusted comparisons, transfer students
predictably finish their credentials faster than direct entry students. However, when we normalize to our
recommended common baseline of 24 credits completed at MacEwan or via transfer, the gap in time to
completion narrows considerably for degree students, with diploma-seeking transfer students now taking
longer than their direct entry counterparts, and degree-seeking transfer students finishing only marginally
faster than direct entry students. Regression analysis on time to completion showed significance but only

                                                                                                          5
Transfer Student Success in Alberta – MacEwan University
June 14, 2018

captured a small amount of the variance in time to completion when transfer was taken into account. For
further information on these metrics, see key metrics.

Graduation rate
Graduation rate was also analyzed against expected program completion time, this being the duration
nominally assigned to completion of a credential (in this study, 1 year for certificates, 2 years for
diplomas, and 4 years for degrees). Using the normalized to 24 credits model, direct entry students were
more likely to finish their diplomas within the expected program length, but this effect is muted by 150% of
the program length. For degree students, transfer students are more likely to have completed their
credential by both expected program length and 150% of that time. For further information on these
metrics, see key metrics.

Progression
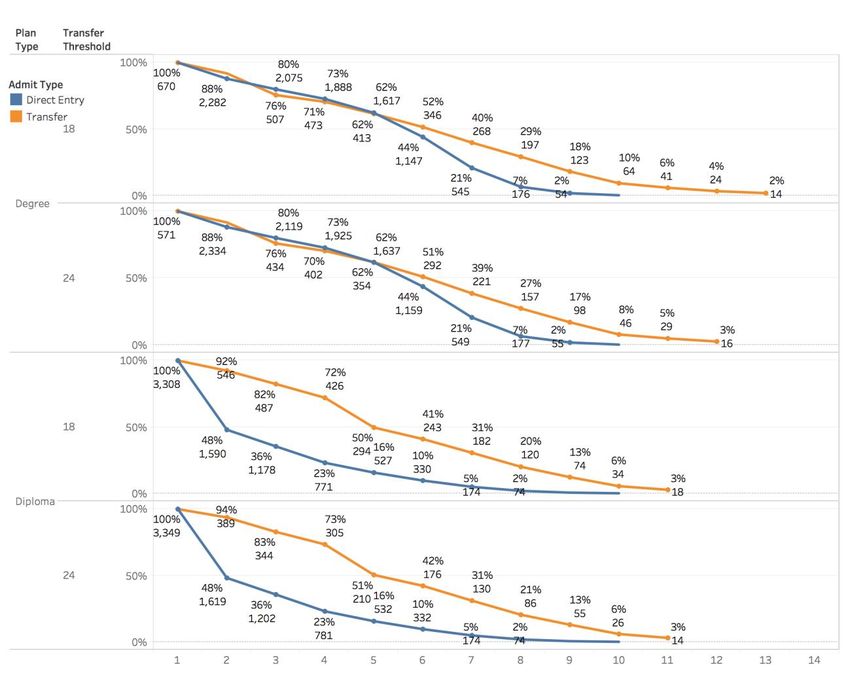
Transfer students were less likely to leave the institution and more likely to graduate within the study
period than their direct entry counterparts. Progression to a particular registration term was comparable
for transfer and direct entry students in degree programs until about 2-3 years into their studies, when
more transfer students began to graduate. In diploma programs, there was minimal difference. When
normalizing for completion of 24 credits, a similar pattern occurs, but earlier. Degree students start to see
divergence around term 5, with transfer students being slightly more likely to continue enrolling than direct
entry students until about term 10. For diploma students, this divergence occurs between terms 4 and 10.
For degree students, transfer and direct entry students are similarly likely to register until term 6, after
which transfer students become more likely to register up to term 10. For further information on these
metrics, see key metrics.

GPA at graduation
Looking at GPA at graduation, just over 11% of the variance can be explained by the variables
international, female, age, program, and admit academic year. International students tended to have
slightly lower GPAs at graduation, while females and older students tended to have slightly higher GPAs
at graduation. Adding a transfer indicator provides a small lift to the predictive power of these variables,
between about 0.9-1.1 percentage points. While these regression results are significant, their predictive
power is quite low, suggesting that the variables captured here do not account for a large amount of the
variance in graduation GPA. For further information on this metric, see key metrics.

Transfer student success
The case study generally shows strong performance by both direct entry and transfer students. One of
the reasons this transfer student performance is possible is because Alberta has a purpose built,
transparent, transfer system that does not isolate different types of institutions from one another. This
system helps ensure that transfer students are able to complete credentials quickly when changing
institutions, while earning credit for their prior academic work.

Lastly, we discussed the notion of "success" with MacEwan University. As further illuminated in the
literature review, institutions struggle with a single definition of success. For example, success from the
perspective of one student is very different than success from the perspective of a different student.
Finishing sooner may not be a good thing, from the perspective of a student.

This study aims to help further the conversation around transfer student success metrics in Alberta by
beginning to define aspects of transfer student success based on available MacEwan University metrics.

                                                                                                               6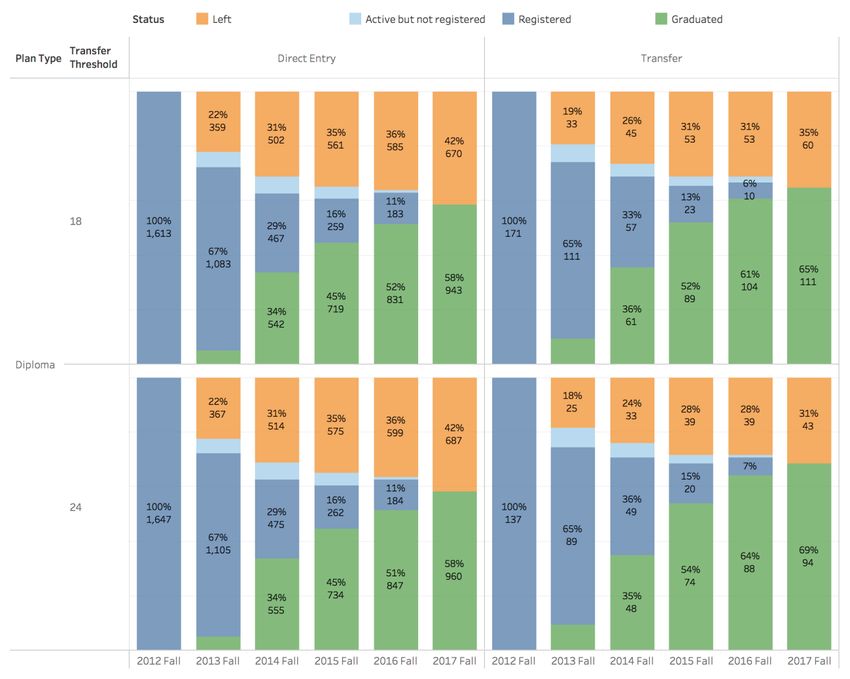
Transfer Student Success in Alberta – MacEwan University
June 14, 2018

These findings may also help to inform future baseline measures for transfer student success in Alberta.
The results of this study, along with the academic literature, suggests the biggest challenges lie in
correctly defining who is a transfer student, which cohort to include them in, and finding a dataset that
goes back far enough to accurately analyze both part- and full-time student success. The study highlights
that transfer students see similar outcomes to direct entry students over similar timeframes when the
basis of comparison is normalized to a similar starting point.

                                                                                                        7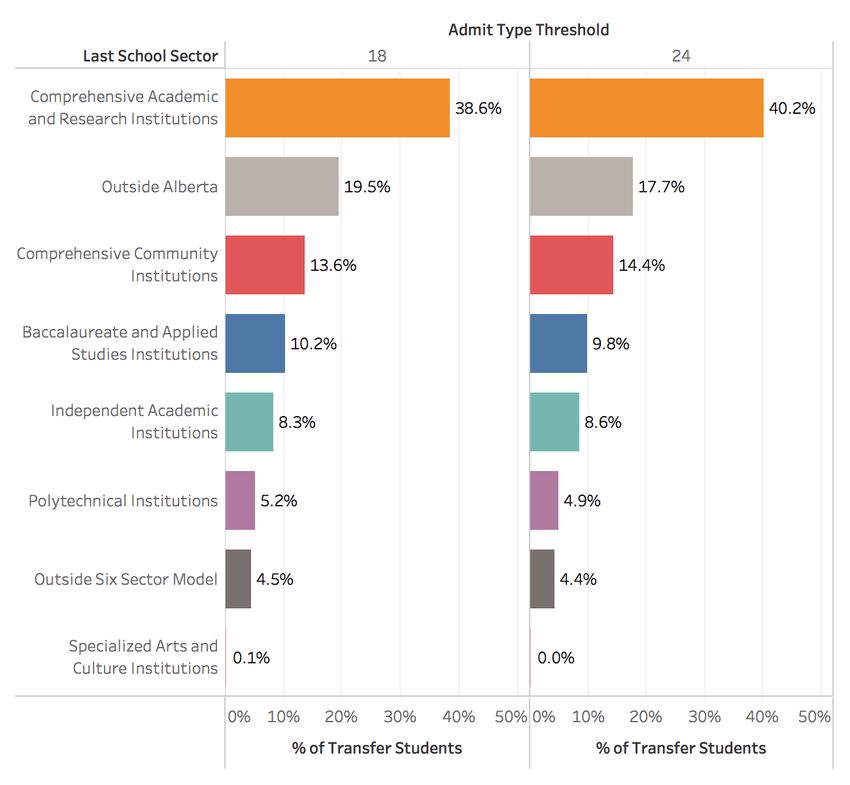
Transfer Student Success in Alberta – MacEwan University
June 14, 2018

Table of contents
Acknowledgements

Executive summary

Table of contents

Introduction

Environmental scan

  Key terms

  Summary of existing metrics from the environmental scan

Literature review

  Canadian transfer student success research

  Research comparing direct entry and transfer student success

    Types of transfer students

Conceptual framework: student transitions

Student success metrics

Case study

  Methodology

  Data transformation summary

  Limitations

  Credit normalization

  Definition of transfer student

  Demographics and previous institution

  Key metrics

    Study Metric 1: Time to completion

      Time to completion descriptive statistics

      Time to completion regression

    Study Metric 2: Graduation rate

      Graduation rate at 100% of expected program length

                                                                 8
Transfer Student Success in Alberta – MacEwan University
June 14, 2018

      Graduation rate at 150% of expected program length

      Graduation rate at 200% of expected program length

      Graduation rate at 100% of expected program length by last institution sector

    Study Metric 3: Progression

         Progression - Fall to Fall, by admit term

      Progression to registration term

         Progression to registration term number

    Study Metric 4: Grade point average at graduation

    Study Metric 5: Average credits over time

Future research recommendations

  Recommendation #1: Further study the impact of students returning to MacEwan for additional
  credentials.

  Recommendation #2: Normalize comparisons between transfer and direct entry.

  Recommendation #3: Explore the feasibility of using Statistics Canada’s Post Secondary Student
  Information System data to measure student success.

  Recommendation #4: Expand the labour market outcomes of graduates of Alberta post-secondary
  institutions analysis to compare direct entry and transfer students.

  Recommendation #5: Explore the feasibility of creating a provincial dataset that measures transfer
  student outcomes.

Conclusion

  Defining transfer students

  Demographics and previous institution

  Normalization and appropriate points in time for comparison

  Transfer student success at MacEwan: Completion time, graduation rate, and progression

  Perspectives on data challenges

References

Appendix - Data Structure

  Base_Data_GMU

  Term_Tbl

                                                                                                       9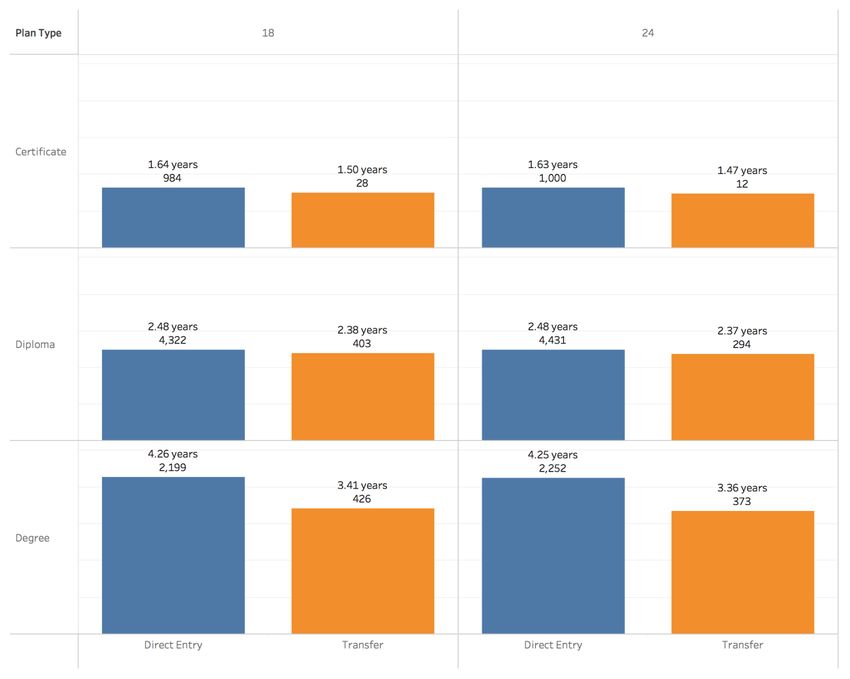
Transfer Student Success in Alberta – MacEwan University
June 14, 2018

 Student_Program

 Student_Term

 Student_Progression_Term

                                                           10
Transfer Student Success in Alberta – MacEwan University
June 14, 2018
Introduction
The Alberta Council on Admissions and Transfer (ACAT) contracted Plaid Consulting to perform a
comprehensive review of transfer student success metrics at MacEwan University. Plaid is a data and
analytics consulting agency focused on helping post-secondary institutions, councils, and governments
make data-informed decisions.
The high-level goal of the project is to begin addressing a gap in Alberta’s post-secondary system learner
pathway and mobility data: transfer of students between post-secondary institutions. While there is
current data on the mobility of students within the system, that data is limited to tracking student
enrolments at and between institutions. This project aims to improve the data available by beginning to
develop and analyze measures of post-secondary transfer student success. The project is focused on
measuring the success of post-secondary transfer students and how transfer students perform in
comparison to direct entry students.
This project consists of 3 main parts: an environmental scan reviewing existing metrics and perceptions of
transfer student success, a literature review emphasizing recent Canadian research into student success,
and a case study utilizing metrics proposed as part of this project. These elements are brought together
to inform the conclusions and recommendations in this report.
The proposed metrics for this report’s analysis were developed using a mixed methods approach that
consisted of
● applying recommendations for best practices for methodology and parameters for analysis
identified in the literature review,
● contextualizing the analysis within information gained from the environmental scan about
MacEwan University, which included informal qualitative data in the form of conversations with
targeted representatives from MacEwan, and
● focusing the report’s core analysis and conclusions on a regression analysis of quantitative
MacEwan data that were based on targeted data metrics for analysis of transfer student success
in comparison to direct entry students.
The case study conducted for this report includes both part- and full-time students in baccalaureate
degrees, diplomas, and certificates who were admitted during the study period. Applied degrees were
excluded from the analysis as the study data included only their final two years of study. University
transfer students were also excluded as we did not have information on whether the student successfully
transferred to a university. Further filtering is done for particular metrics to ensure students had attended
long enough to achieve those metrics. For example, graduation rate at 100% of program length considers
the proportion of students who graduate within the expected program length (1 year for certificates, 2
years for diplomas, and 4 years for baccalaureate degrees). In turn, at least that number of years had to
have elapsed since the student was admitted.
A number of key terms that define different types of students and institutions are used throughout this
report. Please refer to key terms for further information.
11Transfer Student Success in Alberta – MacEwan University
June 14, 2018
Environmental scan
The environmental scan consisted of in person and telephone conversations with Mike Sekulic, University
Registrar, and Tony Norrad, Associate Registrar Admissions. Additional input was provided by David
McLaughlin, Executive Director of Institutional Analysis and Planning. These early conversations revealed
that there would be challenges stemming from adoption of the PeopleSoft Student Information System. It
was also revealed that the current definition of "Previous Post-Secondary" as being 18 transfer credits for
a diploma and 24 transfer credits for a degree, has only been consistently recorded in MacEwan's student
information system in the last few years, necessitating the creation of an admit_type variable for this
study.
At MacEwan there is some debate as to what the most appropriate definition of a transfer student is. One
method of defining a transfer student is based on the whether a student received transfer credit (aligning
with the provincial definition of transferability, discussed at the end of this section). Another method is to
view transfer as a basis of admission, where students surpassing a certain threshold of transfer credits
awarded (at MacEwan, this is 18 transfer credits for diploma programs, and 24 transfer credits for degree
programs) are considered a transfer student. The case study in this report uses the latter definition, based
on the number of transfer credits awarded at admission. While some institutions have a long-defined and
recorded basis of admission for post-secondary transfer, MacEwan has only reliably recorded this basis
of admission in their student information system in the last couple of years (though the definitions of the
basis of admission have been around longer). The environmental scan at MacEwan highlighted additional
nuance to the provincial definitions of both student mobility and transferability: incidental transfer, where a
student has taken courses in post-secondary, later decides to attend MacEwan, and happens to get
transfer credit for previous work; conversely, intentional transfer occurs when a student deliberately takes
transfer courses at another institution and fully intends to transfer to MacEwan as part of their plan. There
is currently no effective way to measure whether transfer is incidental or intentional. The applicability of
transfer credits towards a credential is another area where the definition of transfer gets harder to fully
define. For example, a student moving from a fine arts diploma at one institution to an engineering degree
at another institution may well get several transfer credits for fine arts, but will also likely have to take
enough courses in engineering in order to graduate, invariably leading to some of the transfer courses not
directly counting in the engineering degree. A related subset of student mobility is visiting students, who,
with permission of their home institution, take courses at a recognized institution, with credits counted
towards their home institution credential.
The environmental scan also noted that MacEwan has a significant number of returning students: it is
very common for students to complete a credential (such as a diploma) at the institution and return later
to complete an additional credential (such as a degree). This distinction is allowed for in how the data was
ultimately reshaped for analysis in the case study: we used the earliest graduation term for each student,
and tied that to their admission program (which may not have been the same program as students can
change mid-stream). As such, the analysis to follow shows graduation from the institutional perspective,
rather than the individual program perspective. This case study included degree, diploma, and certificate
program students.
As part of the review process, we also discussed ideas around transfer student performance. In the case
study to follow, several unadjusted metrics show transfer students performing completing their credentials
faster, or being more likely to graduate within a period of time, than their direct entry peers, whereas
normalized metrics show a more complex story that better accounts for the fact that transfer students
12Transfer Student Success in Alberta – MacEwan University
June 14, 2018
begin their studies at MacEwan with a number of transfer credits already completed at their sending
institution that count towards graduation at MacEwan. One of the reasons transfer students are able to
complete their credentials in a timely fashion is because Alberta has a purpose built, transparent, transfer
system that does not isolate different types of institutions from one another. This system helps ensure
that transfer students are able to complete credentials quickly when changing institutions, while earning
credit for their prior academic work.
Lastly, we discussed the notion of "success" with the institutions. As further illuminated in the literature
review, institutions struggle with a single definition of success. For example, success from the perspective
of one student is very different than success from the perspective of a different student.
The focus of this report is to begin to define initial aspects of transfer student success based on available
MacEwan metrics. These findings may help to inform future baseline measures for transfer student
success in Alberta.
Key terms
This report uses the Government of Alberta's definitions related to transfer and student mobility, where
possible, as provided in the data dictionary for the Learner Pathways System (Alberta Council on
Admissions and Transfer, 2017c), and the visiting student definitions as provided by MacEwan
University's website (MacEwan University, n.d.). Terms that are not part of the Government's definitions
are also used in this report, including the admit types of direct entry and transfer, which are used in the
case study and analysis related to it. These latter terms are important because they are a different
method of defining transfer students, which is important for their comparability to direct entry students.
The key terms employed are:
● Student Mobility (Provincial definition): Refers to a learner’s ability to access different learner
pathways (routes) during his/her program of study(s) in post-secondary education, including
movement into, within, from, or back into post-secondary education. Mobility allows students to
earn credits toward a credential at more than one institution, ladder from one credential to
another credential, build on foundational learning and high school upgrading to enter post-
secondary studies, and/or access to many other learner pathways (Alberta Council on
Admissions and Transfer, 2017c).
● Transferability (Provincial definition): Refers to a student’s ability to successfully receive transfer
credit for an applicable course(s) and/or program(s) when he/she moves between post-
secondary institutions and/or between program areas (Alberta Council on Admissions and
Transfer, 2017c).
● Admit Types (used in the case study):
○ Transfer: a student meeting or exceeding a particular threshold of transfer credits at the
time of admission. At MacEwan, this threshold is 18 credits for diploma programs, and 24
credits for degree programs. Because an admit type was not available in the data
provided by MacEwan, we have used the 18-credit and 24-credit thresholds for this
report's case study as a proxy to determine transfer status for all programs (certificates,
diplomas, and degrees).
13Transfer Student Success in Alberta – MacEwan University
June 14, 2018
○ Direct entry: a student not meeting the criteria for transfer.
○ It is important to note that the direct entry will include students who have up to
the threshold of credits noted in the transfer definition. For example, a student
with 17 transfer credits would be coded as direct entry.
● Visiting Student (MacEwan University students visiting another institution): A MacEwan University
student pursuing courses towards their MacEwan credential at another recognized post-
secondary institution. To obtain MacEwan credit, students must have a Letter of Permission prior
to enrolling in the course (MacEwan University, April 4, 2018).
○ Note: there are also visiting students from other institutions who attend MacEwan, and
are part of Open Studies during their time at MacEwan. These students are not included
in this report.
In addition to terms related to defining students, a number of terms defining institutional categories are
used. For this report, we categorize institutions according to Alberta's six sector model, which includes
publicly funded institutions in Alberta (Alberta Advanced Education, 2007). MacEwan University is
categorized in this way as a Baccalaureate and Applied Studies Institution. The six types of institutions
are categorized by their academic programs, research activity, and learner focus.
Institutional Institutions Academic Programs Research Learner Focus
Activity
Sector
Baccalaureate and MacEwan University Certificate Applied Learners interested in an
Applied Studies Diploma research and education oriented to
Institutions Mount Royal University Applied Degree scholarly activity employment or
Bachelor's Degree (in to enhance their academic study.
specified areas) instructional
University Transfer mandate.
Post-Diploma Certificate
Graduate Certificate
Comprehensive Athabasca University Bachelor's Degree The University The University of
Academic and Post-Bachelor's Certificate of Alberta, Alberta, University of
Research University of Alberta Post-Bachelor's Diploma University of Calgary and University
Institutions Master's Degree Calgary and of Lethbridge are
University of Calgary Post-Master's Certificate University of campus-based
Post-Master’s Diploma Lethbridge institutions serving the
University of Lethbridge Doctoral Degree conduct pure needs of learners
Post-Doctoral Certificate and applied interested in a
Post-Doctoral Diploma research in a comprehensive,
University Certificate wide range of research intensive
University Diploma disciplines. environment.
Athabasca Athabasca University is
University an open university that
conducts provides education
research through distance
primarily in the delivery. It focuses on
area of distance learners interested in
delivery open, flexible learning
education. opportunities.
14Transfer Student Success in Alberta – MacEwan University
June 14, 2018
Institutional Institutions Academic Programs Research Learner Focus
Activity
Sector
Comprehensive Bow Valley College These institutions provide a Applied Learners interested in
Community broad range of programs research and preparatory, career, and
Institutions Grande Prairie Regional that prepare learners for scholarly activity academic programming.
College employment or for further to enhance their
study. instructional
Keyano College Academic Upgrading mandate.
Applied Degree
Lakeland College Bachelor's Degree (in
collaboration with a degree-
Lethbridge College granting institution)
Bachelor's Degree with
Medicine Hat College Applied Focus
Certificate
NorQuest College Diploma
Journeyman Certificate
Northern Lakes College (using Apprenticeship and
Industry Training certification
Olds College standards)
Post-Diploma Certificate
Portage College Graduate Certificate
Red Deer College
Independent Ambrose University These institutions primarily Applied Learners interested in
Academic provide liberal arts, science, research and academic programs
Institutions Burman University and education scholarly activity within a faith-based
baccalaureate degree to enhance their educational
Concordia University of programs. They may also instructional environment.
Edmonton offer graduate programs in mandate.
niche areas.
The King's University Not all programs provided by
these institutions are subject
St. Mary's University to approval by the
Government of Alberta.
Other programs may have
met the quality assurance of
other regulatory bodies.
Approved programs:
Academic Upgrading (in
specific areas)
Baccalaureate Degree (in
niche areas)
Master's Degree (in niche
areas)
May also offer:
Divinity Degree
Post-Baccalaureate
Certificate
Post-Baccalaureate Diploma
Polytechnical Northern Alberta Institute Academic Upgrading Applied Learners interested in
Institutions of Technology Applied Degree research and career and technical
Baccalaureate Degree (in scholarly activity programming.
Southern Alberta Institute specified areas) to enhance their
of Technology Certificate instructional
Diploma mandate.
Journeyman Certificate
(Training Component)
Post-Diploma Certificate
Graduate Certificate
15Transfer Student Success in Alberta – MacEwan University
June 14, 2018
Institutional Institutions Academic Programs Research Learner Focus
Activity
Sector
Specialized Arts Alberta College of Art and These two unique Applied Learners interested in
and Culture Design institutions specialize in research to the fine arts and
Institutions providing fine arts and enhance their creativity.
The Banff Centre cultural programming at the instructional In particular, Alberta
undergraduate, graduate or mandate. College of Art and
professional development Alberta College Design serves the needs
level. of Art and of learners interested in
Applied Degree Design also career and academic
Baccalaureate Degree (in engages in programming.
niche areas) scholarly The Banff Centre serves
Certificate activity. the needs of learners
Diploma with prior academic and
Master's Degree (in niche professional experience.
areas)
Doctoral Degree (in niche
areas)
Post-Diploma Certificate
Some post-secondary institutions in Alberta are outside the six sector model, such as First Nations
Colleges, but do participate in Alberta’s Transfer and Pathways System and may have transfer students
moving to MacEwan University.
Lastly, the term "sending institution" or "transfer institution" is used to refer to the institution a transfer
student attended prior to transferring to MacEwan University. "Receiving institution" or "Completion
institution" is used to refer to MacEwan, following a student's transfer.
Summary of existing metrics from the environmental
scan
MacEwan currently has minimal metrics comparing the success of transfer students with direct entry
students.
A detailed overview of the metrics created for this report’s case study can be found in key metrics.
Literature review
Incoming transfer students account for a significant student population at many of Alberta’s post-
secondary institutions (PSIs) and are key to ACAT’s role in providing oversight for "learner pathways and
mobility throughout the advanced learning system" (Alberta Council on Admissions and Transfer, 2017a).
While the number of students continuing in publicly funded institutions grew during the period of 2004-
2013, the number of students demonstrating system mobility by continuing at a new institution declined
over the same period (Alberta Council on Admissions and Transfer, 2017b). Facilitating more seamless
transfer processes for Alberta students could influence these trends by ensuring students are able to
obtain appropriate credit for prior learning and able to move between institutions and sectors as their
educational plans change. In the historical context, one of the roles of college (the sending institution)
was to prepare students for university transfer, often in two year programs that laddered into four year
programs at the university (the receiving institution). The landscape has changed considerably since then:
16Transfer Student Success in Alberta – MacEwan University
June 14, 2018
there are more students, a greater variety of institutions to choose from across Alberta’s Six Sector Model
for Advanced Education (Alberta Advanced Education, 2007), and different societal needs for credentials.
Enrolment patterns are changing as students are seeking to move fluidly from one sector to other sectors,
and “a new view may prove useful, one in which students are the unit of analysis and institutions are
viewed as stepping stones along a diverse set of educational paths” (Hosler et al., 2012).
For this report, we categorize institutions according to Alberta's six sector model, which includes public
institutions in Alberta (Alberta Advanced Education, 2007). For further definition of these sectors, see key
terms.
This literature review is further divided among two major themes: Canadian transfer student success
research, and research comparing direct entry and transfer student success.
Canadian transfer student success research
Research on student persistence in the Canadian context has grown in recent years. Baseline indicators
from within individual academic institutions tell one aspect of the story. More recently, researchers have
begun utilizing longitudinal surveys, administrative, and earnings data from Statistics Canada: the Youth
In Transition Survey (YITS), and the Postsecondary Student Information System (PSIS), and tax records.
Baseline persistence within an individual institution
Prior to work involving the YITS or the PSIS, most research has focused on persistence within a single
institution (Parkin & Baldwin, 2009). This research showed that around 60% of students could be
expected to complete their studies (Grayson & Grayson, 2003). Highlighting this point, Martinello (2008)
found that 40% of students at the bachelor's level left or changed their first program of study, aligning with
Gilbert's (1991, as cited in Martinello, 2008), finding that 42% of students enrolled full-time in the fall of
1985 in several Canadian universities dropped out after 5 years had elapsed; he further estimated that
10% of the initial cohort transferred to another institution.
Youth In Transition Survey
YITS "is designed to examine the patterns of, and influences on, major transitions in young people's lives,
particularly with respect to education, training and work" (Statistics Canada, 2011). The YITS was
developed by Human Resources and Skills Development Canada and Statistics Canada, in consultation
with provincial and territorial ministries responsible for labour and education. The survey measures major
transitions in young people's lives encompassing formal educational experiences, most labour market
experiences, achievement, aspirations, expectations, and employment experiences. YITS consists of two
cohorts: Cohort A (herein referred to as YITS-A) were born in 1984 and were aged 15 at the start of the
survey in 1999; and Cohort B (herein referred to as YITS-B) were born between 1979 and 1981, and
were aged between 18 and 20 in 1999. Follow up surveys of these cohorts were conducted every two
years, in 2002, 2004, and 2006, and 2008. The initial sample size for YITS-A was 38,000 while YITS-B
was 29,000.
Because the YITS (for both cohorts) is both longitudinal and focuses heavily on tracking individuals'
educational experiences, academic backgrounds, aspirations and expectations, it is a very strong tool for
analyzing student persistence (Finnie and Qiu, 2009).
17Transfer Student Success in Alberta – MacEwan University
June 14, 2018
Finnie, Childs, and Qiu (2010) calculated transition rates in Ontario focusing on four broad statuses for
each student in each year: Graduate, Continuer (in the same institution), Switcher (began studying at a
different institution), and Leaver (left PSE without graduating, or no longer in the data file for this regional
study). Because the YITS-B dataset contains information not only on whether the student graduates from
their first program of study, but any program, they found a number of important differences between their
results and research into persistence: nearly 80% of students either obtain a degree or continue to be
enrolled in the post-secondary system five years following entry, with 71% graduating in 5 years and 6%
who are still studying. This 71% compares to 58% if only the initial program started were being measured.
Further, they note that a significant number of students follow non-traditional pathways, including
switching programs, taking breaks, and moving in and out of PSE; including these students shows higher
persistence rates - "while 26.9 of Ontario college students leave their first PSE program by the end of the
first year, over a third of these (10.1 percent of the total) switch immediately to another PSE program"
(Finnie, Childs, & Qiu, 2010 p.29-30), with 23.5% returning within a year of leaving, many at the same
institution in a new program.
These results are further enforced by Lambert, Zeman, Allen and Bussiere (2004) using the YITS-B
dataset for the first two cycles: 15% of those who had enrolled in PSE left without completing their
program. This research was followed up by Shaienks, Eisl-Culkin, and Bussiere (2006) which showed
15.7% for the third cycle.
Finally, a study by Martinello (2008) showed that 50-60% graduated from the first program they started,
with an additional 10-12% completing a credential in their second program, while 12-13% were still
studying in their second program. Martinello additionally showed that only 8.7% of students left post-
secondary entirely, once transfers to new programs or institutions were taken into account.
The YITS also has limitations: the sample size isn't large enough to analyze certain pathways at a more
granular than national level, and it lacks specific information identifying post-secondary institutions, as
well as selection and response bias (Finnie & Qiu, 2009).
Postsecondary Student Information System
Statistics Canada's Postsecondary Student Information System (PSIS) "collects information pertaining to
the programs and courses offered at an institution, as well as information regarding the students
themselves and the program(s) and course(s) in which they were registered, or from which they have
graduated" (Statistics Canada, 2017) for all public post-secondary institutions in Canada. PSIS is an
annual submission. There is no sample associated with PSIS - it contains the population for the
institutions that participate.
Finnie and Qiu (2009) utilized the PSIS to analyze student persistence across Atlantic Canada at all
academic levels: college, bachelor's, master's, doctoral, and first professional degrees, with an emphasis
on college and bachelor's students due to the sample sizes and related policy concerns. The Atlantic
region was chosen in part because it had near universal participation among public institutions for the
reporting period between 2001 through 2004. The researchers linked individual student records both
within each reporting year (where a student enrolled in multiple programs) and over time, allowing them to
uniquely identify and track students pathways in PSE. Finnie and Qiu focused on four broad statuses for
each student in each year: Graduate, Continuer (in the same institution), Switcher (began studying at a
18Transfer Student Success in Alberta – MacEwan University
June 14, 2018
different institution), and Leaver (left PSE without graduating, or no longer in the data file for this regional
study).
One of the key reasons for studying persistence at a regional level, rather than from the perspective of an
individual institution, is that individual institutional data doesn't provide insight into how students switch
institutions, which causes an overestimation of the number of leavers.
The major findings from Finnie and Qiu (2009) on basic persistence rates were:
● The first year "dropout rate" at the university level, for 17-20 year olds beginning their first
program, was 20.2%, at the individual institution level.
● Some of those noted as "leavers" are in fact "switchers" changing institutions: 5.1% in absolute
terms. In effect, this leads to substantial bias in the leaving rates for PSE when a single institution
is analyzed. This means that "true" leavers were only 15.1% at the university level (22.6% at the
college level, where switching institutions was negligible).
● Switching and leaving rates are considerably lower in the second year as compared to the first
with the leaving rates declining from 15.1 % to 11.7%, and switching rates declining from 5.1 % to
4.2%.
● Expanding the list of programs to include short courses, language training, etc. increases the
number of students who would be considered switchers, resulting in a corresponding drop to the
leave rate to 13.8%.
When comparing college students to bachelor’s students they found that leaving rates were higher for
college students at 22.6% versus 15.1% for bachelor’s students in the first year. The switching rates were
almost negligible for college students but were substantial for bachelor’s students. The PSIS data also
showed that the leaving rate increases substantially with age for bachelor’s students, whereas switching
rates decline with age. For college students, leaving rates are slightly lower for older students and
switching rates remain negligible.
Comparing leaving rates across genders the data showed that men leave at much higher rates than
women at the university level (28.4% versus 21.9% by the end of year 2). Conversely, women showed
slightly higher switching rates than men. The patterns by sex at the college level are almost identical by
the end of year 2 (33.1% for men and 33.6% for women). The authors underscore the important
implication of these findings that since men enter university at substantially lower rates than women, and
are also less likely to persist in their studies, the resulting gender differences in final graduation rate will
be skewed even more than the access rates commonly looked at would indicate. When leaving and
switching rates are combined (the “quit rate” from the individual institutional perspective), the gender
differences in persistence in PSE are clearly understated.
Finnie and Qiu (2009) also found that 25% of bachelor's leavers return to PSE over time, with about half
of these returning to the same institution, and a quarter staying at the same level but changing institutions
(it should be noted that "level" is not necessarily the same as Alberta PSE sectors). 11.5% of college
leavers return to their studies, with most returning to the same institution. This points to the conclusion
that overall leaving rates are substantially overstated when these “leaver-returners” are not taken into
account. This is referred to as the “stop-out” phenomenon.
19Transfer Student Success in Alberta – MacEwan University
June 14, 2018
It is possible that Finnie and Qiu (2009) study underestimates continuance rates, as it was limited
geographically to just records from Atlantic Canada, meaning any student who moved to an institution in
another province would be considered a leaver.
The authors concluded that the PSIS data provides a useful perspective on persistence in PSE which will
be of interest to those concerned with student pathways.
Post-graduation earnings
The Educational Policy Research Initiative (EPRI), conducted research on the post-graduation outcomes
of PSE graduates by "constructing and analyzing a dataset linking 14 Canadian PSE institutions'
administrative data with tax data [from 2005-2013] held at Statistics Canada" (Finnie, Dubois, & Miyairi,
2017, p.4). The students were grouped by whether they were direct entry from high school or transfer
students. The study grouped students on the basis of direct entry (DE), or non direct entry (non-DE, i.e.,
transfer). These groups were further divided according to age at graduation: younger and older, with the
age-at-graduation cutoff being 23 for diploma graduates, and 24 for degree graduates.
For diploma graduates, younger and older DE groups as well as the younger non-DE group showed
substantial jumps in earnings following graduation, while the older DE group showed a more modest
increase.
For diploma graduates, the younger DE group saw the largest jump in salary, moving from below $10,000
prior to PSE, to just under $30,000. The older DE group earnings were mostly flat at around $20,000. Of
the non-DE groups, the younger group saw a large uptick from below $10,000 to around $30,000, while
the older group showed a modest increase of about $4,300 compared to their pre-PSE salary. However,
the older non-DE group also exhibited an earnings decline in the two years prior to PSE, unlike the other
groups - when this is accounted for, the increase is about $12,000 relative to two years prior to PSE
(Finnie, Dubois, & Miyairi, 2017).
For degree graduates, younger and older DE groups as well as the younger non-DE group had pre-PSE
salaries of approximately $10,000 and post-PSE salaries of approximately $30,000, while the older non-
DE group had a pre-PSE salary of $30,000 and a post-PSE salary of $43,000 (Finnie, Dubois, & Miyairi,
2017).
Hango (2010) also looked at earnings following study in PSE, but focusing on the comparison between 1-
2 and 5-6 years post-graduation for students who took a direct route to post-secondary or an indirect
route. In this study, direct entry students showed an average lift between years 1-2 and 5-6 following
graduation of 10.25% whereas those who followed an indirect route to PSE showed a lift of nearly 16%.
More recently, the Government of Alberta published the Labour Market Outcomes of Graduates of Alberta
Post-Secondary Institutions in February 2018. This report did not directly compare direct entry to transfer
students, but did highlight that Alberta post-secondary graduates see significant increases in income
following graduation, though this varied by credential and field of study. The study also noted that
students who graduate in a recession year may have lower earnings, both initially and in the long run,
compared to those who graduate in non-recession years. Further, field of study is just as significant as
credential type in predicting earning potential, though higher level credentials usually lead to higher
20Transfer Student Success in Alberta – MacEwan University
June 14, 2018
income (Government of Alberta, 2018a). The Government of Alberta has also made earnings data
available through the ALIS career, learning, and employment portal (Government of Alberta, 2018b).
Research comparing direct entry and transfer student
success
Beyond the examples identified above, there is limited Canadian research into frameworks for effectively
comparing direct entry and transfer student success on key metrics.
In the Canadian context, British Columbia has a provincial level data exchange initiative, the Student
Transitions Project (STP), that brings together data from the secondary and post-secondary systems and
reports on outcomes (Government of British Columbia, April 4, 2018). BC’s STP provides annual high
level reporting and newsletters containing highlights of transfer patterns across all types of institutions as
it contains data from research-intensive universities, teaching-intensive universities, colleges and
institutes. Of particular relevance to this report is the ability to see transfer patterns across different
institutions. We note that the STP is distinct from BC’s Central Data Warehouse (CDW) which does not
include BC’s research universities. The Maritime Provinces Higher Education Commission (MPHEC)
reports publicly on student progress and outcomes for institutions in New Brunswick, Nova Scotia, and
Prince Edward Island. As a joint commission, MPHEC can report both whether a student has persisted or
completed at a particular institution and whether they have persisted or completed at an alternate
maritime university (Maritime Provinces Higher Education Commission, n.d.). Ontario’s universities use a
7-year graduation rate for a cohort of full-time, first-time, first-year students who were attending in the Fall
semester (Council of Ontario Universities, 2017). Ontario’s colleges use a similar metric: certificate and
diploma programs are based on the percentage of students who graduated within twice the time for
standard program duration, while for degree students it is based on seven years (Higher Education
Quality Council of Ontario, 2017). Previously, Ontario’s colleges used a reverse cohort model, where
graduation rate are based on the number of “students who complete diploma/certificate programs within a
minimum time frame expressed as a percentage of entering students”, which the colleges found to be
highly problematic as it overinflated results for some institutions and underinflated results for others
(Donner and Lazar, 2000). Newfoundland and Labrador measures its graduation rate for the college by
taking the number of graduates per year as a percentage of the total entrants within expected program
duration (Donner and Lazar, 2000). The Pan-Canadian Consortium on Admissions and Transfer (PCCAT)
commissioned a survey and report on student mobility across Canadian jurisdictions, which touched
briefly on transfer student performance by noting that many institutions do not keep a historical record of
historical averages of performance measures at a point in time (such as GPA at end of first year), but
tend to keep better records of completion so could more readily calculate historical graduation rate
(Heath, 2012).
In the past decade, there have been significant efforts to improve the reporting of transfer student
success. For example, British Columbia developed KPIs that aim to show that system goals have been
achieved. These principles guided the selection of the KPIs (Donner and Lazar, 2000):
● Consistent data definitions and collection across college system;
● Emphasis on measuring results (outcomes and outputs);
● Valid measures of what they are intended to measure;
● Reliability over time; and
● Clear, understandable, and transparent.
21Transfer Student Success in Alberta – MacEwan University
June 14, 2018
Types of transfer students
Transfer students come from a variety of different backgrounds. The literature notes that students can
transfer in several directions and that there are different subsets of transfer students.
Hossler et al. (2012) note that transfer can occur in several directions:
● Lateral transfer: a student moving from one institution to an institution in the same sector, such as
from NAIT to SAIT.
● Traditional, or vertical, or upward transfer: a student moving from a two-year institution to a four-
year institution, such as from moving from a regional college to a university.
● Reverse transfer: a student moving from a four-year institution to a two-year institution, such as
moving from a university to a regional college..
McCormick (2003) identified several subsets of transfer students:
● Trial enrollers: students experimenting with the possibility of transferring to another institution.
● Special program enrollers: students doing most of their work at their home institution who also
take advantage of unique programs offered at other institutions.
● Supplemental enrollers: students enrolling at an additional institution for a term or two to
supplement or accelerate their program. This often allows students to take courses not available
at the home institution, reduce expenses by enrolling where costs are lower, or make up for a
shortfall in credits. Note that this can also be used strategically: a student fearing a low grade
could take a course elsewhere to ensure it isn’t included in the GPA of their home institution.
● Concurrent enrollers: students enrolling in courses at multiple institutions simultaneously.
● Consolidated enrollers: students who take a substantial share of their coursework at multiple
institutions, but still meet their home institution’s residency requirements.
● Serial transfers: Students who make one or more intermediate transfers on the way to a final
transfer destination.
● Independent enrollment: students pursuing work unrelated to their degree program who transfer
no credits (professional certifications and licensing are examples).
With such a wide variety of transfer students and directions they can take, it can be difficult to accurately
portray success of these students. Many traditional metrics of student success focus on key completion
related elements including graduation rate, time to completion, and retention rate. Typically, graduation
rate is viewed in the context of some percentage of “normal” program completion - the Consortium for
Student Retention Data Exchange (CSRDE) and the Integrated Post-secondary Education Data System
(IPEDS) both use 150% of normal time, which most often translates into reporting on a six-year
graduation rate for students in undergraduate degree programs, while Ontario’s universities use seven-
year graduation rate. Time to completion is nominally the time elapsed between when a student begins
study at an institution and when they complete a credential. Retention rate doesn’t have a universal
definition, but is often reported as the percentage of first-year students retained to second year or third
year. Many institutions participate in data exchange consortia to allow comparison of these metrics to
peer groups, and in some cases be able to report on outcomes for students who have left the institution
but continued to study elsewhere.
The two largest exchange consortia in this realm are CSRDE and IPEDS. The CSRDE includes nearly
400 institutions, of which 36 are in Canada, including the Universities of Alberta, Calgary and Lethbridge
and Mount Royal University (Consortium for Student Retention Data Exchange, n.d.). CSRDE is based
22You can also read


