Redevelopment of the River Club, Observatory, Cape Town Socioeconomic Specialist Study - Liesbeek Leisure Properties Trust
←
→
Page content transcription
If your browser does not render page correctly, please read the page content below
Redevelopment of the
River Club, Observatory,
Cape Town
Socioeconomic Specialist Study

Report Prepared for

Liesbeek Leisure Properties Trust

Report Number 478320/SE
SRK Consulting: 478320 River Club Redevelopment Socioeconomic Study                             Page ii

            Redevelopment of the River Club,
            Observatory, Cape Town
            Socioeconomic Specialist Study

            Liesbeek Leisure Properties Trust

            SRK Consulting (South Africa) (Pty) Ltd
            The Administrative Building
            Albion Spring
            183 Main Rd
            Rondebosch 7700
            Cape Town
            South Africa

            e-mail: capetown@srk.co.za
            website: www.srk.co.za

            Tel: +27 (0) 21 659 3060
            Fax: +27 (0) 21 685 7105

            SRK Project Number 478320

            July 2019

             Compiled by:                                                   Peer Reviewed by:

             Sue Reuther                                                    Chris Dalgliesh
             Principal Environmental Consultant                             Partner

             Email: sreuther@srk.co.za
             Authors:
             Sue Reuther

REUT/DALC                                 478320_River Club_Socioeconomic study_July19_Final    July 2019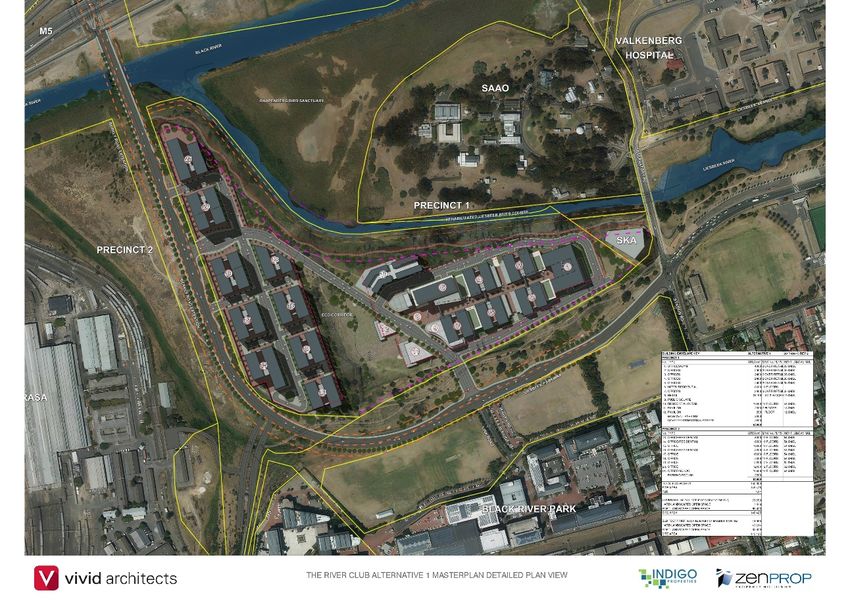
SRK Consulting: 478320 River Club Redevelopment Socioeconomic Study                                                      Page iii

Profile and Expertise of Specialists
SRK Consulting (South Africa) (Pty) Ltd (SRK) has been appointed by the Liesbeek Leisure Properties Trust
(LLPT or the proponent) to undertake the Environmental Impact Assessment (EIA) process required in terms
of the National Environmental Management Act 107 of 1998 (NEMA). SRK has conducted the Socioeconomic
specialist study as part of the EIA process.

SRK Consulting comprises over 1 300 professional staff worldwide, offering expertise in a wide range of
environmental and engineering disciplines. SRK’s Cape Town environmental department has a distinguished
track record of managing large environmental and engineering projects, extending back to 1979. SRK has
rigorous quality assurance standards and is ISO 9001 accredited.

As required by NEMA, the qualifications and experience of the key independent Environmental Assessment
Practitioners (EAPs) undertaking the EIA are detailed below and Curriculum Vitae provided in Appendix A.

 Project Review: Christopher Dalgliesh, BBusSc (Hons); MPhil (EnvSci)
 Certified with the Interim Board for Environmental Assessment Practitioners South Africa (CEAPSA)
 Chris Dalgliesh is a Partner and Principal Environmental Consultant with over 26 years’ experience, primarily in South Africa,
 Southern Africa, West Africa and South America (Suriname). Chris has directed and managed numerous Environmental and
 Impact Assessments (EIAs) and associated management plans, in accordance with South African or international standards,
 and has also been involved in a number of social and socioeconomic specialist studies conducted as part of EIA processes.
 He regularly provides review of ESIAs and associated specialist studies.

 Specialist Consultant: Sue Reuther, BSc Hons (Economics); MPhil (Environmental Management)
 Certified with the Interim Board for Environmental Assessment Practitioners South Africa (CEAPSA)
 Sue Reuther is a Principal Environmental Consultant with more than 15 years of experience, primarily in South Africa,
 Southern and West Africa and South America (Suriname). She has managed complex EIAs for a wide range of projects in
 the infrastructure, mining, coastal and industrial sectors. Sue has also undertaken socioeconomic impact assessments for a
 range of developments, including mining, infrastructure and alternative energy projects in South Africa, Suriname and the
 DRC, and has extensive experience with strategic environmental planning. She has two years of previous experience in
 strategy and financial research.

Statement of SRK Independence
Neither SRK nor any of the authors of this Report have any material present or contingent interest in the
outcome of this Report, nor do they have any pecuniary or other interest that could be reasonably regarded as
being capable of affecting their independence or that of SRK.

SRK has no beneficial interest in the outcome of the assessment which is capable of affecting its
independence.

Disclaimer
The opinions expressed in this report have been based on the information supplied to SRK by LLPT. SRK has
exercised all due care in reviewing the supplied information, but conclusions from the review are reliant on the
accuracy and completeness of the supplied data. SRK does not accept responsibility for any errors or
omissions in the supplied information and does not accept any consequential liability arising from commercial
decisions or actions resulting from them. Opinions presented in this report apply to the site conditions and
features as they existed at the time of SRK’s investigations, and those reasonably foreseeable. These opinions
do not necessarily apply to conditions and features that may arise after the date of this Report, about which
SRK had no prior knowledge nor had the opportunity to evaluate.

REUT/DALC                                  478320_River Club_Socioeconomic study_July19_Final                            July 2019
SRK Consulting: 478320 River Club Redevelopment Socioeconomic Study                                            Page iv

Executive Summary
The River Club in Observatory is currently used as a commercial recreational enterprise including golf facilities
and conference venue. The LLPT is proposing to redevelop ~21 ha of the River Club property and portions of
adjacent properties, including portions of the original course of the Liesbeek River and Liesbeek Canal
(collectively referred to as the site) for limited retail, commercial, residential, institutional and associated uses.
The development will include ~6 ha of high-quality landscaped public open space, and rehabilitation of
watercourses. Two layout alternatives are considered; they have the same floor area but differ regarding the
treatment of the Liesbeek River channel and location of Precinct 1 relative to the western boundary of the site.
A Socioeconomic Impact Assessment (SIA) of the proposed bypass road is one of the investigations
undertaken as part of the BA process for the project.

The River Club will comprise approximately 150 000 m² floor area of mixed-use development, including
~16 000 m2 retail space, ~80 000 m2 commercial office space, ~30 000 m2 residential space (including
~6 000 m2 inclusionary housing) and ~24 000 m2 for hotel, community and institutional uses. The development
will include ~6 ha of high-quality landscaped public open space, including rehabilitation of watercourses.

The River Club site is in a strategic location at the intersection of two motorways (M5 and N2) and main arteries
(Liesbeek Parkway and Voortrekker Road), less than 5 km from the Cape Town CBD and 15 km from the
Cape Town International Airport. The site also forms part of the TRUP, earmarked by local and provincial
government for the development of an integrated and inclusionary mixed-use area.

The River Club development delivers significant socioeconomic benefits in the form of investment in the
economy, increase in employment and increase in government revenue, as well as provision of publicly
accessible open space and commercial cross-subsidisation of public infrastructure and providing critical mass
for and catalysing further infrastructure provision and implementation of TRUP. The development will also
provide additional (inclusionary) housing and contribute further to a trend of rising property prices.

Negative socioeconomic impacts are primarily associated with the flipside of rising property prices, which can
lead to gentrification. Observatory is more exposed but less vulnerable to gentrification due to the River Club
development, whereas poorer neighbouring suburbs such as Woodstock, Salt River and Oude Molen are more
vulnerable but less exposed to the development.

The project will increase ‘busy-ness’ in the area, create a (vibrant) urban node and accessible higher-quality
safe open space system. The net impact of the above elements on quality of life in the area, and whether this
is perceived as positive or negative, will depend on personal values and preferences and likely differ for
residents in the area.

Socioeconomic impacts are not materially different for the two layout alternatives.

The CoCT has advised that electricity transmission infrastructure must be expanded for the River Club
development. Such expansions are characteristic of development in urban areas, and costs are typically
recouped through service charges over time.

The No-Go alternative implies that the River Club will continue to be operated as a commercial recreation and
conference facility, provided it remains financially viable. Certain trends identified in the study, such as
densification and an increase mixed-use development and property prices will continue without the River Club
development, albeit at a slower pace.

The River Club development is a large development and, cumulatively, expected to intensify and accelerate
existing development trends in the area, especially if it acts as a catalyst for the development of remaining
TRUP areas.

On balance, the socioeconomic benefits of the River Club development to the local and wider Cape Town
community are predicted to significantly outweigh negative socioeconomic impacts.

REUT/DALC                                 478320_River Club_Socioeconomic study_July19_Final                   July 2019
SRK Consulting: 478320 River Club Redevelopment Socioeconomic Study                                                                                        Page v

Table of Contents
1 Introduction .................................................................................................................. 1
    1.1     Background ......................................................................................................................................... 1
    1.2     Terms of Reference ............................................................................................................................ 1
2 Approach ....................................................................................................................... 2
    2.1     DEA&DP Guidelines ........................................................................................................................... 2
            2.1.1      Social Impact Assessment ...................................................................................................... 2
            2.1.2      Economic Impact Assessment ................................................................................................ 3
    2.2     Methodology........................................................................................................................................ 4
            2.2.1      Data Gathering ........................................................................................................................ 4
            2.2.2      Data Analysis .......................................................................................................................... 4
            2.2.3      Impact Assessment ................................................................................................................. 4
    2.3     Assumptions and Limitations .............................................................................................................. 5
3 Project Description....................................................................................................... 6
    3.1     Project Location .................................................................................................................................. 6
    3.2     Project Description .............................................................................................................................. 7
4 Socioeconomic Baseline ........................................................................................... 11
    4.1     Provincial and Metropolitan Context ................................................................................................. 11
            4.1.1      Performance and Structure of the Economy ......................................................................... 11
            4.1.2      Population ............................................................................................................................. 12
            4.1.3      Education .............................................................................................................................. 12
            4.1.4      Employment .......................................................................................................................... 13
            4.1.5      Income ................................................................................................................................... 14
    4.2     Socioeconomic Baseline: Project Area ............................................................................................. 14
            4.2.1      Population ............................................................................................................................. 16
            4.2.2      Socioeconomic Status Index ................................................................................................. 17
            4.2.3      Socioeconomic Analysis........................................................................................................ 18
            4.2.4      Socioeconomic Trends .......................................................................................................... 22
5 Impact Assessment .................................................................................................... 23
    5.1     Potential Impacts: Construction Phase ............................................................................................. 23
            5.1.1      Potential Impact SE1: Investment in the Economy Creating Wealth ....................................23
            5.1.2      Potential Impact SE2: Increased Employment, Income and Skills Development .................24
    5.2     Potential Impacts: Operational Phase............................................................................................... 26
            5.2.1      Potential Impact SE3: Increased Employment, Income and Skills Development .................27
            5.2.2      Potential Impact SE4: Increased State and Local Government Revenue ............................28
            5.2.3      Potential Impact SE5: Increase in Centrally Located Housing, Including Inclusionary
                       Housing ................................................................................................................................. 29
            5.2.4      Potential Impact SE6: Densification Facilitating Improved Connectivity, Transport Systems
                       and TRUP Implementation .................................................................................................... 32

REUT/DALC                                             478320_River Club_Socioeconomic study_July19_Final                                                   July 2019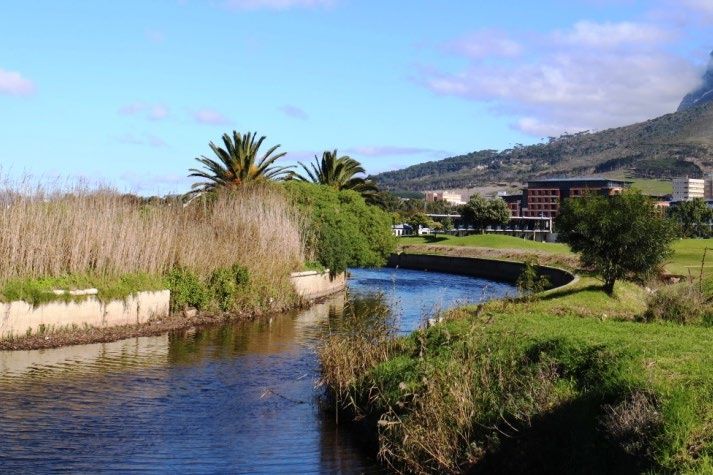
SRK Consulting: 478320 River Club Redevelopment Socioeconomic Study                                                                                        Page vi

            5.2.5      Potential Impact SE7: Loss of Private Open Space and Creation of New Publicly Accessible
                       Areas ..................................................................................................................................... 35
            5.2.6      Potential Impact SE8: Increase in Property Values in Surrounding Areas ...........................36
            5.2.7      Potential Impact SE9: Gentrification in Surrounding Residential Areas ...............................37
            5.2.8      Potential Impact SE10: Change in the Quality of Life in the Area ........................................39
            5.2.9      Potential Impact SE11: Pressure on Service Provision ........................................................40
    5.3     Cumulative Impacts........................................................................................................................... 41
            5.3.1      Introduction ............................................................................................................................ 41
            5.3.2      Cumulative Impacts Analysis ................................................................................................ 41
6 Findings and Conclusion........................................................................................... 42
    6.1     Findings ............................................................................................................................................. 42
    6.2     Conclusion ........................................................................................................................................ 46
7 References .................................................................................................................. 47

List of Tables
Table 3-1:        Development footprint .................................................................................................................. 8
Table 4-1:        Population Groups in the Western Cape and Cape Town .........................................................12
Table 4-2:        Education Levels of Working Age Population ............................................................................ 13
Table 4-3:        Annual household income in 2011 ............................................................................................. 14
Table 4-4:        Population data for the study area ............................................................................................. 17
Table 4-5:        SES indices for suburbs in study area (Census 2011) .............................................................. 18
Table 4-6:        Socioeconomic indicators for the study area ............................................................................. 18
Table 5-1:        Significance of investment in the economy creating wealth ......................................................24
Table 5-2:        Significance of increased employment, income and skills development ...................................26
Table 5-3:        Direct employment at the River Club development during operational phase...........................27
Table 5-4:        Significance of increased employment, income and skills development ...................................28
Table 5-5:        Significance of increased government revenue ......................................................................... 29
Table 5-6:        Significance of increase in centrally located housing, including inclusionary housing ..............32
Table 5-7:        Significance of densification facilitating improved connectivity, transport systems and TRUP
                  implementation ........................................................................................................................... 35
Table 5-8:        Significance of loss of private open space and creation of new publicly accessible open space
                  36
Table 5-9:        Significance of loss of (private) open space and creation of new (public) recreational
                  opportunities ............................................................................................................................... 37
Table 5-10:       Tenure status in Observatory (2011) ......................................................................................... 38
Table 5-11:       Average rental prices in Observatory......................................................................................... 38
Table 5-12:       Significance of gentrification in surrounding residential areas ...................................................38
Table 6-1:        Summary of impacts and mitigation / optimisation measures....................................................44

REUT/DALC                                              478320_River Club_Socioeconomic study_July19_Final                                                   July 2019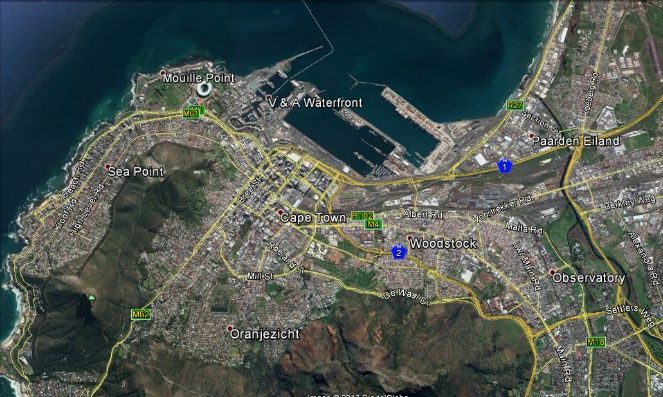
SRK Consulting: 478320 River Club Redevelopment Socioeconomic Study                                                                              Page vii

List of Figures
Figure 1-1:    Location of the project .................................................................................................................. 1
Figure 3-1:    Views of the site and surrounding areas ...................................................................................... 7
Figure 3-2:    River Club development alternatives 1 and 2 ............................................................................ 10
Figure 4-1:    Wards in Subcouncil 15 ............................................................................................................. 15
Figure 4-2:    Suburbs in study area ................................................................................................................ 16
Figure 5-1:    Average year-on-year house price growth by Cape Town sub-region ......................................30
Figure 5-2:    Sales trends for Observatory houses and apartments .............................................................. 30
Figure 5-3:    Location of new apartment blocks relative to the UDZ in Observatory ......................................31
Figure 5-4:    Location of the River Club site relative to TRUP and existing road linkages.............................34
Figure 5-5:    Location of business parks adjacent to the River Club .............................................................. 40

Appendices
Appendix A:       Curriculum Vitae

REUT/DALC                                        478320_River Club_Socioeconomic study_July19_Final                                               July 2019
SRK Consulting: 478320 River Club Redevelopment Socioeconomic Study                                Page viii

List of Abbreviations
    BA               Basic Assessment
    CBD              Central Business District
    DEA&DP           (Western Cape) Department of Environmental Affairs and Development Planning
    EIA              Environmental Impact Assessment
    GDP              Gross Domestic Product
    GDPR             Regional Gross Domestic Product
    HIV              Human Immunodeficiency Virus
    IDP              Integrated Development Plan
    LLPT             Liesbeek Leisure Properties Trust
    NEMA             National Environmental Management Act 107 of 1998, as amended
    NMT              Non-motorised transport
    PERO             Provincial Economic Review and Outlook
    PRASA            Passenger Rail Agency of South Africa
    S&EIR            Scoping and Environmental Impact Reporting
    SAAO             South African Astronomical Observatory
    SDF              Spatial Development Framework
    SES              Socioeconomic Status Index
    SIA              Socioeconomic Impact Assessment
    SRK              SRK Consulting (South Africa) (Pty) Ltd
    StatsSA          Statistics South Africa
    ToR              Terms of Reference
    TRUP             Two Rivers Urban Park
    UCT              University of Cape Town
    UDZ              Urban Development Zone
    WCG              Western Cape Government

REUT/DALC                                 478320_River Club_Socioeconomic study_July19_Final        July 2019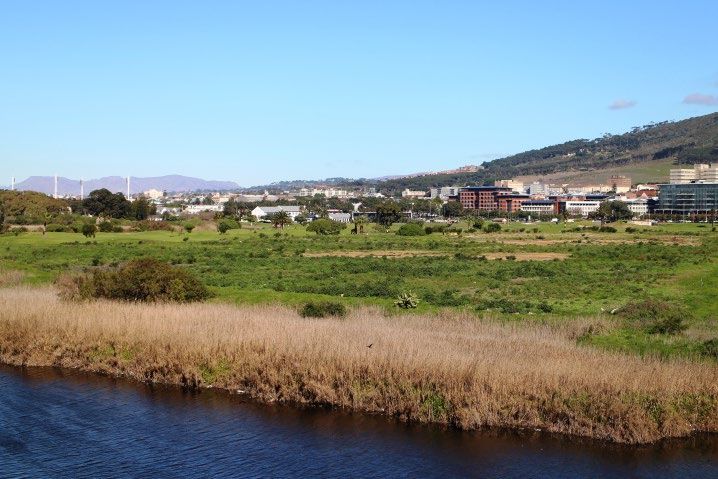
SRK Consulting: 478320 River Club Redevelopment Socioeconomic Study Page 1
1 Introduction
1.1 Background
The Liesbeek Leisure Properties Trust (LLPT) operates the River Club in Observatory, Cape Town
(see Figure 1-1). The site is currently operated as a commercial facility, mainly for recreational
(golfing) activities and conferencing. The LLPT is proposing to redevelop ~21 ha of the River Club
property and portions of adjacent properties, including portions of the original course of the Liesbeek
River and Liesbeek Canal (collectively referred to as the site 1) for limited retail, commercial, residential,
institutional and associated uses (the project).
The National Environmental Management Act 107 of 1998, as amended (NEMA), and the
Environmental Impact Assessment (EIA) Regulations, 2014 (promulgated in terms of NEMA) warrant
that listed activities require Environmental Authorisation (EA) from the competent authority, in this case
the Western Cape Department of Environmental Affairs and Development Planning (DEA&DP). A
Basic Assessment (BA) process is required to support an application for EA. SRK Consulting (South
Africa) (Pty) Ltd (SRK) has been appointed by LLPT to undertake the BA process required in terms of
the NEMA and the EIA Regulations, 2014.
A Socioeconomic Impact Assessment (SIA) of the proposed project is one of the investigations
undertaken for the BA process. An SIA includes the processes of analysing, monitoring and managing
the intended and unintended social consequences, both positive and negative, of planned
interventions (policies, programmes, plans, projects) and any social change processes invoked by
those interventions (Vanclay, 2003).
1.2 Terms of Reference
The primary aims of the study are to describe the socioeconomic baseline, assess the socioeconomic
impacts of the project and identify effective and practicable mitigation measures. More specifically, the
Terms of Reference for the study are as follows:
• Define the study area (the area potentially affected socially and / or economically by the proposed
redevelopment of the River Club);
• Describe the economic characteristics of the study area and place these in context, based on
existing public data;
• Identify the potential social and economic impacts (incl. benefits) associated with the proposed
redevelopment of the River Club;
• Assess the significance social and economic impacts of the project, including:
Creation of employment and income;
Potential impact on the local economy of the capital investment and ongoing government
revenue from the project; and
Potential impact on surrounding areas; and
• Recommend appropriate mitigation measures to minimise / reduce negative impacts and enhance
benefits.
1
The site comprises portions of thirteen properties. LLPT proposes to rezone Erf 151832 (the property that LLPT owns) from Open Space
Zoning 3 to Sub-Divisional Area Zoning, subdivide and develop the site in six main phases.
REUT/DALC 478320_River Club_Socioeconomic study_July19_Final July 2019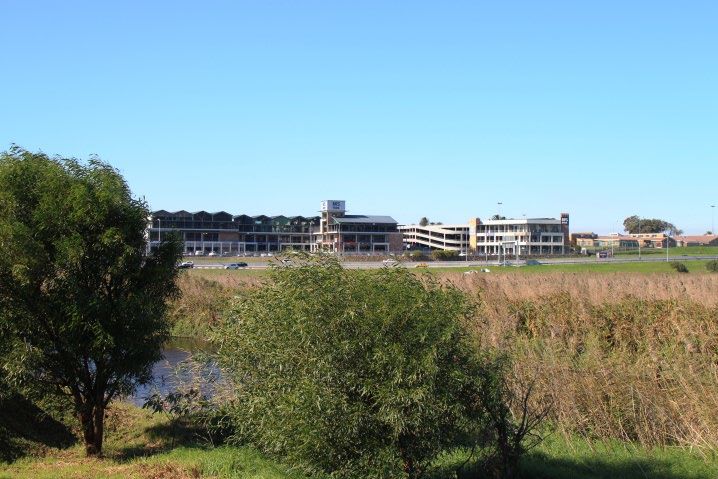
SRK Consulting: 478320 River Club Redevelopment Socioeconomic Study                                     Page 1

                                      River Club

                                                    RIVER CLUB REDEVELOPMENT SIA                Project No.
                                                                 Location of the project        478320/SE

Figure 1-1:       Location of the project

REUT/DALC                                  478320_River Club_Socioeconomic study_July19_Final           July 2019
SRK Consulting: 478320 River Club Redevelopment Socioeconomic Study Page 2
2 Approach
2.1 DEA&DP Guidelines
This study considers both social and economic impacts of the project. As such, guidelines pertaining
to both aspects of the study are summarised below.
2.1.1 Social Impact Assessment
The DEA&DP Guideline for Social Impact Assessment (Barbour, 2007) recommends the following
approach to SIA:
• Describe and obtain an understanding of the proposed intervention (type, scale, location), the
communities likely to be affected and determine the need and scope of the SIA;
• Collect baseline data on the current social environment and historical social trends;
• Identify and collect data on the social impact assessment variables and social change processes
related to the proposed intervention;
• Assess and document the significance of social impacts associated with the proposed
intervention; and
• Identify alternatives and mitigation measures.
The Guideline elaborates that a social study should seek to, amongst others:
• Assess the proposed development in terms of its fit with the relevant legislative, policy and
planning requirements;
• Identify and assess the factors that contribute to the overall quality of life (social wellbeing) of
people not just their standard of living;
• Identify and assess the needs of vulnerable, at risk, groups and/or ethnic minorities or indigenous
peoples;
• Clearly identify which individuals, groups, organisations and communities stand to benefit from the
proposed intervention and those that stand to be negatively affected. In so doing the assessment
must identify and emphasize vulnerable and underrepresented groups;
• Recognise that social, economic and biophysical systems and impacts are inextricably
interconnected, and identify and understand the impact pathways created when changes in one
domain trigger impacts across other domains;
• Acknowledge and incorporate local knowledge and experience into the assessment process; and
• Identify and assess developmental opportunities and not merely the mitigation of negative or
unintended outcomes.
The Guideline further identifies areas where social specialist input is particularly warranted, namely
areas:
• Where vulnerable communities are present;
• With high poverty and unemployment levels;
• Where access to services, mobility and community networks are affected;
• Where local livelihoods depend on access to and use of environmental resources and services;
• Of important tourism or recreation value; and
REUT/DALC 478320_River Club_Socioeconomic study_July19_Final July 2019SRK Consulting: 478320 River Club Redevelopment Socioeconomic Study Page 3
• Where the existing character and “sense of place” will be altered.
Many of these characteristics are not applicable to the area directly affected by the project, as poverty
and unemployment levels are generally low in the project area, and the project is not expected to
negatively affect access to services and community networks. However, others do pertain, e.g. sense
of place and recreation value, and the assessment includes consideration of these aspects.
2.1.2 Economic Impact Assessment
The DEA&DP Guideline for Involving Economists in EIA Processes (van Zyl et al, 2005) provides
indicators that could suggest the need for economic specialist input in projects that fulfil specific criteria
with regards to the nature of the:
• Receiving environment:
o Areas containing vulnerable communities;
o Areas where local livelihoods depend on environmental resources;
o Areas where ecosystems provide valuable services;
o Protected areas or areas with intact wilderness qualities, or pristine ecosystems; and
o Areas of important tourism or recreation value; and
• Project:
o Large, high intensity type projects (e.g. large infrastructure);
o Projects conceived because of their perceived strategic economic benefits (e.g. new roads,
industrial development areas, etc.);
o Projects requiring a large workforce relative to the size of the existing workforce in the area;
o Projects that are likely to change spending patterns in an area (e.g. a toll road in a rural area);
o A change in land use from the prevailing use; and
o A land use that is in conflict with an adopted plan or vision for the area.
Where required, the following key negative and positive issues may need to be addressed by the
specialist:
• Financial viability or justification for the project in the case of public sector projects that do not
require financial viability (e.g. roads, housing projects and other public infrastructure);
• Distortions that lead to financial viability, but are not to the benefit of wider society creating a false
‘viability’ when seen from a broader, economic, perspective;
• Environmental externalities that are not accounted for in economic costs and benefits;
• Degree of fit with economic development planning in the area (i.e. does the project complement
economic and spatial plans);
• Linkage effects that allow a project to generate added benefits in the form or employment,
incomes, and increased production; and
• Macro-economic risks (i.e. whether the project has the potential to change exchange rates, interest
rates or local factor and product prices, for large projects).
Social and economic impacts are closely related, which reflects in the similarity of criteria for projects
requiring economic and social assessment (see Section 2.1.1). Many of the criteria signalling a
sensitive receiving (socio-economic) environment or project do not apply to the proposed River Club
REUT/DALC 478320_River Club_Socioeconomic study_July19_Final July 2019SRK Consulting: 478320 River Club Redevelopment Socioeconomic Study Page 4
development, as the project is located within a relatively affluent urban environment. The proposed
project is in keeping with City of Cape Town (CoCT) general urban development policies for the
broader Cape Town Metropole and is largely congruent with prevailing surrounding land use. It does,
however, require a change in land use on the project site and does not fully align with current planning
frameworks for the area.
The project is a private development on privately owned land. LLPT has a track record of property
development, analysed the market, is confident that the project is commercially viable (as reflected in
the proposed mix of uses), and will phase in the development. This aspect is not investigated further.
The study thus focuses on socio-economic impacts related to project investment and employment and
discusses the likely implications of the project for surrounding communities.
2.2 Methodology
The following methodology was used to generate the baseline and impact assessment for the
socioeconomic specialist study.
2.2.1 Data Gathering
Literature, internet resources and previous studies relating to the socioeconomic environment of the
study area were reviewed to compile a baseline for the affected areas, including the potentially affected
community as well as the local (ward) and, where relevant, regional (metropolitan) context. Sources
included:
• Statistical data from Census 2011 and 2001 and the 2007 community survey;
• Provincial statistics;
• Relevant planning and policy frameworks for the area, such as Spatial Development Frameworks
(SDF) and Integrated Development Plans (IDP);
• Maps and aerial photographs of the area;
• Economic publications, such as the Provincial Economic Review and Outlook (PERO) for the
Western Cape; and
• Other published information on specific aspects relevant to this SIA.
Stakeholder submissions during prior phases of the EIA process also informed the study.
2.2.2 Data Analysis
The information was analysed to ascertain the socioeconomic conditions and characteristics of the
study area. Analysis involved the integration and comparison of data:
• From different sources for the same area, to derive a holistic picture of socioeconomic conditions
in any one area; and
• Across different timeframes to identify key trends.
The socioeconomic baseline environment is described in Chapter 4.
2.2.3 Impact Assessment
Potential socioeconomic impacts of the proposed project were identified based on the baseline data,
project description, review of other studies for similar projects and professional experience.
The significance of the socioeconomic impacts was assessed using the prescribed SRK impact rating
methodology described in Appendix A. It includes the rating of impact significance determined by
REUT/DALC 478320_River Club_Socioeconomic study_July19_Final July 2019SRK Consulting: 478320 River Club Redevelopment Socioeconomic Study Page 5
scale, duration, intensity and probability of an impact. This rating is then qualified with a confidence
rating. The alternatives were comparatively assessed and the preferred alternative indicated.
Mitigation measures for the reduction of the significance of negative impacts (and enhancement of
benefits) were identified and the impact significance re-rated assuming the effective implementation
of mitigation measures.
In this context it must be noted, specifically with regards to social impacts, that:
• Social impacts are not easily quantified and often need to be inferred rather than measured. A
combination of insight into social processes in general and knowledge of the community under
study is important to draw valid inferences;
• Social impacts are often multifaceted and inter-connected and therefore not easily disaggregated
into separate impacts;
• Communities are dynamic and in a continual process of change. The announcement of the
proposed redevelopment of the River Club project is one factor contributing to such change, but
it is often difficult to identify when an impact is attributable to the project or to other factors, such
as the Two Rivers Urban Park (TRUP - see Section 3.2) proposals (or a combination thereof);
and
• Human beings are naturally continuously adapting to changes in their environment, including
project impacts. As such, these impacts change in significance for those affected.
2.3 Assumptions and Limitations
As is standard practice, the study is based on a number of assumptions and is subject to certain
limitations, which should be borne in mind when considering information presented in this report. The
validity of the findings of the study is not expected to be affected by these assumptions and limitations:
• The assessment is based on technical information supplied to SRK, which is assumed to be
accurate. This includes the proposed locations, dimensions and drawings of the project / route
alternatives;
• This study does not motivate for or against the project, but rather seeks to give insight into the
socioeconomic character of the area and the significance of the anticipated socioeconomic
impacts created by the project. In the event that unacceptable social impacts are identified, this is
clearly indicated in the report;
• The report is based largely on secondary data gathered during a desktop analysis. Primary field
work (other than a site inspection) and socioeconomic surveys were not conducted for this study,
as the existing data was deemed sufficient;
• This report depends on the accuracy of secondary data, such as Statistics South Africa Census
Data; and
• It is assumed that no significant developments or changes in the socioeconomic characteristics
will take place in the area of influence between data collection and submission of the report.
Other assumptions made in the report are explicitly stated in the relevant sections.
REUT/DALC 478320_River Club_Socioeconomic study_July19_Final July 2019SRK Consulting: 478320 River Club Redevelopment Socioeconomic Study Page 6
3 Project Description
The project description provides a summary of the more comprehensive description in the BA Report
and focuses on socioeconomic aspects of the development.
3.1 Project Location
The site is located in the suburb of Observatory in Cape Town (see Figure 4-2). The site is bordered
to the west and north-west by the (former) natural channel of the Liesbeek River (the original course
of the Liesbeek River) and Liesbeek Parkway (road), with sports fields (Malta Park) and the Black
River Park commercial development located beyond. A railway line, light industry and the residential
areas of Observatory and Salt River are located further west.
The Liesbeek River Canal and the Black River form the eastern boundary of the site. Raapenberg Bird
Sanctuary Nature Reserve on the banks of the Black River is located to the immediate east of the
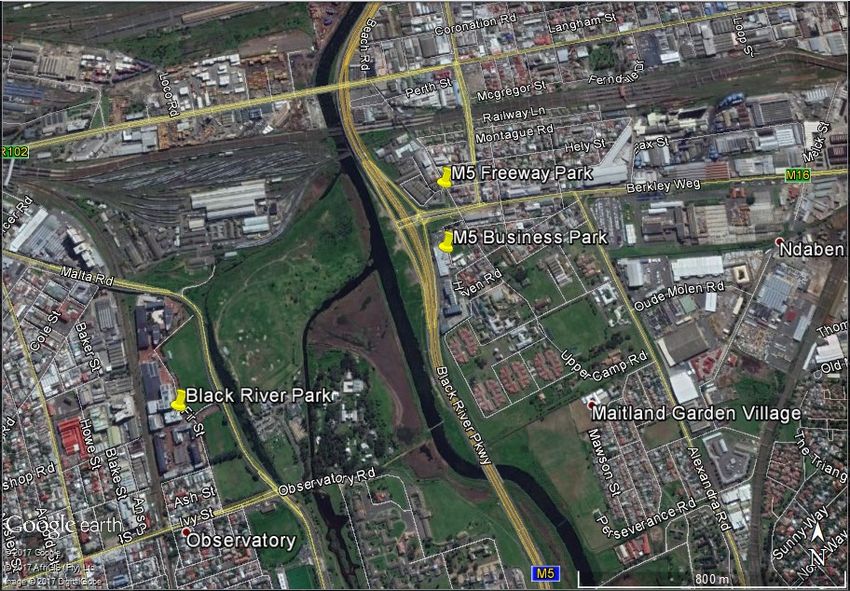
Liesbeek River Canal. The M5 runs parallel to the site east of the Black River. The Maitland and
Ndabeni industrial areas, a commercial development (M5 Park), Alexandra Hospital and Maitland
Garden Village are located further east of the M5.
The South African Astronomical Observatory (SAAO), a Grade 1A Heritage Site, is situated on a low
ridgeline immediately east of the southern portion of the site and the Liesbeek River Canal. The
Valkenberg Hospital Complex is situated south-east of the site and south of the Observatory.
The PRASA rail yard is located immediately north of the site, with related industrial activities further
north.
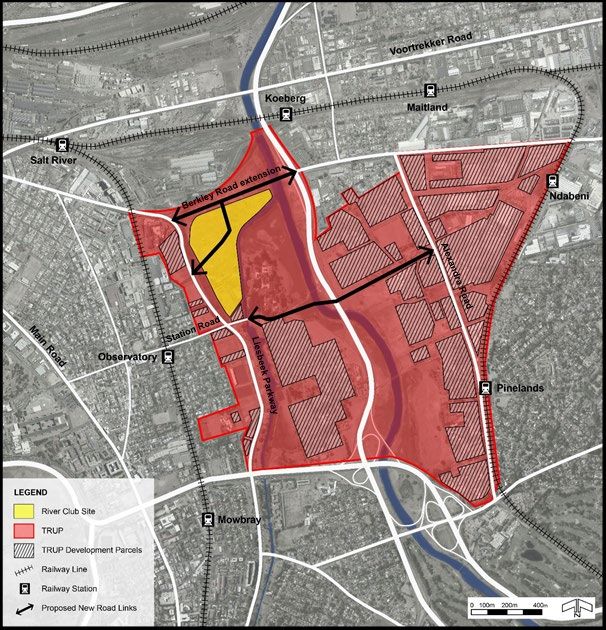
The site is very accessible and less than 5 km from the Cape Town Central Business District (CBD),
in close proximity to agglomerated places of work in the CBD and Paarden Eiland and within relatively
close proximity of the metropolitan south-east. The site also falls within the north-western portion of
the TRUP.
The site is currently predominantly used as a commercial recreational enterprise comprising a golf
driving range and a “mashie” 9-hole golf course in the north-east of the site, conference and function
venue, restaurant and bar. A bird hide is located on the site, which overlooks the new Liesbeek River
channel and its confluence with the Black River. The River Club building (the main building), built in
1939, has been converted into a recreational and conference facility. A number of surrounding
buildings on the property are rented to businesses for commercial use.
Liesbeek Parkway (south), Albert Road (north-west) and Station Road (west) provide access to the
site, and the main vehicular access to the River Club is from the south off Observatory Road. Although
the M5 runs almost parallel to the eastern boundary of the site, access from the M5 is not possible.
REUT/DALC 478320_River Club_Socioeconomic study_July19_Final July 2019SRK Consulting: 478320 River Club Redevelopment Socioeconomic Study Page 7
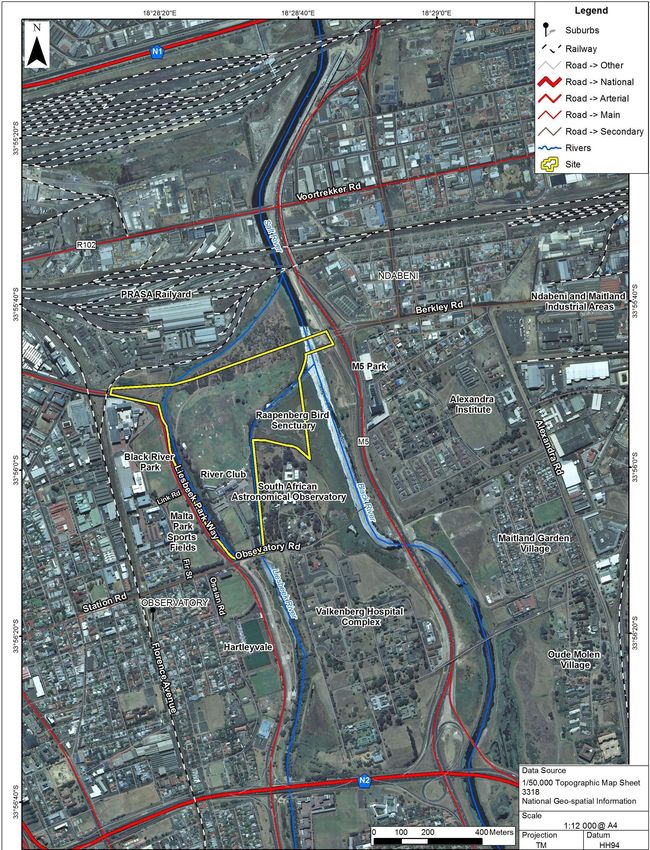
Black River and vacant PRASA land Liesbeek Parkway (right), Liesbeek “Lake” and River Club (left).
Malta Sports Fields (foreground) and Black River Park Development Liesbeek Canal, Raapenberg Wetland (left) and River Club (right)
Black River, M5, and M5 Park Raapenberg Wetland (foreground) and Observatory Hill (background)
RIVER CLUB REDEVELOPMENT SIA Project No.
Views of the site and surrounding areas 478320/SE
Figure 3-1: Views of the site and surrounding areas
3.2 Project Description
The LLPT owns the River Club in Observatory, Cape Town. The LLPT operate the River Club as a
commercial facility, mainly for recreational (golfing) activities and conferencing. The LLPT is proposing
to redevelop ~21 ha of the River Club property and portions of adjacent properties, (the site) for limited
retail, commercial, residential, institutional and associated uses (see Table 3-1).
REUT/DALC 478320_River Club_Socioeconomic study_July19_Final July 2019SRK Consulting: 478320 River Club Redevelopment Socioeconomic Study Page 8
The LLPT aim to develop the site as a “destination place” within Cape Town and as the western
gateway to the TRUP, accommodating a medium to high density, mixed-use agglomeration of uses
which supports the vision of ‘live, work, play’, while retaining certain recreational and ecological
aspects. In this way, the proponents hope that River Club can act as a catalyst project to help to
implement the greater TRUP.
Table 3-1: Development footprint
Development Component Footprint % of development
Retail, commercial, residential, institutional and associated development ~4.5 ha 22%
Hard landscaping (including covered pedestrian space, foot and cycle paths, ~4 ha 19%
and service infrastructure)
Roads, bridges and surface parking ~3.2 ha 16%
Soft landscaping / Open space / Rehabilitated watercourses ~9.3 ha 45%
Total 21 ha 100%
The River Club will comprise approximately 150 000 m² floor area of mixed-use development,
including ~16 000 m2 retail space, ~80 000 m2 commercial office space, ~30 000 m2 residential space
(including ~6 000 m2 inclusionary housing) and ~24 000 m2 for hotel, community and institutional uses.
Development will occur in two precincts:
• Precinct 1, located in the southern portion of the site, provides ~65 000 m² of mixed-use floor
space in buildings 4-9 storeys high; and
• Precinct 2, located in the northern portion of the site, provides ~85 000 m² of mixed-use floor space
in buildings 10-12 storeys high.
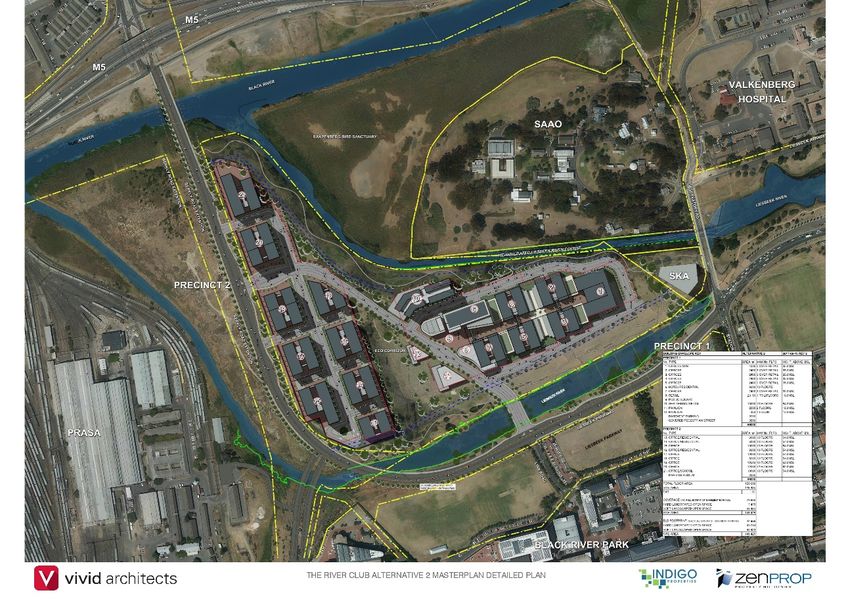
Two layout alternatives are considered in the impact assessment (see Figure 3-2). The alternatives
are the same as regards floor area and land use, but differ as follows:
• For layout alternative 1, the old Liesbeek River channel on the western site boundary will be
infilled, leaving only a narrow vegetated stormwater swale along its existing course. Precinct 1 will
be located closer to the western site boundary; and
• For layout alternative 2, the old Liesbeek River channel on the western site boundary will be
retained, and Precinct 1 will be located closer to the eastern site boundary and the Liesbeek canal
(and SAAO).
Different types of land uses envisaged for the development are as follows:
• Commercial space comprising offices catering for a range of services, such as financial services,
sales and marketing;
• Retail areas focused around a lifestyle / health and sports theme anchored by convenience food
retailers. The balance of the retail offering will consist of typical line shops as well restaurants,
food and beverage outlets and a gym;
• Residential units consisting of studio, one-bedroom and two-bedroom units with an average floor
space of between 47 m2 and 77 m2. LPT proposes that 20% of the total floor area (~30 000 m2)
will be assigned for residential use.
It is anticipated that the target market will be households earning more than R18 000 per month.
However, 20% (~6 000 m2) of residential floor space will be allocated for inclusionary housing.
These units will, as far as possible, be integrated into the same block(s) of apartments as other
residential units. LLPT will be offering these units below their market rental value. For the purpose
REUT/DALC 478320_River Club_Socioeconomic study_July19_Final July 2019SRK Consulting: 478320 River Club Redevelopment Socioeconomic Study Page 9
of this study, it is assumed that the development will entail at least 600 units (at an average floor
space of 50 m2), of which at least 120 units will be inclusionary.
A ~100-150 room hotel is being considered. It is anticipated that the hotel may serve both
business and leisure travellers.
• Associated uses can also be considered, such as community facilities and schools. A cultural,
educational, environmental and heritage center is also proposed.
No manufacturing is proposed, i.e. no noxious or industrial facilities will be developed, and there will
be no industrial emissions or industrial effluent emanating from the site.
The LLPT intends to retain ownership of the entire development, although portions may be sold off.
REUT/DALC 478320_River Club_Socioeconomic study_July19_Final July 2019SRK Consulting: 478320 River Club Redevelopment Socioeconomic Study Page 10
Precinct 1
Precinct 2
River Club Development Alternative 1 – Precinct 1 shifted marginally south towards Black River Park
Precinct 1
Precinct 2
River Club Development Alternative 2 – Precinct 1 shifted marginally north towards SAAO
RIVER CLUB REDEVELOPMENT SIA Project No.
River Club development alternatives 1 and 2 478320/SE
Figure 3-2: River Club development alternatives 1 and 2
REUT/DALC 478320_River Club_Socioeconomic study_July19_Final July 2019SRK Consulting: 478320 River Club Redevelopment Socioeconomic Study Page 11
4 Socioeconomic Baseline
This chapter provides an overview of the provincial and metropolitan socioeconomic baseline to
provide context for the more focused baseline of Subcouncil 15 (in which the River Club is located),
which follows thereafter.
4.1 Provincial and Metropolitan Context
The physical characteristics of the Western Cape support a diverse provincial economy. The shoreline
provides an important fishing industry. Varying geographic and climatic zones, ranging from winter
rainfall areas suitable for intensive farming (such as for citrus and viticulture) to the arid conditions of
the Karoo and Namaqualand only suitable for extensive livestock farming, allows for agricultural
diversity. These characteristics also contribute to a sizable and developed tourism sector that attracts
national and international visitors.
Although the Western Cape is not recognised as an industrial hub, a number of industries make
significant contributions to the economy. These include a sophisticated developed agro-processing
sector, some heavy industry (metal and chemical) and, to a lesser and declining extent, the clothing
and textiles sector. The large service sector is the biggest contributor to the economy of the Western
Cape.
Cape Town is one of Africa’s most dynamic and developed metropolitan areas. It benefits from its
strategic and spectacular location on the tip of Africa and at the foot of Table Mountain, recently voted
as one of the world’s new seven wonders of nature. One of the Province’s two deep sea ports as well
the international airport are located in the Cape Town, facilitating both domestic and international trade
and travel to and through the City.
4.1.1 Performance and Structure of the Economy
The economy of the Western Cape has outperformed the national economy since 2010 (StatsSA,
2014) and contributed more than 13% to national GDP, exceeding its share of national population and
land mass (both ~11%). The historically better performance by the Western Cape economy stems
from both the structure and source of its economic activity (PERO, 2014): the tertiary sector makes up
a greater proportion of the Western Cape economy (67% of Western Cape Regional GDP (GDPR) in
2013) and has outperformed primary and secondary sector industries.
After contracting in 2009, GDPR accelerated to an annual rate of 3.9% in 2011. Economic growth in
the Western Cape then slowed to 2.9% in 2012 and has largely mirrored national growth since then
(PERO, 2014). Western Cape GDPR reached R391.6 billion in 2015 (WCG, 2016).
The performance of the CoCT metropolitan area largely mirrors that of the Province, as it generates
more than 71% of the Western Cape’s GDPR (WCG, 2016a) with 64% of the Province’s population.
It is the second-largest metropolitan economy in South Africa, after the City of Johannesburg. On
average, in the last 15 years, the variation between the City’s GDP growth rate and the provincial rate
was ~0.5% (CoCT, 2013c). Cape Town’s GDP amounted to R283.28 billion in 2015 (WCG, 2016),
while GDPR per capita was R76 420 in 2014 (up 14% from R67 010 in 2004) (CoCT, 2016).
The most important sectoral contributors to the Western Cape Economy in terms GDPR are finance,
real estate and business services (of which the River Club development would form a component)
(~30% of total value added); wholesale, retail and trade, catering and accommodation (~16% of total
value added); and manufacturing (~16% of total value added) (StatsSA, 2014). Although it contributes
a relatively small portion of GDPR, the wide diversity of products produced by the agriculture, forestry
and fishing industries are important to the Western Cape economy.
REUT/DALC 478320_River Club_Socioeconomic study_July19_Final July 2019SRK Consulting: 478320 River Club Redevelopment Socioeconomic Study Page 12
The CoCT contributes 80% of the Western Cape’s finance and business services, more than 70% of
wholesale and retail trade and about 70% of manufacturing (CoCT, 2013c).
Income, household consumption and growth in real consumer spending is expected to remain under
pressure nationally in the short to medium term, as inflation, interest rates, subdued employment and
credit growth weigh on household income. This poses a particular challenge to the tertiary sector,
which dominates the Western Cape economy, as a slowdown in consumer spending will reduce
demand for services (PERO, 2014). However, the Western Cape is less exposed to the mining sector
than the national economy, and the fluctuations in commodity prices.
4.1.2 Population
The Western Cape has a population of ~6.1 million people, which is ~11% of the national population
(StatsSA, 2014c). Almost 3.9 million people live in the Cape Town Metropolitan area, comprising 63%
of the provincial population (CoCT, 2014). The population structure of both the Western Cape and the
CoCT broadly mirrors the national population structure: ~25% are younger than 15 years, ~69% of the
population is of working age (15 – 64 years old) and ~6% are over the age of 64 years (StatsSA, 2014b
and CoCT, 2014). The proportion of working-age population in the CoCT and the Western Cape
Province is slightly higher than South Africa as a whole.
The provincial and metropolitan populations grew on average by 2.3% per annum between 2001 and
2014 (CoCT, 2014), compared to a 1.6% average annual growth rate in the national population
(Census, 2001 and Census, 2011). Cape Town’s population grew by 29% between 2001 and 2011.
Higher population growth in the Western Cape and the CoCT can (at least partly) be ascribed to in-
migration, i.e. people from other provinces drawn to the Western Cape in the hope of finding
employment and better opportunities (PERO, 2014) or a better lifestyle. Approximately one third of
migrants came from the Eastern Cape, followed by foreign arrivals (~20%) and arrivals from Gauteng
(~12%). As a result, the Black African population group has increased fastest over the last decade
(see Table 4-1).The Western Cape had a net in-migration of just over 150 000 people between 2006
and 2011 (StatsSA, 2014c). The population is projected to continue growing 7.36 million people in
2040 (WCG, 2014a).
Table 4-1: Population Groups in the Western Cape and Cape Town
Western Cape Cape Town
Population group
Population Growth 2001-11 Population Growth 2001-11
Black African 1 912 547 58% 1 444 939 58%
Coloured 2 840 404 16% 1 585 286 14%
Indian or Asian 60 761 34% 51 786 25%
White 915 053 10% 585 831 8%
Other* 93 969 - 72 184 -
Total 5 822 734 3 740 026 29%
Source: Census 2011 and Census 2001
Note: * Not a category reported in the 2011 Census
4.1.3 Education
Education levels of the working age population in the CoCT (44% have Grade 12 or higher education)
are better than those for the Western Cape Province (39% with Grade 12 or better and 2% without
education). Nevertheless, the majority of the working age population at all levels does not have matric
education (see Table 4-2).
REUT/DALC 478320_River Club_Socioeconomic study_July19_Final July 2019SRK Consulting: 478320 River Club Redevelopment Socioeconomic Study Page 13
Table 4-2: Education Levels of Working Age Population
% of working Age Population
Education level
South Africa Western Cape Cape Town
No education 6% 2% 1%
Grades 0 -8 23% 24% 19%
Grades 9 - 11 31% 32% 33%
Grade 12 27% 26% 28%
Diploma / certificate 8% 8% 10%
Degree 4% 5% 6%
Source: Census 2011
The Western Cape (and national) government has invested in technology and higher education. The
objective of this strategy is to create the skills required to meet the demand for qualified and skilled
workers (WESGRO, 2011).
4.1.4 Employment
Of the ~6.1 million people in the Western Cape, ~4.2 million people are of working age (15 – 64 years)
(PERO, 2014). Of these, 64% (or ~2.9 million people) are in the labour force (employed or actively
seeking employment), while ~8% (340 000 people) are discouraged work seekers 2. Approximately
23% (675 000 people) of the provincial labour force was unemployed in 2014 (PERO, 2014).
Of the ~3.7 million people living in the City (in 2011), ~2.6 million people were of working age. Of
these, 65% (or ~1.7 million people) were in the labour force, while 3% were discouraged work seekers.
Approximately 24% of Cape Town’s labour force was unemployed in 2011 (Census 2011), closely
mirroring provincial patterns. Employment growth has averaged 1.5% per annum from 2010 to 2015,
below the Provincial employment growth rate of 1.9% over the same period and down from 2.1% in
Cape Town from 2005 – 2010. Approximately 268 500 net jobs have been created in the CoCT since
2005 (WCG, 2016).
Following the recession and global financial crisis, the unemployment rate increased in South Africa.
The provincial unemployment rate grew by an average of 5.6% annually between 2009 and 2014
(higher than the national average of 3.5% - partly as a result of in-migration of unemployed people to
the Western Cape). However, in the Western Cape, the number of employed people has increased at
a faster rate than the national average (PERO, 2015) indicating that although unemployment is rising,
additional jobs are being created in the Province.
The wholesale and retail trade sector was the largest employer in the Western Cape in 2014 (21.5%),
followed by general government services (21.4%), finance, real estate and business services (16.7%)
and manufacturing (13.2%) (StatsSA, 2014b and StatsSA, 2010).
Employment in the CoCT is expected to largely mirror provincial employment patterns, with slightly
lower numbers of the metropolitan population employed in the primary sector than in rural areas.
2 The Western Cape differs substantially from most other provinces in that the non-searching unemployed (also
referred to as discouraged work seekers) account for ~8% of the working-age population, compared to nearly
32% nationally (PERO, 2014). A number of factors explain this difference, including the Province’s relatively
high level of urbanisation, the City of Cape Town’s dominance within the provincial labour market and different
patterns of educational attainment (PERO, 2014).
REUT/DALC 478320_River Club_Socioeconomic study_July19_Final July 2019SRK Consulting: 478320 River Club Redevelopment Socioeconomic Study Page 14
4.1.5 Income
Both the Western Cape and the City of Cape Town have a smaller proportion of households earning
very low incomes and a larger proportion of households earning higher incomes than the national
average. Nevertheless (in 2011), more than half of the households the Western Cape (65%) and the
City (61%) had a monthly income of less than ~R6 366 (or R76 400 per annum) (see Table 4-3).
Table 4-3: Annual household income in 2011
% of the households in:
Annual income
South Africa Western Cape CoCT
No income 15% 13% 14%
R1 – R38 200 48% 36% 33%
R38 201 – R76 400 13% 16% 14%
R76 401 – R307 600 16% 24% 25%
R307 601 – R614 400 5% 7% 9%
R614 401+ 3% 4% 5%
Source: Census 2011
The GDPR per capita in the Western Cape was estimated at R43 557 in 2011 (2005 prices) compared
to R49 647 for Cape Town (CoCT, 2014). This placed the CoCT third - after Tshwane and
Johannesburg - in terms of per capita GDPR in the country’s six metros. The level of poverty 3
decreased in the Western Cape Province and the CoCT by 4.6% and 4.2% respectively between 2001
and 2010 (CoCT, 2014).
4.2 Socioeconomic Baseline: Project Area
The CoCT is divided into eight planning districts and 24 subcouncils. Subcouncils are divided into 111
smaller administrative wards, which may contain several suburbs.
The site is situated in the Table Bay District and Subcouncil 15 of the CoCT. Subcouncil 15 is divided
into Wards 51, 52, 53, 55, 56 and 57 (see Figure 4-1). The site is located in Ward 57.
3 Poverty income is defined as the minimum monthly income needed to sustain a household and varies
according to household size. The monthly income needed to keep a one person household out of poverty was
estimated in 2010 to be R1 315; for a two person household R1 626; four person household R2 544; and eight
or more person R4 729.
REUT/DALC 478320_River Club_Socioeconomic study_July19_Final July 2019You can also read