Adelaide: Student Accommodation Demand and Supply Analysis - Prepared for the Government of South Australia - Department of State Development
←
→
Page content transcription
If your browser does not render page correctly, please read the page content below
May 2016

Adelaide: Student Accommodation
Demand and Supply Analysis
Prepared for the Government of South Australia – Department of State
Development

   COPYRIGHT © JONES LANG LASALLE IP, INC. 2016. All Rights Reserved
                                                                       Page | i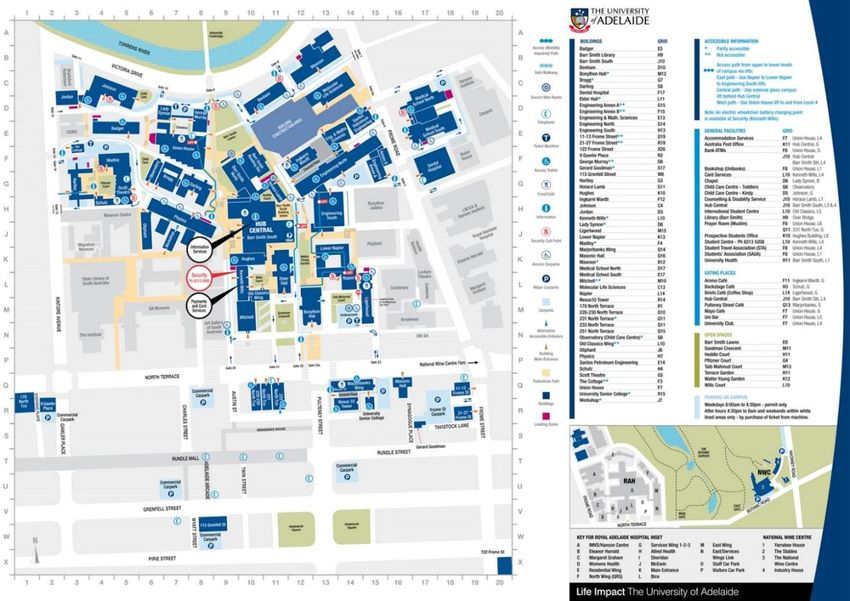
List of Contents
Executive Summary........................................................................................................................................vii
1 Introduction ................................................................................................................................................12
2 Adelaide Overview .....................................................................................................................................13
2.1 Overview .............................................................................................................................................13
2.1 Demographics .....................................................................................................................................14
2.2 Adelaide Student Demographics Summary ........................................................................................14
3 Adelaide Universities Overview ...............................................................................................................15
3.1 University of South Australia ...............................................................................................................15
3.2 University of South Australia – City East and West Campuses .........................................................17
3.3 University of South Australia – Mawson Lakes Campus ....................................................................21
3.4 University of Adelaide .........................................................................................................................24
3.5 University of Adelaide – North Terrace Campus ................................................................................26
3.6 Flinders University ..............................................................................................................................29
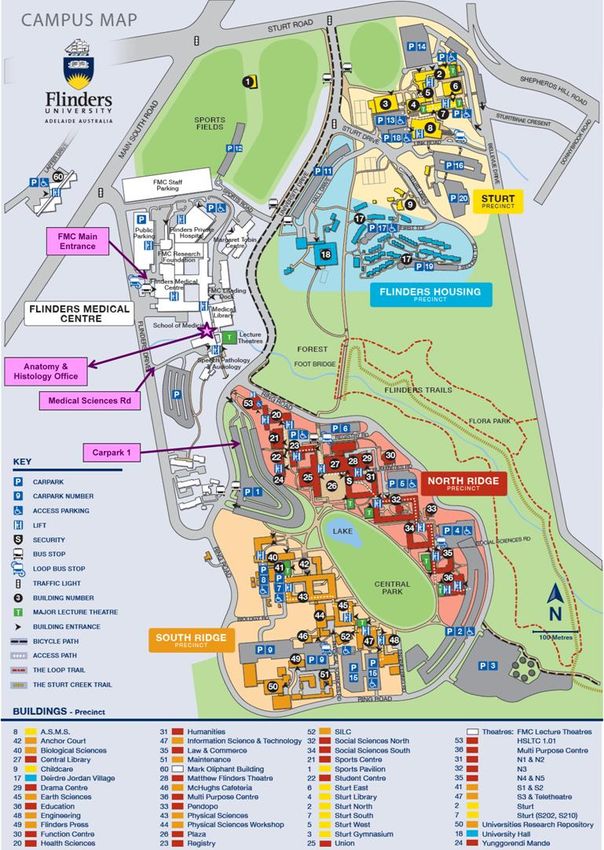
3.7 Flinders University – Bedford Park Campus .......................................................................................30
3.8 Full-time Student Trends 2010 – 2014 ...............................................................................................34
4 Supply Considerations – Adelaide CBD .................................................................................................36
4.1 Types of Accommodation – Where do students live? ........................................................................36
4.2 Residential Colleges / University Accommodation .............................................................................36
4.3 Other PBSA and Other Housing Options ...........................................................................................37
4.4 Existing Student Accommodation .......................................................................................................38
4.5 Pricing .................................................................................................................................................39
5 Supply Considerations – Mawson Lakes ................................................................................................42
5.1 Types of Accommodation – Where do students live? ........................................................................42
5.2 University Accommodation .................................................................................................................42
5.3 Other PBSA and Other Housing Options ...........................................................................................42
5.4 Existing Student Accommodation .......................................................................................................42
5.5 Pricing .................................................................................................................................................43
6 Supply Considerations – Bedford Park ...................................................................................................44
6.1 Types of Accommodation – Where do students live? ........................................................................44
6.2 University Accommodation .................................................................................................................44
6.3 Other PBSA and Other Housing Options ...........................................................................................44
6.4 Existing Student Accommodation .......................................................................................................45
6.5 Pricing .................................................................................................................................................45
7 Adelaide Rental Market Overview ............................................................................................................46
7.1 Adelaide CBD and North Adelaide Rental Market ..............................................................................46
7.2 Mawson Lakes and Surrounding Suburbs Rental Market ..................................................................49
COPYRIGHT © JONES LANG LASALLE IP, INC. 2016. All Rights Reserved Page | i
Page | i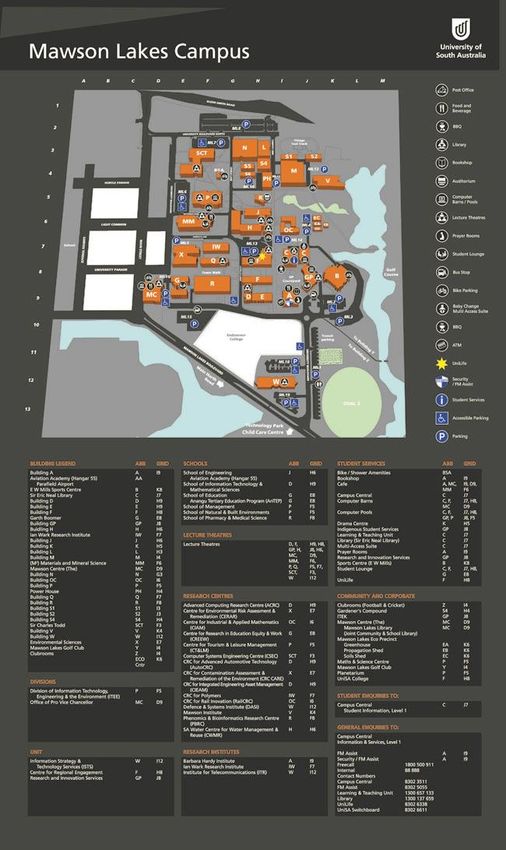
The Government of South Australia, Department of State Development: Student Accommodation Demand Study

    7.3     Bedford Park and Surrounding Suburbs Rental Market .....................................................................52
    7.4     Student Preferences ...........................................................................................................................55
8 Occupancy Rates in PBSA .......................................................................................................................61
9 Development Pipeline ...............................................................................................................................62
10 Top Ten Private Operators .......................................................................................................................63
11 University Benchmark Profiles ................................................................................................................65
    11.1 Existing Supply of Accommodation – Adelaide Universities ..............................................................65
12 PBSA Demand ...........................................................................................................................................66
    12.1 Current and Future Demand Levels ...................................................................................................66
    12.2 Initial Demand Forecasts ....................................................................................................................66
    12.3 Summary of initial demand forecasting ..............................................................................................72
    12.4 Gap analysis forecast .........................................................................................................................72
    12.5 Aspirational Forecasts ........................................................................................................................79
13 Key Constraints for the Development of Additional PBSA in Adelaide ..............................................81
14 Options to deliver accommodation at $200-$250 per week ..................................................................84
    14.1 Overview .............................................................................................................................................84
    14.2 University Participation .......................................................................................................................84
    14.3 Major mixed use developments ..........................................................................................................84
    14.4 Tax incentives .....................................................................................................................................85
    14.5 Planning policy and guidance - examples ..........................................................................................86
    14.6 Planning legislation in the UK .............................................................................................................88
    14.7 Specific tenancy legislation for students .............................................................................................89
    14.8 Private accommodation to suit the student market.............................................................................90
    14.9 Student Accommodation Providers Accreditation ..............................................................................90
    14.10        Accreditation of Letting Agents .....................................................................................................93

       COPYRIGHT © JONES LANG LASALLE IP, INC. 2016. All Rights Reserved                                                                                Page | ii
The Government of South Australia, Department of State Development: Student Accommodation Demand Study

List of Tables
Table 1: Summary of Full Time Students in Adelaide, 2014 ....................................................................................... 14
Table 2: University of South Australia, Number of Student Enrolments, 2014 .............................................................. 15
Table 3: Breakdown of International Students by Campus ........................................................................................ 16
Table 4: University of South Australia, Top Countries of Origin 2015 .......................................................................... 16
Table 5: University of South Australia – City East and West Campus Country of Origin Trends ..................................... 20
Table 6: University of South Australia – Mawson Lakes Country of Origin Trends ........................................................ 23
Table 7: University of Adelaide, Number of Student Enrolments, 2014 ........................................................................ 24
Table 8: University of Adelaide, Top Countries of Origin 2014 ................................................................................... 25
Table 9: University of Adelaide – North Terrace Campus Country of Origin Trends ...................................................... 28
Table 10: Flinders University, Number of Student Enrolments, 2014 ........................................................................... 29
Table 11: Flinders University – Bedford Park Campus Country of Origin Trends .......................................................... 33
Table 12: Adelaide CBD and North Adelaide Supply Analysis .................................................................................... 38
Table 13: Summary of University Accommodation & Residential Colleges Rents at Adelaide CBD & North Adelaide, 2016. 39
Table 14: Summary of existing self-catered PBSA Rents in proximity of Adelaide CBD and North Adelaide, 2016 ............ 40
Table 15: UniSA Mawson Lakes Campus Supply Analysis ........................................................................................ 43
Table 16: Summary of existing PBSA Rents in proximity to UniSA Mawson Lakes, 2016 ............................................... 43
Table 17: Bedford Park Supply Analysis ................................................................................................................. 45
Table 18: Summary of existing University Accommodation Rents at Flinders University Bedford Park Campus, 2016....... 45
Table 19: Adelaide CBD and North Adelaide Market Attributes, 2011 .......................................................................... 47
Table 20: Adelaide CBD and North Adelaide Suburb Profiles, December 2015 ............................................................. 47
Table 21: Adelaide CBD and North Adelaide Rental Analysis ..................................................................................... 48
Table 22: Mawson Lakes Statistics ........................................................................................................................ 50
Table 23: Mawson Lakes Rental Analysis ............................................................................................................... 51
Table 24: Bedford Park Statistics ........................................................................................................................... 53
Table 25: Bedford Park Rental Analysis .................................................................................................................. 54
Table 26: Summary of Local Government Areas based on University Location ............................................................ 55
Table 27: Summary of Commercial Accommodation Providers .................................................................................. 63
Table 28: Summary of Adelaide Universities Existing Student Accommodation Analysis .............................................. 65
Table 29: Summary of Comparable Universities Existing Student Accommodation Analysis ......................................... 65
Table 30: Forecast demand propensity for PBSA ..................................................................................................... 66
Table 31: Forecast enrolment growth table ............................................................................................................. 67
Table 32: Demand Projection Analysis – Adelaide CBD University Campuses ............................................................. 68
Table 33: Demand Projection Analysis – The University of South Australia Mawson Lakes Campus ............................... 69
Table 34: Demand Projection Analysis – Flinders University Bedford Park Campus ..................................................... 70
Table 35: Low Propensity Forecast Summary – Full-time Students per Bed ................................................................ 71
Table 36: Mid Propensity Forecast Summary .......................................................................................................... 71
Table 37: High Propensity Forecast Summary ........................................................................................................ 72
Table 38: Supply Gap Analysis – Adelaide CBD Campuses ....................................................................................... 73

        COPYRIGHT © JONES LANG LASALLE IP, INC. 2016. All Rights Reserved                                                                              Page | iii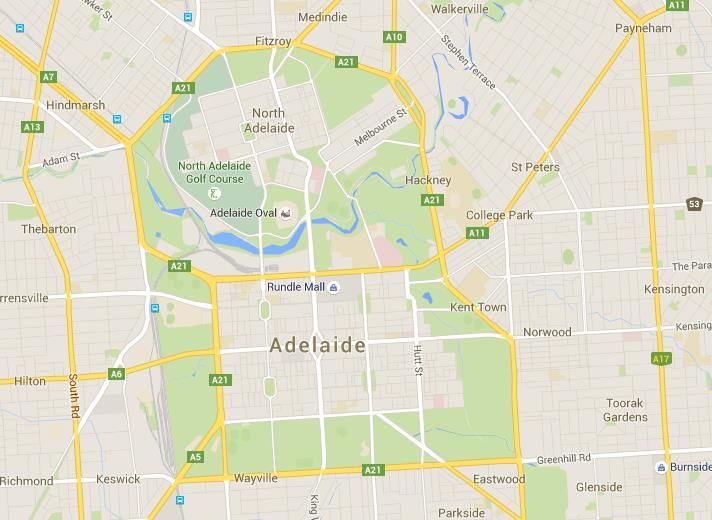
The Government of South Australia, Department of State Development: Student Accommodation Demand Study

Table 39: Supply Gap Analysis –University of South Australia Mawson Lakes Campus ................................................ 74
Table 40: Supply Gap Analysis – Flinders University Bedford Park Campus ................................................................ 75
Table 41: Supply Gap Analysis – Total Universities .................................................................................................. 76
Table 42: Demand Projection Analysis – Aspirational Growth in International Students and High Propensity .................. 80
Table 43: Land Tax Comparisons, Mainland States, 2016 .......................................................................................... 83
Table 44: Qualmark Star Grade Definitions ............................................................................................................. 91
Table 45: Qualmark Assessment Criteria ................................................................................................................ 91

       COPYRIGHT © JONES LANG LASALLE IP, INC. 2016. All Rights Reserved                                                                          Page | iv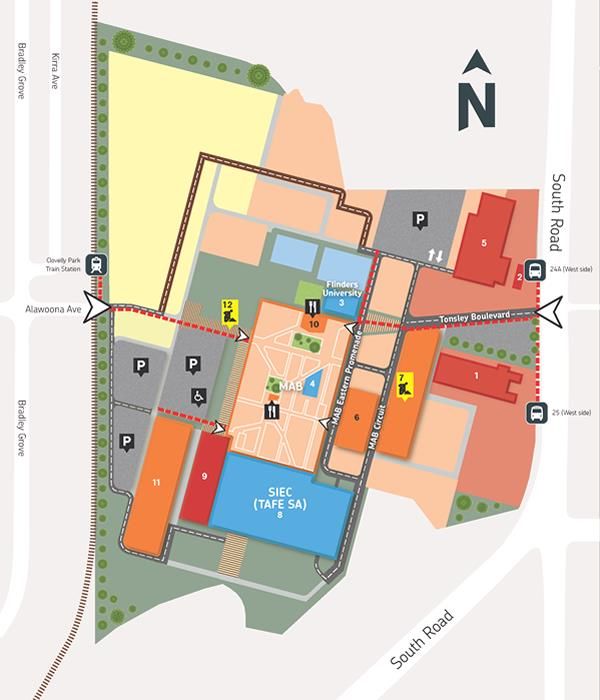
The Government of South Australia, Department of State Development: Student Accommodation Demand Study

List of Figures
Figure 1: University of South Australia City East Campus Map .................................................................................. 19
Figure 2: University of South Australia City West Campus Map ................................................................................. 19
Figure 3: University of South Australia Mawson Lakes Campus Map .......................................................................... 22
Figure 4: University of Adelaide North Terrace campus Map ..................................................................................... 27
Figure 5: Tonsley Site Map ................................................................................................................................... 31
Figure 6: Flinders University Bedford Park Campus Map .......................................................................................... 32
Figure 7: The University of South Australia Full-time Student Numbers 2010 – 2014..................................................... 34
Figure 8: The University of Adelaide Full-time Student Numbers 2010 – 2014 .............................................................. 34
Figure 9: Flinders University Full-time Student Numbers 2010 – 2014 ......................................................................... 35
Figure 10: Adelaide Student Population LGA Analysis 2006 ...................................................................................... 56
Figure 11: Adelaide Student Population LGA Analysis 2009 ...................................................................................... 57
Figure 12: Adelaide Student Population LGA Analysis 2011 ...................................................................................... 58
Figure 13: Adelaide Student Population LGA Analysis 2014 ...................................................................................... 59
Figure 14: Adelaide Student Population LGA Analysis 2015 ...................................................................................... 60
Figure 15: Adelaide CBD Campuses Gap Analysis of Low and Mid Scenarios ............................................................. 77
Figure 16: University of South Australia – Mawson Lakes Campus Gap Analysis of Low and Mid Scenarios ................... 78
Figure 17: Flinders University – Bedford Park Campus Gap Analysis of Low and Mid Scenarios .................................... 79

        COPYRIGHT © JONES LANG LASALLE IP, INC. 2016. All Rights Reserved                                                                               Page | v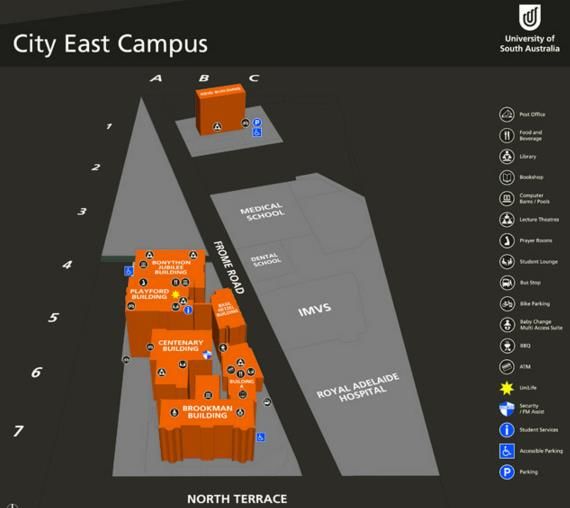
The Government of South Australia, Department of State Development: Student Accommodation Demand Study

Disclaimer
The material contained in this report was provided by JLL to the party to whom it is addressed strictly for the specific purpose to
which it refers and no responsibility is accepted to any third party.

Neither JLL nor any of its associates have any other interests (whether pecuniary or not and whether direct or indirect) or any
association or relationships with any of its associates that might reasonably be expected to be or have been capable of influencing
JLL in providing this report.

Whilst the material contained in the report has been prepared in good faith and with due care by JLL, no representations or
warranties are made (express or implied) as to the accuracy of the whole or any part of the report.

JLL, its officers, employees, subcontractors and agents shall not be liable (except to the extent that liability under statute or by
operation of law cannot be excluded) for any loss, liability, damages or expense suffered by any party resulting from their use of this
report.

If a projection has been made in respect of future demand, business trends, property prices, rentals and projected take up rates,
such a projection is an estimate only and represents only one possible result therefore should at best be regarded as an indicative
assessment of possibilities rather than absolute certainties. The process of making forward projections of such key elements
involves assumptions about a considerable number of variables that are acutely sensitive to changing conditions and variations, and
any one of which may significantly affect the resulting projections. This must be kept in mind whenever such projections are
considered.

      COPYRIGHT © JONES LANG LASALLE IP, INC. 2016. All Rights Reserved                                                        Page | vi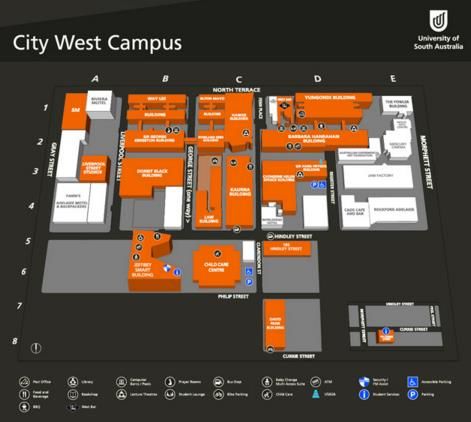
Executive Summary
A key economic priority of the state government is to increase the number of international students studying
in South Australia from 28,300 (2013 numbers) to 35,500 by 2017. Increased international students will place
increased demand for quality and affordability student accommodation in close proximity to the major higher
education institutions.
Existing Supply
Student accommodation is concentrated in Adelaide CBD and North Adelaide, within close proximity of two
of Adelaide’s three major universities (University of Adelaide and University of SA (UniSA)). There are also
concentrations of student accommodation near UniSA’s Mawson Lakes campus and near Flinders University
at Bedford Park. These three markets are the focus of this report.
The main types of purpose built student accommodation (PBSA) are:
Residential Colleges;
Purpose Built Student Accommodation;
University managed / leased accommodation;
Students also access a range of other accommodation options, including private rental accommodation,
serviced apartments, homestays, backpackers’ hostels and guesthouses.
Supply / Demand Relationship
The ratio of full-time students to total student accommodation rooms at the three main university locations in
Adelaide is compared to a selective group of universities across Australia. The supply of PBSA in Adelaide
CBD and Mawson Lakes is relatively high compared to the University of QLD, Melbourne and Sydney.
FT FT Students
Total Rooms
Students Per Bed
University of South Australia and University of
33,713 3,765 9.0
Adelaide CBD Campuses
University of South Australia Mawson Lakes 3,714 386 9.6
Flinders University Bedford Park 14,976 561 26.7
ANU (Canberra) 15,000 4,432 3.4
University of Melbourne (Parkville) 43,000 2,533 17.0
University of QLD (St Lucia) 42,000 2,871 14.6
University of Sydney 43,500 2,666 16.3
Rental Markets
The existing private rental markets in each of the three University locations highlights the higher median
house and unit prices in the Adelaide CBD and North Adelaide compared with Mawson Lakes and Bedford
Park. As at December 2015, the median asking rents for units in each suburb was:
Adelaide: $430 per week;
North Adelaide: $380 per week;
Mawson Lakes: $325 per week;
COPYRIGHT © JONES LANG LASALLE IP, INC. 2016. All Rights Reserved Page | vii
Page | vii
The Government of South Australia, Department of State Development: Student Accommodation Demand Study
Bedford Park: $283 per week.
Occupancy Rates for PBSA
Occupancy rates of PBSA across Adelaide tend to run at or near 100% occupancy. Similar high occupancy
levels are achieved by managers of student lettings in the private rental market.
We understand some of the residential colleges are not operating at 100% occupancy. There is a preference
for accommodation with ensuite bathroom rather than shared facilities. A recent development project at
Aquinas College has increased the number of rooms with ensuites.
Development Pipeline
Main developments in the pipeline are:
228 - 231 North Terrace, Adelaide: a 689 bed facility for Urbanest has been granted approval and is
expected to be completed for Semester 1 in 2018;
231-243 Waymouth Street, Adelaide: A proposed development by BlueSky comprising 415 student
beds;
UniSA City West campus, Adelaide: UniSA has run a tender process to select a development
partner to build and operate approximately 300 bedrooms adjacent to its City West campus.
Demand Scenarios for PBSA
JLL has undertaken four demand scenarios as outlined below. The scenarios are based on take-up rates for
PBSA (propensity) for both domestic and international students and growth rates in student numbers.
Forecasts are provided to 2020 and have been run for each of the three campus locations. Propensity ratios
in each scenario is higher than existing ratios, which reflects the fact that supply of quality PBSA is quite
constrained and enjoys 100% occupancy.
International
Domestic Students Domestic Students International Students
Students forecast
propensity for PBSA forecast growth propensity for PBSA
growth
Scenarios
Low forecast 5% 3.00% 40% 0.0%
Mid forecast 10% 4.26% 50% 3.5%
High forecast 15% 5.11% 60% 7.0%
Aspirational forecast 15% 5.11% 60% 12.0%
Adelaide CBD Campuses
Based on the low propensity scenario there could be demand for an additional 562 beds by 2020
(equivalent to one large development), resulting in continued supply levels of 10.3 FT students per
bed. This takes into account the completion of Urbanest’s new student accommodation
development on North Terrace in 2018.
Other scenarios are more aspirational in terms of propensity and require higher growth rates of both
domestic and international students as detailed above:
o Mid forecast scenario would result in a supply gap of 4,167 beds by 2020;
o High forecast scenario would result in a supply gap of 8,527 beds by 2020;
COPYRIGHT © JONES LANG LASALLE IP, INC. 2016. All Rights Reserved Page | viiiThe Government of South Australia, Department of State Development: Student Accommodation Demand Study
o Aspirational forecast scenario would result in a supply gap of 11,032 beds by 2020.
University of South Australia Mawson Lakes Campus
The supply gap for the four scenarios modelled are as follows:
o Low forecast scenario would result in a supply gap of 142 beds by 2020;
o Mid forecast scenario would result in a supply gap of 529 beds by 2020;
o High forecast scenario would result in a supply gap of 994 beds by 2020;
o Aspirational forecast scenario would result in a supply gap of 1,249 beds by 2020.
Flinders University Bedford Park Campus
The supply gap for the four scenarios modelled are as follows:
o Low forecast scenario would result in a supply gap of 1,008 beds by 2020;
o Mid forecast scenario would result in a supply gap of 2,326 beds by 2020;
o High forecast scenario would result in a supply gap of 3,852 beds by 2020;
o Aspirational forecast scenario would result in a supply gap of 4,415 beds by 2020.
Constraints to developing PBSA in Adelaide
Demand - The ability of Adelaide universities to continue to attract, and grow student population in
Adelaide will largely determine demand. Increased propensity for PBSA by both domestic and
international students will also grow demand.
Availability of land – This is not considered a major constraint at Mawson Lakes, Flinders
University or even in the Adelaide CBD where a wide variety of other land uses compete for
development sites. The Adelaide CBD is relatively under-developed compared to eastern seaboard
cities. The student housing sector has successfully sourced premium sites in the CBD for student
housing over the past decade. Numerous student accommodation projects have been proposed,
granted approval and have not progressed. This implies that the physical constraints have not been
a major limiting factor in the delivery of PBSA.
Feasibility - Feasibility is impacted by rental levels, land costs, build costs and end value.
o Rental levels for high quality PBSA in Adelaide are lower than headline rents in other state
capital cities across Australia. The availability of a large supply of private residential
dwellings at competitive rents creates a ceiling for rental levels and puts pressure on
feasibility.
o Build costs in the last 12 months have risen across many locations in Australia. This has put
further pressure on the feasibility of delivering new PBSA. Alternative building methods,
such as modular construction, may be one way of reducing build costs.
o Investment appetite for the asset class impacts feasibility. As the market matures and
investor appetite grows, yields are expected to tighten as has occurred in international
markets. This increases the feasibility of delivering new accommodation.
COPYRIGHT © JONES LANG LASALLE IP, INC. 2016. All Rights Reserved Page | ixThe Government of South Australia, Department of State Development: Student Accommodation Demand Study
Planning Restrictions
Planning restrictions do not appear to be a major impediment to delivering PBSA in the Adelaide
CBD or other markets. Overall, the planning rules in the Adelaide CBD are reasonably encouraging
for student accommodation. While they do not provide additional development density above other
land uses as a mean of encouraging student accommodation, the specific guidelines for student
accommodation provide more leniency compared with traditional residential apartment development
in terms or unit size (per bedroom), private open space, storage, and car parking.
Likewise we do not consider planning rules near either UniSA Mawson Lake or Flinders University
Bedford Park restrict opportunities.
Land Tax
South Australia has the highest rate of land tax of the mainland states. Compared to the other four
mainland states, SA land tax costs are:
Between $75,487 and $86,112 per annum higher on an assessed land value of $5 million;
Between $158,612 and $166,087 per annum higher on an assessed land value of $10 million;
Assessed value of land $5 million $10 million
State Land Tax Difference from SA Land Tax Difference from SA
SA 156,087 n.a. 341,087 n.a.
NSW 80,600 75,487 180,600 160,487
VIC 69,975 86,112 182,475 158,612
QLD 75,000 81,087 175,000 166,087
WA 73,130 82,957 180,130 160,957
Providing Affordable Student Accommodation: Options
JLL has reviewed the pricing of existing student accommodation as well as private rental accommodation
access by students in each location near Adelaide’s main university campuses.
There are opportunities for self-catering rental accommodation in each market within the price point of $200-
$250 per student per week, although we acknowledge that quality PBSA with ensuite facilities and including
utilities is above this price point in the Adelaide CBD.
Options to deliver more affordable accommodation include the following:
Participation by the Universities – this may include providing land on campus at a discounted rate to
enable a more affordable product to be developed;
Tax incentives – including both state and local government rebates and concessions. The main two
concessions identified are land tax concessions and rate rebates. Land tax concessions apply in
some markets for education institutions and this may be interpreted to include student
accommodation provided by education providers on a not-for-profit basis. The residential colleges in
North Adelaide already qualify for rate rebates of 75%. Direct involvement of the education providers
appears to be required in order to qualify for this rebate;
Infrastructure Charges – These costs can be significant and there is the potential for state or local
government to be pro-active and reduce the costs for certain developments that it wants to
encourage. In SA, the main infrastructure charge is payable for the open space contribution,
COPYRIGHT © JONES LANG LASALLE IP, INC. 2016. All Rights Reserved Page | xThe Government of South Australia, Department of State Development: Student Accommodation Demand Study
amounting to $6,488 per additional title created. If individual units within a student housing
development are strata titled, then an open space fee of $6,488 will be payable per unit;
Planning policy – Particularly relating to minimum sizes of units. The City of Adelaide’s Development
Plan does not quantify the minimum sizes for student accommodation units but recognises that
student accommodation is different and may not require quite the same unit size as private dwelling
units;
Current tenancy agreements and boarding house arrangements
Operators and education providers consider these are not suited to student accommodation, offer limited
protection and need to be addressed.
One of the issues related to the very broad range of accommodation that students could potential access,
including PBSA (private, university managed, residential colleges, self-catered, fully-catered), student
hostels, fully catered home stays, boarding houses, lodging houses, hostels, private rental accommodation,
and shared rental accommodation).
Most legislation includes minimum standards and protection mechanisms for tenants in general, but this is
not based on the status of the tenant. It more likely based on the type of accommodation offered.
The proliferation of rental websites aimed at international students that potentially channel students away
from university advertised and reputable student accommodation providers / managers. This potentially
leads to accommodation that may fall outside not of the jurisdiction of SACAT, the Local Tenancies Tribunal,
leading to accommodation with “flexible” contract arrangements that are not secured under standard tenancy
agreements. Fixing this “loophole” appears to be the main area that needs addressing in tenancy
agreements.
Private accommodation to suit the student market
Students in PBSA have a preference for ensuite accommodation. Most PBSA provided by Urbanest has
ensuites. Private accommodation that provides shared accommodation in say three bedroom units, each
with an ensuite, may not only suit the student market, but be deliverable within the price point of $200-$250
per person per week.
Student Accommodation Accreditation
This would provide consistency in standards and is particularly relevant in the private rental sector. The
recently established South Australian Student Accommodation Association (SASAA) has been promoting
accreditation and has drafted a framework for providers. This follows similar accreditation systems in other
countries. Such a system would provide greater certainty for students that their chosen accommodation will
be properly managed and meet minimum standards.
COPYRIGHT © JONES LANG LASALLE IP, INC. 2016. All Rights Reserved Page | xiThe Government of South Australia, Department of State Development: Student Accommodation Demand Study
1 Introduction
JLL has been instructed by the Government of South Australia, Department of State Development to assist
in the preparation of a student accommodation demand and supply study.
The Government of South Australia has recently released an “Economics Priorities” report outlining the
importance of attracting an increased number of international students studying and living within the state of
South Australia. The report recognises the need to grow jobs through opportunities arising from the field of
applied research and innovation at a University level. The objectives directly relating to international students
are as follows:
By 2017 to establish an accommodation offer guarantee to new international students studying at
South Australia’s public universities;
To increase the number of international students studying in South Australia from 28,300
(2013 numbers) to 35,500 by 2017; and
To encourage better coordination of services to meet the needs of an increasing student population,
such as accommodation, employment opportunities and support services within 12 months.
COPYRIGHT © JONES LANG LASALLE IP, INC. 2016. All Rights Reserved Page | 12
Page | 12The Government of South Australia, Department of State Development: Student Accommodation Demand Study
2 Adelaide Overview
2.1 Overview
Adelaide is the capital city of South Australia and is the fifth largest city in Australia, with a population of circa
1.3 million (77% of South Australia’s population). The Adelaide Central Business District (CBD) is the heart
of South Australia’s government and commercial sectors bounded by North, East, South and West Terrace.
The main education precinct is located within the Adelaide CBD and fronting North Terrace. Within this
precinct are the University of Adelaide, the City West and City East campuses of the University of South
Australia (UniSA), TAFE SA, a number of colleges and other educational providers. There is also a
concentration of retail and leisure activities focussed at the student market.
The existing student accommodation in the immediate locality is provided by a number of private sector
operators. However, the existing accommodation within this locality is not all purpose built and varies
significantly in quality of accommodation and services.
Outside the CBD, UniSA has a campus in the Mawson Lakes area 15 kilometres north of the CBD and
Flinders University has a campus at Bedford Park 12 kilometres south of the CBD. The following map
identifies the agreed study areas for this report within Adelaide.
Map 1: Location Map
Source: Google Maps
COPYRIGHT © JONES LANG LASALLE IP, INC. 2016. All Rights Reserved Page | 13The Government of South Australia, Department of State Development: Student Accommodation Demand Study
2.1 Demographics
The following demographic data is based on the 2011 Census:
Adelaide has a population of 1,225,235 people;
Median age of the population is 39 years;
Average of 1.8 children per family;
More than 30% of Adelaide residents are born overseas;
Most people in Adelaide live in houses (89%) rather than apartments;
About 67.9% of Adelaide residents owned their dwelling fully or with a mortgage, the reminder rent
or occupy under other tenure;
69.5% of Adelaide residents travel to work by car and only 8.5% use public transport;
Median household income is approximately $2,110 per week;
Median mortgage repayments are approximately $357 per week;
Median weekly rent is approximately $250;
The unemployment rate of Greater Adelaide in December 2015 was 7.2%.
2.2 Adelaide Student Demographics Summary
The number of full-time higher education students studying in Adelaide was 65,516 in 2014 based on the
latest available Australian Government Department of Education statistical data.
The majority of students study at three main Adelaide based universities: UniSA, University of Adelaide and
Flinders University. The rest of the student population study at other private providers of higher education,
including a range of colleges and institutes.
Table 1: Summary of Full Time Students in Adelaide, 2014
Providers Full-time Students
University of South Australia 21,788
University of Adelaide 21,531
Flinders University* 16,505
Private Providers 5,692
Total: 65,516
Commencing international students in 2014 - onshore 7,635
Commencing international students in 2014 - offshore 2,150
Source: Australian Government Department of Education 2014 data, JLL research.
*Figures for Flinders University include students outside of the CBD at Bedford Park.
COPYRIGHT © JONES LANG LASALLE IP, INC. 2016. All Rights Reserved Page | 14The Government of South Australia, Department of State Development: Student Accommodation Demand Study
3 Adelaide Universities Overview
3.1 University of South Australia
The University of South Australia (UniSA) is
the largest University in the state of South
Australia, with a strong reputation for
excellence across a wide range of subjects in
business, law, education, arts and social
sciences, health sciences, information
technology, engineering and the
environment.
UniSA has two City campuses, East and
West (both located towards the northern
fringe of the CBD) and four other regional
campuses.
The following facts highlight the UniSA
student demographics:
International / domestic students 20% / 80% On campus / off campus 63% / 37%
students
Domestic undergraduate / 79% / 21% Domestic full-time / part- 65% / 35%
postgraduate students time domestic students
International undergraduate / 67% / 33% International full-time / part- 80% / 20%
postgraduate students time international students
The table below shows the number of domestic and overseas students enrolled into UniSA and split between
mode of attendance (internal, external and multi-modal), type of attendance (full/part-time) and course level
(undergraduate, postgraduate, non-award/enabling courses).
Table 2: University of South Australia, Number of Student Enrolments, 2014
Internal External / Multi-modal Total
Full-time Part-time Full-time Part-time
Domestic
Undergraduate 10,191 2,268 4,306 2,795 19,560
Postgraduate 1,031 902 545 2,666 5,144
Non-Award/Enabling 525 144 206 122 997
Total 11,747 3,314 5,057 5,583 25,701
Overseas
Undergraduate 2,811 685 496 108 4,100
Postgraduate 1,228 313 329 114 1,984
Non-Award/Enabling 112 56 8 5 181
Total 4,151 1,054 833 227 6,265
Total 15,898 4,368 5,890 5,810 31,966
Source: Department of Education Statistics Data Cube (uCube)
COPYRIGHT © JONES LANG LASALLE IP, INC. 2016. All Rights Reserved Page | 15The Government of South Australia, Department of State Development: Student Accommodation Demand Study
The Table below provides a breakdown of on-campus international full and part time students studying by
Campus. The Whyalla and Mount Gambier Campus do not have any international students. City West
Campus is home to the largest number of international students (2,939), with Mawson Lakes holding the
largest percentage of international students (35%). Overall the numbers provided to us by the University of
South Australia’s Facilities Management Unit suggest that international students make up 22% of total
students studying at the University.
Table 3: Breakdown of International Students by Campus
Total Full-time and Part-time International Full-time and Part- Percentage of International
Campus
Students time Students Students
City West Campus 9,210 2,939 32%
City East Campus 6,940 1,188 17%
Magill Campus 6,407 580 9%
Mawson Lakes Campus 3,490 1,210 35%
Whyalla Campus 242 0 0%
Mount Gambier 47 0 0%
26,336 5,917 22%
Source: Facilities Management Unit, University of South Australia
Further analysis of the international students studying at the University of South Australia as detailed below
indicates a strong representation from Asian countries, reasonably consistent with overall trends for
1
international students across Australia .
Top Countries of Origin
Table 4: University of South Australia, Top Countries of Origin 2015
Country Students Percentage of total international students: 5,917
China (Excl SARS and Taiwan) 2,276 38.46%
Other* 1,038 17.54%
Malaysia 737 12.45%
Hong Kong (SAR of China) 524 8.85%
India 437 7.39%
Vietnam 301 5.09%
Saudi Arabia 153 2.58%
South Korea 125 2.12%
Brazil 123 2.08%
Kenya 110 1.86%
Philippines 93 1.58%
Total: 5,917 100%
Source: Facilities Management Unit, University of South Australia
*Other includes all other countries not identified in the table
1
Page 7 – JLL Australian Student Accommodation Market Update 2015
COPYRIGHT © JONES LANG LASALLE IP, INC. 2016. All Rights Reserved Page | 16The Government of South Australia, Department of State Development: Student Accommodation Demand Study
3.2 University of South Australia – City East and West Campuses
Courses and Use
Students at UniSA’s City East campus study:
Construction Management; Pharmacy and Medical Sciences;
Geographic Information Systems; Physiotherapy;
Health Sciences; Podiatry;
Nursing and Midwifery; Population Health; and
Planning and Geoinformatics; Surveying.
Students at UniSA’s City West campus study:
Arts; Commerce;
Architecture and Design; Law; and
Business; Management.
Location
UniSA’s two main campuses, City East and City West, are situated in Adelaide’s Central Business district.
City East campus is located on the corner of North Terrace and Frome Road, adjacent to the University of
Adelaide. The campus is situated opposite Royal Adelaide Hospital and has a focus on Health and
Biomedical research including Health Sciences, Nursing and Midwifery, Pharmacy and Medical Sciences
and Population Health. The State’s only Podiatry, Pharmacy and Medical Radiation programs are also
offered by UniSA’s City East campus.
City West campus is located on the corner of North Terrace and Morphett Street and is largely home to the
schools of Business, Law, Commerce and management, Architecture and Creative Arts.
Facilities
Both City East and City West Campus location is on a prominent main road, North Terrace, and allows
students, staff and visitors reasonably simple public transport access from wider Adelaide. UniSA does not
provide on-campus parking to students at City East and City West Campus.
The campus is accessible primarily by bus, with numerous bus stops situated outside the Campus.
The University has a range of facilities such as sporting facilities, parklands, management and conference
centre, theatres as well as retail and cafes.
Masterplan
City West Campus - Campus Master Plan 2020
The University of South Australia City West Campus Master Plan aims to provide significant enhancement to
the quality of life, services and facilities offered by the campus. The proposed Learning Centre will shift
student services and University activities away from the North Terrace cluster towards the southern edge of
Hindley Street. The relocation of student services and University activities, as well as public realm
redevelopment, will create a new centre for the City West Campus.
This reorientation of the north and south areas of the campus will increase future opportunities for expansion
with a greater pool of land holdings.
UniSA has recently completed and are in the process of constructing large infrastructure projects to assist in
the growing students numbers into Adelaide. Information on these projects is detailed below:
Jeffrey Smart Building
Completed in 2014, the Jeffrey Smart Building is a new purpose-built student learning centre situated at the
University’s City West campus. The building has a 5 Green Star rating and provides all University of South
COPYRIGHT © JONES LANG LASALLE IP, INC. 2016. All Rights Reserved Page | 17
Page | 17The Government of South Australia, Department of State Development: Student Accommodation Demand Study
Australia students with eight floors of modern technology zones, 600 new student PCs, interactive work
spaces and silent study zones.
Student Lounge
Having reopened in September 2015, the redeveloped City West Student Lounge offers students an
interactive space outside of study time. The building’s concept design was influence by the University’s
architecture students and will cater for social and recreational activities organised by the University and their
student groups.
Health Innovation Building
In mid-2015, the University of South Australia started construction on a $230 million Health and Research
facility which will form part of the South Australian Health and Biomedical precinct. This facility aims to
enable an innovative approach to health research, teaching and community engagement.
Great Hall
Having commenced in October 2015, UniSA has begun construction of a new Great Hall situated at their
City West campus. The Great Hall will serve as a Graduations and Function Centre including a purpose built
amphitheatre, a five lane swimming pool and a fully-equipped fitness centre, due to be completed by late
2017.
COPYRIGHT © JONES LANG LASALLE IP, INC. 2016. All Rights Reserved Page | 18The Government of South Australia, Department of State Development: Student Accommodation Demand Study
Figure 1: University of South Australia City East Campus Map
Figure 2: University of South Australia City West Campus Map
Source: University of South Australia
COPYRIGHT © JONES LANG LASALLE IP, INC. 2016. All Rights Reserved Page | 19The Government of South Australia, Department of State Development: Student Accommodation Demand Study
Table 5: University of South Australia – City East and West Campus Country of Origin Trends
Full-time Full-time Full-time Full-time Full-time
2010 2011 2012 2013 2014
Students Students Students Students Students
China 1395 China 1477 China 1397 China 1298 China 1284
Malaysia 797 Malaysia 696 Malaysia 587 Malaysia 541 Malaysia 456
India 323 Hong Kong 306 Hong Kong 293 Hong Kong 270 Hong Kong 250
Hong Kong 291 Vietnam 186 Vietnam 182 Vietnam 165 Vietnam 163
Vietnam 200 India 178 India 156 India 159 India 153
South Korea 101 South Korea 113 South Korea 110 South Korea 105 South Korea 83
Singapore 91 Singapore 82 Philippines 71 Philippines 91 Philippines 64
Pakistan 67 Nepal 50 Singapore 64 Singapore 47 Brazil 60
Indonesia 54 Pakistan 47 Nepal 51 Saudi Arabia 45 Kenya 58
Sri Lanka 46 Indonesia 45 Kenya 37 Indonesia 39 Saudi Arabia 45
Other 491 Other 490 Other 416 Other 405 Other 420
Total 3856 Total 3670 Total 3364 Total 3165 Total 3036
Source: Department of Education Statistics Data Cube (uCube)
The University of South Australia City Campuses have experienced a 27% decline in International Student numbers between the years 2010 – 2014 (most recent
data). Indian students were the largest reduction in student numbers, seeing a 53% decline of 170 students. Malaysian and Chinese students were the next
largest drop in student numbers being 43% (341) and 8% (111) respectively. However significant increases in International Student enrolments since 2010 have
come from Brazil, Kenya and the Philippines.
COPYRIGHT © JONES LANG LASALLE IP, INC. 2016. All Rights Reserved Page | 20
Page | 20The Government of South Australia, Department of State Development: Student Accommodation Demand Study
3.3 University of South Australia – Mawson Lakes Campus
Courses and Use
Students at UniSA’s Mawson Lakes campus primarily study:
Applied Science; Environmental Studies;
Civil Aviation; Information Technology;
Computer Science; Science; and
E-Commerce; Sports Science.
Engineering;
Location
The UniSA Mawson Lakes Campus is located in the northern suburbs of Adelaide, on Mawson Lakes
Boulevard, next to Parafield Airport. The campus is set in large open green spaces and wetland areas.
Mawson Lakes is located approximately 15km north east of Adelaide’s Central Business District and is
bounded by Parafield Gardens, Para Hills, Dry Creek and Green Fields.
The Mawson Lake Campus specialises in Schools of Computing and Information, Engineering, Science, Civil
Aviation, Applied Science, Sports Science, E-Commerce and Environmental Studies and is highly regarded
in these areas.
Location and Facilities
The Campus location is just off Main North Road, the main road through Mawson Lakes. The Mawson
Interchange is a major public transport hub and only a five minute walk from the Campus. This Interchange
allows students, staff and visitors with frequent transport links including buses and trains.
The Mawson Lake Campus provides unreserved metred parking to students wishing to drive, as well as a
limited amount of parking permits to postgraduate students.
Facilities provided include a post office, bookshop, library, student lounge, a large BBQ area, an ATM,
sporting facilities and ovals, an Eco precinct including a greenhouse, and numerous other learning and
recreational facilities.
Masterplan
The University of South Australia currently has no Master Plan for their Mawson Lake Campus, with the
focus being on City East and City West Campuses.
COPYRIGHT © JONES LANG LASALLE IP, INC. 2016. All Rights Reserved Page | 21
Page | 21The Government of South Australia, Department of State Development: Student Accommodation Demand Study
Figure 3: University of South Australia Mawson Lakes Campus Map
Source: University of South Australia
COPYRIGHT © JONES LANG LASALLE IP, INC. 2016. All Rights Reserved Page | 22The Government of South Australia, Department of State Development: Student Accommodation Demand Study
Table 6: University of South Australia – Mawson Lakes Country of Origin Trends
Full-time Full-time Full-time Full-time Full-time
2010 2011 2012 2013 2014
Students Students Students Students Students
China 211 China 198 China 210 China 197 China 195
India 195 India 113 India 78 Malaysia 106 Malaysia 111
Malaysia 74 Malaysia 79 Malaysia 73 Hong Kong 83 Hong Kong 98
Hong Kong 62 Hong Kong 70 Hong Kong 68 India 72 India 79
Pakistan 45 Saudi Arabia 35 Saudi Arabia 49 Saudi Arabia 44 Saudi Arabia 62
Sri Lanka 37 Pakistan 33 Vietnam 32 Vietnam 32 Brazil 37
Vietnam 34 Vietnam 33 Pakistan 26 Kuwait 26 Vietnam 34
Iran 24 Sri Lanka 30 Bangladesh 25 Bangladesh 25 Bangladesh 20
Saudi Arabia 23 Iran 29 Kuwait 25 Iran 23 Iran 19
Bangladesh 20 Bangladesh 19 Sri Lanka 24 Pakistan 22 Kuwait 19
Other 163 Other 185 Other 185 Other 198 Other 226
Total 888 Total 824 Total 795 Total 828 Total 900
Source: Department of Education Statistics Data Cube (uCube)
Over the period of 2010 to 2014, International Student numbers have grown insignificantly at 1.4% or 12 students. The most significant increase has come from
Saudi Arabian, Malaysian and Hong Kong students being 77%, 43% and 38% respectively. There have been no material countries of decline between 2010 and
2014.
COPYRIGHT © JONES LANG LASALLE IP, INC. 2016. All Rights Reserved Page | 23
Page | 23The Government of South Australia, Department of State Development: Student Accommodation Demand Study
3.4 University of Adelaide
The University of Adelaide is a highly
regarded tertiary education and research
institution, being ranked 100th in the world in
the QS World University Rankings. It is part
of Australia’s Group of Eight – a coalition of
leading universities.
The University was established in 1874, and
as such is the oldest University in South
Australia.
The University of Adelaide is ranked in the
top 1% in the world in 11 research fields. It
has major strengths in many science
subjects including environmental sciences
and social sciences.
The University of Adelaide has its main campus on North Terrace and three other regional campuses. The
following facts highlight the University of Adelaide student demographics:
International / domestic students 24% / 73% On campus / off campus 97% / 3%
students
Domestic undergraduate / 79% / 21% Domestic full-time / part- 77% / 33%
postgraduate students time domestic students
International undergraduate / 51% / 49% International full-time / part- 85% / 15%
postgraduate students time international students
The table below shows the number of domestic and overseas students enrolled into The University of
Adelaide and split between mode of attendance (internal, external and multi-modal), type of attendance
(full/part-time) and course level (undergraduate, postgraduate, non-award/enabling courses).
Table 7: University of Adelaide, Number of Student Enrolments, 2014
Internal External / Multi-modal Total
Full-time Part-time Full-time Part-time
Domestic
Undergraduate 13,036 2,202 246 18 15,502
Postgraduate 1,929 1,905 68 298 4,200
Non-Award/Enabling 90 109 0 1 200
Total 15,055 4,216 314 317 19,902
Overseas
Undergraduate 2,929 415 16 0 3,360
Postgraduate 2,589 594 12 18 3,213
Non-Award/Enabling 616 92 0 3 711
Total 6,134 1,101 28 21 7,284
Total 21,189 5,317 342 338 27,186
Source: Department of Education Statistics Data Cube (uCube)
COPYRIGHT © JONES LANG LASALLE IP, INC. 2016. All Rights Reserved Page | 24
Page | 24You can also read


