Periphyton growth in Northland rivers - Current status, and development of relationships for nutrient limit-setting
←
→
Page content transcription
If your browser does not render page correctly, please read the page content below
Periphyton growth in Northland
             rivers
Current status, and development of relationships for
                nutrient limit-setting

   Prepared for Northland Regional Council (Envirolink Fund)

                          June 2019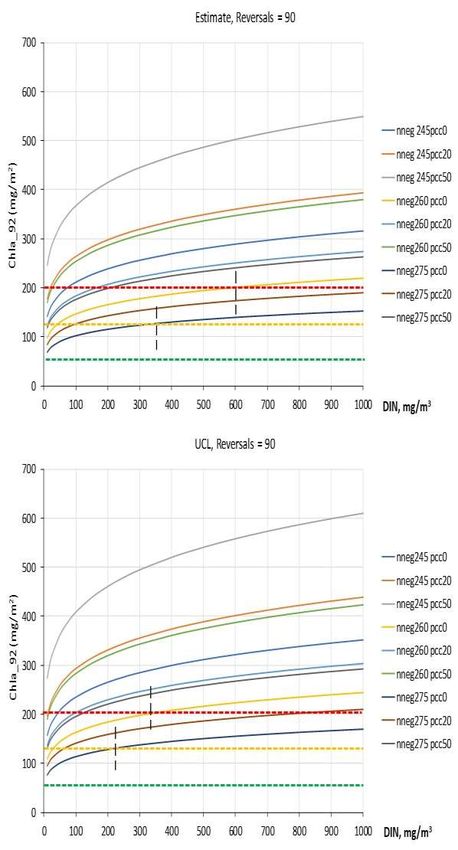
Prepared by:
Cathy Kilroy
Rick Stoffels

For any information regarding this report please contact:
Cathy Kilroy
Freshwater Ecologist

+64-3-343 7883
cathy.kilroy@niwa.co.nz

National Institute of Water & Atmospheric Research Ltd
PO Box 8602
Riccarton
Christchurch 8011

Phone +64 3 348 8987

NIWA CLIENT REPORT No:      2019064CH
Report date:                June 2019
NIWA Project:               ELF19501

 Quality Assurance Statement

                                                Reviewed by:                 Clive Howard-Williams

                                                Formatting checked
                                                                             Rachel Wright
                                                by:

                                                Approved for release
                                                                             Helen Rouse
                                                by:

© All rights reserved. This publication may not be reproduced or copied in any form without the permission of
the copyright owner(s). Such permission is only to be given in accordance with the terms of the client’s contract
with NIWA. This copyright extends to all forms of copying and any storage of material in any kind of
information retrieval system.

Whilst NIWA has used all reasonable endeavours to ensure that the information contained in this document is
accurate, NIWA does not give any express or implied warranty as to the completeness of the information
contained herein, or that it will be suitable for any purpose(s) other than those specifically contemplated
during the Project or agreed by NIWA and the Client.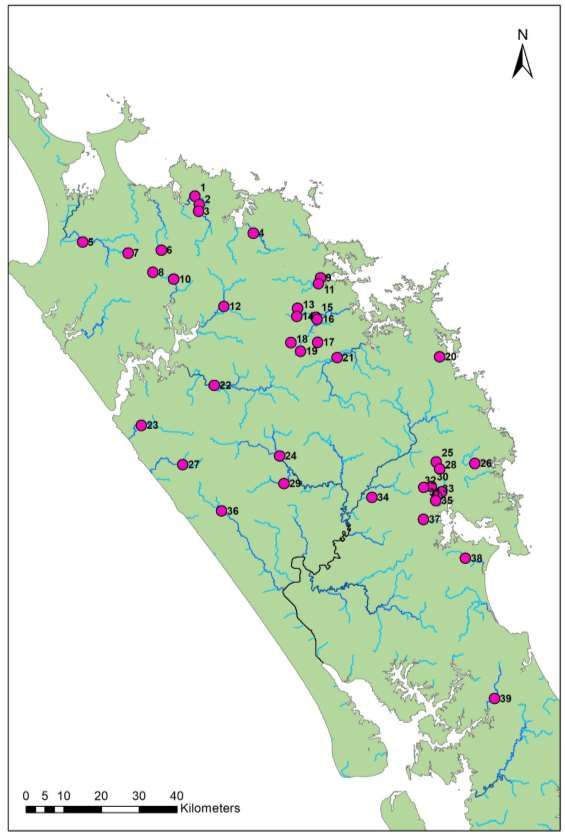
Contents

Executive summary ............................................................................................................. 6

1       Introduction .............................................................................................................. 9

2       The Northland periphyton dataset ........................................................................... 11
        2.1      Sampling sites ......................................................................................................... 11
        2.2      Periphyton data ...................................................................................................... 11
        2.3      Nutrient and environmental data ........................................................................... 11
        2.4      Data preparation..................................................................................................... 14

3       Assessment of periphyton in Northland relative to the NPS-FM and other guidelines 15
        3.1      Periphyton standards.............................................................................................. 15
        3.2      Methods .................................................................................................................. 17
        3.3      Results ..................................................................................................................... 18
        3.4      Discussion ............................................................................................................... 26
        3.5      Summary of assessment ......................................................................................... 27

4       Drivers of periphyton biomass in Northland rivers: effect of river flows within sites .. 29
        4.1      Controls on periphyton in rivers: general background ........................................... 29
        4.2      Identification of an effective flow at each site ....................................................... 30
        4.3      Discussion ............................................................................................................... 35

5       Drivers of periphyton biomass in Northland rivers: relationships between chlorophyll a
        and multiple environmental variables ...................................................................... 37
        5.1      Predictor variables .................................................................................................. 37
        5.2      Relationships between chlorophyll a and single predictors ................................... 40
        5.3      Relationships between chlorophyll a and multiple predictors ............................... 43
        5.4      Discussion ............................................................................................................... 51

6       Development of nutrient criteria for Northland rivers ............................................... 58
        6.1      Approach................................................................................................................. 58
        6.2      Results ..................................................................................................................... 58
        6.3      Limitations of the method ...................................................................................... 59

7       Review of Northland’s periphyton monitoring programme ....................................... 61
        7.1      Monitoring progress towards NPS-FM freshwater objectives ............................... 61

Periphyton growth in Northland rivers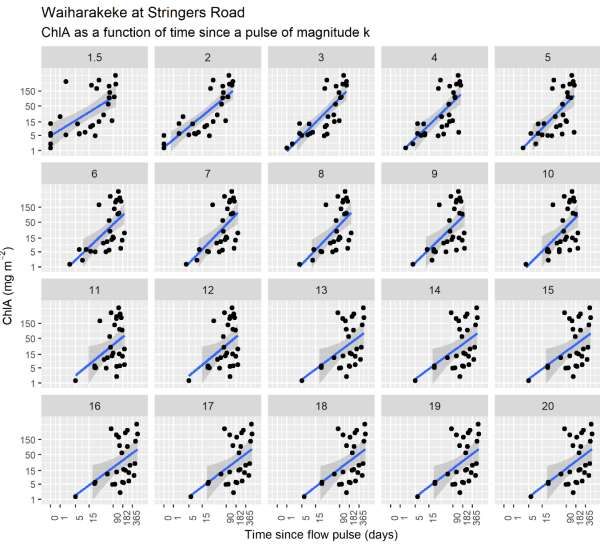
7.2      Monitoring related to setting numeric objectives for Northland’s rivers .............. 62

8       Synthesis and recommendations .............................................................................. 66
        8.1      Compliance with guidelines .................................................................................... 66
        8.2      Drivers of periphyton biomass in Northland rivers ................................................ 67
        8.3      Review of Northland’s periphyton monitoring programme ................................... 67
        8.4      Summary of recommendations .............................................................................. 68

9       Acknowledgements ................................................................................................. 69

10      References............................................................................................................... 70

Appendix A                    Northland Regional Council periphyton monitoring sites: summary of
     data                     75

Appendix B           Pearson correlation matrix of all predictor variables and 92nd percentile
     of chlorophyll a........................................................................................................ 77

Appendix C                    Comparison of data from Northland, Manawatu-Whanganui and
     Canterbury               78

Appendix D         Predictions of Chla_92 plotted against DRP and DIN under different
     combinations of predictor values ............................................................................. 79

Appendix E                    Distributions of available predictor variables .................................... 90

Tables
Table 2-1:           List of sites included in the Northland periphyton monitoring programme. 13
Table 3-1:           Summary of periphyton and cyanobacteria standards, set to protect a range of
                     instream values.                                                               16
Table 3-2:           Numbers of exceedances of 30% cover by filaments and 60% cover by mats. 19
Table 3-3:            Mean annual chlorophyll a calculated for 2015, 2016 and 2017 at 39
                     Northland river sites.                                                         20
Table 3-4:           Numbers of exceedances of chlorophyll a thresholds from the 2000 periphyton
                     guideline at each Northland periphyton monitoring site, by year.               21
Table 3-5:           Assignment of 39 sites in Northland to bands of the periphyton attribute of the
                     NPS-FM.                                                                        24
Table 3-6:           Summary of exceedances of the cyanobacteria guidelines.                        25
Table 3-7:           Summary of compliance with MfE periphyton guidelines, NPS-FM grading, and
                     compliance with cyanobacteria guidelines in Northland.                         26
Table 4-1:           Summary results of analysis of chlorophyll a versus accrual times at 21 sites
                     with a flow record, with assignments of effective flow.                        32
Table 5-1:           Dependent and predictor variables used in the analysis, with justification for
                     inclusion of each.                                                             38
Table 5-2:           Classifications used to partition sites.                                       40

                                                                                            Periphyton growth in Northland rivers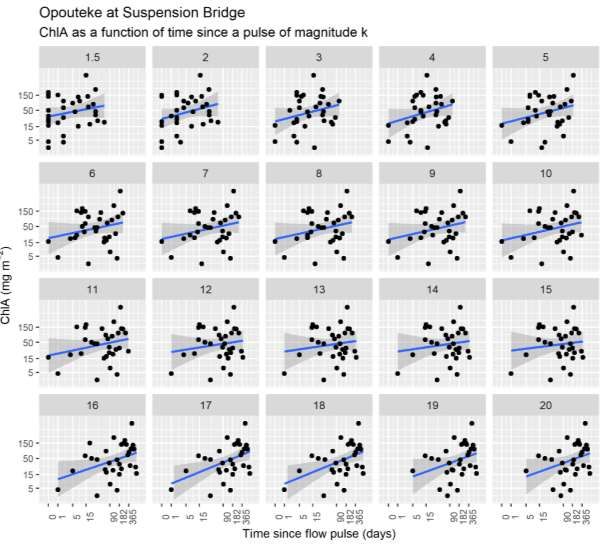
Table 5-3:      Summary results of screening for regression relationships between chla_92
                and environmental variables.                                                    47
Table 5-4:      Model details for relationships assessed as potentially useful for predicting
                Chla_92 across Northland rivers.                                                50
Table 6-1:      Summary of DRP and DIN concentrations corresponding to the Chla_92
                thresholds separating the NPS-FM bands under a set of specified values for
                each predictor.                                                                 59
Table 7-1:      Assessment of sites in the Northland periphyton dataset for
                representativeness for development of periphyton – nutrient relationships.      63

Figures
Figure 2-1:     Locations of the 39 periphyton monitoring sites in the Northland region.       12
Figure 3-1:     Box plots showing medians and ranges of pH, nutrients, EC and temperature at
                sites assigned to bands A to D of the periphyton attribute.                    28
Figure 3-2:     Comparison of deviations of hydrological metrics from the long-term mean in
                four years from 2014-15 to 2017-18.                                            28
Figure 4-1:     Plots of R2 versus flow threshold for defining accrual period (in multiples of
                median flow) at each of the 21 NRC sites with a flow record.                   33
Figure 4-2:     Chlorophyll a plotted against time since flow pulses at Opouteke at Suspension
                Bridge.                                                                        34
Figure 4-3:     Chlorophyll a plotted against time since flow pulses at at Waiharakeke at
                Stringers Road                                                                 35
Figure 5-1:     Plots of chlorophyll a versus DIN, DRP, TN, TP, NH4N and pcNH4 with sites
                partitioned into flow sensitive and flow insensitive sites.                    41
Figure 5-2:     Plots of chlorophyll a versus DIN, DRP, TN, TP, NH4N and pcNH4 , with sites
                partitioned according to their REC geology class.                              42
Figure 5-3:     Plots of chlorophyll a versus DIN, DRP, TN, TP, NH4N and pcNH4 , with sites
                partitioned into full sun and partial shade sites.                             42
Figure 5-4:     Plots of chlorophyll a versus DIN, DRP, TN, TP, NH4N and pcNH4 , with sites
                partitioned into Hill and Lowland sites based on mean upstream slope.          43
Figure 5-5:     Percentage of NH4-N in DIN (pcNH4) plotted against NOx-N showing a strong
                negative relationship.                                                         54
Figure 5-6:     Box plots showing medians and ranges of environmental variables at sites in
                REC geology classes HS, SS and VA.                                             57

Periphyton growth in Northland rivers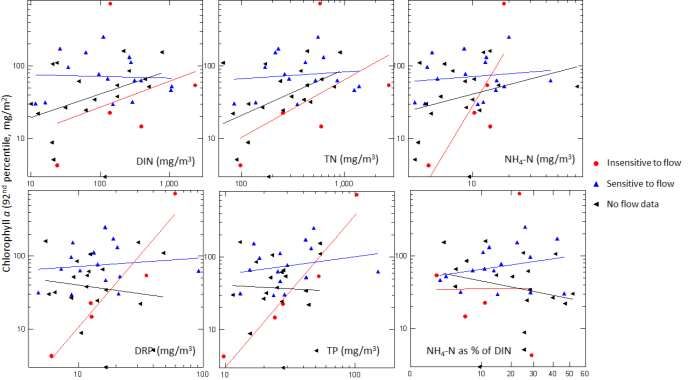
Executive summary
The National Policy Statement for Freshwater Management 2014 (NPS-FM) requires regional councils
to monitor a range of freshwater attributes defined in the National Objectives Framework as part of
a process of understanding, managing and improving the state of New Zealand’s fresh waters. The
state of ecosystem health in rivers is currently represented by the attribute for periphyton biomass
(as chlorophyll a in mg/m2 of river bed).

In 2017, the Government amended the NPS-FM to require regional councils to “at least set
appropriate instream concentrations and exceedance criteria for dissolved inorganic nitrogen (DIN)
and dissolved reactive phosphorus (DRP)” for the purposes of managing periphyton biomass.

The NPS-FM periphyton metric specifies monthly time series of periphyton observations (as
chlorophyll a) for at least three years. The metric used for grading a site is the 92nd percentile of
chlorophyll a (hereafter referred to as “Chla_92”), which is equivalent to at least three exceedances
of the thresholds separating bands A and B (50 mg/m2), B and C (120 mg/m2) and C and D (200
mg/m2) recorded during three years of monthly monitoring.

Collection of other environmental data at the same monitoring sites over that period also allows
progress towards meeting the requirements of the 2017 amendment to the periphyton attribute of
the NPS-FM.

To fulfil its obligations in relation to the NPS-FM periphyton attribute, Northland Regional Council
(NRC) expanded its existing State-of-the-Environment periphyton monitoring programme to monthly
monitoring at 39 sites, starting in January 2015.

In mid-2018, NRC obtained Envirolink funding to enable NIWA to carry out an analysis of data
collected in the first three years of the monitoring programme. NRC requested analysis to address
the four sets of questions, three of which are addressed in this report and shown below in italics.

      Q1: “Is there a problem with periphyton in Northland (as determined from exceedances of MfE
      guidelines and breaches of the “national bottom line” (D band) of the periphyton attribute in
      the National Policy Statement for Freshwater Management (NPS-FM))? The analysis will
      include identification of problem sites for periphyton growth measured as both chlorophyll a
      biomass and percentage cover and including cyanobacteria.”

The Ministry for the Environment (MfE) 2000 Periphyton Guideline proposed limits for periphyton in
rivers for the protection of a range of instream values. Percentages of sites not complying with the
MfE 2000 periphyton guidelines over the period of monthly monitoring (January 2015 to May 2018)
ranged from 90% (35 of 39 sites) for mean chlorophyll a to protect benthic biodiversity (< 15 mg/m2)
to 33% (13 of 39 sites) at which the highest threshold (maximum chlorophyll a < 200 mg/m2) set for
the protection of trout habitat and angling values was exceeded at least once in the monitoring
period.

Thirty-two sites (82%) were graded into bands A or B of the NPS-FM periphyton attribute (indicating
natural or near-natural nutrients and habitat), and two sites (5%) into band D (indicating nutrient
enrichment and non-natural habitat, below the national “bottom line”). The band D sites were
Hakaru at Topuni and Waiharakeke at Stringers Road. Five sites were graded as band C (Awanui at
FNDC, Opouteke at Suspension Bridge, Punakitere at Taheke, Waipapa at Landing, Watercress at
SH1).

6                                                                  Periphyton growth in Northland rivers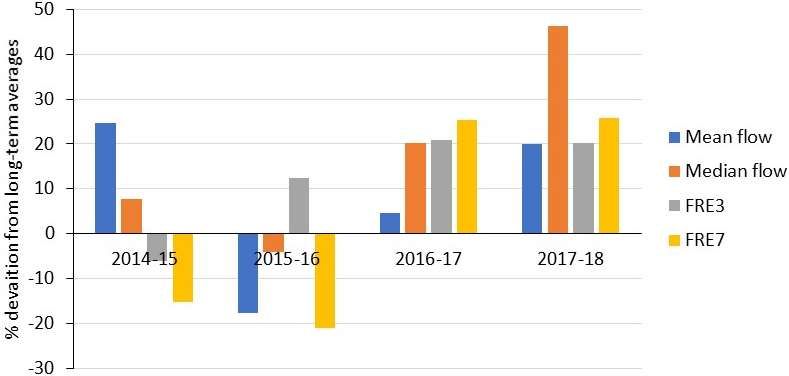
Over the whole monitoring period, one-third of all sites exceeded the Alert level of the 2009
Cyanobacteria Guideline (>20% cover of the stream bed), and 10% of sites exceeded the Action level
(>50% cover of the stream bed) at least once. All exceedances of the Action guideline level were in
2015 or 2016. The sites with highest cover by cyanobacteria were not necessarily the sites that
exceeded the MfE guidelines or the sites that were graded into bands C or D of the NPS-FM.
In summary, the periphyton data from 39 Northland sites indicates that a small proportion (5%) of
sites have a periphyton “problem” (i.e., excessive periphyton) and a further 13% could potentially be
problematic, when assessed against the NPS-FM. The rate of problem sites (graded as NPS-FM band
D) was similar to that in recent analysis of a national dataset that included the Northland sites.
Q2: “What are the major drivers of periphyton growth in Northland? In particular, what are the
roles of dissolved inorganic nitrogen (DIN), dissolved reactive phosphorus (DRP) and
ammoniacal-N (NH4-N) in driving periphyton and what are appropriate instream nutrient
criteria for Northlands hard-bottomed rivers?”
Relationships between periphyton Chla_92 and environmental variables were explored using
regression techniques. Environmental variables that contributed to strong predictive relationships
were: mean water temperature, DRP, DIN, flow metrics and substrate (percentage of the bed
covered by coarse substrate), with water temperature the strongest predictor. DRP was generally a
stronger predictor than DIN, although relationships with either DRP or DIN as predictors were
identified.
NH4-N concentration (NH4N) and NH4-N as a percentage of DIN (pcNH4) were, respectively, positively
and negatively strongly correlated with DIN (or NO3-N) across all sites. All these predictors were also
correlated with Chl-92 in some subsets of sites and could be interchangeably used in models with
similar explanatory skill. Similarly, NH4N or pcNH4 were also correlated with DRP in some subsets
and the variables were interchangeable in strong models. Because the variables were
intercorrelated, it was not possible in this analysis to isolate any effect of NH4-N on Chla-92 from the
effect of DIN, NO3-N or DRP.
We suggest that further analysis of the monthly time-series of DRP, DIN and NH4-N (rather than
three-year means) may assist in understanding site-specific responses to different nutrient sources.
When considering all 39 sites in combination, we were unable to confidently identify any relationship
between Chla_92 and measured environmental variables. However, Chla_92 was predictable within
subsets of sites at which periphyton was sensitive to flow (identified using within-site analyses), with
mean temperature, DRP or DIN, flow variables and substrate composition as predictors.
The nature of the relationships means that nutrient criteria may need to be site- or river-specific,
because the predictions take account of other site conditions (i.e., flow variability, water
temperature) as well as nutrients.
Catchment geology (represented by the REC geology class) appeared to influence periphyton –
environment relationships. Chla_92 was predictable across sites with catchments dominated by hard
sedimentary geology (HS geology class in the REC), with mean temperature and DIN as predictors.
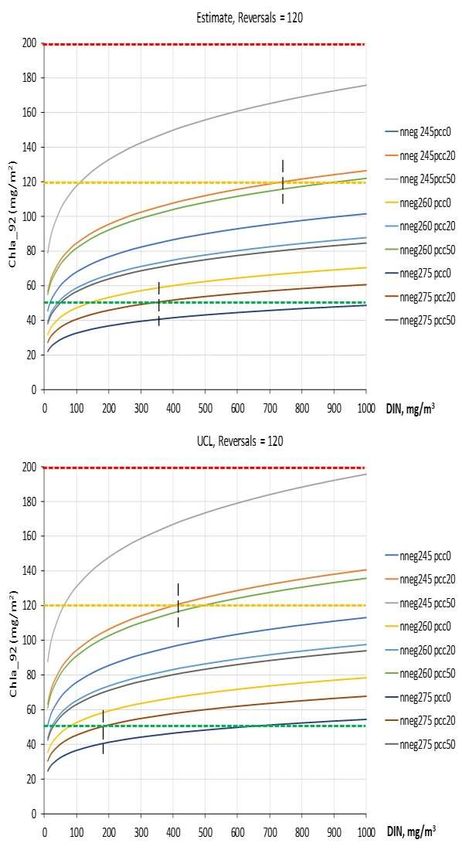
Preliminary nutrient criteria (both DRP and DIN) applicable to Chla_92 of 50, 120 and 200 mg/m3 (the
thresholds separating the NPS-FM periphyton bands) were derived using five relationships. Criteria
were read off look-up plots with each of the three Chla_92 values as the predicted value (the
estimate), and as the upper limit of the 95% confidence interval (i.e., a higher value than the
Periphyton growth in Northland rivers 7estimate associated with the same values of predictor variables). The latter provides more
conservative (i.e., restrictive) nutrient criteria, but increases confidence that the Chla_92 threshold
will not be exceeded.
Look-up diagrams are provided for all five relationships for a range of scenarios (where appropriate).
Calculations were performed in spreadsheets, which can be provided to NRC if required.
Q3: “Is Northland’s current periphyton monitoring programme fit for purpose, in relation to (a)
setting numeric freshwater periphyton objectives for Northland’s rivers, and (b) monitoring
progress towards the achievement of the freshwater objectives in the context of the NPS-FM?”
Related to question (b) (the primary purpose of the monitoring programme) we concluded that the
size of the programme (number of sites) is good compared to the size of the region. Site
representation appeared to be good, although a detailed assessment of representativeness was
beyond the scope of this project. Sample collection methods are adequate because they follow
standard procedures. Sample analysis methods (for chlorophyll a) are consistent with those used by
at least three other regions.
Related to question (a), we reviewed suitability of the dataset for model development by referring to
three steps towards development of nutrient limits suggested in MfE (2018): (1) select suitable
periphyton monitoring sites; (2) monitor periphyton; (3) collect data on controlling factors.
For step (1) we concluded that NRC’s periphyton dataset covers a reasonably good range of sites in
terms of flow variability and nutrient enrichment and is therefore already suitable for preliminary
development of periphyton – environment relationships (as presented in this report). However, the
number of sites lacking flow data constrained model development. For step (2), we considered that
this step was addressed by question (b) above. For step (3) the NRC dataset already includes data on
most of the important potential controllers of periphyton.
The following recommendations are aimed at improving the dataset, to enable development of more
reliable relationships for deriving nutrient criteria
▪ Derive modelled flow records to enable flow-based predictor variables to be calculated
for all sites. A first step would be to evaluate existing national predictions against
existing flow records in Northland.
▪ In view of the importance of water temperature as a predictor of Chla_92, consider
supplementing the existing monthly spot temperature measurements with continuous
water temperature logger data.
▪ A continuous variable to represent shade would be useful in view of the importance of
light at the streambed as a predictor of periphyton in previous studies.
8 Periphyton growth in Northland rivers1 Introduction
The National Policy Statement for Freshwater Management 2014 (NPS-FM) requires regional councils
to monitor a range of freshwater attributes defined in the National Objective Framework, as part of a
process of understanding, managing and improving the state of New Zealand’s fresh waters. The
state of ecosystem health in rivers is currently represented by the attribute for periphyton biomass
(i.e., attached algae growing on the beds of rivers). Some periphyton is a natural feature of rivers and
is an essential component of the riverine food web. However, over-abundant periphyton degrades
rivers from ecological, recreational and cultural perspectives.
The abundance of periphyton is primarily controlled by factors (such as nutrient supply and river flow
regime) that vary naturally but can also be related to human activities (Snelder et al. 2013).
Periphyton abundance (represented by biomass measured as chlorophyll a per unit area of river bed)
thus integrates the effects of nutrient availability, flows and other environmental variables such as
temperature and light on the river environment.
Nutrient attributes in the NPS-FM currently target protection of ecosystems from the toxic effects of
high concentrations of nitrate-N and ammoniacal-N. In 2017, the Government amended the NPS-FM
to require regional councils to “at least set appropriate instream concentrations and exceedance
criteria for dissolved inorganic nitrogen (DIN) and dissolved reactive phosphorus (DRP)” for the
purposes of managing periphyton biomass (NZ Government 2017). The amendment was added as a
“note” to the periphyton attribute. The note includes a direction to also take account of downstream
receiving environments. Guidance on how councils might set about achieving the requirements of
the note was provided by the Ministry for the Environment (MfE) in 2018 (MfE 2018).
The NPS-FM periphyton metric requires monthly time series of periphyton observations (as
chlorophyll a) for at least three years. Collection of other environmental data at the same monitoring
sites over that period also allows progress towards meeting the requirements of the periphyton
note, following some of the suggestions in the MfE guidance document (MfE 2018).
To fulfil its obligations in relation to the NPS-FM periphyton attribute, Northland Regional Council
(NRC) expanded its existing State-of-the-Environment periphyton monitoring programme, starting in
January 2015. NRC currently monitors 39 sites in the Northland region monthly for periphyton and
range of other variables. In mid-2018, NRC obtained Envirolink funding to enable NIWA to carry out
an analysis of data collected in the first three years of the monitoring programme. NRC requested
analysis to address the following questions.
1. Is there a problem with periphyton in Northland (as determined from exceedances of MfE
guidelines and breaches of the “national bottom line” (D band) of the periphyton attribute in
the National Policy Statement for Freshwater Management (NPS-FM))? The analysis will
include identification of problem sites for periphyton growth measured as both chlorophyll a
biomass and percentage cover and including cyanobacteria.
2. What are the major drivers of periphyton growth in Northland? In particular, what are the
roles of dissolved inorganic nitrogen (DIN), dissolved reactive phosphorus (DRP) and
ammoniacal-N (NH4-N) in driving periphyton and what are appropriate instream nutrient
criteria for Northland’s hard-bottomed rivers?
Periphyton growth in Northland rivers 93. Is there any correlation between chlorophyll a and periphyton cover data? Some sites
persistently have a high percentage of mat/filamentous cover but chlorophyll a seldom if ever
exceeds 200 mg/m2 (i.e., the national bottom line for periphyton). Can these sites be identified
by any other characteristics (e.g., geology)?
4. Is Northland’s current periphyton monitoring programme fit for purpose, in relation to (a)
setting numeric freshwater periphyton objectives for Northland’s rivers, and (b) monitoring
progress towards the achievement of the freshwater objectives in the context of the NPS-FM.
The third question above (relationships between chlorophyll a and cover) was separated off to be
addressed in a separate project. It is mentioned here because the four questions are closely related.
This report addresses questions 1, 2 and 4 and comprises the following sections.
Section 2 introduces the Northland periphyton dataset including a description of steps taken
to prepare the dataset for analysis.
In Section 3 we address question 1 above. Periphyton data were compared with guidelines and
assessments made of the state of individual sites and of the region.
Section 4 addresses part of question 2 above, focusing on the effect of rivers flow at individual
sites on periphyton (as chlorophyll a).
The response to Question 2 continues in Section 5, in which we explore relationships between
chlorophyll a (summarised over time as the 92nd percentile) and multiple variables including
flows, nutrients and water temperature. The outcomes of the analysis were cross-validated
models that showed some potential for use in developing nutrient criteria (as required by the
NPS-FM periphyton note) for Northland.
In Section 6, promising relationships are used to develop and suggest preliminary nutrient
targets applicable to certain river types in Northland.
In Section 7 the review of the monitoring programme requested in question 4 above is
provided.
A brief synthesis and summary of the main outcomes of the study is presented in Section 8,
along with a summary of recommendations.
10 Periphyton growth in Northland rivers2 The Northland periphyton dataset 2.1 Sampling sites The locations of 39 sites currently included in NRC’s monthly periphyton monitoring programme are shown in Figure 2-1 and listed in Table 2-1. For further details of monitoring sites, including summary water quality data, refer to Appendix A. 2.2 Periphyton data Northland Regional Council (NRC) provided periphyton and water quality data from 39 state of the environment monitoring sites. The record at eight sites began in 2008, with annual periphyton surveys in late summer (March), collecting biomass (chlorophyll a) data only. Between 2008 and 2011, annual summer data were available from up to 14 sites. No data from 2012 were provided. In 2013, data collection increased to quarterly (February, May, August and November) at 21 sites in 2013. In 2014, periphyton samples and data were collected monthly over summer at 22 sites (January, February, March, April and November), with a further 10 sites added sampled in November only. Monthly data collection commenced in January 2015 at 36 sites. Three sites were added to the programme in July 2016. Monthly periphyton data provided spanned January 2015 to May 2018. Periphyton data in both the quarterly and monthly datasets (i.e., from 2013 onwards) comprised chlorophyll a and a visual estimate of periphyton cover on the stream bed. Visual estimates were assessments of the percentage of periphyton cover on the stream bed in two categories: filamentous algae (% filaments) and periphyton mats (%mats). In addition, the percentage of the bed covered by potentially toxic cyanobacterial mats (i.e., Phormidium, now known as Microcoleus) was also recorded (%cyano). Cyanobacterial mats were a subset of periphyton mats (i.e., %mats included %cyano). When cover of the stream bed was less than 100% we assumed that the balance of cover was made up of either thin algal films or bare rock (no visible algae). In the present analysis, we focused mainly on the monthly dataset that started in January 2015. Data from 2013 and 2014 were assessed in the analysis of river state. Periphyton sample and data collection from 2013 onwards was carried out using the same methods, following methodology adapted from Biggs and Kilroy (2000) and Kilroy et al. (2008). 2.3 Nutrient and environmental data The NRC dataset included monthly measurements of a range of environmental variables that are known, from previous research, to influence periphyton growth. These included nutrient concentrations (dissolved inorganic nitrogen, DIN; dissolved reactive phosphorus, DRP; and total N and P, TN, TP), water temperature (spot temperatures in °C), electrical conductivity (EC), turbidity, and water clarity. An estimate of the composition of the substrate on the stream bed was also provided for each site. Substrate composition was assessed as percentage cover by bed particles in the following categories: bedrock (continuous), boulder (> 256 mm across), large cobbles (128 – 256 mm across), small cobbles (64 – 128 mm), gravel (32 – 63 mm), fine gravel (0.5 – 32 mm), sand (
Figure 2-1: Locations of the 39 periphyton monitoring sites in the Northland region. Sites are numbered 1
to 39, ordered from North to South. Refer to Table 2.1 for site details. Note that in the rest of the report, sites
are listed alphabetically in tables.

12                                                                           Periphyton growth in Northland rivers
Table 2-1:     List of sites included in the Northland periphyton monitoring programme. Sites are numbered
from north to south, corresponding to the map in Figure 2-1. Linked hydrological recording are shown. *Flow
data provided for these two sites was not current and could not be used in the analysis. Monthly data
collection started in January 2015 except for those marked ** (start dates March - July 2016).

 N                    Site name                 E          N               Linked hydrological recording site
1    Oruaiti at Windust Road               1654906     6125632
2    Stony Creek at Sawyer Road            1656071     6123396
3    Oruaiti at Sawyer Road                1655830     6121640
4    Kaeo at Dip Road                      1670326     6115833     2624*       Kaeo at Fire Station
5    Awanui at FNDC                        1625095     6113439     1316        Awanui at School Cut
6    Peria at Honeymoon Valley Road        1645966     6111291
7    Victoria at Victoria Valley Road      1637132     6110554     1351        Victoria at Victoria Valley Road
8    Tapapa at SH1 **                      1643752     6105453
9    Waipapa at Landing                    1688150     6103986
10   Mangamuka at Iwitaua Road             1649247     6103622
11   Kerikeri at Stone Store               1687631     6102447     3506        Maungaparerua at Tyrees Ford
12   Waipapa at Forest Ranger              1662582     6096421     47804       Waipapa at Forest Ranger
13   Waipapa at Waimate North Road         1682092     6095939
14   Waitangi at Waimate North Road        1681894     6093741     3725        Waitangi at Waimate North Road
15   Waitangi at SH10                      1686946     6093563     43602       Waitangi at SH10
16   Waiaruhe at Puketona                  1687317     6093001     3707*       Waiaruhe at Puketona
17   Watercress at SH1                     1687416     6086899
18   Pekepeka at Ohaeawai                  1680346     6086802
19   Waiaruhe d/s Mangamutu Confl.         1682873     6084561
20   Punaruku at Russell Road **           1719724     6083074
21   Waiharakeke at Stringers Road         1692604     6082806     3819        Waiharakaka at Willowbank
22   Punakitere at Taheke                  1660001     6075453     47595       Punakitere at Taheke
23   Waimamaku at SH12                     1640666     6064914
24   Mangakahia at Twin Bridges            1677333     6056762     46618       Mangakahia at Gorge
25   Mangahahuru at Main Road              1718886     6055192     46674       Mangahahuru at County Weir
26   Ngunguru at Coalhill Lane             1729072     6054775     4901        Ngunguru at Dugmores Rock
27   Waipoua at SH12                       1651633     6054443     46902       Waipoua at SH12
28   Mangakino at Mangakino Lane           1719727     6053270
29   Opouteke at Suspension Bridge         1678503     6049460     1046651 Opuoteke at Suspension Bridge
30   Waiarohia at Whau Valley              1717568     6048671
31   Pukenui at Kanehiana Drive **         1715556     6048444
32   Hatea at Mair Park                    1720284     6047290     5538        Hatea at Whareora Road
33   Waiarohia at Second Avenue            1719047     6046013     5527        Waiarohia at Lovers Lane
34   Waipao at Draffin Road                1701772     6045796     46641       Waipao at Draffin Road
35   Raumanga at Bernard Street            1718760     6044937     5528        Raumanga at Bernard Street
36   Kaihu at Gorge                        1661946     6042161     46611       Kaihu at Gorge
37   Otaika at Otaika Valley Road          1715476     6039940     5659        Otaika at Kay
38   Ruakaka at Flyger Road                1726626     6029623     5901        Ruakaka at Flygers Road
39   Hakaru at Topuni                      1734330     5992416     46020       Hakaru at Topuni Creek Farm

Periphyton growth in Northland rivers                                                                             13
2.4       Data preparation
Checks were carried out on the dataset prior to starting any analysis. Nutrient data were converted
from mg/L to mg/m3, to avoid multiple decimal places at low concentrations. Electrical conductivity
(EC) data were converted from mS/m to µS/cm, for consistency with data from other regions. We
noted that two sites (Hatea at Mair Park and Kerikeri at Stone Store) had very high EC values from
time to time. We confirmed with NRC that the outlying values were caused by tidal influence at the
sites. It was not possible to assign a typical mean EC at these sites1 and the sites were omitted from
analyses including EC as a predictor.

The following datasets were prepared.

Dataset A included all individual chlorophyll a observations at each site since 2013, along with the
available water quality variables from samples collected or measurements made
contemporaneously. There were 1637 chlorophyll a observations in total. Water quality observations
were made on the same day in 23% of cases, within 1 day in 57% of cases, and within 3 days in 80%
of cases. Water quality and periphyton data were collected more than 7 days apart in
3         Assessment of periphyton in Northland relative to the NPS-FM
          and other guidelines
In this section we provide an assessment of the state of periphyton in Northland rivers in relation to
national guidelines. NRC asked:

        “Is there a problem with periphyton in Northland (as determined from exceedances of MfE
        guidelines and breaches of the “national bottom line” (D band) of the periphyton attribute in
        the National Policy Statement for Freshwater Management (NPS-FM))? The analysis will
        include identification of problem sites for periphyton growth measured as both chlorophyll a
        biomass and percentage cover and including cyanobacteria.”

We mainly used the monthly time series data at the 39 SOE sites, starting in January 2015 to make
the assessments. For completeness, we also report exceedances of thresholds in the MfE 2000
guidelines (Biggs 2000) in the data collected in 2013 and 2014.

3.1       Periphyton standards
3.1.1 MfE 2000 guidelines
Guidelines for periphyton, measured as both coverage of the stream bed and as biomass (chlorophyll
a or ash-free dry mass (AFDM)) were set out by Biggs (2000). The guidelines applied to different
instream values and were “effects-based”. In other words, the biomass and cover thresholds were
shown to be linked to the values, which were aesthetics / recreation, trout habitat / angling and
benthic biodiversity (Table 3-1). We assessed all the Northland sites against each guideline, except
those that were specified in AFDM (for which there was no data).

3.1.2 NPS-FM
Currently, the key periphyton standards for assessing the ecological state of a site are those
described by the four bands of the periphyton attribute of the NPS-FM. The periphyton attribute
defines four bands (A to D), each of which is associated with a narrative on river state (New Zealand
Government 2017) (Table 3-1). The periphyton attribute requires that periphyton biomass is
measured as chlorophyll a and allows for two classes: default and productive.2 The metric for
assessing band membership in the default class is more than three exceedances of the threshold
separating the bands over a 36-month period of monthly monitoring (i.e., one exceedance per year,
on average, of the thresholds). The productive class is allowed one additional exceedance per year,
or more than six exceedances over a 36-month period of monthly monitoring.

None of the Northland sites fell into the “productive class”. Nine of the 39 sites are classified as
having dominant geology in the productive class (SS), but all sites are in the climate class WW (warm
wet).

The chlorophyll a thresholds separating the bands in the periphyton attribute are nominally the same
as those set by Biggs (2000) (Table 3-1), although the metric used is different.

2 Classes are defined according to types in the River Environment Classification (REC). The productive class includes sites at which
periphyton is expected to be naturally high because of naturally occurring high background concentrations of nutrients. The productive
class is defined by the combination of REC “Dry” Climate categories (i.e. Warm-Dry (WD) and Cool-Dry (CD)) and REC Geology categories
that have naturally high levels of nutrient enrichment due to their catchment geology (i.e. Soft-Sedimentary (SS), Volcanic Acidic (VA) and
Volcanic Basic (VB)). Therefore, the productive class is defined by the following REC defined types: WD/SS, WD/VB, WD/VA, CD/SS, CD/VB,
CD/VA. The default class includes all REC types not in the productive class.

Periphyton growth in Northland rivers                                                                                                    15
3.1.3 Cyanobacteria guideline
The New Zealand Guideline for Cyanobacteria (Wood et al. 2009) sets thresholds for percentage
cover by cyanobacteria for the protection of human and animal health in rivers. The predominant
species of cyanobacteria seen in New Zealand rivers is the potentially toxic Microcoleus autumnale
(formerly Phormidium autumnale). We assumed that percentage cover by cyanobacteria in the
dataset referred mainly to this species. The guidelines specify two levels:
Alert: 20−50 per cent coverage of potentially toxic cyanobacteria mats attached to substrate.
Attaining alert level at recreational sites is a trigger for more intensive monitoring of both
cover and levels of toxins.
Action: >50 per cent coverage of the substrate by potentially toxic cyanobacteria mats, or 3mm thick 60 %
Aesthetics / recreation values Max. cover, filaments < 2 cm long 30 %
Max. AFDM 35 g/m2
Maximum chlorophyll a 120 mg/m2
Benthic biodiversity Mean monthly chlorophyll a (over 12 months) 15 mg/m2
Maximum chlorophyll a 50 mg/m2
Trout habitat/angling Max. AFDM 35 g/m2
Maximum chlorophyll a (mats) 200 mg/m2
Maximum chlorophyll a (filaments) 120 mg/m2
Periphyton attribute, NPS-FM (NZ Government 2017)
Ecosystem health of rivers
Band A, negligible impact 8% exceedance (1 of 12), chlorophyll a
Band B, low impact Based on monthly samples, with min. data 50–120 mg/m2
series of 3 years (i.e., the 92nd percentile of
Band C, moderate impact chlorophyll a, subsequently referred to as 120–200 mg/m2
Chla_92)
Band D, below "bottom line" >200 mg/m2
New Zealand Guideline for Cyanobacteria (Wood et al. 2009)
Human/animal health: alert Max. cover, Microcoleus 20 %
Human/animal health: action Max. cover, Microcoleus 50 %
16 Periphyton growth in Northland rivers3.2 Methods 3.2.1 Treatment of missing periphyton data for assessments requiring data over time The wording in the periphyton attribute of the NPS-FM related to the period over which the grading is made is: “Based on a monthly monitoring regime. The minimum record length for grading a site based on periphyton (chl-a) is 3 years.” This is unambiguous and implies that the minimum data used for an assessment against the periphyton attribute must be 36 samples collected over three years (i.e., in every consecutive month). The wording also implies that periods of longer than three years can be used to assess state. The interpretation of the wording is important because the monthly time series at all Northland sites had sampling occasions on which no periphyton data were collected, hereafter termed “missing data”. Inclusion or exclusion of the missing data points can affect a grading, depending on how it is calculated. In practice, a small proportion of missing periphyton data should make little difference to the analysis because the metric of interest is close to the maximum value (a high percentile). However, at sites with high proportions of missing monthly datapoints (e.g., more than 20% missing), using the raw data without compensating for the missing data could lead to upward bias in chlorophyll a when assessments against the NPS-FM are made by calculating the 92nd percentile of chlorophyll a over the monitoring period. The alternative method of grading a site, by counting numbers of exceedances over periods of 36 months, is not affected by missing data if we make the reasonable assumption that periphyton abundance is always low when samples cannot be collected. The data were screened for missing data and the percentage missing was calculated for each site from the number of months in the monitoring period for which there was no data (see Appendix A). To compensate for missing data, we completed the time series at each site by inserting into each month with a value calculated as the 5th percentile of the observed values at that site. The 5th percentile of chlorophyll a across all measured values was
3.3    Results
3.3.1 MfE 2000 guidelines

Aesthetics / recreation values
There were no exceedances of either of the percentage cover thresholds at three sites over the
entire period of monitoring (Pukenui at Kanehiana Drive, Tapapa at SH1, Waipoua at SH12), although
monitoring at Pukenui has been underway only since mid-2016 (Table 3-2).

There was a single exceedance at two sites (Hatea at Mair Park, mats in 2015; Waitangi at SH10,
filaments in 2017) (Table 3-2). Highest rates of exceedance of the 30% filaments thresholds were at
Hakaru at Topuni, Opouteke at Suspension Bridge, Oruaiti at Sawyer Road and Waipapa at Landing.

Highest rates of exceedance of the 60% mats threshold were at Pekepeka at Ohaeawai and Waipapa
at Waimate North Road.

There was a higher rate of exceedances (i.e., lower compliance) in 2015 than in other years,
indicating more favourable conditions for accrual of periphyton cover in that period.

Benthic biodiversity
Mean monthly chlorophyll a over twelve months (adjusted for missing data) was below the threshold
of 15 mg/m2 in all three calendar years at four sites (Mangaharuru at Main Road, Mangamuka at
Iwitaua Road, Waipapa at Forest Ranger, Waipoua at SH12), and exceeded the threshold in all three
years at 13 sites (Table 3-3).

The most severe exceedance was in the Hakaru at Topuni, where mean chlorophyll a was at least 15
times the threshold in all three years with complete data. Other sites where mean chlorophyll a
exceeded the threshold at least four-fold were (in order, highest first) Awanui at FNDC, Waiharakeke
at Stringers Road, Opouteke at Suspension Bridge, Punakitere at Taheke, and Waipapa at Landing.

There was only one case where unadjusted data returned exceedance of the threshold, while
adjusted data did not (Waitangi at Waimate North Road in 2017, Table 3-3).

The threshold for maximum chlorophyll a (50 mg/m2) was exceeded at least once at 31 of 36 sites
(79%), 22 of 39 sites (56%) in 2016 and 19 of 39 sites (49%) in 2017 (Table 3-4). Highest rates of
exceedance (across all years) were at Hakaru at Topuni (27 exceedances) and Pekapeka at Ohaeawai
(16), Opouteke at Suspension Bridge (15), Waipapa at Landing (14).

Trout habitat and angling
Two sites (Hakaru at Topuni, Waiharakeke at Stringers Road) had persistent high chlorophyll a that
breached the Biggs (2000) thresholds of 120 and 200 mg/m2 in the three years with complete data.
The thresholds for maximum chlorophyll a of 120 and 200 mg/m2 were exceeded at least once at 21
and 11 of 36 sites (58% and 31% respectively) in 2015, 16 and seven of 39 sites (41% and 18%
respectively) in 2016, and at eight and three of 39 sites (21% and 8% respectively) in 2017 (Table
3-4). Note that we did not distinguish between chlorophyll a from mats and filaments, as specified in
the Biggs (2000) guideline, because cover was usually a mixture of mats and filaments and the main
source of chlorophyll a could not be determined.

18                                                                 Periphyton growth in Northland rivers
Table 3-2:    Numbers of exceedances of 30% cover by filaments and 60% cover by mats. Thresholds used to
assess compliance with the MfE 2000 guidelines for protection of aesthetics / recreation values. Grey shaded
panels indicate data from 2013 and 2014 (for completeness). A dash indicates no data. 2015 to 2018 are
calendar years. Blue shaded data indicate that the time series started part way through the year. *note that
2018 data are for five months only. Brown shaded cells show sites with high exceedance rates.

                                      Exceedances of 30% cover, filaments        Exceedances of 60% cover, mats
                 Site                2013 2014 2015 2016 2017 2018* 2013           2014 2015 2016 2017 2018*
Awanui at FNDC                        4     3      3      1      2
Hakaru at Topuni                      3     2      7      7      4      4                   4     1      4
Hatea at Mair Park                                                                          1
Kaeo at Dip Road                      -     -      2      1      2           -       -      1
Kaihu at Gorge                        2     1             2                                                       3
Kerikeri at Stone Store                            1      1                                 2
Mangahahuru at Main Road                    1                                                            1
Mangakahia at Twin Bridges            4     3      3      1      1                          2
Mangakino at Mangakino Lane           -     -                                -       -                   1
Mangamuka at Iwitaua Road             1     3      1      1                                 1
Ngunguru at Coalhill Lane             -     -             2                  -       -      1
Opouteke at Suspension Bridge         5     4      3      2      1      1                   6     1               1
Oruaiti at Sawyer Road                -     -      2      3      5      1    -       -      2
Oruaiti at Windust Road               -     -      5      1                  -       -
Otaika at Otaika Valley Road                1      2             2
Pekepeka at Ohaeawai                  -     -             4                  -       -      3     2      8        4
Peria at Honeymoon Valley Road        -     -      1             1           -       -
Pukenui at Kanehiana Drive            -     -      -                         -       -      -
Punakitere at Taheke                        2      2                    -                                         -
Punaruku at Russell Road              -     -      -                         -       -                   1        1
Raumanga at Bernard Street            -     -      4      1                  -       -      1
Ruakaka at Flyger Road                             1                                        1     2      2
Stony Creek at Sawyer Road            -     -      2                         -       -
Tapapa at SH1                         -     -      -                         -       -
Victoria at Victoria Valley Road      4     1      1                                 1      1
Waiarohia at Second Avenue            2     3      4      3      1                                2               2
Waiarohia at Whau Valley              2            1                                        1     1
Waiaruhe at Puketona                  -     -                                -       -      2            1
Waiaruhe d/s Mangamutu Confl.         -     -             1                  -       -      1            1
Waiharakeke at Stringers Road         2            2      1      1
Waimamaku at SH12                     -     1                    1           -                    1
Waipao at Draffin Road                      1      1      1      1
Waipapa at Forest Ranger                           1
Waipapa at Landing                    1     1      2      4      2      1                   2
Waipapa at Waimate North Road         -     -      1             1           -       -      6     2      3
Waipoua at SH12
Waitangi at SH10                      -     -                    1           -       -
Waitangi at Waimate North Road        1
Watercress at SH1                     -     -      6             1           -       -
      Total exceedances, all sites   31    27     58     37     27      7            1     38     12     22       11
   Percentage, all months & sites                12.4    7.9    6.2   11.7

Periphyton growth in Northland rivers                                                                                 19
Table 3-3: Mean annual chlorophyll a calculated for 2015, 2016 and 2017 at 39 Northland river sites.
Data from January to December in each year. Shaded cells indicate sites and year in which 15 mg/m 2 was
exceeded. Bold highlighted sites had overall mean Chl a > 60 mg/m2. Two means are provided for each year.
Chl a is the mean value of the available data in the 12-month period. Adj. Chl a is the mean value after the time
series was adjusted to compensate for all missing values using the method in Section 3.2.1. - = no data. Blue
shading indicates a part year of data.
2015 2016 2017
Site Chl a Adj Chl a Chl a Adj Chl a Chl a Adj Chl a
Awanui at FNDC 119 100 97 81 39 18
Hakaru at Topuni 282 261 279 238 387 239
Hatea at Mair Park 29 22 6 6 6 6
Kaeo at Dip Road 17 17 8 8 7 7
Kaihu at Gorge 32 28 64 64 24 24
Kerikeri at Stone Store 38 38 42 42 29 27
Mangaharuru at Main Road 7 7 13 13 8 8
Mangakahia at Twin Bridges 45 41 52 52 12 12
Mangakino at Mangakino Lane 39 39 5 4 4 4
Mangamuka at Iwitaua Road 11 11 3 3 11 8
Ngunguru at Coalhill Lane 37 34 27 27 21 21
Opouteke at Suspension Bridge 90 90 123 95 24 20
Oruaiti at Sawyer Road 68 57 28 28 34 29
Oruaiti at Windust Road 35 32 23 23 5 5
Otaika at Otaika Valley Road 66 61 28 28 14 14
Pekapeka at Ohaeawai 52 52 52 52 28 28
Peria at Honeymoon Valley Road 58 58 32 32 14 14
Pukenui at Kanehiana Drive - - 2 2 2 2
Punakitere at Taheke 113 86 53 33 5 5
Punaruku at Russell Road - - 4 4 3 3
Raumanga at Bernard Street 53 53 22 19 4 4
Ruakaka at Flyger Road 30 27 16 16 16 16
Stony Creek at Sawyer Road 34 31 8 8 3 3
Tapapa at SH1 - - 10 10 2 2
Victoria at Victoria Valley Road 17 17 7 7 10 10
Waiarohia at Second Avenue 60 56 34 34 21 21
Waiarohia at Whau Valley 40 40 35 30 9 9
Waiaruhe at Puketona 18 15 20 20 9 8
Waiaruhe d/s Mangamutu Confl. 52 52 13 13 2 2
Waiharakeke at Stringers Road 101 85 118 90 71 38
Waimamaku at SH12 20 18 15 13 24 16
Waipao at Draffin Road 27 23 25 25 20 20
Waipapa at Forest Ranger 14 14 5 5 6 6
Waipapa at Landing 63 63 76 76 49 42
Waipapa at Waimate North Road 16 16 18 18 13 12
Waipoua at SH12 8 8 3 3 2 2
Waitangi at SH10 28 21 3 2 3 2
Waitangi at Waimate North Road 15 15 2 2 18 9
Watercress at SH1 80 80 55 41 31 31
20 Periphyton growth in Northland riversTable 3-4: Numbers of exceedances of chlorophyll a thresholds from the 2000 periphyton guideline at each Northland periphyton monitoring site, by year. Grey-shaded
panels indicate 2013 and 2014, when periphyton surveys were quarterly. A dash indicates no data. 2015 to 2018 are calendar years. Blue shaded cells indicate that the monthly
time series for that site started part way through the year. *note that 2018 data are for five months only.
Exceedances of 50 mg/m2 Exceedances of 120 mg/m2 Exceedances of 200 mg/m2
Site 2013 2014 2015 2016 2017 2018* 2013 2014 2015 2016 2017 2018* 2013 2014 2015 2016 2017 2018*
Awanui at FNDC 1 2 3 5 2 1 3 4 1 1
Hakaru at Topuni 2 1 10 9 6 2 1 1 8 7 4 1 1 3 4 4 1
Hatea at Mair Park 1 2 1
Kaeo at Dip Road - - 1 - - - -
Kaihu at Gorge 1 1 3 5 2 1 2 1
Kerikeri at Stone Store 4 3 1 1 1
Mangahahuru at Main Road
Mangakahia at Twin Bridges 1 4 3 5 1 1 1 2 - - 1
Mangakino at Mangakino Lane - - 3 - - 1
Mangamuka at Iwitaua Road 1 1
Ngunguru at Coalhill Lane - - 3 4 1 1 - - 1 - -
Opouteke at Suspension Bridge 1 2 7 5 1 2 1 1 5 2 1 1 1
Oruaiti at Sawyer Road - - 3 1 3 - - 2 - - 1
Oruaiti at Windust Road - - 2 2 - - 1 1 - -
Otaika at Otaika Valley Road 2 4 1 2 2 1 1
Pekepeka at Ohaeawai - - 6 4 2 4 - - 1 1 - -
Peria at Honeymoon Valley Road - - 4 3 1 - - 1 1 1 - - 1
Pukenui at Kanehiana Drive - - - - - - - - -
Punakitere at Taheke 5 2 2 1 2 1
Punaruku at Russell Road - - - - - - - - -
Raumanga at Bernard Street 3 1 2 1
Ruakaka at Flyger Road 2 1 1 1 1
Stony Creek at Sawyer Road - - 3 - - - -
Tapapa at SH1 - - - - - - - - -
Victoria at Victoria Valley Road 1 2 1
Waiarohia at Second Avenue 3 7 2 1 1 2 1 1
Waiarohia at Whau Valley 4 3 1
Waiaruhe at Puketona - - 1 2 1 1 - - 1 - -
Periphyton growth in Northland rivers 21Exceedances of 50 mg/m2 Exceedances of 120 mg/m2 Exceedances of 200 mg/m2
Site 2013 2014 2015 2016 2017 2018* 2013 2014 2015 2016 2017 2018* 2013 2014 2015 2016 2017 2018*
Waiaruhe d/s Mangamutu Confl. - - 3 1 1 - - 1 - - 1
Waiharakeke at Stringers Road 5 3 3 4 3 1 2 3 1
Waimamaku at SH12 - 1 1 - 1 -
Waipao at Draffin Road 1 2 2 1 1 1
Waipapa at Forest Ranger
Waipapa at Landing 5 5 2 2 1 4 2 1 1
Waipapa at Waimate North Road - - - - - -
Waipoua at SH12 1
Waitangi at SH10 - - 1 - - - -
Waitangi at Waimate North Road 1
Watercress at SH1 - - 6 4 1 - - 4 2 1 - - 1 1
Total exceedances, all sites 7 18 109 73 33 17 3 8 44 34 12 3 1 1 15 12 6 1
Total sites with exceedances 31 23 20 11 21 16 8 3 11 7 3 1
22 Periphyton growth in Northland rivers3.3.2 NPS-FM periphyton attribute Sixteen sites each were placed in bands A and B, five sites were placed in band C and two sites in Band D (below the bottom line) (Hakaru at Topuni and Waiharakeke at Stringers Road) (Table 3-5). These assessments were consistent with those obtained using numbers of exceedances in the 36- month period from January 2015 to December 2017. Using unadjusted data, one additional site (Punakitere at Taheke) would have been placed in Band D of the periphyton attribute of the NPS-FM. We suggest that methods that assess sites against the NPS-FM periphyton attribute bands from calculations of the 92nd percentile of chlorophyll a should not be used unless the data are adjusted to allow for missing values. 3.3.3 Cyanobacteria guideline Between January 2015 and May 2018, there were 17 exceedances of the Alert level of the cyanobacteria guideline and five exceedances of the Action level (Table 3-6). Thirteen of the 39 monitoring sites were affected and at seven of these there was just one exceedance over the 42- month monitoring period. One site (Ruakaka at Flyger Road) had exceedances in three years. Three sites had exceedances in two years: Kerikeri at Stone Store, Ngunguru at Coalhill Lane, Opouteke at Suspension Bridge. Most exceedances were in 2015 (10 Alerts and three Actions). Nine sites were affected in 2015, one of which (Waiaruhe d/s Mangamutu Confl.) had three exceedances, including two exceedances of the Action level. Cyanobacteria was more widespread that than the guideline exceedances indicated, with 32 of the 39 monitoring sites having some cover by cyanobacteria at least once between January 2015 and May 2018. Across all sites, cover by cyanobacteria was recorded in 249 of 1642 visual estimate surveys (~15%). Cover ranged from 70%, the latter in the Kerikeri at Stone Store. 3.3.4 Overall state of Northland rivers relative to periphyton standards Percentages of sites not complying with the MfE guidelines over the period of monthly monitoring (January 2015 to May 2018) ranged from 90% (35 of 39 sites) for the most stringent standard (mean chlorophyll a to protect benthic biodiversity) to 33% for the highest threshold (maximum chlorophyll a) (Table 3-7). Thirty-two sites (82%) were graded into bands A or B of the NPS-FM periphyton attribute, five (13%) into band C and two (5%) into band D (Table 3-7). Note that the number of sites exceeding 200 mg/m2 in the MfE guidelines was much higher than the number of sites below graded into band D of the NPS-FM because just one exceedance breaches the MfE guideline, whereas the NPS-FM requires at least three exceedances over three years. Over the whole monitoring period, one-third of all sites exceeded the Alert level of the cyanobacteria guideline, and 10% of sites exceeded the Action level at least once. All exceedances of the guideline Action level were in 2015 and 2016 (Table 3-7). The sites with highest cover by cyanobacteria were not necessarily the sites that exceeded the MfE guidelines or were graded into bands C or D of the NPS-FM. Periphyton growth in Northland rivers 23
Table 3-5:     Assignment of 39 sites in Northland to bands of the periphyton attribute of the NPS-FM.
Gradings (blue, A; green, B; amber, C; red, D) were calculated using two methods. 1. Samples within the ranges
specified for each band were counted (see Table 3-1). More than three samples in the range places the site in
bands D, C or B. A site is in band A when ≤ 3 samples exceed 50 mg/m2 in a three-year period. 2. TChla_92 was
calculated over the whole time series. The “Adjust.” Column shows the result after taking account of missing
data (see Section 3.2.1). The result for Punakitere at Takehe illustrates that adjustment is needed to obtain
consistent results. ** Provisional grading as less than 3 years of data available.

                                       N samples in range of Band                 N                    Chla_92
                  Site                A       B        C        D       samples       surveys   Unadj.      Adjust.
 Awanui at FNDC                      16        3       5            2     26            30      186.2        173.5
 Hakaru at Topuni                     6        7       8        11        33            34      744.6        717.0
 Hatea at Mair Park                  35        1       1                  37            37       15.6        14.7
 Kaeo at Dip Road                    38        1                          39            40       26.8        26.8
 Kaihu at Gorge                      27        9       1            1     38            39       66.9        66.9
 Kerikeri at Stone Store             30        8       1                  39            40       63.5        63.5
 Mangahahuru at Main Road            39                                   39            40       22.6        22.6
 Mangakahia at Twin Bridges          29        5       2            1     37            40      102.4        96.9
 Mangakino at Mangakino Lane         37        2       1                  40            40       38.1        38.1
 Mangamuka at Iwitaua Road           36        1                          37            38       23.6        22.1
 Ngunguru at Coalhill Lane           29        8       1                  38            40       77.3        77.4
 Opouteke at Suspension Bridge       17        7       6            2     32            35      167.5        153.7
 Oruaiti at Sawyer Road              27        5       1            1     34            37      108.0        106.7
 Oruaiti at Windust Road             34        2       2                  38            38       63.5        61.7
 Otaika at Otaika Valley Road        35        2       2            1     40            40       67.3        52.6
 Pekapeka at Ohaeawai                25       14       2                  41            41       88.6        85.4
 Peria at Honeymoon Valley Road      33        5       2            1     41            41      108.6        110.3
 Pukenui at Kanehiana Drive **       23                                   23            23
 Punakitere at Taheke                14        4                    3     21            26      203.3        132.8
 Punaruku at Russell Road **         22                                   22            23       8.6             8.9
 Raumanga at Bernard Street          35        1       3                  39            40       79.8        46.7
 Ruakaka at Flyger Road              35        4       1                  40            40       63.7        63.1
 Stony Creek at Sawyer Road          37        3                          40            40       24.3        24.6
 Tapapa at SH1 **                    21                                   21            22       5.9             5.1
 Victoria at Victoria Valley Road    36        3                          39            40       30.6        30.6
 Waiarohia at Second Avenue          28       10       1                  39            40      112.7        112.7
 Waiarohia at Whau Valley            33        6       1                  40            40       65.9        65.9
 Waiaruhe at Puketona                33        4       1                  38            38       54.7        54.4
 Waiaruhe d/s Mangamutu Confl.       28        4                    1     33            35       82.4        52.1
 Waiharakeke at Stringers Road       17        3       2            6     28            30      291.1        250.5
 Waimamaku at SH12                   32        1       1                  34            35       33.8        30.1
 Waipao at Draffin Road              33        3       2                  38            39       54.2        54.2
 Waipapa at Forest Ranger            39                                   39            38       32.0        31.7
 Waipapa at Landing                  24        6       7            1     38            39      160.3        160.3
 Waipapa at Waimate North Road       39                                   39            40       34.4        34.4
 Waipoua at SH12                     40        1                          41            41       4.2             4.3
 Waitangi at SH10                    24        1                          25            27       37.2        29.8
 Waitangi at Waimate North Road      30        1                          31            34       35.6        31.9
 Watercress at SH1                   24        4       5            2     35            37      155.7        154.3

24                                                                        Periphyton growth in Northland rivers
Table 3-6: Summary of exceedances of the cyanobacteria guidelines. Years are calendar years. Numbers of
exceedances are shown. Green cells = acceptable (< 20% cover); amber cells = alert (20 – 50% cover); red cells =
action (>50% cover). Blue shading indicates that monitoring started part way through the year. - = no data.
*2018 data from January to May only.
2015 2016 2017 2018*
Site Alert Action Alert Action Alert Action Alert Action
Awanui at FNDC
Hakaru at Topuni
Hatea at Mair Park
Kaeo at Dip Road
Kaihu at Gorge 1
Kerikeri at Stone Store 1 1
Mangahahuru at Main Road
Mangakahia at Twin Bridges 1
Mangakino at Mangakino Lane
Mangamuka at Iwitaua Road
Ngunguru at Coalhill Lane 1 1
Opouteke at Suspension Bridge 1 1
Oruaiti at Sawyer Road 1
Oruaiti at Windust Road
Otaika at Otaika Valley Road
Pekepeka at Ohaeawai
Peria at Honeymoon Valley Road
Pukenui at Kanehiana Drive - -
Punakitere at Taheke 1
Punaruku at Russell Road - -
Raumanga at Bernard Street
Ruakaka at Flyger Road 2 1 1
Stony Creek at Sawyer Road
Tapapa at SH1 - -
Victoria at Victoria Valley Road
Waiarohia at Second Avenue
Waiarohia at Whau Valley
Waiaruhe at Puketona
Waiaruhe d/s Mangamutu Confl. 1 2
Waiharakeke at Stringers Road 2
Waimamaku at SH12
Waipao at Draffin Road
Waipapa at Forest Ranger
Waipapa at Landing
Waipapa at Waimate North Road 1
Waipoua at SH12
Waitangi at SH10 1
Waitangi at Waimate North Road 1
Watercress at SH1
Grand Total 10 3 3 2 2 2
Periphyton growth in Northland rivers 25Table 3-7: Summary of compliance with MfE periphyton guidelines, NPS-FM grading, and compliance with
cyanobacteria guidelines in Northland. NPS-FM band assessed based on data from 2015-17 only. *Note that
three sites in band A were assessed provisionally from less than the required 36 months of data.
Percentage sites compliant in period
Threshold or
Guideline or standard Metric 2015 -18 2015 2016 2017 2018*
range
MfE guidelines: New Zealand Periphyton Guideline (Biggs 2000)
Aesthetics / recreation Maximum % cover, mats 60% 38 50 79 77 87
Max. cover, filaments 30% 23 33 54 59 89
Benthic biodiversity Mean monthly chl a (12 mo) 15 mg/m2 10 11 36 62 -
Max. chlorophyll a 50 mg/m2 15 14 41 49 71
Trout habitat/angling Max. chlorophyll a 200 mg/m2 67 69 82 92 97
Max. chlorophyll a 120 mg/m2 33 42 59 79 92
Periphyton attribute, NPS-FM (NZ Government 2017)
Band A 8% exceedance (1 of 12),
Band B chlorophyll a; based on 50–120 mg/m2 41
Band C monthly samples, for 120–200 mg/m2 13
minimum of 3 years
Band D >200 mg/m2 5
New Zealand Guideline for Cyanobacteria (Wood et al. 2009)
Cyanobacteria alert Max. cover, Microcoleus 20% 67 74 92 95 95
Cyanobacteria action Max. cover, Microcoleus 50% 90 92 95 100 100
3.4 Discussion
3.4.1 Is there a problem with periphyton in Northland?
Returning to the question:
Is there a problem with periphyton in Northland (as determined from exceedances of MfE
guidelines and breaches of the “national bottom line” (D band) of the periphyton attribute in
the National Policy Statement for Freshwater Management (NPS-FM))?
the analysis indicated that two sites (Hakaru at Topuni and Waiharakeke at Stringers Road)
consistently exceeded the MfE guidelines in all years and also fell below the national bottom line of
the NPS periphyton attribute. These two sites could therefore be defined as “problem sites”. In
particular, periphyton in the Hakaru at Topuni far exceeded the thresholds for all MfE guidelines and
the NPS-FM bottom line.
Four of the five sites graded as band C of the of the NPS-FM periphyton attribute also exceeded the
MfE guidelines for maintenance of ecosystem health in all years. The exception was Punakitere at
Taheke, at which the MfE guidelines were met in 2017 but not in 2016. We also noted periphyton
exceeded 200 mg/m2 at least once in the monitoring period at all five sites graded as band C.
Therefore, there is potential for these sites to fall into band D in other periods when flow conditions
are different (see Section 3.4.2 below).
26 Periphyton growth in Northland riversYou can also read