Effects of Climate and Land-Use Change on Thermal Springs Recharge-A System-Based Coupled Surface-Water and Groundwater-Flow Model for Hot Springs ...
←
→
Page content transcription
If your browser does not render page correctly, please read the page content below
Prepared in cooperation with the National Park Service

Effects of Climate and Land-Use Change on Thermal Springs
Recharge—A System-Based Coupled Surface-Water and
Groundwater-Flow Model for Hot Springs National Park,
Arkansas

Scientific Investigations Report 2021–5045

U.S. Department of the Interior
U.S. Geological Survey
Cover. Photograph showing a spring at Hot Springs, Arkansas.
Effects of Climate and Land-Use Change
on Thermal Springs Recharge—A
System-Based Coupled Surface-Water and
Groundwater-Flow Model for Hot Springs
National Park, Arkansas

By Rheannon M. Hart, Scott J. Ikard, Phillip D. Hays, and Brian R. Clark

Prepared in cooperation with the National Park Service

Scientific Investigations Report 2021–5045

U.S. Department of the Interior
U.S. Geological Survey
U.S. Geological Survey, Reston, Virginia: 2021 For more information on the USGS—the Federal source for science about the Earth, its natural and living resources, natural hazards, and the environment—visit https://www.usgs.gov or call 1–888–ASK–USGS. For an overview of USGS information products, including maps, imagery, and publications, visit https://store.usgs.gov/. Any use of trade, firm, or product names is for descriptive purposes only and does not imply endorsement by the U.S. Government. Although this information product, for the most part, is in the public domain, it also may contain copyrighted materials as noted in the text. Permission to reproduce copyrighted items must be secured from the copyright owner. Suggested citation: Hart, R.M., Ikard, S.J., Hays, P.D., and Clark, B.R., 2021, Effects of climate and land-use change on thermal springs recharge—A system-based coupled surface-water and groundwater-flow model for Hot Springs National Park, Arkansas: U.S. Geological Survey Scientific Investigations Report 2021–5045, 38 p., https://doi.org/10.3133/ sir20215045. Associated data for this publication: Hart, R.M., and Ikard, S.J., 2021, Model inputs and outputs for simulating and predicting the effects of climate and land-use changes on thermal springs recharge—A system-based coupled surface-water and groundwater-flow model for Hot Springs National Park, Arkansas: U.S. Geological Survey data release, https://doi.org/10.5066/P9SBJVVL. ISSN 2328-0328 (online)
iii

Acknowledgments
The authors would like to thank the National Park Service for their support in conducting this
research. Without their concern and desire to protect and preserve the springs at Hot Springs
National Park, this research would have been inessential. The authors would also like to grate-
fully and sincerely thank Dr. Jeff Connelly, Professor of Structure, Tectonics, and Engineering
Geology at the University of Arkansas at Little Rock, for his help with the hydrogeologic frame-
work beneath Hot Springs National Park. Without his generous help, the hydrogeologic frame-
work depicted herein would not have been nearly as detailed or representative. Work on this
project was conducted when R.M. Hart was employed by the U.S. Geological Survey.
v

Contents
Acknowledgments����������������������������������������������������������������������������������������������������������������������������������������iii
Abstract�����������������������������������������������������������������������������������������������������������������������������������������������������������1
Introduction����������������������������������������������������������������������������������������������������������������������������������������������������1
     Purpose and Scope������������������������������������������������������������������������������������������������������������������������������2
     Previous Investigations�����������������������������������������������������������������������������������������������������������������������2
     Geologic Description of Study Area��������������������������������������������������������������������������������������������������3
     Hydrogeologic Description of Study Area����������������������������������������������������������������������������������������5
Delineation of the Recharge Area��������������������������������������������������������������������������������������������������������������7
PRMS Model Development��������������������������������������������������������������������������������������������������������������������������9
     PRMS Model Climate Inputs���������������������������������������������������������������������������������������������������������������9
     PRMS Model Parameters��������������������������������������������������������������������������������������������������������������������9
     Calibration of the PRMS Model��������������������������������������������������������������������������������������������������������10
     PRMS Model Results�������������������������������������������������������������������������������������������������������������������������10
     Coupling of the PRMS and MODFLOW Models�����������������������������������������������������������������������������12
MODFLOW Groundwater-Flow Model Development�����������������������������������������������������������������������������13
     MODFLOW Model Discretization and Framework������������������������������������������������������������������������13
     Boundary Conditions in the MODFLOW Model�����������������������������������������������������������������������������14
     Calibration of the MODFLOW Model�����������������������������������������������������������������������������������������������23
     Sensitivity of the MODFLOW Model������������������������������������������������������������������������������������������������25
     Particle Tracking���������������������������������������������������������������������������������������������������������������������������������26
MODFLOW Model Simulations������������������������������������������������������������������������������������������������������������������29
Model Assumptions and Limitations��������������������������������������������������������������������������������������������������������33
Summary�������������������������������������������������������������������������������������������������������������������������������������������������������34
References Cited�����������������������������������������������������������������������������������������������������������������������������������������36

Figures
         1.     Map showing the locations of the Gulpha Creek streamgage, Hot Springs
                thermal springs, Hot Springs watershed and surrounding area streams,
                hydrologic response units delineating the Precipitation-Runoff Modeling
                System model boundaries, approximate recharge area, well heads H1–H9,
                MODFLOW groundwater-flow model boundary, the city of Hot Springs, and the
                Hot Springs National Park boundary, Arkansas����������������������������������������������������������������������4
         2.     Map showing the regional surficial geology controlling hydrogeologic
                processes in Hot Springs National Park with decimated MODFLOW
                groundwater-flow model grid�����������������������������������������������������������������������������������������������������6
         3.     Map showing locations of formations contributing to the estimated recharge
                area for the Hot Springs thermal springs and elevations of the recharge area
                near Hot Springs National Park, Arkansas�������������������������������������������������������������������������������8
         4.     Graph showing simulated and measured daily mean streamflow at U.S.
                Geological Survey streamgage 07358550, Gulpha Creek at Hot Springs,
                Arkansas, August 14, 2009–December 31, 2014���������������������������������������������������������������������13
         5.     Graph showing annual mean precipitation time series used as
                Precipitation-Runoff Modeling System (PRMS) model input, and
vi
PRMS-simulated annual mean runoff and recharge for the simulation period
1980–2014 for the Hot Springs National Park and surrounding area, Arkansas��������������14
6. Map showing Precipitation-Runoff Modeling System-simulated annual
mean recharge in individual hydrologic response units for use in the
groundwater-flow model of the Hot Springs National Park and surrounding
area, Arkansas����������������������������������������������������������������������������������������������������������������������������15
7. Map showing recharge simulated by the Hydrologic Evaluation of Landfill
Performance v. 3 model for the Hot Springs National Park and surrounding
area, Arkansas����������������������������������������������������������������������������������������������������������������������������17
8. Map showing annual mean recharge simulated by the Soil-Water-Balance
model for the Hot Springs National Park and surrounding area, Arkansas���������������������18
9. Three-dimensional hydrogeologic framework and model grid of the MODFLOW
groundwater-flow model: MODFLOW groundwater-flow model framework
showing surficial and subsurface geology, and MODFLOW groundwater-flow
model framework showing subsurface geology�������������������������������������������������������������������19
10. River network showing cells of the top layer of the model grid used as
nonlinear head-dependent flux boundaries for the Hot Springs National Park
study area, Arkansas�����������������������������������������������������������������������������������������������������������������20
11. Examples of Precipitation-Runoff Modeling System-simulated recharge applied
to the top layer of the MODFLOW model grid for the Hot Springs National Park
study area, Arkansas�����������������������������������������������������������������������������������������������������������������21
12. Simplified diagram of the conceptual groundwater-flow path between the
recharge location and the thermal springs in the MODFLOW groundwater-flow
model, from which the starting heads in each cell of the model grid and the
reference heads in the general head boundary cells were computed�����������������������������22
13. Distribution of starting heads in the model grid calculated from equation 12 and
derived from the simplified conceptual model of the groundwater-flow system
shown in figure 12 for the Hot Springs National Park and surrounding area,
Arkansas��������������������������������������������������������������������������������������������������������������������������������������24
14. Sensitivity matrices showing the sensitivity of simulated equivalents to
parameter values for the Hot Springs National Park and surrounding area,
Arkansas��������������������������������������������������������������������������������������������������������������������������������������27
15. Forward and backward particle-tracking simulations produced from the
calibrated MODFLOW groundwater-flow model�������������������������������������������������������������������28
16. Simulated heads in the model grid corresponding to the calibration solution for
the Hot Springs National Park and surrounding area, Arkansas���������������������������������������30
17. Graph showing linear relation between recharge supplied to the
groundwater-flow system and spring flows simulated by the calibrated model
for the Hot Springs National Park study area, Arkansas�����������������������������������������������������33
Tables
1. Summary of calibrated values for selected hydrology parameters for the
Precipitation-Runoff Modeling System�����������������������������������������������������������������������������������11
2. Summary of model-fit statistics for calibration of the Precipitation-Runoff
Modeling System model������������������������������������������������������������������������������������������������������������12
3. Simulated recharge values, obtained by using the Rorabaugh code, for U.S.
Geological Survey streamgages near the Hot Springs National Park and
surrounding area, Arkansas�����������������������������������������������������������������������������������������������������16vii
4. Summary of calibrated model parameters by geologic formation in the Hot
Springs National Park and surrounding area, Arkansas�����������������������������������������������������23
5. Summary of hydraulic heads in wells in the Hot Springs National Park and
surrounding area, Arkansas�����������������������������������������������������������������������������������������������������25
6. Comparison of median values of starting heads and simulated heads by
formation in the Hot Springs National Park and surrounding area, Arkansas�����������������29
7. Summary of inputs and outputs of water and associated mass balances for Hot
Springs National Park MODFLOW groundwater-flow model simulations using
PRMS-simulated recharge grids as stresses to the groundwater-flow system��������������31
Conversion Factors
U.S. customary units to International System of Units
Multiply By To obtain
Length
inch (in.) 2.54 centimeter (cm)
inch (in.) 25.4 millimeter (mm)
foot (ft) 0.3048 meter (m)
mile (mi) 1.609 kilometer (km)
yard (yd) 0.9144 meter (m)
Area
square mile (mi2) 2.590 square kilometer (km2)
Volume
acre-foot (acre-ft) 1,233 cubic meter (m3)
Flow rate
foot per second (ft/s) 0.3048 meter per second (m/s)
foot per year (ft/yr) 0.3048 meter per year (m/yr)
cubic foot per second (ft3/s) 0.02832 cubic meter per second (m3/s)
cubic foot per day (ft3/d) 0.02832 cubic meter per day (m3/d)
inch per year (in/yr) 25.4 millimeter per year (mm/yr)
Pressure
pound per square foot (lb/ft2) 0.04788 kilopascal (kPa)
Density
pound per cubic foot (lb/ft3) 16.02 kilogram per cubic meter (kg/m3)
pound per cubic foot (lb/ft3) 0.01602 gram per cubic centimeter (g/cm3)
Transmissivity
foot squared per day (ft2/d) 0.09290 meter squared per day (m2/d)
Temperature in degrees Celsius (°C) may be converted to degrees Fahrenheit (°F) as follows:
°F = (1.8 × °C) + 32.viii
Datum
Vertical coordinate information is referenced to the North American Vertical Datum of 1988
(NAVD 88).
Horizontal coordinate information is referenced to the North American Datum of 1983 (NAD 83).
Elevation, as used in this report, refers to distance above the vertical datum.
Supplemental Information
Concentrations of chemical constituents in water are given in milligrams per liter (mg/L).
Abbreviations
CMIP5 Phase 5 Coupled Model Intercomparison Project
GCM global climate model
GHB general head boundary
HELP3 Hydrologic Evaluation of Landfill Performance v. 3
hk horizontal hydraulic conductivity
HRU hydrologic response unit
PRMS Precipitation-Runoff Modeling System
Qs simulated equivalent spring flows
RCP Representative Concentration Pathway
R2 coefficient of determination
RMSE root mean square error
RORA Rorabaugh (model)
SSURGO Soil Survey Geographic database (U.S. Department of Agriculture)
SWB Soil-Water-Balance (model)
TDS total dissolved solids
USGS U.S. Geological Survey
vka vertical hydraulic conductivityEffects of Climate and Land-Use Change on Thermal
Springs Recharge—A System-Based Coupled
Surface-Water and Groundwater-Flow Model for Hot
Springs National Park, Arkansas
By Rheannon M. Hart, Scott J. Ikard, Phillip D. Hays, and Brian R. Clark
0.6–0.9 mile of the thermal springs. Forward particle tracking
Abstract indicated a recharge area southwest of the thermal springs that
corresponded to a location where the predominant litholo-
A three-dimensional hydrogeologic framework of the gies are the Arkansas Novaculite, Hot Springs Sandstone, and
Hot Springs anticlinorium beneath Hot Springs National Park, Bigfork Chert. Backward particle tracking indicated a second
Arkansas, was constructed to represent the complex hydroge- localized area of recharge to the northeast of the thermal
ology of the park and surrounding areas to depths exceeding springs that corresponded to a location where the dominant
9,000 feet below ground surface. The framework, composed lithology is the Bigfork Chert. The groundwater-flow model
of 6 rock formations and 1 vertical fault emplaced beneath indicated that the most probable recharge formations are
the thermal springs, was discretized into 19 layers, 429 rows, the Arkansas Novaculite, Bigfork Chert, and Hot Springs
and 576 columns and incorporated into a 3-dimensional Sandstone.
steady-state groundwater-flow model constructed in The simulated effects of climate and land-use changes
MODFLOW-2005. Historical daily mean thermal spring on the variability of the spring-flow rates at the thermal
flows were simulated for one stress period of approximately springs generally resulted in reductions of thermal spring flow
34 years (1980–2014), chosen to represent the period of record attributed to urban development and more extreme climates
for historical climate data used in the quantification of the characterized by elevated mean surface air temperatures. The
boundary conditions. The groundwater-flow model was manu- groundwater-flow model predicted a linear relation between
ally calibrated to historical daily mean thermal spring flows the thermal spring discharge and the cumulative recharge vol-
of 88,000 cubic feet per day observed over a 12-year period ume applied to the hydrogeologic framework, and the positive
of record (1990–1995 and 1998–2005) at the thermal springs slope of the predicted relation between recharge and simulated
collection system. Calibration was achieved by calculating
thermal spring flow indicates that more extreme precipita-
starting heads and general head boundary conditions from tion events that supply more recharge may in fact increase the
the Bernoulli equation and then adjusting the horizontal and thermal spring-flow rates.
vertical hydraulic conductivities of the rock formations and
vertical fault and the hydraulic conductance of head-dependent
flux boundaries. The groundwater-flow model was coupled to
a surface-water model developed in the Precipitation-Runoff Introduction
Modeling System (PRMS) by using PRMS-simulated gravity
drainage as a specified flux recharge boundary condition in the Hot Springs Reservation was established by the U.S.
groundwater-flow model. Together, the coupled models were Congress in 1832 and was designated as Hot Springs National
used to (1) locate the areas of groundwater recharge to the Park in 1921 to protect the artesian thermal springs that dis-
thermal springs in the discretized hydrogeologic framework charge from the southwestern slope of Hot Springs Mountain
by using forward and reverse particle-tracking capabilities of (Petersen and Mott, 2002). Hot Springs National Park, located
MODPATH, (2) simulate the effects of variable recharge rates in Hot Springs, Arkansas, features 47 artesian thermal springs
on the spring flows at the thermal springs, and (3) assess pos- that have been designated as significant geothermal features by
sible effects of climate and land-use change on the long-term the Geothermal Steam Act Amendments of 1988 (Petersen and
variability of spring flows at the thermal springs. Mott, 2002), in addition to several cold-water springs and a
Forward and backward particle-tracking maps indicated National Historic Landmark known as “Bathhouse Row” that
that the most prevalent areas of recharge in the discretized provides facilities for recreational use of the thermal spring-
hydrogeologic framework used in this study were within about water. The springwater is channeled through a single gage into2 Effects of Climate and Land-Use Change on Thermal Springs Recharge, Hot Springs National Park, Arkansas
a collection system (Yeatts, 2006), and most is conveyed to development of a coupled surface-water and groundwater-flow
the bathhouses that line Bathhouse Row, in addition to a few model to serve as an investigative tool to support continued
select hotels. A smaller portion of the springwater is diverted research.
to three separate public-use fountains. The thermal springs This report addresses these identified gaps in the
are therefore a source of public recreation and are the primary scientific apperception of the thermal springs at Hot
features upon which the park, the unique cultural setting, and Springs National Park by using coupled surface-water and
the local tourism-based economy of the city of Hot Springs, groundwater-flow models, constructed by the U.S. Geological
Arkansas, depend. Survey (USGS) in cooperation with the National Park Service.
The thermal springs are also a source of scientific A surface-water model was constructed in version 4 of the
intrigue. Scientific interests in the thermal springs were first Precipitation-Runoff Modeling System (hereinafter referred
documented in 1804 when the first documented measurement to as the “PRMS model”) (Markstrom and others, 2015) and
of the springwater temperature, measured at 67.8 degrees used to simulate aerially distributed recharge in Hot Springs
Celsius (°C; Weed, 1902), was reported. Since 1804, geolo- National Park and the surrounding region that was depen-
gists and geochemists have shown through their research that dent upon anticipated climate and land-use change within the
the springs emerge from the plunging crest line of the large vicinity of Hot Springs, Arkansas. A groundwater-flow model
overturned Hot Springs anticlinorium (Bedinger and oth- was constructed in MODFLOW-2005 (Harbaugh and others,
ers, 1979), and they are sustained entirely by local recharge 2000) (hereinafter referred to as the “MODFLOW model”)
areas whose locations are currently (2021) based on indirect and coupled to the PRMS model by incorporating the PRMS-
evidence and thought to lie within about 10 miles of the simulated recharge as a specified-flux boundary condition in
thermal springs. Geochemical data have further indicated that the numerical solution of the steady-state groundwater-flow
the groundwater that recharges the thermal springs is differ- equation (Wang and Anderson, 1982; Anderson and Woessner,
entiated into two separate flow constituents that each travel 2002). Numerical solutions to the groundwater-flow equation
separate flow paths through the subsurface from the recharge were performed in steady state to simulate spring-flow rates
location to the thermal springs. Groundwater is differentiated at the thermal springs established by the groundwater-flow
into a shallow, “cold-water” constituent (hereinafter referred to system in response to stresses attributed to recharge variability.
as the “cold-water” or “cold” constituent) and a deep, thermal
constituent and each constituent is characterized by a remark-
ably different residence time and flow depth. The residence Purpose and Scope
times of the cold and thermal constituents, as quantified from
The purpose of this report is to describe the develop-
geochemical data, are less than 20 years and greater than
ment, calibration, and use of the PRMS and MODFLOW
4,400 years, respectively (Bell and Hays, 2007; Kresse and
models, with an emphasis on generating a conceptual model of
Hays, 2009). The estimated flow depth of the thermal constitu-
groundwater flow through the deep flow system at Hot Springs
ent is 7,500 feet (ft) or more (Bedinger and others, 1979).
National Park more so than developing a true calibration
Despite substantial advances in scientific understanding
dataset. This report specifically describes (1) the PRMS model
of the origins of the thermal springs since 1804, many aspects
used to quantify aerially distributed recharge applied to the
regarding the long-term variability of the spring-flow rates
MODFLOW model as a boundary condition, (2) the hydro-
remain uncertain. Uncertainty is, in part, attributed to the lim-
geologic framework developed and used in the MODFLOW
ited understanding of the structurally complex hydrogeologic
model, (3) the manual calibration of the MODFLOW model to
framework of the groundwater-flow system and its exerted
historical daily mean thermal spring flow, (4) particle-tracking
influence upon the flow paths and residence times of the cold
simulations to estimate a plausible recharge area in the MOD-
and thermal constituents of groundwater flow. Consequently,
FLOW model framework, and (5) the results of the PRMS and
additional scientific questions remain unanswered. This
MODFLOW model simulations including predictive forecast-
investigation addresses two outstanding questions pertain-
ing of thermal spring-flow variability attributed to climate and
ing to the natural groundwater-flow system. First, what is the
land-use changes.
origin of the recharge to the thermal springs? Second, what
are the potential effects of climate and land-use changes on
the long-term variability of the thermal spring-flow rates? Previous Investigations
Previous scientific investigations have provided meaningful,
yet predominantly inconclusive insight into both aspects of The thermal springs of Hot Springs National Park have
the groundwater-flow system; however, answers to the first been the focus of several scientific studies completed between
question depend upon factors that need to be more definitively the early 19th century and present (2021). Many of these
constrained and characterized, and answering the second studies have emphasized some specific aspect of the thermal
question is a difficult task because of the unknown aspects springs and their relation to the interconnected hydrogeologic
of groundwater-flow and heat-transport processes occurring framework in the subsurface. Collectively, the previous studies
within the hydrogeologic framework of Hot Springs National have culminated in the currently accepted conceptual model of
Park. The need for better answers to these questions requires recharge and groundwater flow to the thermal springs.Introduction 3
Early researchers such as Purdue (1910) and Bryan groundwater constituent after storm events. However, their
(1922, 1924) provided descriptions of the local and regional water-quality data indicated that little water-quality change has
geology, as well as discussions of the postulated origins of the occurred with respect to base-flow conditions at the springs
thermal springs and their source(s) of heat. Following in the when compared to data from studies dating back to the 1800s.
footsteps of these researchers and others, Albin (1965) out- The continuously monitored temperature data did not support
lined the regional tectonic setting and described the geologic the idea that long-term temperature changes have occurred
processes that formed the present-day geologic structure and through time at the thermal springs.
aquifers encountered within the Ouachita Province and the Following Yeatts (2006) and Bell and Hays (2007),
effects of those processes on the present-day surface-water Kresse and Hays (2009) studied the coincidence of two distal
and groundwater resources in the region. Building upon these thermal wells outside of Hot Springs National Park boundaries
investigations, Bedinger and others (1979) conducted the by a comparative analysis of the geochemical characteristics
first in-depth water-quality analyses of the thermal springs of cold-water springs and wells, distal thermal wells outside
and developed the first published “hydrothermal” mathemati- of the park, and the thermal springs in the park. Their study
cal models of the flow system to test the debated theories on evaluated the degree of hydraulic connectivity between the
the recharge formations and locations and the hydraulics of distal thermal wells and the thermal springs in Hot Springs
the groundwater-flow system that sustain the thermal spring National Park. They concluded that the two very different
flows. Bedinger and others (1979) constructed two models. isotopic and geochemical signatures observed for the distal
The first model tested the hypothesis that the Bigfork Chert is thermal wells did not provide evidence of any direct hydrau-
the primary recharging formation, whereas the second model lic connection between the water in the distal wells and the
tested the hypothesis that the Arkansas Novaculite is the pri- thermal springs in Hot Springs National Park. Furthermore,
mary recharging formation. Bedinger and others (1979) noted they concluded that the deep flow systems for thermal waters
critical constraints in both models that limited their conclu- encountered within the region were likely unique to localized
sions regarding the recharge formation(s) and the source(s) hydrogeologic settings.
of heat. In their first model, an abnormally high uniform heat
flux was required as a boundary condition at the base of the
model. Although the required heat flux exceeded the maxi- Geologic Description of Study Area
mum known value of crustal heat flow in the eastern United
Hot Springs National Park is in central Arkansas and
States (Bedinger and others, 1979), the model was able to
encompasses the city of Hot Springs, Arkansas (fig. 1). The
adequately simulate the observed temperature of the thermal
park lies entirely within the Ouachita Physiographic Province
springs and supplied enough hydraulic head at the theorized
(Fenneman and Johnson, 1946). The structural fabric of the
recharge location to recharge the thermal springs. This was
Ouachita Province is a direct result of the tectonic events
not the case in their second model, in which the available head
described by Albin (1965), which began in the Paleozoic Era
was the critical constraint. In their second model, the hydrau-
with the formation of a long, narrow geosynclinal trough, fol-
lic head required to recharge the thermal springs through the
lowed by the subsequent infilling of the trough by deposition
Arkansas Novaculite exceeded the available head supplied by
of a great thickness of clastic sediments. Sediment deposi-
the recharge by a factor of three.
tion was interrupted by continental collision and the ensuing
More recently, Yeatts (2006) focused on defining the
deformation of the sediment wedge into a complex folded,
recharge area for the shallow, cold groundwater constituent
thrust-faulted arch. Periods of collision and deformation
by continuously monitoring discharge and temperature at
were followed by a long period of uplift and erosion, which
eight thermal springs and at the collection system reservoir.
has led to the present-day expressions of the geologic forma-
In this study, dye tracing with fluorescent dyes was used to
tions observed in outcrop and their subsurface stratigraphic
develop a conceptual model of the groundwater-flow system
relations.
and to delineate recharge locations for the thermal and cold
Continental collision induced intricate folding at regional
groundwater constituents. In a related study, Bell and Hays
and local scales and led to overturning of complete and partial
(2007) sampled water-quality at nine hot-water springs and
geologic sequences (Arkansas Geological Survey, 2016). At
two cold-water springs and performed continuous tempera-
present (2021), the Hot Springs anticlinorium is intensely
ture monitoring at four of the hot-water springs for a duration
folded and overturned to the south and dips to the north at
of 2 years to better understand the contributions of the cold
15–60 degrees. The major folds consist of numerous smaller
groundwater constituent to the thermal springs. Their data
folds that are tight and compressed, strike northeast, and over-
indicated that the water quality of the thermal springs was
lap one another laterally in a discontinuous manner over long
influenced to some degree by the cold groundwater constitu-
distances (Purdue, 1910; Bryan, 1922). Thrust faults occur
ent. Their conclusions were supported by observations of
parallel to the strikes of the fold axes. The thermal springs
substantial differences in water quality of the thermal springs
discharge from the ground near a mapped thrust fault, along
during base-flow and stormflow events, in addition to observa-
a belt that is approximately 1,300 ft long and a few dozen
tions of short time-scale temperature reductions at the thermal
feet wide at the southwestern base of Hot Springs Mountain
springs in response to mixing with the locally derived cold4 Effects of Climate and Land-Use Change on Thermal Springs Recharge, Hot Springs National Park, Arkansas
93°10' 93°05' 93° 92°55' 92°50'
EXPLANATION
34°40' Hot Springs National Park
boundary
PRMS hydrologic response
units (HRUs) for the
Gulpha Creek watershed
PRMS HRUs for the rest of
rest of the modeling domain
Approximate recharge area
MODFLOW model boundary
07358253
USGS streamgage
H9
Hot Springs thermal spring
H3
34°35' Hot Springs surficial well
H8
H7
H6
H5
H3
H4
H2
07358253
H1 07358550
07358284 MISSOURI
34°30'
ARKANSAS
OKLAHOMA
Ouachita Physiographic
Province in Arkansas
MISSISSIPPI
Study area:
0 1 2 3 4 5 MILES Hot Springs
0 1 2 3 4 5 KILOMETERS TEXAS
LOUISIANA
Map image is the intellectual property of Esri and is used herein under license.
Copyright © 2013 Esri, i-cubed, GeoEye. All rights reserved.
Figure 1. Locations of the Gulpha Creek streamgage (U.S. Geological Survey [USGS] station 07358550), Hot Springs thermal springs, Hot
Springs watershed and surrounding area streams, hydrologic response units delineating the Precipitation-Runoff Modeling System (PRMS)
model boundaries, approximate recharge area, well heads H1–H9, MODFLOW groundwater-flow model boundary, the city of Hot Springs, and
the Hot Springs National Park boundary, Arkansas.Introduction 5
(fig. 2, Bryan, 1922; Bedinger and others, 1979). The thermal temperatures and depths, combined with the presence of the
springs are located on the nose of a southwestern-plunging permeable conveyance conduits created by joints, fractures,
anticline that is part of the larger anticlinorium. This general and faults, cause the heated groundwater to travel vertically
structural configuration—wherein thermal springs tend to be upwards under artesian pressure. The travel time from depth to
found at the noses of plunging anticlines and closely aligned the surface is rapid (on the order of a few years) in comparison
with mapped thrust faults—is observed for all documented to the travel time required for the groundwater to reach the
occurrences of thermal springs across the Ouachita Province maximum flow depth (on the order of several thousand years).
(Kresse and Hays, 2009). This concept is supported by observations of silica concentra-
tions in the thermal groundwater constituent, which indicated
that the maximum temperature achieved at depth is only a few
Hydrogeologic Description of Study Area degrees greater than the average temperature of the thermal
springs. Silica data collected by Bell and Hays (2007) were
The regional surficial geology controlling hydrogeologic
used with the methods of Fournier and Rowe (1966) to calcu-
processes in Hot Springs National Park is shown in figure 2.
late the maximum temperature of the groundwater conveyed
The folding, faulting, and extreme dips of the geologic for-
along the deep flow path. Bell and Hays (2007) estimated a
mations plunge the formations to great depths. Groundwater
maximum groundwater temperature of about 66.6 °C based on
travels vertically downward through these highly fractured
the maximum silica concentration from thermal spring base-
formations to estimated depths of 4,500–7,500 ft at an esti-
flow data—an estimate that is 3.4 °C higher than the source
mated flow velocity of 1–10 feet per year (ft/yr; Bedinger and
temperature of 63.2 °C previously reported by Bedinger and
others, 1979). The groundwater is heated along the deep flow
others (1979).
path by the local geothermal gradient of 0.006–0.01 degrees
Although the spring flows are thought to be sustained
Celsius per foot (°C/ft; Bedinger and others, 1979) and attains
exclusively by recharge occurring over the eroded anticlinal
a maximum estimated temperature of 63–68 °C along the
complex, some speculation regarding the presence or absence
flow path (Bedinger and others, 1979; Bell and Hays, 2007).
of a component of interbasin flows has occurred. Through
The geothermal heat source is generally agreed upon as being
base-flow analysis, Bedinger and others (1979) concluded
the most probable heat source, although past researchers have
that interbasin transfers of groundwater from several adjacent
debated if the origin of the heat is magmatic (Weed, 1902;
stream basins likely contribute to the thermal groundwater
Purdue, 1910; Bryan, 1922), or a result of the convective
constituent and therefore the thermal springs. Kresse and Hays
upwelling of heated juvenile water (Arndt and Stroud, 1953).
(2009), however, found no evidence of interbasin transfers of
Researchers now consider that the thermal effects on the
the cold groundwater constituent.
buoyancy and kinematic viscosity of the groundwater at these
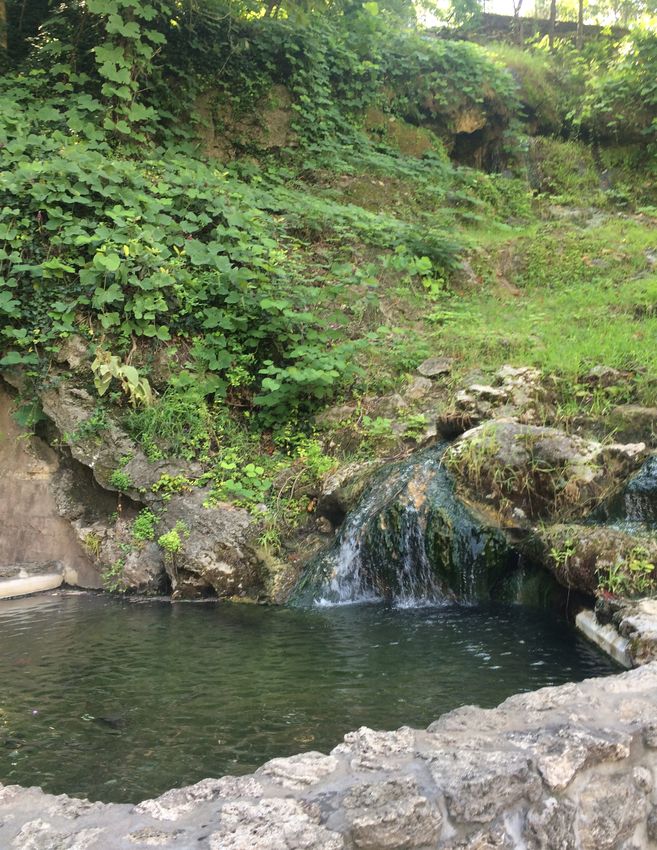
Recharge area, Hot Springs, Arkansas.6 Effects of Climate and Land-Use Change on Thermal Springs Recharge, Hot Springs National Park, Arkansas
93°05' 93°
34°35'
B
A A'
34°30' 0 1 2 MILES
0 1 2 KILOMETERS
Base from U.S. Geological Survey digital data, 1:24,000, 2014 B'
Universal Transverse Mercator, zone 15 EXPLANATION
Formation
Hot Springs National Arkansas Novaculite (MDa) Hot Springs Tufa (Qtufa) Stanley Shale (Ms)
Park boundary
Bigfork Chert (Obf) Igneous Pluton (Ki) Womble Shale (Ow)
Potential groundwater
recharge area Blakely Sandstone (Ob) Mazarn Shale (Om)
A A' Line of section Hot Springs Sandstone (Mshs) Polk Creek Shale-Missouri
MODFLOW model grid node Mountain Shale (SO)
Hot Springs thermal spring
Figure 2. The regional surficial geology controlling hydrogeologic processes in Hot Springs National Park with decimated
MODFLOW groundwater-flow model grid. Each grid node is separated from surrounding grid nodes by 984.25 feet corresponding
to a model-grid decimation of 10 (the full model grid has 10 times the number of nodes shown in both the x and y directions).Delineation of the Recharge Area 7
Delineation of the Recharge Area and others [1979]). A 5,000-ft column of groundwater at an
average temperature of about 42 °C is therefore roughly equiv-
The thermal springs in Hot Springs National Park exist alent to a 5,055-ft column of groundwater at a temperature
because the formations that recharge them exhibit the fol- of 66.6 °C. The implication is that the recharge area could be
lowing general characteristics: (1) the formations are per- lower in elevation than the discharge elevation of the thermal
meable, and their outcrop areas are large enough to accrue springs (Bedinger and others, 1979).
enough recharge to yield thermal spring discharge of about Consideration of the previously listed characteristics
88,000 cubic feet per day (ft3/d), or about 1 cubic foot per enabled an estimate of the recharge area and its elevation,
second (ft3/s), (2) water-level elevations within the recharging which are depicted in figure 3. Simple Darcy calculations
formations provide sufficient hydraulic head for the thermal that incorporated hydraulic conductivity constraints based
springs to emerge from the ground at elevations between 576 on available local data indicated that hydraulic head in the
and 683 ft (Bedinger and others, 1979), and (3) the recharge recharge area must be sufficiently high relative to the eleva-
area is hydraulically connected to the thermal springs and tion of the thermal springs in order to produce the discharge
capable of supplying a recharge of at least 2–6 inches per rates measured at the thermal springs. Based on the elevation
year (in/yr; Bedinger and others, 1979). Based on these of the thermal springs, and in consideration of water-density
characteristics, three formations are considered plausible for effects attributed to groundwater temperature increases along
supplying the majority of recharge to the thermal springs. the flow path, the outcrop areas of the Bigfork Chert, Arkansas
Recharge to the thermal springs is theorized to occur primar- Novaculite, and Hot Springs Sandstone that lie above an
ily through the secondary porosity of the Bigfork Chert and elevation of 660 ft on the Hot Springs anticlinorium were con-
the Arkansas Novaculite Formations (fig. 2), and to a lesser sidered the most likely recharge areas because they exhibit the
degree, through the less extensive outcrop of the Hot Springs aforementioned criteria in the delineated recharge area (fig. 3).
Sandstone Member—a member of the Stanley Shale (herein- Throughout the delineated recharge area (fig. 3), the rocks of
after referred to as the Hot Springs Sandstone following usage these formations are permeable enough to convey water into
from the Arkansas Geological Survey [Johnson and Hanson, the deep subsurface, and the hydraulic head is sufficient to
2011; McFarland, 2004]). These formations are character- convey groundwater flow through the subsurface to the ther-
ized by relatively high permeability because of abundant mal springs. Geologic maps of the anticlinorium (Johnson and
faulting and fracturing, and water levels in some areas of Hanson, 2011) show that about 8 square miles (mi2) of Bigfork
their outcrops exceed 850 ft elevation (Nottmeier and Hays, Chert, about 5 mi2 of Arkansas Novaculite, and about 3 mi2 of
2019). The formations are part of the eroded, thrust-faulted Hot Springs Sandstone outcrop at elevations above 660 ft. The
anticline from which the thermal springs emerge at the nose, recharge area delineated in figure 3 therefore totals approxi-
and therefore represent the most structurally, topographically, mately 16 mi2; however, this estimate is conservative because
and stratigraphically suitable area meeting the recharge criteria the shales and siltstones of the Stanley Shale, Polk Creek-
listed above. Missouri Mountain Shale, and Womble Shale formations are
The hydraulic head in the recharge area that is required not considered. The shales of these formations do outcrop
to recharge the thermal springs is affected by groundwa- at elevations that are high enough to provide recharge to the
ter temperature, total dissolved solids (TDS), the flow path thermal springs, and these formations are highly fractured and
length, and frictional head losses that occur along the flow capable of transmitting groundwater at shallow depths where
path between the recharge area and the thermal springs (Zhang overburden pressure has not effectively closed the fractures.
and Nemcik, 2013). Temperature increases that occur along Furthermore, thousands of shallow domestic wells produce
the flow path reduce the groundwater density and the hydrau- water from these formations, and the shallow groundwater lev-
lic head that is required in the recharge area. In contrast, an els within these formations show notable and rapid responses
increase of TDS along the flow path increases the groundwater to recharge events. However, these wells rarely produce water
density and the hydraulic head that is required in the recharge at depths below about 180 ft (Kresse and Hays, 2009), indicat-
area. For example, groundwater with 200 milligrams per ing that the overburden stress is great enough to close fractures
liter (mg/L) TDS and a temperature of 66.6 °C at the thermal in the deeper regions of these more labile formations and pre-
springs (the approximate temperature of the hot-water column) vent groundwater flow to the depths necessary to recharge the
is about 98.9 percent as dense as the groundwater contained thermal springs. The Arkansas Novaculite, Bigfork Chert, and
within the upstream segments of the flow path where lower Hot Springs Sandstone are therefore regarded herein as the
TDS of about 110 mg/L and reduced temperature of about formations that serve as the principal recharge source of the
42 °C are common (these values are representative of the con- thermal springs, and the estimated recharge area is delineated
ceptual model of the thermal springs considered by Bedinger in figure 3.8 Effects of Climate and Land-Use Change on Thermal Springs Recharge, Hot Springs National Park, Arkansas
93°05' 93°
EXPLANATION
Approximate recharge area
Hot Springs National Park boundary
Hot Springs thermal spring
Formation
Arkansas Novaculite (MDa)
34°35'
Bigfork Chert (Obf)
Hot Springs Sandstone (Mshs)
Elevation, in feet above NAVD 88
High : 1,409.39
Low : 344.419 ain
nt
ou
fM
rloa
ga
Su
ain
unt
s Mo
ring
t Sp
Ho
34°30'
Base from U.S. Geological Survey digital data, 1:24,000, 2014
Universal Transverse Mercator, zone 15 0 1 2 MILES
0 1 2 KILOMETERS
Figure 3. Locations of formations contributing to the estimated recharge area for the Hot Springs thermal springs and elevations of the recharge area
near Hot Springs National Park, Arkansas. [NAVD 88, North American Vertical Datum of 1988]PRMS Model Development 9
PRMS Model Development and maximum surface air temperatures, and incident solar
radiation from 1980 to 2014, each produced by the University
The following sections of this report describe the devel- of Idaho’s Gridded Surface Meteorological Dataset (gridMET
opment of the PRMS model used to simulate the hydrologic Climatology Lab) (Abatzoglou, 2013). The historical cli-
cycle and quantify recharge at the watershed scale. PRMS is mate data were downloaded from the USGS Geo Data Portal
a modular, deterministic, distributed-parameter model that (Blodgett and others, 2011, 2012) and were used to derive a
has been used in many hydrologic applications to evaluate the spatially and temporally continuous high-resolution gridded
effects of climate and land use on general watershed hydrol- climate dataset, which ultimately was used to produce a base-
ogy (Markstrom and others, 2015). All input and output files line recharge condition for use as a boundary condition during
for the PRMS watershed model described herein are provided calibration of the MODFLOW model.
in a related data release (Hart and Ikard, 2021). The future climate data consisted of predicted daily
The PRMS model domain included all of the hydrologi- precipitation and minimum and maximum surface air tem-
cally similar units shown in figure 1, referred to as hydrologic peratures for the conterminous United States for the period
response units (HRUs), and overlapped the MODFLOW 2015–2099. These data were produced by several global
groundwater-flow model domain. Stream segments are the climate models (GCMs) of the Phase 5 Coupled Model
smallest geographic features that can be simulated by the Intercomparison Project (CMIP5) (World Climate Research
PRMS model, and they are simulated in the PRMS model as Programme, 2020). Future climate data were used as inputs to
channelized flow (Markstrom and others, 2015). the PRMS model to simulate potential future climate condi-
The PRMS model maintains a daily water balance of the tions and the corresponding recharge fluxes that were used
entire watershed and simulates all processes of the hydrologic as boundary conditions in predictive simulations using the
cycle by using daily time-series of precipitation, incident MODFLOW model. The future climate data were downscaled
solar radiation, and maximum and minimum air tempera- by the Multivariate Adaptive Constructed Analogs method
tures as inputs. Precipitation in the form of rain, snow, or a (Abatzoglou and Brown, 2012) by using the gridMET data
mixture of rain and snow is either intercepted by the vegeta- (Abatzoglou, 2013) as a training dataset. The downscal-
tive canopy or converted to throughfall onto the watershed ing was based on the 365-day outputs from different GCMs
surface. At the watershed surface, precipitation that either that used historical (1950–2005) and future (2006–2099)
runs off into stream segments, lakes, or adjacent HRUs or Representative Concentration Pathway (RCP) scenarios of
infiltrates into the soil is subjected to evapotranspiration 4.5 and 8.5, respectively (Pachauri and Meyer, 2014). GCMs
controlled by daily temperature and incident solar radiation. corresponding to the two RCPs were selected to examine
The impervious portions of the watershed surface have no moderate and extreme greenhouse gas emission scenarios
infiltration capacity, and maximum storage capacity in the for the Hot Springs National Park area, which are character-
soil must be met before surface runoff can occur (Markstrom ized by RCPs of 4.5 and 8.5, respectively. The global mean
and others, 2015). surface air temperature was projected to rise for the period
Three conceptual soil reservoirs are represented within 2016–2035 under both of the greenhouse emissions scenarios
the PRMS model, and groundwater flow is simulated between considered. After 2035, the global mean surface air tempera-
each of these soil reservoirs based on antecedent conditions ture changes through 2099 were dependent upon the specific
in adjacent soil reservoirs and the soil properties distributed greenhouse gas emissions scenario. An RCP of 4.5 resulted
within them (Markstrom and others, 2015). The reservoirs, in a moderate surface air temperature change corresponding
from top to bottom) are (1) the preferential-flow reservoir, to a global mean surface air temperature increase of 1.8 °C,
which enables simulation of fast lateral interflow, (2) the cap- whereas an RCP of 8.5 resulted in the most extreme surface air
illary reservoir, which accounts for volumetric soil moisture temperature change corresponding to a global mean surface air
between the wilting point and field-capacity extremes, and temperature increase of 3.7 °C (Pachauri and Meyer, 2014).
(3) the gravity reservoir, which enables simulation of slow, In all cases, an increase in mean surface air temperature was
lateral interflow and gravity drainage out of the soil column. predicted for the Hot Springs National Park area by the end of
Gravity drainage accounts for base flow to the stream net- the century. Precipitation predictions were more uncertain than
work and serves as a groundwater sink to represent drainage temperature predictions for this region; however, the general
out of the soil column (Markstrom and others, 2015). Gravity consensus is that intense rainfall events will likely increase in
drainage simulated by the PRMS model was incorporated frequency in the future (Carter and others, 2014).
into the MODFLOW model as recharge.
PRMS Model Parameters
PRMS Model Climate Inputs Numerous datasets were required to define the static
Historical and future climate data were input into the parameters of the PRMS model. The required datasets were
PRMS model to simulate the water cycle at the watershed part of the Geospatial Fabric (Viger, 2014; Viger and Bock,
scale. Historical data included daily precipitation, minimum 2014) and included (1) the National Elevation Dataset (USGS,10 Effects of Climate and Land-Use Change on Thermal Springs Recharge, Hot Springs National Park, Arkansas
2019a) for delineating HRUs in the PRMS model domain between the minimum of 2.4 in/yr in 1981 and 2005 and the
(fig. 1), (2) the National Hydrography Dataset (USGS, 2019b) maximum of 8.1 in/yr in 2009. The PRMS-simulated annual
for delineating the stream reaches within the Gulpha Creek mean recharge over the entire PRMS-model domain was
watershed (fig. 1), (3) the 2001 National Land Cover Database approximately 7.9 in/yr and varied between the minimum of
(Homer and others, 2007) to quantify the static PRMS param- 1.4 in/yr in 1981 and the maximum of 18.7 in/yr in 2009. The
eters related to land cover, and (4) the Soil Survey Geographic annual mean recharge simulated by PRMS within any indi-
database (SSURGO; U.S. Department of Agriculture, 2019a, vidual HRU (fig. 6) varied between the minimum of 3.3 in/yr
b) to quantify the PRMS parameters related to the soils in the and the maximum of 12.1 in/yr depending on the soil and land
Gulpha Creek watershed. Other important parameters that cover properties.
control the recharge processes in the PRMS model are listed in The PRMS-simulated annual mean recharge (7.9 in/yr)
table 1. compared reasonably well to the independent recharge esti-
mate of 2–6 in/yr published by Bedinger and others (1979). To
further evaluate the validity of the PRMS-simulated recharge,
Calibration of the PRMS Model the PRMS-simulated values were compared to estimates
simulated by three additional models. The first of these mod-
The PRMS model was calibrated to historical daily mean
els was the Hydrologic Evaluation of Landfill Performance
streamflow data measured at the Gulpha Creek streamgage
v. 3 (HELP3) model (https://www.epa.gov/land-research/
(USGS station 07358550, Gulpha Creek at Hot Springs,
hydrologic-evaluation-landfill-performance-help-model; U.S.
Arkansas [figs. 1 and 4]) between August 14, 2009, and
Environmental Protection Agency, 2017), which uses a combi-
December 31, 2014 (USGS, 2019c). The PRMS model was
nation of climate, soil, and land-use data to estimate recharge
calibrated in a two-step sequence to produce a long-term mean
(Jyrkama and others, 2002; Lacombe and others, 2017). The
recharge for use in calibrating the MODFLOW model. First,
HELP3 model simulation (fig. 7) returned recharge estimates
a baseline PRMS simulation was performed by using histori-
that varied between a minimum of about 0 in/yr to a maxi-
cal climate data representing the period January 1, 1980, to
mum of 29.2 in/yr; the annual mean recharge estimated with
August 14, 2009, to allow the simulated water balance to
the HELP3 model was 6.5 in/yr which compared favorably
converge on a stable antecedent soil moisture condition. The
to the annual mean recharge returned by the PRMS simula-
antecedent soil moisture condition was then used in the second
tion. The second model used the Rorabaugh (RORA) code
step, and the PRMS model was calibrated to historical daily
(Rutledge, 1998, 2000), which is based on recession curve
mean streamflow from August 14, 2009, to December 31,
displacement and estimates recharge to the water table based
2014, by using historical climate data.
on daily streamflow in a watershed. This model incorporated
The time-series of PRMS-simulated daily mean stream-
all streamgages near the Hot Springs National Park study
flow compared reasonably well with the daily mean stream-
area (table 3) and produced recharge estimates that varied
flow data measured at the Gulpha Creek streamgage (fig. 4).
between a minimum of 9.0 in/yr and a maximum of 24.5 in/
The mean absolute error and the root mean square error
yr; the annual mean recharge estimated from the RORA model
(RMSE) between the calibrated and measured daily mean
was 14.9 in/yr (table 3). This estimate was notably larger than
streamflow were 3.63 ft3/s and 7.58 ft3/s, respectively (table 2).
the PRMS-simulation but still compared reasonably well.
The means of the simulated and measured streamflow data
The third model was the Soil-Water-Balance (SWB) model
compared well also; the mean of the simulated streamflow
(Westenbroek and others, 2010). The SWB model calculates
data was 6.20 ft3/s, and the mean of the measured streamflow
spatial and temporal variations in groundwater recharge by
data at the Gulpha Creek gage was 7.20 ft3/s, corresponding
using a modified Thornthwaite-Mather soil-water balance
to an error of about 14 percent (table 2). Based on the model-
(Thornthwaite and Mather, 1955, 1957), which is based on
fit statistics (table 2), the corresponding performance ratings
daily values of precipitation and temperature, in addition to
given by Moriasi and others (2007) indicate that the calibra-
land-use classification, hydrologic soil groupings, and soil-
tion of the PRMS model falls within the category of “accept-
water retention properties. The SWB model produced recharge
able” to “very good.”
that varied between a minimum of 0 in/yr and a maximum of
74.9 in/yr (fig. 8); the annual mean recharge estimated with
PRMS Model Results the SWB model was 10.8 in/yr, which was also slightly greater
than the PRMS simulation but comparable. The PRMS-
The PRMS model results are shown graphically in fig- simulated annual mean recharge (7.9 in/yr) was encapsulated
ure 5 and in map view in figure 6. The annual mean precipita- by the mean values obtained from the HELP3, RORA, and
tion supplied to the PRMS model (fig. 5) was approximately SWB models (6.5–14.9 in/yr) and was therefore considered
47 in/yr for the calibration period 1980–2014. The minimum an adequate representation of the actual recharge in the Hot
of 34.0 in/yr occurred in 2005, and the maximum of 69.6 in/ Springs National Park study area and suitable for use as a
yr occurred in 2009. Using the annual mean precipitation time boundary condition in the MODFLOW model.
series as a PRMS model input, the PRMS-simulated annual
mean surface runoff (fig. 5) was about 4.1 in/yr and variedYou can also read