2020 Census Research and Testing 2012 National Census Test Contact Strategy, Optimizing Self-Response - Census.gov
←
→
Page content transcription
If your browser does not render page correctly, please read the page content below

2020 Census Research and Testing 2012 National Census Test Contact Strategy, Optimizing Self-Response
[This page intentionally left blank]
2012 National Census Test Contact Strategy Results 1

Contents
List of Tables .................................................................................................................................. 2
List of Figures ................................................................................................................................. 3
Executive Summary ........................................................................................................................ 4
1. Introduction ............................................................................................................................. 7
1.1       Scope ................................................................................................................................ 8
1.2       Intended Audience............................................................................................................ 8
2. Background .............................................................................................................................. 9
2.1       Internet Response Option and Contact Strategy Research ............................................... 9
2.2       Internet Instrument Design Research ............................................................................. 10
3. Methodology.......................................................................................................................... 11
3.1       Research Questions ........................................................................................................ 11
3.2       Assumptions ................................................................................................................... 12
3.3       OMB Clearance .............................................................................................................. 13
3.4       Schedule ......................................................................................................................... 13
3.5       Sample Design................................................................................................................ 13
3.6       Study Design and Implementation ................................................................................. 14
3.7       Data Analysis ................................................................................................................. 27
4. Limitations ............................................................................................................................. 30
4.1       Questionnaires in English Only...................................................................................... 30
4.2       Anticipated Expansion of Internet Access and Usage ................................................... 30
4.3       Paper Data Capture......................................................................................................... 31
5. Results ................................................................................................................................... 31
5.1       Self-Response Rates ....................................................................................................... 31
5.2       Item Nonresponse Rates ................................................................................................. 36
5.3       Race and Origin Analysis ............................................................................................... 37
5.4       Telephone Questionnaire Assistance Reasons for Call .................................................. 44
5.5       Paradata Analysis ........................................................................................................... 46
6. Related Evaluations, Experiments, and/or Assessments........................................................ 59
7. Dependencies ......................................................................................................................... 59
8. Conclusions and Recommendations ...................................................................................... 59
8.1       Conclusions .................................................................................................................... 59
8.2       Program-Level Recommendations ................................................................................. 62
8.3       Project-Level Recommendations ................................................................................... 63
8.4       Lessons Learned ............................................................................................................. 63
9. Knowledge Management Resolutions ................................................................................... 65
10. Acknowledgements ............................................................................................................ 65
11. References .......................................................................................................................... 66
12. Appendices ......................................................................................................................... 68
2012 National Census Test Contact Strategy Results 2

List of Tables
Table 1. 2012 NCT Contact Strategy Panel Design .................................................................... 15
Table 2. Self-Response Rates by Panel and Response Mode ...................................................... 31
Table 3. Internet Item Nonresponse by Panel .............................................................................. 36
Table 4. Weighted Combined Race and Hispanic Origin Distributions for Internet Responses .. 38
Table 5. Detailed Reporting for Select Race Groups and Hispanic Origin for Internet Responses
....................................................................................................................................................... 39
Table 6. 2010 Census Race and Hispanic Origin Alternative Questionnaire Experiment:
Detailed Reporting for Select Race Groups and Hispanic Origin ................................................ 40
Table 7. Detailed Reporting for Select Race Groups and Hispanic Origin for 2012 NCT Paper
Responses...................................................................................................................................... 41
Table 8. Percentage of Write-Ins Requiring Residual Coding in the 2012 NCT (Internet and
Paper Responses) and the 2010 AQE (Paper Responses) ............................................................. 43
Table 9. Frequency and Percent of Logins by Respondent ......................................................... 47
Table 10. Frequency and Percent of Login Attempts .................................................................. 48
Table 11. Frequency and Percent of Item Changes from the Review Screen .............................. 49
Table 12. Completion Time by Household Size .......................................................................... 52
Table 13. Distribution of Edit Messages by Instrument Section ................................................. 54
Table 14. Distribution of Help Link Usage by Instrument Section ............................................. 56
Table 15. Device Used to Access the 2012 NCT Instrument ...................................................... 57
Table 16. Median Completion Time and Break-off Rate by Device ........................................... 58
Table 17. Browser Used to Access the 2012 NCT Instrument .................................................... 58
2012 National Census Test Contact Strategy Results 3

List of Figures
Figure 1. Telephone Number Question ........................................................................................ 20
Figure 2. Tenure Question ........................................................................................................... 20
Figure 3. Relationship Question .................................................................................................. 21
Figure 4. Sex Question ................................................................................................................. 21
Figure 5. Age and Date of Birth Questions.................................................................................. 22
Figure 6. "Streamlined" Approach for Combined Race and Hispanic Origin Question X3 ........ 22
Figure 7. "Very Streamlined" Approach for Combined Race and Hispanic Origin Question (X4)
....................................................................................................................................................... 23
Figure 8. Predictive Text.............................................................................................................. 24
Figure 9. Email Address Question ............................................................................................... 24
Figure 10. Review Screen ............................................................................................................ 25
Figure 11. Internet Self-Response Rates by Contact Strategy Panel ........................................... 32
Figure 12. Detailed Reporting Percentage for X3 Questionnaire in the 2010 AQE and the 2012
NCT............................................................................................................................................... 42
Figure 13. TQA Completed Interview Rates by Contact Strategy Panel .................................... 44
Figure 14. Logout Button on the Internet Instrument Menu Bar ................................................. 49
Figure 15. Review/Submit Screen ............................................................................................... 51
Figure 16. Red Edit Message Indicating Item Nonresponse........................................................ 53
Figure 17. Green Edit Message Indicating a Request for More Information .............................. 54
Figure 18. Example of the "Help" Link for the Sex Item ............................................................ 56
2012 National Census Test Contact Strategy Results 4
Executive Summary
Study Overview
The Census Bureau is committed to using the Internet as a primary response option for the 2020
Census. Recent Census Bureau Internet research has developed around the Internet Push
methodology, in which households do not receive a paper questionnaire in the initial mailing.
Questionnaires were only sent to households who did not respond by a pre-determined date.
This approach was intended to maximize self-response, while considerably reducing the mailing
costs associated with a decennial census.
This test served as an opportunity to establish baseline response rate indicators that we can
continue to monitor as we approach the 2020 Census. The 2012 National Census Test assessed
the relative self-response rates and Internet self-response rates across various contact strategies in
the presence of an Internet Push methodology. In addition to a control panel, five experimental
contact strategy panels were tested, all in the presence of an Internet Push methodology.
Results
The following sections provide summary results to answer the five research questions.
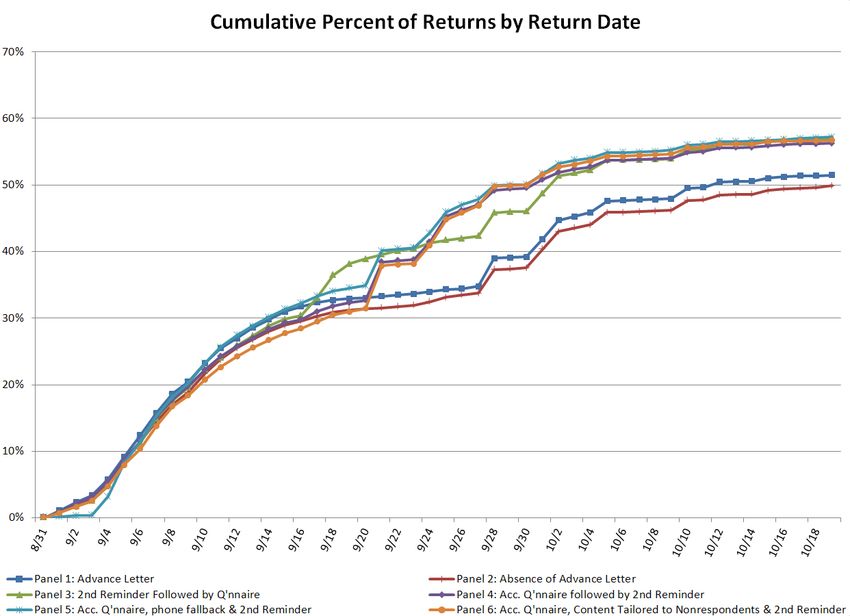
1) What are the relative overall self-response rates (and self-response rate differences)
associated with each of the six contact strategies? What are the Internet self-
response rates by contact strategy?
Panel 1: Advance letter (Control):
- 60.3 percent self-response rate
- 38.1 percent Internet, 17.2 percent Mail, 5.1 percent Telephone
Panel 2: Absence of advance letter:
- 58.0 percent self-response rate
- 37.2 percent Internet, 16.5 percent Mail, 4.3 percent Telephone
Panel 3: Second reminder prior to questionnaire (and absence of advance letter):
- 64.8 percent self-response rate
- 42.3 percent Internet, 13.6 percent Mail, 8.9 percent Telephone
Panel 4: Accelerated questionnaire followed by second reminder (and absence of
advance letter):
- 63.7 percent self-response rate
- 38.1 percent Internet, 20.3 percent Mail, 5.3 percent Telephone
Panel 5: Telephone number at initial contact, accelerated questionnaire, and
second reminder (and absence of advance letter):
- 64.5 percent self-response rate
- 37.4 percent Internet, 17.6 percent Mail, 9.4 percent Telephone
Panel 6: Accelerated questionnaire, content tailored to nonrespondents, and
second reminder (and absence of advance letter):
- 65.0 percent self-response rate
- 37.6 percent Internet, 22.2 percent Mail, 5.2 percent Telephone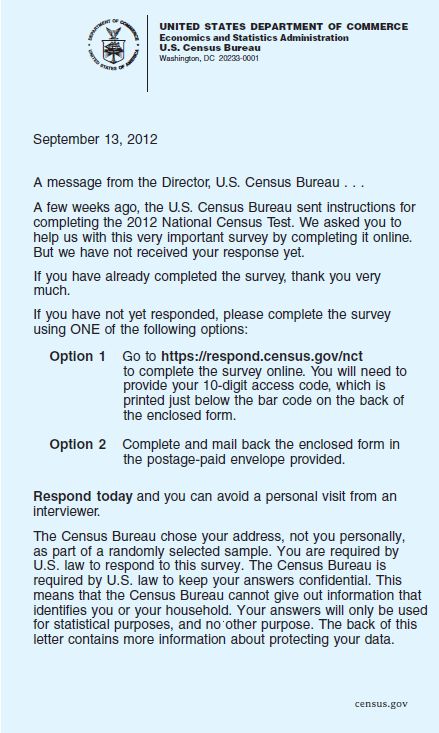
2012 National Census Test Contact Strategy Results 5
2) What are the Internet item nonresponse rates?
No statistically significant differences were found for item nonresponse rates across the
six contact strategy panels when controlling for multiple comparisons. We consider the
observed item nonresponse rates to be low, with all census data items having less than
three percent item nonresponse.
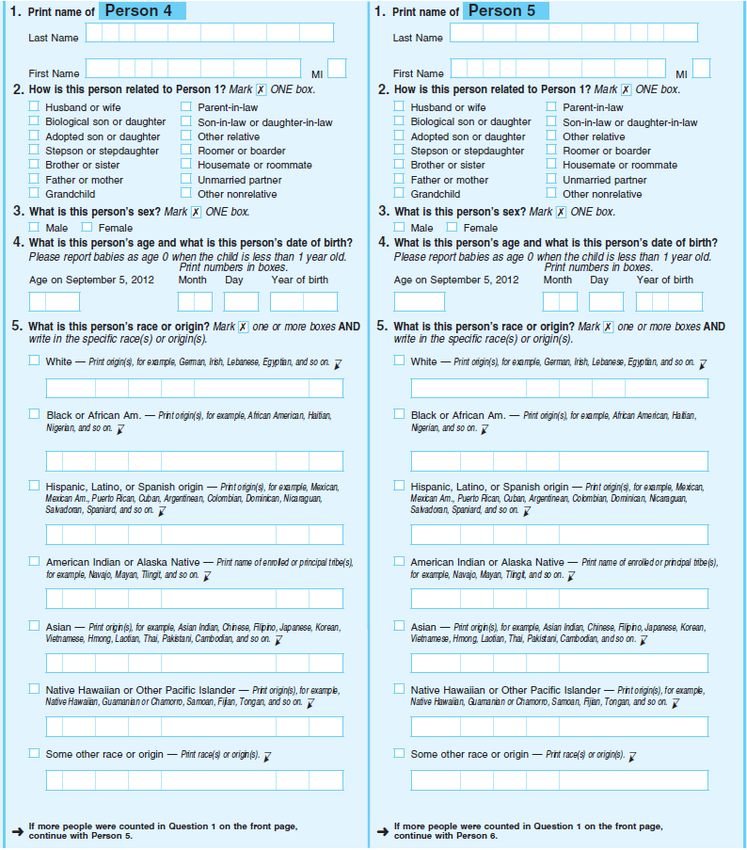
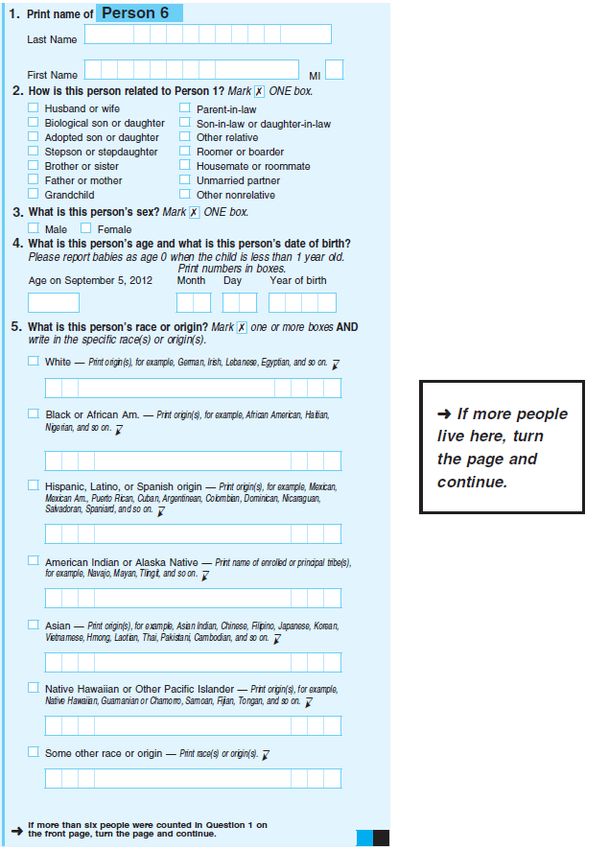
3) What are the Internet item nonresponse rates, distributions, and proportions of
detailed groups provided in the write-in fields (by the six race and origin groups) for
each of two versions of the combined race and Hispanic origin question? Did the use
of predictive text reduce the need for clerical race and origin coding?
The distributions between the two race and origin question versions were similar overall,
with the exception of a higher proportion who reported Asian alone and a lower
proportion of Hispanics who also reported a race category in the two-part question
version. In addition, the two-part version had significantly lower item nonresponse than
the one-part version. It is possible that this was due to a less cluttered appearance of the
two-part question version.
Asian respondents tended to provide the most detail, of the major groups. The proportion
of detailed reporting on the 2012 National Census Test Internet questionnaire
(streamlined version) was generally less than the proportion from 2012 National Census
Test paper questionnaires (streamlined version). The results did not indicate the expected
benefit of enhanced reporting of detailed race and origin groups.
We hypothesized that predictive text would reduce the need for clerical race and
origin coding by providing responses that a respondent could select rather than
type in themselves. We found that the proportion of responses requiring clerical
coding was higher for the Internet compared to paper, but we cannot attribute
causal meaning since other factors may have contributed to this difference.
4) What is the reason code distribution for Telephone Questionnaire Assistance calls
and overall Telephone Questionnaire Assistance workload associated with an
Internet Push methodology to use as a baseline (where one of the treatments
contained the Telephone Questionnaire Assistance phone number and another
included a strong message tailored to nonrespondents)? What are the completed
interview rates for telephone by contact strategy panel?
Telephone interviews were completed for 4,044 of 6,226 calls. Panel 3 and Panel 5
achieved the highest rates of telephone completes (8.9 percentage points and 9.4
percentage points respectively.)
The majority of the Telephone Questionnaire Assistance call sheets (76.0 percent)
indicated that the respondent had computer or Internet access issues. Another frequently
used category was difficulty with the Internet instrument (14.7 percent). Finally, the
2012 National Census Test Contact Strategy Results 6
“Other” category (14.8 percent) included calls from people who wanted to do the survey
over the telephone, those with a disability that prohibited paper or Internet completion
(e.g., blindness), and people calling to see if they could complete the survey for their
elderly relative or neighbor.
5) What do the paradata tell us about respondent navigation of the Internet
instrument, such as break-off rates, location of break-off, use of help screens,
answer changes, access failures, completion times, etc.?
91 percent of Internet respondents logged into the instrument only once.
The median completion time for the survey was 8.4 minutes.
The break-off rate for the Internet questionnaire was 3.8 percent.
Roughly 88 percent of the edit messages that occurred did so in the demographic
section of the instrument and about 81 percent of all edit messages happened on the
race and origin screens.
Among the demographic items, help link usage was highest for the race and origin
items.
Nearly 93 percent of Internet respondents accessed the survey by computer, 2.4
percent by smartphone, and 4.7 percent by tablet.
Over half of the sessions were accessed in Internet Explorer, 15.8 percent in Mozilla
Firefox and 14.3 percent in Google Chrome.
Recommendations
Incorporate multiple components of the panel strategies in future contact strategy
testing.
Include a telephone number on all mailing materials, as well as the bolded, tailored
statements on all nonresponse mailings.
Develop question presentation for race and origin groups via Internet with edit
messaging that encourages accurate detailed reporting, but does not promote satisficing
response behavior that results in artificial detailed reporting.
Analyze further the paradata to provide more intelligence on the interaction between
Internet data collection technology and respondent behavior, as well as to examine
detailed race and origin reporting patterns and a study of the American Community
Survey detailed responses before and after the implementation of the production
Internet response option.
Design a National Test to study the effects of relatively lower cost contact methods.
Research reporting patterns in the presence of predictive text.
Investigate using email address as a contact strategy or as a followup.
Test the Internet response mode and materials in languages other than English since
reporting patterns may differ by population groups.
Analyze 2012 National Census Test results by the eight segmentation clusters developed
for the 2010 Census Integrated Communication Program in an effort to identify
differing subpopulation response patterns.
Evaluate changes in content resulting from optimizing Internet data collection for
mobile devices.
2012 National Census Test Contact Strategy Results 7

1. Introduction
To meet the strategic goals and objectives for the 2020 Census, the Census Bureau is making
fundamental changes to the design, implementation, and management of the decennial Census.
These changes will build upon the successes and address the challenges of the previous Censuses
while also balancing challenges of cost containment, quality, flexibility, innovation, and
disciplined and transparent acquisition decisions and processes.

The U.S. Census Bureau is committed to using the Internet as a primary response option in the
2020 Census. However, much research and testing is needed throughout the next decade to
develop and implement a successful, secure, and user-friendly online instrument. The primary
goal of the 2012 National Census Test (NCT) was to evaluate new within-household coverage
strategies on the Internet. This test was also the first opportunity to establish baseline response
rate indicators which we can continue to monitor as we approach the 2020 Census. To this end,
the 2012 NCT assessed the relative self-response rates across various contact strategies. By
honing in on the more successful strategies in 2012, additional Internet tests can make efficient
use of sample and resources. Strategies tested in the 2012 NCT built off previous Census and
American Community Survey (ACS) research and included an Internet Push methodology with
additional reminders, new motivational wording, and various timing strategies for the paper
questionnaire mailout.

The main objective of the 2012 NCT was to test new, dynamic approaches for collecting the
number of people in a household, which are not feasible on a paper questionnaire. The concept of
“usual residence” is the main principle in determining where people are counted in a census.
Usual residence is defined as the place where a person lives and sleeps most of the time. The
standard paper questionnaire used in a census typically begins with the residence rule
instructions to guide the respondent as to whom to include as members of the household as of a
specific reference date. After the residence rule is presented on the questionnaire, the respondent
is asked about people who the respondent may have missed (undercounted) or included by
mistake (overcounted). In a self-administered Internet data collection instrument, the respondent
can be guided through a series of questions and conditional probes about usual residence to allow
us to gain a better understanding of who was living in the household on the reference day.

For the 2012 NCT, the Census Bureau aimed to optimize the presentation of the residence rule
instructions in an Internet data collection mode and identify validated methods for determining
the appropriate number of people in a household in accordance with its residence rule. To fully
assess the validity of the new approaches, a real-time, targeted, probing, coverage reinterview
was conducted by telephone with a sample of households that responded by Internet. The
purpose of this reinterview was to evaluate the accuracy of within-household coverage by
comparing the final household population roster collected via each Internet coverage approach to
the final roster collected via telephone. The goal was to obtain a “truth” measure for who was
living in the household on the reference day, with the reinterview assumed to be closer to the
truth due to its in-depth, interviewer-guided, probing questions.
2012 National Census Test Contact Strategy Results 8

A secondary objective of the 2012 NCT was to obtain baseline self-response rate indicators,
Internet self-response rates and item nonresponse rates under the Internet Push methodology.
The Census Bureau aimed to study the relative self-response rates associated with various
contact strategies under an Internet Push methodology in which households are encouraged to
respond online, and do not receive a paper questionnaire unless they have not responded by a
pre-determined date. Contact strategies were built off previous census and ACS research and
include alternate reminder and replacement questionnaire approaches, as well as variations on
the timing of the replacement questionnaire.

The 2012 NCT also presented the opportunity to experimentally evaluate two versions of a
combined Hispanic origin and race question in the Internet environment. Based on 2010 Census
Race and Hispanic Origin Alternative Questionnaire Experiment (AQE) results, the combined
race and Hispanic origin question showed to be a promising strategy (Compton, et al., 2012). In
addition, we incorporated the use of predictive text in this question. That is, the open-ended text
boxes in the Hispanic origin and race question produced a dynamic drop-down list of suggested
options based on the initial text string entered in the box. We hypothesized that predictive text
would reduce the need for clerical race and origin coding by providing responses that a
respondent could select rather than type in themselves. This was anticipated to have resulted in
fewer typos, misspellings, and other formatting differences that would require a clerical review,
thereby automating and streamlining the race and Hispanic origin coding process1. This
functionality could be an important component in fostering an adaptive design for the 2020
Census data collection, as it would allow for the use of edited data in the adaptive design
process.

Finally, another benefit of the 2012 NCT was the opportunity to build on previous paradata
research, by collecting data related to respondent interaction with the census Internet
questionnaire such as break-off rates and completion times. Laboratory usability testing
conducted prior to fielding the 2012 NCT also provided navigational data, such as eye-tracking,
keystroke analysis, and mouse-tracing results for the personal computer environment.

1.1 Scope

The 2012 NCT plays an early role in 2020 Census planning. The intent is to use the quantitative
survey results to focus the Census Bureau’s Internet development and design resources for
continued testing. This survey design work will be integrated with additional response option and
contact strategy research within the 2020 testing cycle, with the ultimate goal of establishing the
optimal Internet data collection strategy for the 2020 Census.

1.2 Intended Audience

This report is intended primarily for internal use by the U.S. Census Bureau.

1
 When respondents typed in the first three letters of their write-in response, matching options from the race and
origin database appeared. Respondents could choose from these or keep typing another response.
2012 National Census Test Contact Strategy Results 9

2. Background

2.1    Internet Response Option and Contact Strategy Research

The Census Bureau has conducted much Internet research over the last decade. Various Internet
response option strategies were first tested in the 2003 NCT, including the use of Internet Push
and Choice methods (Brady et al., 2004). Multiple panels tested a push strategy in which
respondents did not receive a paper questionnaire in the initial mailing, but instead received a
letter that described how to respond using either the Internet or by telephone using Interactive
Voice Response (IVR). Note that this study did not include a panel that tested the push strategy
for the Internet mode alone since it was not a realistic alternative census contact strategy due to
Internet coverage issues at that time in the planning cycle. Various choice strategies were also
tested in which respondents did initially receive a paper questionnaire, but were also offered the
choice of responding using the Internet or IVR (or both). The results showed that households that
were pushed to use the electronic modes were significantly less likely to respond (by about 5.7
percentage points). There was no difference in response for the households that were offered a
choice of alternative modes, with some of the responses simply shifting from paper to either
Internet or IVR. For the choice panels offering Internet as a response option, the Internet
response rate was less than seven percent. Finally, the item nonresponse rates for the Internet
responses were significantly lower for almost all items compared to the paper returns. This was
assumed to be due to the use of soft edits in the Internet application.

Internet testing continued in the 2005 NCT. Unlike the 2003 NCT, all households in the 2005
test were given the option to respond using the Internet. One experiment tested encouraging
Internet response in the replacement mailing (Bentley and Tancreto, 2006) whereby respondents
received a letter (in lieu of a paper replacement questionnaire) asking them to respond by
Internet if they had not already responded or to return their initial census paper questionnaire.
The results indicated that households who were encouraged to use the Internet at the replacement
mailing stage were significantly less likely to respond overall (by about 3.7 percentage points).

The Census Bureau tested an Internet option for the ACS in two separate tests during 2011. The
first test, conducted in April 2011, found that implementing an Internet Push methodology,
which removed the paper questionnaire from the first mailing (combined with an accelerated
mailing of the paper questionnaire to nonrespondents), was successful in terms of Internet
response, as well as in keeping overall response very close to (or better than) the mail-only
production rates (Tancreto, et al., 2012). The second test, conducted in November 2011, was a
followup study designed to validate the findings of the April test and investigate other strategies
to determine the best way to present the Internet mode in ACS mailings to maximize self-
response, particularly Internet response (Matthews, et al., 2012). As a result of this testing, the
Internet Push methodology (with an additional postcard reminder) was adopted by the ACS for
production implementation beginning in January 2013.

External research projects on Internet response rates have limited relevance to the use of a census
Internet response mode option because the census environment, including the sizable advertising
campaign and mandatory participation requirement, is unique in the survey world. However,
studies conducted on the Canadian Census apply more closely to a U.S. Decennial Census in that
2012 National Census Test Contact Strategy Results 10

it is conducted within a similar survey environment. Statistics Canada has included an Internet
response option throughout their most recent decade of research. For the 2011 Canadian Census,
an attempt was made to obtain as many responses as possible by Internet. In 2011, 60 percent of
Canadian households did not receive a paper questionnaire. Instead, those households received a
letter providing the website address, a secure access code, and a toll-free number to call for a
questionnaire. Statistics Canada anticipated a 40 percent Internet response rate using this
methodology (Cote and Laroche, 2009), but ultimately realized a 54.4 percent Internet response
rate in their 2011 Census (Statistics Canada, 2012). This is an encouraging result in terms of the
use of an Internet response option in a census environment.

2.2       Internet Instrument Design Research

Following the 2010 Census, the Census Bureau conducted the 2010 Census Quality Survey
(CQS), which provided estimates of measurement error associated with the design and content of
a self-administered, census Internet questionnaire. This was a census reinterview evaluation and
was not intended to evaluate public compliance (as measured by unit-level response rates), since
an Internet response strategy study conducted shortly after the 2010 Census production cycle
would be critically limited by a census-sponsored message stating that there was no Internet data
collection for the census. The CQS implemented three different contact strategy approaches:
Internet Push, Internet/Mail Choice, and Mail Only.

The CQS found that, across contact strategies, both Internet and mail respondents provided
consistent responses to the survey compared to the 2010 Census. The gross difference rates for
the Internet respondents were not higher than those of the mail respondents, and in some cases
significantly smaller, suggesting that responses to an Internet census instrument would have
similar measurement error compared to the census paper questionnaire (Bentley et al., 2011).

The study also found lower rates of missing data for Internet responses, which is attributed to the
use of soft edits2 in the Internet instrument.

2
  Most data items were subject to “soft edits.” When an error was made (e.g., an item was left blank or the response was invalid),
a message appeared at the top of the screen, above the main questions, indicating that no answer was provided or that there was a
problem with the information entered. The respondent was given the opportunity to change the information and continue.
However, if nothing was changed or the error still existed and the respondent again pressed “Next,” they were allowed to bypass
the error and continue entering data for the next question (Bentley et al., 2011).
2012 National Census Test Contact Strategy Results 11

3. Methodology
The general methodology for the 2012 NCT focused on the use of new Internet-based coverage
approaches3, as well as an Internet Push approach tested across six contact strategies. The
advance letter was sent on August 23, 2012 (to one panel only). Data collection began on
August 30, 2012 after the initial mailing was sent with a survey reference date of
September 5, 2012. Data collection concluded on October 18, 2012.

Telephone response and TQA were available throughout the data collection period. Telephone
agents answered respondent questions and encouraged respondents to complete the survey
online, but also gave the respondent the opportunity to complete the interview over the
telephone. In the initial mailing, the telephone as a response option was only offered to sample
households in one panel. The remaining households first received the telephone number in the
subsequent mailing, the reminder postcard4. However, note that the reminder postcard did not
explicitly say that they could respond by telephone. The telephone number was presented in the
following context, “If you need help completing your survey, please call 1-800-972-5650.”

3.1 Research Questions

The research questions presented in this report are related to contact strategies, item response,
two versions of a combined race and origin question, Telephone Questionnaire Assistance
(TQA), and Internet paradata5.

1) What are the relative overall self-response rates (and self-response rate differences)
   associated with each of the six contact strategies? What are the Internet self-response rates
   by contact strategy?

2) What are the Internet item nonresponse rates?

3) What are the Internet item nonresponse rates, distributions, and proportion of detailed groups
   provided in the write-in fields (by the six race and origin groups) for each of two versions of
   the combined race and Hispanic origin question? Did the use of predictive text reduce the
   need for clerical race and origin coding?

4) What is the reason code distribution for TQA calls and overall TQA workload associated
   with an Internet Push methodology to use as a baseline (where one of the treatments
   contained the TQA telephone number and another included a strong message tailored to
   nonrespondents)? What are the completed interview rates for telephone by contact strategy
   panel?

3
    Recall that results related to the 2012 NCT coverage strategies will be presented in a separate report.
4
  TQA was conducted using the same web instrument that was designed for respondents (with a slightly different
entry screen). Some of the question screens were not easy to transition from a self-response mode to an interviewer-
administered mode and interviewers had to make these alterations on the fly, using handouts presented during
training. Ideally, the TQA instrument would have been optimized as an interviewer-administered instrument, but due
to time constraints, this was not possible.
5
  Results for research questions related to coverage strategies will be presented in a separate report.
2012 National Census Test Contact Strategy Results 12
5) What are the paradata for the Internet questionnaire, such as break-off rates, location of
break-off, use of help screens, answer changes, access failures, completion times, etc.?
3.2 Assumptions
Research and planning for the 2020 Census has been focused on major innovations to the design
of the census oriented around the major cost drivers of the 2010 Census. Identification of those
cost drivers led us to four major design principles with the following overarching assumptions
(Bishop, 2014):
Reengineering Address Canvassing:
In-field address canvass only 20 percent of total housing units
Eliminate early-opening local census offices (manage from Regional Census Centers)
Redesign the training strategy to reduce enumerator training hours by 35 percent
Reduce the number of crew leader assistants by 50 percent
Establish a training pay rate of $1.50 lower than the production pay rate
Optimizing Self-Response:
Promote for internet self-response from 55 percent of the population
Mail paper questionnaires to only a targeted 20 percent of nonrespondents
Achieve a reduction in paper data capture operations and infrastructure as compared to
the 2010 Census
Utilizing Administrative Records:
Reduce the total NRFU workload by 11 percent through the removal of vacants and
deletes
Reduce the total number of local census offices by 12 percent through the removal of
vacants and deletes
Eliminate Coverage Followup and Vacant/Delete Operations
Reduce the total number of NRFU visits
Reengineered Field Operations:
Increase NRFU productivity by 20 percent with automation
Remove late responses from the NRFU workload
Reduce the total number of local census offices by 5 percent
Reduce the total square footage of local census offices by 70 percent
Eliminate Crew Leader assistants
Reduce the number of clerical staff by 20 percent with automation
Redesign the training strategy to reduce enumerator training hours by 35 percent
Establish a training pay rate $1.50 lower than the production pay rate
Allow seventy-five percent of enumerators to bring their own device (BYOD)
Reduce the phone/personal visit contact cycle relative to the 2010 Census
Use routing and dynamic case management to allocate resources efficiently2012 National Census Test Contact Strategy Results 13 This report focuses on the assumptions associated with Optimizing Self-Response. 3.3 OMB Clearance This research project, 2012 National Census Test, is covered under OMB clearance number 0607-0970 which expired 03/31/2013. 3.4 Schedule Prepare initial Draft of Optimizing Self-Response Project Report ..............................................04/16/2013 Distribute initial draft to critical reviewers for review. ...............................................................05/01/2013 Incorporate comments. .................................................................................................................05/17/2013 Results presented at 2020 Census Management Review. ...........................................................09/24/2013 Incorporate comments. ................................................................................................................10/17/2013 Brief final draft product to the 2020 R&T Strategies Group. .....................................................09/04/2014 Report released in DSSD Memorandum Series. .........................................................................11/06/2014 3.5 Sample Design For the 2012 NCT, the initial sample was selected from housing units in mailout/mailback areas of the 50 states and the District of Columbia, using the July 2011 extract of the Master Address File. Group quarters and housing units in any other types of enumeration areas were not included in the sampling frame. Further, to reduce burden on respondents, any housing units selected for the 2012 ACS sample (entire year) were also excluded from the sampling frame. In preparing the 2012 NCT sample design, we closely examined response rates in the 2003 and 2005 NCTs, as well as the 2010 CQS, to determine the response rate assumptions for the 2012 NCT. The 2010 CQS Internet Push panel is the starting point for the methodology and design of the 2012 NCT. That test is not directly comparable, since it was a reinterview of households that had already responded by mail to the 2010 Census and thus were already more inclined to respond to surveys, but 24.8 percent responded using the Internet survey and 46.5 percent responded overall. Given the further increase in Internet accessibility and usage in the two years since the CQS, we expected 25 percent of the 2012 NCT to respond by Internet and at least 45 percent to respond by some means (Internet, mail, or telephone). A sample of 80,000 housing units was randomly assigned to one of five Internet content paths (based on differences in coverage design as well as race and origin question versions) and one of six contact and notification strategies. The test panels were assigned in two stages, first by pre- assigning each selected housing unit to an Internet content path, and then by assigning each selected unit to a contact strategy (Bentley and Meier, 2012). Two sampling strata were used. The first stratum, “CFU,” included a substantial oversampling of units that were in the 2010 Census Coverage Followup (CFU) operation, in order to optimize the sample in an attempt to reach more units with unique coverage situations. The sample size for the CFU stratum was 50,000 housing units. The second stratum, “All Other,” consisted of all other eligible housing units in the sampling frame and had a sample size of 30,000 housing units.
2012 National Census Test Contact Strategy Results 14

Due to budgetary reasons, the maximum reinterview workload was capped at 20,000 housing
units. Reduction groups, that is random groups of specific size, were pre-assigned to sample
households to avoid exceeding the maximum number of reinterview cases assigned for
reinterview. One or more of those groups could be designated to be dropped from sample, in
which case housing units from those groups that had not yet been reinterviewed would not be
added to the reinterview workload. Households from those groups that had already been
reinterviewed remained in sample. This method ensured that late responders were included in the
reinterview, but the 20,000 case limit was not surpassed (Bentley and Meier, 2012).

3.6 Study Design and Implementation

3.6.1 Contact Strategies

The 2012 NCT tested six different contact strategies utilizing Internet Push methodology. The
base contact strategy was modeled after the core approach used in the 2010 Census (advance
letter, initial survey request, reminder postcard, and a final survey request sent only to
nonrespondents). Across all panels, the initial survey request included an initial cover letter and
an instruction card (in place of a questionnaire) containing information on how to access the
survey online. A combination of motivational strategies was included on the initial cover letter,
as well as subsequent mailing pieces. This built on the results of the 2010 Census Deadline
Messaging and Compressed Mailing Schedule Experiment, which found an increase in mail
response in the presence of a cost savings message, a notification that nonrespondents may be
visited by an enumerator, and the use of “respond by” as opposed to the use of the term
“deadline” (Stokes et al., 2011). All households in each panel received a reminder postcard that
was sent out about a week after the initial survey request. As mentioned earlier, the reminder
postcard contained the TQA phone number for respondents to call if they needed help
completing their survey.

For applicable panels, a second reminder was sent to nonrespondents in the form of a postcard.
The postcard was blue and slightly larger than the first postcard to distinguish it as a separate
mailing piece. A second reminder postcard successfully increased response in the 2011 ACS
Internet Followup Test when it followed an accelerated questionnaire6 mailing (Matthews et al.,
2012). The second reminder postcard treatment was based on this success.

The cover letter that accompanied the paper questionnaire targeted to nonrespondents provided a
choice of Internet or paper response options. This continued the paper “replacement”
methodology, in which both a paper questionnaire and the Internet response option were offered.
This methodology performed well in the 2010 CQS and both 2011 ACS Internet Tests. This was
a chance for those with neither Internet nor telephone access to respond to the mandatory data
collection. Table 1 displays the 2012 NCT contact strategy panel design. Detailed descriptions of
the individual panel treatments follow. See Appendix A for copies of all mail materials. See
Appendix B for a copy of the mail questionnaire.

6
    A questionnaire sent one week earlier than the typical mailing schedule.
2012 National Census Test Contact Strategy Results 15
Table 1. 2012 NCT Contact Strategy Panel Design
Panel Thursday Thursday Tuesday Friday Friday
August 23, August 30, September September 14, September 21,
2012 2012 4, 2012 2012* 2012*
Letter + Mail
1) Advance Letter Advance Reminder
Internet questionnaire
(n=13,334) letter postcard
instructions (w/choice)
2) Absence of Letter + Mail
Reminder
Advance Letter Internet questionnaire
postcard
(n=13,334) instructions (w/choice)
3) 2nd Reminder
Letter + Mail
prior to Reminder 2nd Reminder
Internet questionnaire
questionnaire postcard Postcard (blue)
instructions (w/choice)
(n=13,333)
4) Accelerated Q Letter + Accelerated Mail
Reminder
followed by 2nd Internet questionnaire 2nd Reminder
postcard
reminder instructions (w/choice) Postcard (blue)
(n=13,333)
5) Telephone Letter +
number at initial Internet Accelerated Mail
contact, instructions Reminder questionnaire 2nd Reminder
accelerated Q, with postcard (w/choice) Postcard (blue)
and 2nd reminder telephone
(n=13,333) number
Accelerated Mail
6) Accelerated Q, 2nd Reminder
Letter + questionnaire
content tailored to Reminder Postcard (blue)
Internet (w/choice) with
nonrespondents, postcard with content
instructions content tailored
and 2nd Reminder tailored to
to
(n=13,333) nonrespondents
nonrespondents
*These mailings were targeted to nonrespondents.
Panel 1: Advance Letter (Control)
The control panel implemented a strategy most comparable to previous censuses in terms
of contact materials and timing. Households in this panel received an advance letter, initial
package with instructions for accessing the Internet instrument, reminder postcard, and
targeted replacement package with a paper questionnaire and choice of Internet or mail
response.
Panel 2: Absence of advance letter
This panel tests the removal of the advance letter prior to the initial survey request. As
Dillman (2000) states, research has shown consistently that a pre-notice letter will improve
response rates to mail surveys, but it is unclear whether the effect stems from the fact that
it is one additional mailing and the more contacts the higher the response rate, or whether it
is a unique type of contact. The advance letter was viewed by many as government waste
in the 2010 Census (Emery, 2010; Harper, 2010; Hicks, 2010). Although its purpose is to
establish survey legitimacy and alert households to the coming survey request, the use of2012 National Census Test Contact Strategy Results 16
an advance letter may draw more criticism when received as part of an Internet Push
methodology. That is, from a cost-savings perspective, sending a paper letter notifying
respondents that a web survey invitation is coming, may appear even more wasteful, when
the letter itself does not provide any actionable response mode options. Additionally, a
decennial census carries with it an extensive advertising and promotional campaign, which
we expect will urge respondents to use the Internet response mode in 2020. This
advertising campaign may effectively serve as advance notice and thereby further reduce
the usefulness of an advance letter. Furthermore, Statistics Canada did not use an advance
letter in their 2011 Census (which implemented an Internet Push methodology).
Panel 3: Second reminder notice prior to questionnaire (and absence of advance letter)
A second reminder of a different color (blue) was sent prior to the questionnaire in this
panel. This panel was a variation on a second reminder approach tested in the 2011 ACS
Internet Test, and now used in ACS production and incorporated some of the same
motivational phrases (e.g., “Now is the time to respond.”) The second reminder is tested
against only one reminder.
Panel 4: Accelerated mailing of paper questionnaire followed by second reminder (and
absence of advance letter)
Mailing a paper questionnaire to nonrespondents one week earlier followed by a second
reminder was successful in the second 2011 ACS Internet Test, and this strategy is now
used in ACS production. This treatment tests the effect of mailing the paper questionnaire
to nonrespondents (followed by a second reminder) one week after the first reminder
postcard, as opposed to two weeks after the reminder postcard.
Panel 5: Telephone number provided at initial contact, accelerated questionnaire, and
second reminder (and absence of advance letter)
Providing a telephone number at the initial Internet invitation is similar to a strategy used
in the 2011 Canadian Census (Statistics Canada, 2012). In this panel, we included the
telephone number in place of a statement that tells respondents a paper form will be mailed
to them in a few weeks.7 The assumption is that inbound telephone data collection in the
2020 Census will be less expensive than attempting to enumerate nonrespondents via
personal visit. We consider this treatment an implicit choice of Internet and telephone
response, since the respondent was asked to respond by Internet, but the telephone number
was listed later in the letter as a fallback option in the following way, “If you are unable to
complete the survey online, you may call 1-800-972-5650 to provide your census
information over the phone.” Telephone number was not listed in the initial letter for all
other panels, since the goal was to maximize Internet response.
7
The assurance that a paper form will be mailed later was suggested by Don Dillman during the development of
materials associated with the 2010 CQS, in order to provide advance notification of an alternative response option
for Internet Push recipients who do not have Internet access. The assertion is that this notice on the Internet
invitation cover letter may mimic a choice option. However, offering an Internet and paper response choice reduced
overall response compared to the push strategy in the targeted stratum of the April 2011 ACS Internet Test and
resulted in a lower relative Internet self-response rate in the 2010 CQS.2012 National Census Test Contact Strategy Results 17
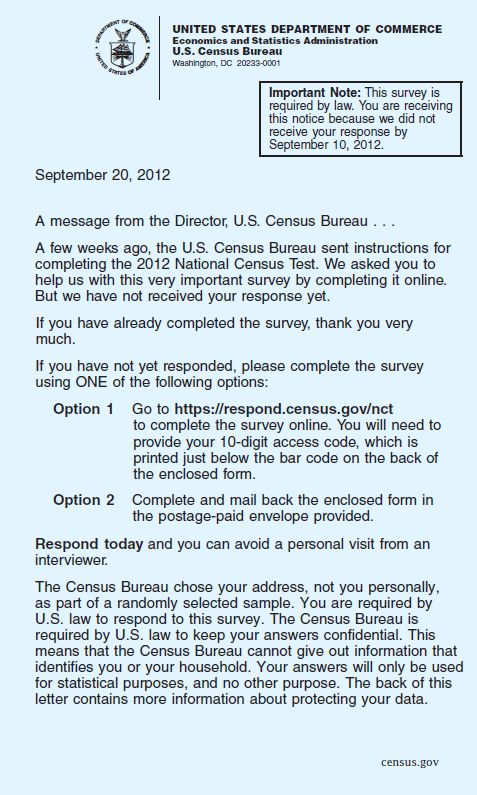
Panel 6: Accelerated questionnaire, content tailored to nonrespondents, and second
reminder (and absence of advance letter)
This treatment is based on the hypothesis that a targeted reminder with content tailored to
the nonrespondents might yield an increase in self-response rates. The following
statement was added within a bolded box at the top of the reminder (or cover letter)
before the greeting: “Important Note: This survey is required by law. You are
receiving this notice because we did not receive your response by September XX,
2012.” The outbound envelope (and front of postcard) contains the standard phrasing,
“Your response is required by law” followed by the additional statement, “We have
not yet received your response.” This strategy assumes that the explicit inclusion of the
cut date would provoke in the respondent a perceived lack of anonymity. This message
aimed at nonrespondents may compel some recipients to respond who would not
otherwise have responded. This panel was inspired by the second reminder letter used in
the 2011 Canadian Census, in which the following wording was used, “Important note: If
you refuse to complete a census questionnaire, this information may be documented and
referred to the Public Prosecution Service of Canada for further action.”
3.6.2 Internet Instrument Development
The design of the Internet instrument built on that of the 2010 CQS instrument, which benefited
from external consultation. However, the design of the 2012 NCT instrument had some different
design features, which were tailored to the 2012 objectives. Improvements were also made to the
instrument based on lessons learned in the 2010 CQS. Although some changes were made for the
2012 instrument, including color and look and feel, the overall layout and design were the same
as the 2010 CQS instrument.
Access/Authentication:
Respondents accessed the Internet survey by using a ten-digit access code,8 which was provided
to the respondent in the initial survey request via mail. Since security procedures in the 2020
Census are expected to be much more advanced, no attempt was made to replicate the 2010
Census process of using the relatively long Census ID as the access code. A four-digit personal
identification number (PIN) was auto-generated to allow respondents to come back and finish the
survey at a later login time.
The instrument also contained a new verification question feature. Upon entering the survey,
respondents were asked to provide an answer to a verification question of their choosing.
Respondents could use this feature to access the survey at a later date, if they had forgotten or
lost their PIN. Instrument developers worked with internal security experts to ensure that the
access strategy met security standards and existing requirements. This strategy is described in
detail in the 2012 National Census Test Online Instrument Security Profile (DSSD, 2012).
8
The ten-digit access code contained two check digits to reduce the likelihood that a respondent would mistype their
access code and, in doing so, match another household’s access code.2012 National Census Test Contact Strategy Results 18 Instrument Appearance: The appearance of the 2012 NCT Internet instrument was designed to be consistent with the look and feel of an ‘official’ federal survey. The color scheme and overall design was consistent with www.census.gov. Topic-Based Format: The 2012 NCT Internet instrument was designed with topic-based ordering of person items instead of person-based, as presented on the paper questionnaire. The planned approach in Nonresponse Followup (NRFU) on the hand-held computers for the 2010 Census was to collect items by topic since cognitive research showed that respondents preferred a topic-based approach (Childs, 2008). The 2010 Telephone Questionnaire Assistance (TQA) data collection instrument was also topic-based. Although these differ from the 2012 NCT Internet instrument in that they are interviewer-administered data collection instruments, they both display one item per screen. 9 The 2010 CQS also collected data in a topic-based format, which worked well. Respondent Assistance: The respondent had the ability to click on links in the top banner of the page to access instructions and general survey Frequently Asked Questions (FAQs), which included information on navigation, estimated burden, and the types of questions being asked. The logout button was also contained in the top banner. In addition, information links appeared on the bottom right of every screen that allowed respondents to access information about the Census Bureau’s policies on privacy, security, and accessibility. While general information on privacy and security was included in the FAQs, the links at the bottom of the screen took respondents to the actual www.census.gov page that outlined the Census Bureau’s privacy and security policies. All census data items (i.e. items asked of all persons) contained item-specific help10. The “Help” link appeared next to the question stem but not next to each response option since this would clutter the screen. For item-specific help, a respondent could click on the “Help” link next to the question and a new window would open on top of the current survey window. This new window was not a pop-up since many people have pop-up blockers on their computers. This help window included explanatory text on how to answer the item, which was based on the help information available in TQA as well as the FAQs for the 2010 Census. The window contained an “X” in the upper right hand corner, as well as a “Close” button at the bottom to close the window. If the window was not closed, it would remain open in the background when the respondent clicked the “Next” button in the instrument or clicked anywhere on the screen. If they clicked the “Help” link again, the new help window would become active and replace the old help window that was never closed. 9 Note that the topic-based Internet instrument used in the 2005 NCT had a different topic-based format in that the questions were asked all on one screen for the entire household using a different line for each person, as opposed to one question per person per screen. 10 Mail respondents to the 2012 NCT had access to help by calling a toll-free TQA number listed on the back of the paper questionnaire and in some mailing pieces.
2012 National Census Test Contact Strategy Results 19

Data Pre-fills:

The 2012 NCT Internet instrument made use of web-based survey technology by using pre-fills
for names in the question stem for the person data items (as well as using the address pre-fill in
address-based questions). For example, if a respondent listed “John L Doe” on the roster, the sex
question asked “What is John L Doe’s sex?” The pre-fills were used to increase clarity and
potentially reduce errors in the presence of the topic-based format.

Automated Edits:

Most data items were subject to “soft edits.” When an error was made (e.g., an item was left
blank or the response was invalid), a message with red text appeared at the top of the screen,
above the main questions, indicating that there was a problem with the information entered. The
respondent was given the opportunity to change the information and continue. However, if
nothing was changed and the respondent again pressed the “Next,” button, they were allowed to
bypass the error and continue entering data for the next question. If respondents changed the
answer to something that was also incorrect, the edit message would not appear a second time.
Note that the respondent name screen and the roster screen required an answer for the respondent
to be allowed to continue the survey (i.e., a “hard edit.”) Since names are pre-filled in the
question stems, the instrument cannot be completed without some kind of response in the name
fields. It is imperative that the respondent understand to whom each question is referring. During
roster completion, we provided up to two edit messages that explicitly told respondents that they
could use a nickname or description in place of full name. It should also be noted that a single
character in any of the name fields constituted a response and would not trigger an edit.

In addition to the red edit messages, which were used in the 2010 CQS, the 2012 NCT
introduced the use of green edit messages on the age/date of birth and race and origin screens.
Green edit messages occurred on the age/date of birth screen to accommodate respondents who
might not know the exact date of birth or the exact age of all household members. Green
messages also occurred on the race and origin screen for respondents who did not know the
detailed origin for the household members as well as for those who did not identify with a
detailed race or origin beyond the Office of Management and Budget (OMB) categories. In these
instances, the respondent was shown a green edit message with an “i” icon (for information) that
explained the request for additional information and explicitly told the respondent they could
press the “Next” button to continue if they did not know the requested information. These
alternate edit messages were the result of respondent difficulty with the race and origin item in
the usability lab. Requesting detailed origin information and providing a red edit message when
left blank (leading respondents to believe they had to change the information in order to
continue) caused some respondents to provide an origin to which they did not legitimately have a
connection. For example, one “White” participant from the instrument usability test added the
“Chinese” origin because she grew up with an Asian caretaker to whom she was close (reference
forthcoming).
You can also read