WKPETSAMP REPORT 2018 - Joint WGBYC-WGCATCH Workshop on sampling of bycatch and PET species (WKPETSAMP) - ICES
←
→
Page content transcription
If your browser does not render page correctly, please read the page content below
WKPETSAMP REPORT 2018

         ICES ECOSYSTEM OBSERVATION STEERING GROUP

                          ICES CM 2018/ EOSG: 35

                            REF ACOM, SCICOM,
                            WGBYC & WGCATCH

Joint WGBYC-WGCATCH Workshop on
 sampling of bycatch and PET species
                       (WKPETSAMP)

                                  24–26 April 2018

                       SLU Aqua, Lysekil, Sweden
International Council for the Exploration of the Sea
Conseil International pour l’Exploration de la Mer
H. C. Andersens Boulevard 44–46
DK-1553 Copenhagen V
Denmark
Telephone (+45) 33 38 67 00
Telefax (+45) 33 93 42 15
www.ices.dk
info@ices.dk

Recommended format for purposes of citation:

ICES. 2019. Joint WGBYC-WGCATCH Workshop on sampling of bycatch and PET spe-
cies (WKPETSAMP), 24–26 April 2018, SLU Aqua, Lysekil, Sweden, ICES CM
2018/EOSG:35. 76 pp.

The material in this report may be reused for non-commercial purposes using the rec-
ommended citation. ICES may only grant usage rights of information, data, images,
graphs, etc. of which it has ownership. For other third-party material cited in this re-
port, you must contact the original copyright holder for permission. For citation of da-
tasets or use of data to be included in other databases, please refer to the latest ICES
data policy on the ICES website. All extracts must be acknowledged. For other repro-
duction requests please contact the General Secretary.

The document is a report of an Expert Group under the auspices of the International
Council for the Exploration of the Sea and does not necessarily represent the views of
the Council.

© 2019 International Council for the Exploration of the Sea
Contents

Executive Summary................................................................................................................ 1

1      Adoption of the agenda ................................................................................................ 3

2      Inventory of existing sampling programmes (ToR a) ............................................. 3

3      At-sea catch sampling programmes vs directed studies – comparison of
       designs, advantages and limitations (ToR b)............................................................ 4

4      Alternative methods to obtain data on bycatches (ToR b) ..................................... 7

5      Precision and accuracy needed by end users. What do we know? (ToR b)
       ........................................................................................................................................... 9

6      Criteria to evaluate if at-sea sampling programmes meet end user needs
       (ToR b) ........................................................................................................................... 11

7      Mechanisms for storage, maintenance and dissemination of data
       originating from at-sea catch sampling programmes and directed studies
       (ToR c) ............................................................................................................................ 16

8      Preparation of guidelines for at-sea sampling programmes, suggestion
       for best practices and relevant parameters for PETS sampling (ToR d) ............ 23

9      References ..................................................................................................................... 26

Annex 1: List of participants ............................................................................................. 27

Annex 2: Agenda ................................................................................................................. 28

Annex 3: Guidelines for best practice in catch sampling schemes. From ICES
   WKPICS2 2012 .............................................................................................................. 29

Annex 4: A comparison of bycatch rates calculated from dedicated bycatch
   monitoring and fish catch monitoring (DCF) in the UK ...................................... 32

Annex 5: Inventory of sampling programmes where bycatches are recorded......... 35

Annex 6: Recommendations ............................................................................................. 73
WKPETSAMP Report 2018 | 1 Executive Summary This workshop, chaired by Bram Couperus (the Netherlands) and Katja Ringdahl (Sweden) was held at SLU-Aqua, Lysekil, Sweden between 24–26 April 2018, with 10 participants from 7 countries. Prior to the workshop, participants from each country were provided with a template to summarize information on their sampling schemes, Data Collection Framework (DCF) sea-sampling programmes, dedicated bycatch monitoring programmes and di- rected bycatch studies, in which bycatch data are obtained. These were collated into an inventory and developed further at the workshop. The inventory describes when the different programmes/surveys started, what kind of monitoring it is, what the main objective of the programme is, where it takes place, what fishery it covers, the sampling design of the programme, sampling intensity and how data is stored, along with some expert judgement on the perceived importance of these fisheries compared to other fisheries in relation to the bycatch of birds, mammals, PET fish species, elasmobranchs and reptiles. The suggestion from WKPETSAMP is to fully populate this inventory with information on equivalent programmes from other countries and to update it on an annual basis, allowing for more complete future as- sessments on how data on bycatches are sampled throughout Europe. WKPETSAMP suggest that the ICES Working Group on Protected Species Bycatch (WGBYC) assumes the responsibility to manage the inventory. WKPETSAMP compared the strengths and limitations between fish catch sampling programmes, dedicated bycatch monitoring programmes and directed bycatch stud- ies. The UK was the only participating country running a dedicated bycatch monitor- ing programme. An important distinction between catch sampling / bycatch monitor- ing programmes and directed bycatch studies is that directed studies are usually lim- ited in time and space which make them unsuitable for extrapolating results to areas beyond the immediate fishery of focus. Catch sampling and bycatch monitoring pro- grammes have a larger spatial and temporal coverage meaning that extrapolation is appropriate, but may have high uncertainty due to monitoring intensity. Fish catch sampling programmes tend to focus on fisheries with large volumes of catch and/or fisheries were discards are considered high. This often coincides with fisheries of rele- vance for bycatches of protected fish species and elasmobranchs but with a lesser rele- vance for bycatches of birds, marine mammals and reptiles. Observers working in catch sampling programmes might not be specifically trained for typical bycatch monitoring tasks (e.g. they might not check for drop-outs or have difficulties with protected species identification). An additional limitation of catch sampling programmes for quantifying protected species bycatch was that observers may have to carry out multiple tasks on board and so may not be able to fully observe fishing operations for incidental bycatch (i.e. they may not be present in the right position at the right time), and generally do not record to what extent the haul was actually properly monitored for bycatch. A way forward might be to design robust multipurpose catch/bycatch sampling programmes in which observers focus on fish catch sampling on some hauls and on bycatch moni- toring on others. WKPETSAMP was also asked to attempt to identify the precision and accuracy re- quired by end users. Work Package 3 (WP3) from the FishPi project has prepared an overview of these requirements and the workshop reviewed this work and concluded that end user needs are generally not clearly enough defined by the end users them- selves. Another part of WKPETSAMP’s remit was to develop criteria to evaluate if at- sea sampling programmes actually meet end user needs. It was proposed to carry out
2 |                                                               WKPETSAMP Report 2018

risk assessments following the method developed in WKBYC (ICES, 2013), which was
further developed within the FishPi project. Risk assessments were carried out within
the FishPie project for most areas in the NE Atlantic, but not for the Baltic, Mediterra-
nean or Black Sea. WKPETSAMP has recommended that WGBYC should be tasked
with filling these gaps.
In addition WKPETSAMP was asked to define proper mechanism(s) for storage,
maintenance and dissemination of the bycatch data generated from sampling pro-
grammes and directed studies. The outcome can be summarized as follows: (1) build
routines into sampling (parts of) the entire haul and treat any rare item in the catch as
an incidental bycatch, (2) provide observers with proper instructions and training, in-
cluding protocols for identification and recording of rare catch items, (3) clear indica-
tion of species selection within sampling procedures so that real zeros can be distin-
guished from zeros arising through non-sampling, (4) adequate design of the national
database(s) where catch and bycatch information is stored. WKPETSAMP were further
given a presentation on the new data model for the Regional Database and Estimation
System (RDBES) and an opportunity to provide feedback on fields needed to take re-
quirements from bycatch studies into account. The Second Workshop on Practical Im-
plementation of Statistical Sound Catch Sampling Programmes (WKPICS2 - ICES 2012)
developed guidelines for best practice on the design and documentation of catch sam-
pling programmes. The guidelines are generic and have high relevance for catch sam-
pling programmes and studies providing data on incidental bycatch. WKPETSAMP
developed a draft guidance for best practice on some of the issues that were discussed
during the meeting, in particular in relation to training of observers, sampling proto-
cols and data capture in the same format as the WKPICS2.
WKPETSAMP Report 2018                                                                | 3

    Opening of the meeting
    The workshop started at SLU-Aqua, Swedish University of Agricultural Sciences in
    Lysekil, Sweden, on Tuesday, 24 April at 10:00 and closed on Thursday, 26 April at
    16:00. 10 representatives from 7 countries attended the workshop (Annex 1).

1   Adoption of the agenda

    The agenda of the meeting is included in Annex 2.

2   Inventory of existing sampling programmes (ToR a)

    TOR A of WKPETSAMP was to compile an inventory of the various sampling pro-
    grammes that provide information on incidental bycatch at the national level. These
    programmes include regular Data Collection Framework (DCF) at-sea sampling pro-
    grammes as well as other national monitoring programmes and directed studies that
    focus on protected species bycatch.
    A template for the inventory was designed and circulated prior to the workshop and
    was filled in by the participants. The template was then updated during the meeting
    in light of different problems, issues and misinterpretations that occurred when partic-
    ipants initially filled it in.
    In the final document we have compiled information on at-sea data collection pro-
    grammes from Germany, Greece, Iceland, Ireland, Netherlands, Spain (Basque
    county), Sweden and the United Kingdom. The inventory is found in Annex 5.
    The programmes vary in methodology, from regular DCF sampling programmes,
    wide-scale bycatch monitoring programmes, self-sampling programmes, to direct
    studies on bycatch or interviews and surveys with fishermen. The inventory details
    when the different programmes/surveys started, what kind of monitoring is con-
    ducted, what the main objective of the programme is, spatial scale, what fisheries are
    covered, sampling protocols, sampling intensity, what data is recorded, along with
    some expert judgement on the perceived importance of monitored fisheries compared
    to other fisheries in relation to the bycatch of birds, marine mammals, PET fish species,
    elasmobranchs and marine reptiles.
    The inventory will be forwarded to the Fish Pi2 (MARE/2016/22) project, and to the
    ICES Working Group on Protected Species Bycatch (WGBYC), to gather information
    on sampling programmes in other countries. It can also be forwarded to the Regional
    Coordination Groups (RCGs) for completion on DCF sea-sampling programmes in all
    EU countries.
    The inventory provides an opportunity to get an overview of all programmes and stud-
    ies collecting information on protected species bycatch. The existence of such an over-
    view provides end users of the data, such as ICES WGBYC, the potential to assess what
    data should be available and to identify gaps to help further improve data collection
    efforts. It may also be useful to and inform expectations on where, for example, bycatch
    rates can be appropriately generated. This is of increasing importance as more focus is
    put on quantifying bycatches in fisheries in connection with sustainability accredita-
    tion schemes but also because of the broadening scope of the Common Fisheries Policy
4 | WKPETSAMP Report 2018
(Council Regulation 1380/2013) within EU as it moves towards the proper implemen-
tation of the Ecosystem Approach.
However it is important that the inventory is managed and kept up to date in order to
maximise its utility. WKPETSAMP thereby recommend that WGBYC get the respon-
sibility to gather and maintain an inventory of various sampling programmes
providing data on protected species bycatch conducted by ICES countries. This in-
cludes regular DCF at sea programmes, other national sea sampling programmes (in-
cluding dedicated bycatch monitoring programmes) and directed studies that target
protected species bycatch. This should be reflected in the future ToRs of WGBYC. The
inventory can then be updated annually through a formal data call via ICES.
3 At-sea catch sampling programmes vs directed studies – comparison
of designs, advantages and limitations (ToR b)
This section provides a comparison of various aspects of different types of at-sea data
collection schemes, highlights common issues encountered in survey design, and de-
scribes relative strengths and limitations of each programme type. A short explanation
is provided below to clarify what is meant by each programme type. The information
provided here is based on data submitted by participants to the sampling inventory
spreadsheet and through group discussion at the workshop.
Definitions:
1. Catch sampling programmes – wide spatial scale, long term programme (such
as DCF) with sampling design (e.g. fishery selection) and on-deck sampling
protocols optimized for quantifying commercial fish catches.
2. Dedicated bycatch monitoring programmes – wide spatial scale, long term
programme (such as UK bycatch programme) with sampling design and on-
deck sampling protocols optimized for quantifying protected species bycatch.
3. Directed bycatch studies – small spatial scale, short term research type studies
designed to understand and possibly mitigate protected species bycatch in spe-
cific métiers/fisheries.
Catch sampling and dedicated bycatch monitoring programmes can encounter issues
with vessel selection due to various constraints (unwilling skippers or owners, no legal
obligation to carry observers, insufficient space for observers, vessels considered po-
tentially unsafe etc.). These constraints mean it is frequently difficult to achieve true
randomness within sampling plans which may have implications for the representa-
tiveness of the data due to introduced biases. The importance of such biases is by na-
ture hard to determine, but could lead to significant estimation error, and may have
consequences for data quality assurance and management advice. A considerable
amount of work (ICES WGCATCH, WKPICS 1-3, SGPIDS) has been done over the last
10 years to improve the design and reduce bias in catch sampling programmes. The
ambition is to move away from ad-hoc selection of vessels to be sampled, which was
the prevailing situation in most countries before the onset of this work and to follow a
hierarchical structure in the way vessels are chosen and trips sampled (e.g. vessel-trip-
haul-sample-specimen). This work also includes guidance on how, for example, refus-
als to take observers on-board should be documented. WKPIC2 developed a best prac-
tice for the design of catch sampling programmes which is included in Annex 3. It is
however unknown to what extent individual countries have implemented this work.WKPETSAMP Report 2018 | 5 Directed studies do not tend to be affected by bias to the same degree because they are more focused spatio-temporally and the data are not typically used for extrapolation beyond the immediate area of interest. If such data were used to extrapolate to a wider level this will introduce potentially significant levels of bias. Despite these issues, the absence of true randomness in large scale monitoring pro- grammes should not be viewed as an excuse to disregard data or undermine data col- lection efforts because analytical techniques can be developed and results viewed in the appropriate context which can help compensate for uncertainties arising from a sub-optimal sampling design. Catch sampling programmes and dedicated bycatch monitoring studies tend, due to budgetary constraints, to have relatively low sampling effort in relation to the effort within the monitored fishery (see column “sampling intensity” in the inventory of sam- pling programmes/studies, Annex 5). This has direct implications on the precision that can be expected in the results from sampling programmes. Assuming that a sampling programme has a sufficient design, the level of precision around any calculated estimates (e.g. a bycatch rate) expected by end users is highly dependent on funding levels. Funding levels also have direct implications on the reso- lution at which estimates can be generated, for example, if the spatial sampling strata is the North Sea but funding is only sufficient for the collection of 10 samples, then end users should not expect results to be presented at the scale of statistical rectangle. End users should be aware that increasing precision or higher spatial resolution generally requires increased funding. Simulation studies (e.g. Northridge 2016) on how sampling levels and precision interact are a useful way of conceptualizing this issue. WKPETSAMP discussed the strengths and limitations of catch sampling programmes, dedicated bycatch monitoring programmes and directed studies based on programmes put in the inventory by the participants. Notable is that the UK is the only of the par- ticipating countries that operates a dedicated bycatch monitoring programme along- side a DCF catch sampling programme. The conclusions from the discussions are sum- marized in Table 1.
6 |                                                                         WKPETSAMP Report 2018

Table 1. Strengths and limitations of catch sampling programmes, dedicated bycatch monitoring
programmes and directed studies in the collection of bycatch data.

                 Strengths                                       Limitations
 Catch sam-      •   Already being conducted in all coastal      •   Sampling design may omit or under-
 pling pro-          EU member states.                               sample gears of high importance to
 grammes         •   Large spatial and temporal scale.               some protected species bycatch.
                 •   Well-funded through established             •   Sampling protocols optimized for fish
                     mechanisms.                                     species are suboptimal for quantifying
                 •   Generally target fisheries with high            some protected species bycatch (e.g.
                     catches and mixed catch compositions            mammals in net fisheries, birds in
                     so may already be suitably designed             longlines)
                     for assessing bycatch of protected fish     •   Sampling intensity sometimes low, un-
                     and elasmobranch species.                       likely to observe rare event bycatches.
                                                                 •   Non-commercial bycatches may be
                                                                     overlooked in existing sub-sampling
                                                                     procedures.
                                                                 •   Observers not always trained in alter-
                                                                     native sampling methodologies and
                                                                     species identification for protected
                                                                     species.
                                                                 •   Sometimes difficult for observer to
                                                                     monitor bycatch in surveys with multi-
                                                                     ple objectives (i.e. the observer might
                                                                     be occupied with other duties when
                                                                     gear is being hauled)
                                                                 •   Data recording practices and database
                                                                     storage facilities may not be able to
                                                                     deal with incidences of protected spe-
                                                                     cies bycatch.
 Dedicated       •   Large spatial and temporal scale.           •   Sampling design may not be opti-
 bycatch         •   Generally target gear types with                mized for quantifying bycatch of some
 monitoring          higher perceived risk of protected spe-         protected species (e.g. fish and elasmo-
 programmes          cies bycatch (e.g. static nets/ midwater        branchs in demersal trawls).
                     trawls for mammals, longlines for sea-      •   Sampling protocols normally do not
                     birds).                                         provide detailed information on com-
                 •   Observers are trained in sampling               mercial fish catch. Normally an esti-
                     techniques and species identification           mate of retained and discarded catch is
                     of protected species.                           recorded but no fish measuring takes
                                                                     place.
 Directed by-    •   Small spatial and temporal scale –          •   Small spatial and temporal scale – re-
 catch studies       strength if this is the scale of interest       sults should not be extrapolated to a
                 •   Generally target gear types / fisheries         wider scale
                     with known risk of protected species        •   Usually limited studies/projects diffi-
                     bycatch.                                        cult to follow development over time
                 •   Observers are trained in sampling           •   Sampling design may not be opti-
                     techniques and species identification           mized for quantifying bycatch of some
                     of protected species                            protected species (e.g. fish and elasmo-
                                                                     branchs in demersal trawls).
                                                                 •   Sampling protocols normally do not
                                                                     provide detailed information on com-
                                                                     mercial fish catch. Normally an esti-
                                                                     mate of retained and discarded catch is
                                                                     recorded but no fish measuring takes
                                                                     place.
WKPETSAMP Report 2018 | 7
The situation in the UK provides a unique opportunity to compare results (i.e. mammal
bycatch rates) from different data collection programme types because both dedicated
bycatch monitoring and DCF fish catch monitoring programmes are conducted, and
some of the same fisheries are monitored by both programmes but under different
sampling protocols. A comparison was undertaken (Annex 4) which showed that the
estimated bycatch rate for marine mammals differed by more than a degree of magni-
tude between the two programmes based on data from the same gear types (gillnets
and tangle/trammel nets), areas and over the same time period. The data were stratified
in an equivalent way for each dataset, and the UK draws the conclusion from the anal-
ysis that the observed differences in bycatch rates are likely largely driven by differ-
ences in on-board sampling protocols between the programmes. Large animals such as
marine mammals often fall or are removed from the nets outside the vessel and if these
occurrences are not checked for or recorded if seen within catch sampling programmes
then significant differences in calculated bycatch rates can occur.
This comparison conducted by the UK shows that it might be naive to assume that it is
possible to get reliable bycatch data, at least for marine mammals, from catch sampling
programmes without proper adjustments to sampling protocols. A key question is if it
is possible to alter the designs of the present at-sea sampling programmes to satisfy
multiple objectives. This might imply revised sampling protocols and reallocation of
sampling effort. Ideas such as keeping the “normal” fish sampling protocols for some
hauls while the sampling of other hauls are dedicated to monitoring for bycatch of
mammals and birds need to be investigated, and should be considered on a fishery by
fishery basis. It is however important to acknowledge that sampling effort in the at-sea
catch sampling programmes are already generally quite low. The amount of sampling
effort needed to meet the different objectives for such a fully functional multi-purpose
at-sea sampling programme need to be examined closely but could be calculated from
existing data.
The development of multi-purpose at-sea sampling schemes requires expertise in sta-
tistics, sampling design, fisheries exploitation patterns and patterns of bycatch. This
expertise might not always be present in all countries. Joint efforts are most likely
needed. This could be done in cooperation between ICES WGBYC, ICES WGCATCH
and the Regional Coordination Groups for Data Collection. In this context is it also
important to realize that data are used at an international level. It is thereby important
that at sea-sampling schemes are evaluated against agreed best practices for sampling
design and sampling protocols.
4 Alternative methods to obtain data on bycatches (ToR b)
On-board observers are a relatively costly way to obtain data from fisheries which may
still result in limited sampling effort (see inventory on sampling programmes). Observ-
ers also require space on-board the vessel (for work tasks or sleeping) which may be
challenging on small vessels or on larger vessels that carry a full crew complement.
In some regions there is little existing reliable data available on the actual impact of
fisheries on protected species populations, particularly related to the bycatch of sea-
birds and marine mammals in passive gears. This is mainly due to the very high num-
bers of vessels in these fisheries and the comparatively rare but very variable bycatch
events, and low sampling levels which make a statistically reliable extrapolation diffi-
cult. Vessels using passive gears also tend to be relatively small. In Germany, for ex-
ample, set net fisheries in the Baltic are mainly carried out by vessels below 12 m8 | WKPETSAMP Report 2018 length, thus without obligation to carry a Vessel Monitoring System (VMS), and a large number of vessels are smaller than 8 m length and therefore do not need to fill in log- books (Oesterwind and Zimmermann, 2013) so accurate estimates of fishing effort are difficult to obtain. For vessels above 8 m that do fill in logbooks in the Baltic (and over 10m elsewhere) some important fields are not mandatory (e.g. length of nets, number of hooks for longlines, soaking times etc.), so it is not possible to calculate valid esti- mates of the true total fishing effort in these passive fleet segments. Implementing a representative sampling scheme with on-board observers is not practical or cost effec- tive due to the high number of vessels and limited space on board to carry extra per- sonnel. To increase knowledge of bycatch in these types of fisheries other data collection meth- ods can be utilized. Such methods are briefly discussed below. Remote Electronic monitoring (REM) Different methods of remote electronic monitoring, including Closed Circuit Televi- sion (CCTV), might be a cost-effective way to increase sampling effort. CCTV have been tested in different countries including Germany where the Thünen Institute of Baltic Sea Fisheries tested an REM system on three small vessels around the island of Rügen from March 2011 to December 2012 (Oesterwind and Zimmermann, 2013). Re- sults show that REM is a practical method to document bycatch of seabirds and marine mammals reliably and much more extensively than would be possible with occasional monitoring by on-board observers. The amount of data collected is important for sub- sequent extrapolation: most protected species bycatch events are so rare that they can only be extrapolated in a statistically sound manner if the sampling is as extensive as possible. Only by this requirements like those set by the Multi Annual EU Program (DC-MAP) and Marine Strategy Framework Directive (MSFD), can be fulfilled. Implementation of sampling schemes based on remote electronic monitoring does however require that such methods are generally accepted on a political level and by the industry. Self-sampling Self-sampling by industry through different apps or reporting logs might be consid- ered. There is an obvious risk of bias as bycatches are usually considered as something negative by the industry so there is a risk of significant underreporting. Self-sampling schemes thereby need to be validated with REM and/or by observers. The generation of bycatch estimates also requires some knowledge of the level of fishing effort. There- fore self-sampling of fishing effort, because the quality of effort estimates from small scale fisheries using passive gears is poor in many cases, might be a promising way forward. Questionnaire/ Interviews Fishermen tend to have useful knowledge about when and where bycatches generally occur, particularly in their direct area of operation, and thus collectively can possess a significant amount of information over a much larger spatial scale. Questionnaires and interviews might be considered as a way to access and ultimately utilize this knowledge. The information might be difficult to use in quantitative assessments but could be incorporated as part of a screening procedure to highlight possible areas of particular interest when designing programmes or for validating outcomes from sam- pling programmes.
WKPETSAMP Report 2018                                                                    | 9

    It is important that the international scientific community learn from experiences
    gained in individual countries on alternative ways to collect bycatch data. WGBYC has
    an important role to review results of alternative data collection efforts from different
    countries and disseminate the information and knowledge acquired.

5   Precision and accuracy needed by end users. What do we know?
    (ToR b)

    End users and their use of bycatch data is described in FishPi (2015) Table 2. In general
    the end user needs are not clearly defined by the end users themselves. However an
    overall need to understand the level of bycatch mortality for different protected species
    has been expressed by many end users. One of the ToRs of WGBYC (an end user) in-
    cludes evaluating the range of impacts of bycatch on protected species and the provi-
    sion of associated precision levels (min/max).
    The Baltic Marine Environment Protection Commission (HELCOM), also identified as
    an end user, has developed a number of fish and fishery related indicators including
    the HELCOM core indicator ”Number of drowned mammals and water birds in fish-
    ing gear”. To properly estimate that indicator there will be a need to monitor the by-
    catch of the mentioned taxa. In HELCOM (2018), it is expressed that it is necessary to
    develop monitoring programs in a way that the coefficient of variation is low because
    uncertainties of all estimated parameters, i.e. of abundance, bycatch rate and fishing
    effort add up to a considerable overall uncertainty which would make a thorough as-
    sessment difficult. The level of precision is not set, however the coefficient of variation
    (0.3) required by EU Regulation 812/2004 (European Commission 2004) is thought to
    be not possible to achieve in many cases.
    Furthermore, in Article 12 (4) of the Habitats Directive it is laid down that “Member
    States shall establish a system to monitor the incidental capture and killing of the ani-
    mal species listed in Annex IV (a).
    Species to be monitored under protection programmes in the European Union or under
    international obligations are listed in the EU MAP Regulation (EU 2016/1251). How-
    ever, it is the end users’ responsibility to prioritise the protected species for which there
    is an immediate need for bycatch estimates and associated precision. The Regional Co-
    ordination Groups will be the bodies responsible for defining regional sampling objec-
    tives. To this end, the needs of the various end users and the feasibility of collecting the
    necessary information and any potential impacts on data collection programmes will
    need to be taken into account.
10 | WKPETSAMP Report 2018
Table 2. From FishPi WP3. Relevant end users.
End User End user subgroups Use of by catch data
ICES WGBYC (Working Group on Bycatch of Pro- Collates and assesses information on by-
tected Species) catch monitoring and assessment for pro-
tected species, including mammals, birds,
turtles, and rare fish.
WGMME (Working Group on Marine Mam- Provides scientific advice in relation to
mal Ecology) marine mammals. examines any new in-
formation on population sizes, popula-
tion/stock structure and management
frameworks for marine mammals and as-
sess how these can contribute to the regu-
latory requirements
JWGBIRD (Joint OSPAR/HELCOM/ICES Requests for advice from OSPAR that, re-
Working Group on Seabirds) cently have featured the development of
Ecology Quality Objectives (EcoQOs) and
the development of common bird indica-
tors under the EU’s Marine Strategy
Framework Directive
ICES expert assessment WG
WGFTFB (Working Group on Fishing Tech- Studies measurements and observations
nology and Fish Behaviour) relating to scientific and commercial fish-
ing gears, design and statistical methods
and operations, and fish behaviour in re-
lation to fishing.
ICES expert groups and steering groups deal-
ing with integrated ecosystem assessment
WGCATCH (Working Group on Commercial Documents national fishery sampling
Catches) schemes, establishes best practice and
guidelines on sampling and estimation
procedures, and provides advice on other
uses of fishery data.
WGRFS (Working Group on Recreational Planning and coordination of marine rec-
Fisheries Surveys) reational fishery data collection for stock
assessment purposes.
Other RMFO Expert assessment and ecosystem WG
(ICCAT, NAFO,
NEAFC…)
European DGMARE & DG Environment Implementation of MSFD; achievement of
Commission GES with good management of recrea-
tional as well as commercial fishery im-
pacts. Implementation of CE 812/2004,
Birds Directive, Habitats Directive
STECF Inclusion of data collection in the EU
MAPWKPETSAMP Report 2018 | 11
International FAO, OSPAR, ASCOBANS, ACAP, IWC, Identifying threats, recommending action
Organizations HELCOM plans, implementation of different agree-
ments.
For MSFD purposes The regional Sea con-
ventions are one of the absolutely most
important end user since they’re the ones
working with the indicators/indicator tar-
gets for D1 which are later implemented
at national level.
Regional RCGs for each region Coordination and cost-effectiveness of by
Coordination catch data collection within regions (if in-
Groups cluded in EU-MAP)
National Gov- Developing policy positions on manage-
ernments and re- ment that reflects the ecosystem aspects of
gional fisheries sustainable development in coastal re-
authorities gions and spatial planning such as MCZs.
within countries Meeting international agreed responsibili-
ties
Scientific Universities; Govt. departments; other Insti- Scientists interested on by catch and eco-
community in tutes system dynamics
general.
Data for publication
Representative Commercial fishermen’s organisations and Policy developments in relation to inter-
bodies for Inter- federations. action between commercial species and
national and na- main predators;
tional commer-
cial fisheries.
Recreational Recreational fishermen’s organisations and Developing best practices
fisheries bodies federations (EAA, Angling Trust…)
Advisory Coun- e.g. North Western Waters AC; North Sea Policy developments in relation to inter-
cils AC….. action between commercial species and
main predators;
Marine NGOs Birdlife international, WWF, GREENPEACE, Policy developments in relation to inter-
OCEANA etc. action between commercial species and
main predators;
6 Criteria to evaluate if at-sea sampling programmes meet end user
needs (ToR b)
To set up criteria for evaluating if at-sea sampling programmes meet end user needs, a
bycatch risk assessment for species in different areas and métiers needs to be carried
out. The bycatch risk assessment should be correlated with the sampling coverage of
monitored effort under the EU MAP or other studies monitoring bycatch. The method
is described in the FishPi report Work Package 3 (WP3) and by WGBYC.
The first objective should be to identify those protected species with high bycatch rates
by fishery/métier. Then, assess the sampling coverage of these fisheries under the EU-
MAP at-sea sampling National programmes.
The approach of combining species abundance, bycatch rates, fishing effort and current
monitoring levels by fishing grounds is a useful tool to identify the overall bycatch risk,
highlight sampling needs and identify gaps or shortfalls in monitoring levels as a first12 | WKPETSAMP Report 2018
step. It would also identify which MS fisheries have the highest effort in different fish-
ing grounds / métiers. This information is needed when allocating appropriate sam-
pling levels between MS involved in these fisheries. In ICES WGBYC (2013) a method-
ology to estimate the bycatch risk of different groups of species, based on the métier,
fishing effort and abundance in each different fishing region was developed. FishPi
(2015) then combined this risk approach with the DCF sampling effort, to provide an
index of which areas and fishing gears are most in need of additional sampling. High
bycatch risk métiers and fishing grounds were identified in the North Sea and North
Atlantic regions, considering different protected species or taxa.
The methodology followed can be found in the FishPi report under WP3 (Mugerza et
al., 2017) deliverable 3.1 section, and is summarized below in Figure 1.
Table 1 Table 2
Risk of species group vs metier Abundance of species in fishing grounds
(expert opinion) multiplication (expert opinion)
code 1: low risk code 1: present
2: some risk 0: absent
3: high risk
Table 3.1 - 3.13
Potential risk by species and metiers,
in each fishing ground
table 4 table 5
Effort by metier and fishing ground Effort by metier vs fishing ground
(days at sea) standarization (standarized) multiplication
(2011 DCF National Programs Report) code: 00
1 1-100
2 101-1,000
3 1,001-10,000
4 10,001-100,000
5 100,001-1000,000
Table 6.1-6.13
Risk index for each species and metier, in each fishing ground
Table 7 Table 8
Risk index for each metier and fishing ground sum sum Risk index for each species and fishing ground
(summed across all species) (summed across all metiers)
Figure 1. Risk based assessment methodology used in FishPi.
In order to check the relative distribution of monitoring effort under the EU-MAP
against the risk by métier, the risk index by métier for different regions was combined
with the planned effort in the EU MAP National programmes. This index provides an
initial blueprint for determining which métiers in which regions require relatively
more monitoring in order to improve estimates or understanding of bycatch across all
protected species groups. An example of this index is shown in Table 3.WKPETSAMP Report 2018 | 13
Table 3. Table from FishPi WP3. Relative DCF sampling effort subtracted from relative summed
risk factors for each métier at different areas. Positive numbers (in green), indicate relative under
sampling; negative numbers (in red) indicate relative over sampling. The header is the different
areas included in the analysis.
AZ BB CS EA FI IB IS MA NS SK WC WI WS
Boat dredge [DRB] 0 3 0 0 0 5 1 0 2 3 2 3 6
Bottom otter trawl [OTB] 0 -28 -36 -24 -50 -47 -32 -12 -39 -63 -29 -21 -57
Multi-rig otter trawl [OTT] 0 6 9 0 14 2 3 0 4 6 4 7 8
Bottom pair trawl [PTB] 0 -2 2 -4 14 -5 0 0 4 4 2 2 6
Beam trawl [TBB] 0 3 -10 0 0 4 8 0 -13 3 -16 2 3
Midwater otter trawl [OTM] 0 -4 6 -14 18 2 2 6 -1 6 4 -40 2
Pelagic pair trawl [PTM] 0 3 2 6 0 4 6 14 6 6 5 2 3
Hand and Pole lines [LHP] [LHM] -29 3 5 0 0 5 2 0 3 5 4 3 2
Trolling lines [LTL] 0 4 0 0 0 0 0 0 0 0 3 0 0
Drifting longlines [LLD] 0 4 3 0 0 6 0 0 0 0 2 6 0
Set longlines [LLS] -23 -2 8 7 0 5 4 0 5 5 7 11 10
Pots and Traps [FPO] 0 5 3 0 0 6 -25 19 6 2 6 3 -7
Fykenets [FYK] 0 5 0 0 0 0 0 0 2 3 0 0 0
Stationary uncovered poundnets [FPN] 0 0 0 0 0 0 0 0 0 0 0 0 0
Trammelnet [GTR] 0 -21 9 0 0 11 5 0 6 10 -5 8 5
Set gillnet [GNS] 35 10 -12 20 4 4 14 -27 -2 0 -5 7 13
Driftnet [GND] 0 9 4 0 0 0 0 0 9 4 7 0 0
Purse-seine [PS] 17 4 2 10 0 -3 3 0 3 2 3 2 2
Lampara nets [LA] 0 0 0 0 0 0 0 0 0 0 0 0 0
Fly shooting seine [SSC] 0 0 3 0 0 0 5 0 0 2 3 3 5
Anchored seine [SDN] 0 -3 0 0 0 0 3 0 3 0 2 0 0
Pair seine [SPR] NA NA NA NA NA NA NA NA NA NA NA NA NA
Beach and boat seine [SB] [SV] 0 0 2 0 0 0 0 0 0 4 2 0 0
Glass eel fishing NA NA NA NA NA NA NA NA NA NA NA NA NA
WKPETSAMP recommend that WGBYC review this method and create tables for
the areas which has not been done in the FishPi project (the Baltic, the Mediterra-
nean and Black sea). The results from the tables created in FishPi WP3 showed many
areas and many métiers where there is a need to increase the monitoring of bycatch of
protected species. Therefore there is a need for endusers to prioritize areas, métiers
and species in need of monitoring. This task could be included in the ToR for
WGBYC with help from other relevant ICES working groups such as WGBIRD, the
Working Group on Marine Mammal Ecology (WGMME) and the Working Group
on Elasmobranch Fishes (WGEF) etc.
The method for how to prioritize between the species, métier and areas to be monitored
should be agreed by WGBYC. An example of a methodology used on other species and
in other areas is the Ecological Risk Assessment. An alternative method which can be
used to determine which fisheries require most monitoring in order to most effectively
minimise the uncertainty around the overall bycatch estimate is being developed by14 | WKPETSAMP Report 2018
the UK and is briefly described below. There may also be a need to use methods other
than at-sea sampling programmes due to the high associated costs if high monitoring
coverage is needed to meet end user defined precision requirements. It is recom-
mended that WGBYC review alternative methods that might be used as an alternative
to at-sea sampling by observers.
Development of a rational for monitoring protected species bycatch
Work has recently been carried out in the UK (Northridge, 2016) to develop a formal
rationale for allocating sampling effort between métiers to reduce uncertainty in pro-
tected species bycatch estimation. Here we briefly describe the conceptual approach.
When bycatch of protected species is being considered, the risk assessment framework
can be visualised as three elements as shown in Figure 2 below.
1. Resilience is usually taken to be a function of animal population abundance
and the ability of the population to grow or recover.
2. Susceptibility is most usefully expressed in terms of a metier specific bycatch
rate, but can be provided by expert solicitation and categorised in simple terms
(e.g. Low-High).
3. Scale is generally considered to be known accurately through official fishing
effort statistics and is usually expressed without uncertainty, though signifi-
cant uncertainty can exist.
A species with low resilience and high susceptibility to bycatch in a large fishery is at
risk of significant conservation impact, and conversely a species with high resilience
and low levels of interaction in a small fishery is less at risk.
Figure 2. Three elements of the risk assessment framework.
An example is given in Table 4 to illustrate how sampling effort can be allocated be-
tween métiers. It is assumed that Species X has a maximum bycatch reference limit
(resilience) of 1000 individuals. This limit is divided among four fisheries, pro-rated by
effort in each fishery.WKPETSAMP Report 2018 | 15
Table 4. Example of how sampling effort can be allocated between métiers. It is assumed that Spe-
cies X has a maximum bycatch reference limit (resilience) of 1000 individuals. This limit is divided
among four fisheries, pro-rated by effort in each fishery.
Fishery Days Days No of Upper Confidence Allocated Difference between
métier at Sea observed animals Limit on bycatch bycatch allocated limit and
observed estimate reference limit current estimate
A 3800 50 1 103 95 -8
B 31000 3000 15 248 775 527
C 200 30 0 23 5 -18
D 5000 10 0 1540 125 -1415
Summed 40000 3090 16 1914 1000 -914
In this example current sampling levels suggest the total bycatch of Species X (UCL)
may exceed the reference limit overall by 914 animals, but most of this uncertainty
comes from Fishery D, where only ten observation days have been carried out with no
observed bycatch. The bycatch estimate for Fishery D lies between 0 and 1540 animals
per year (high uncertainty), assuming bycatch events are binomially distributed. If an
additional 20 days observations were made in fishery D (assuming no bycatches were
observed) the upper confidence limit on the bycatch estimate falls to below 580 and to
less than 1000 overall, below the allocated reference limit. An additional 20 days in
fishery B would barely alter the UCL for that fishery and so would change the overall
picture. Clearly allocating monitoring effort to fishery D is a more efficient way of im-
proving precision around the overall bycatch estimate.
This approach helps determine which fisheries require most monitoring in order to
most effectively minimise uncertainty. A more complex analysis is required where 2 or
more species are considered with different bycatch reference limits and varying sus-
ceptibilities among the fisheries.
The importance of setting reference limits as yardsticks against which to compare cur-
rent best estimates of the likely maximum bycatch should be clear. Such reference lev-
els could be aligned with conservation targets (such as the 1.7% limit on small cetacean
bycatch adopted by the Agreement on the Conservation of Small Cetaceans of the Bal-
tic, North East Atlantic, Irish and North Seas (ASCOBANS), but it is equally possible
to use reference limits unrelated to estimates of sustainability. The way in which the
reference limit is allocated between métiers is also important and can be based on fish-
ing effort or other metrics such as landed catch weight or value of landings depending
on what is most appropriate.
In times of restricted budgets it is important that attempts to implement ecosystem
based fisheries management are directed in a rational way to meet different objectives.
Already, within the UK, data from sampling schemes that were established to monitor
commercial species discards are being used to address bycatch of protected species,
while the sampling programme established to monitor cetacean bycatch has evolved
and now covers all protected species. Within such data collection programmes, re-
sources should be allocated in a way that best addresses management needs and re-
duces uncertainties. The approach briefly outlined here aims to provide a rationale for
parsimonious sampling that will address the key uncertainty in bycatch risk assess-
ment, that of susceptibility by métier.16 | WKPETSAMP Report 2018
7 Mechanisms for storage, maintenance and dissemination of data origi-
nating from at-sea catch sampling programmes and directed studies
(ToR c)
The term incidental bycatch indicates that the catch components that are being de-
scribed are relatively rare. In practice this means that quantifying this part of the catch
is not currently part of the routine work of a DCF fisheries observer. Properly quanti-
fying incidental bycatch requires specifically trained observers and sampling protocols
which should be readily available for at-sea observer programs.
Building routine
Although in many fisheries, an observer may not have to deal with occurrences of in-
cidental bycatch very often, it is possible to build routine elements into the sampling
protocol to ensure that if a bycatch occurs it will be noticed and recorded. For example
this can be achieved by (1) instructing the observer to indicate on a haul-by-haul basis
what part/s and portion of the fishing operation and catch sorting process has been
checked for incidental bycatch items and (2) by treating any rare or unusual catch item
as an incidental bycatch to avoid subjectivity in species selection. These aspects are
described in more detail below.
1. Indicate what part of the catch has been observed “on haul level”: It is important to
collect this information so that in subsequent analyses true zero bycatch records can be
distinguished from “zeros” arising from “no observer effort”. This aspect of data col-
lection should be included clearly in the sampling protocol and should be a high pri-
ority part of the forms that are filled out by the observer for each haul. The exact infor-
mation that needs to be collected depends on the fishery / gear type and may contain
information that is very specific for the local situation. For example some fisheries use
specific alterations (e.g. shark catchers) in the trawl to avoid megafauna entering the
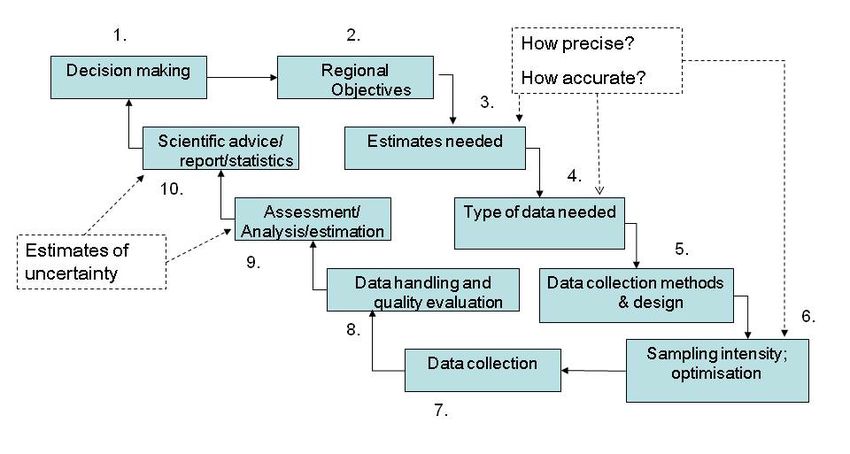
fish pump, which can make it hard to detect bycatch. Figure 3 below shows a section
of the Dutch DCF programme data collection form that has been adapted to ensure this
type of information is routinely recorded.
Incidental bycatches (fill in always!)
(cetaceans, seals, birds, turtles, rare fish species)
...................................................................................................................................................... Sa
......................................................................................................................................................
General:
present at opening of codend or deconnecting pump? yes / no
Demersal - and pelagic fishery: ..
How much of the sorting proces has been observed? ........%
..
Pelagic fishery:
Was a "shark-catcher" being used? yes / no ..
Has the "shark-catcher"been checked for bycatch? yes / no / NA
..
Gill nets:
How much of the hauling has been observed? .......%
Figure 3. Part of the field form used in Dutch at-sea catch sampling programs. Observers are ex-
pected to fill in this section for incidental bycatch for every haul.WKPETSAMP Report 2018 | 17 Generally in DCF at-sea fisheries observer programmes there are three indicators that could be used to improve descriptions of the sampling effort on haul level: (1) the per- centage of time the observer checked the sorting process for rare catch items, (2) the percentage of the actual hauling process that was properly checked for rare catch items, particularly relevant in line and net fisheries, where catches can fall or be removed from the net outside the vessel, (3) Was the observer suitably positioned to be able to see any bycatch of megafauna (e.g. in trawl gears was megafauna bycatch checked for at the opening of the cod-end). Within dedicated bycatch monitoring programmes or bycatch directed studies recording these aspects are less important because given the focus of the data collection one could assume that the observer dedicated close to 100% of their time in a way appropriate to quantifying bycatch. These indicators can be used to flag the quality of the observer process or to directly apply a subsample factor to any rare catch item. For example: if an observer recorded a bycaught turtle falling out of the net during hauling of a gillnet while he/she properly observed 50% of the hauling process, the bycatch would be recorded with a haul sub- sample factor of 2. 2. Treat each rare catch item as incidental bycatch: Because protected species bycatch events tend to be relatively rare it is important that observers are alert to the possibility of it occurring because missed events dramatically alter calculated bycatch rates. A way of shifting focus towards rare events is to consider any unusual catch in the same way, whether it is a protected species or not. For example, a single shad (or any other species) in a catch of 1 tonne of herrings, if noticed during the sorting process, can be recorded with a subsample factor of 1 (or 2 if only 50% of the sorting process was fully observed). The bulk herring catch is sampled in the normal way by taking a subsample of the catch for measurements etc. There is no need for the observer to check through the entire sorting process for a single specimen, but IF a shad (or other species) is ob- served within the bulk herring catch it is important to record it separately to the sub- sample details. Applying this routine should not add much extra work for observers in areas/fisheries with few species such as many midwater trawls fisheries. In very mixed fisheries this approach may be more problematic, and would require well- trained observers to ensure less common species are identified. Making it a routine to record all “rare” specimens in the catch has also the advantage that the observer does not need to cross check extensive lists of protected species that need to be recorded. Identification The identification of rare species in the catch can often present problems because it is unlikely that any single observer is a fish, elasmobranch, bird, reptile and mammal specialist. Therefore, appropriate guides which also contain species that are uncom- mon in the area, should be made readily available. The protocol should contain clear instructions on what to do if a catch item cannot be identified to species (or taxa). This may include taking pictures for later identification or instructions to bring the speci- men(s) to the lab (assuming any transport licenses are valid for protected species). The protocol should contain clear instructions on how to make sure that a specimen which was not fully identified and recorded on board, can be entered later in the national institutes database to ensure the record does not disappear. For unidentified bycatch that could not be photographed or sampled for later identifi- cation, there should be an option to record by some taxonomic level (genus, family, order). Any species checklists carried on board should therefore always be hierarchical.
18 |                                                                  WKPETSAMP Report 2018

Species selection and other methods: EM, questionnaires, self-sampling, market sampling

Although the new DCF requires the sampling of all the species mentioned in Table D1
of EU Decision 1251/2016. In specific programs, trips or hauls, not all the species are
sampled and this should be clearly described in the sampling design and protocol text.
Limited/restricted species selection methodologies are used in some commercial spe-
cies sampling programmes but are also likely in alternative methodologies like Elec-
tronic Monitoring, questionnaires, fisher self-sampling etc. For example self-sampling
of rare fish species by crews which collect specimens and bring them ashore for iden-
tification, will probably not contain marine reptiles, birds or marine mammals so this
should be clearly stated in any protocols so that these types of data can be placed in an
appropriate context.

Database

In relation to the provision of data to end users the at-sea recording of incidental by-
catch becomes essentially pointless if the data are not entered into national databases
and then subsequently submitted to the Regional Database and Estimation System
(RDBES or RDB). Therefore national databases need to be designed appropriately to be
able to hold the relevant information, including the option to enter information for all
species from Table D1 in EU Decision 1251/2016, which provides a reference list of pro-
tected or vulnerable species.
Most institutes use a front end application to enter data so it is extremely important
that such applications are modified accordingly, as many such applications use refer-
ence lists for selecting what species codes can be entered or not. For example if a refer-
ence list only contained fish species, data on other vertebrates (mammals, birds etc)
will not be accepted by the database and such records may then for all intents and
purposes become lost.
Data should be stored in such a way that permits export in a format compatible with
the RDB. Data managers in national institute should be made aware of and follow the
development of the RDBES steering group.
The latest version of the RDBES and associated documentation were presented during
WKPETSAMP by Nuno Prista, a member of the group that supports ICES Data Centre
in the development of the RDB data model. The presentation focused on the sampling
hierarchies that most directly relate to at-sea sampling and in particular on the fields
most relevant to records of incidental bycatch. These fields are in found in tables Fish-
ing Operation (FO), Species Selection (SS) and Sample (SA) and can be traced back
to the variables identified in 2013 by SGPIDS 3 (ICES, 2013) which indicated in Table
5.1 of its report a set of core information that should be registered in national databases
and be used in reporting incidental bycatch. Specifically, these variables were Date,
Time, Geographical Position, Gear type level 6, and Mesh-size used at haul level, a
check-box for sampling at haul level, species and number of specimens caught, and the
presence/absence of pingers on the gear. All of these variables have been integrated
into the latest version of the RDB data model with the exception of the presence/ab-
sence of pingers. Following the presentation, the member of RDBES data group re-
quested WKPETSAMP to review the incorporation of these fields, checking if the pre-
sent data model fulfils the present needs with regards to recording of incidental by-
catch.
WKPETSAMP Report 2018                                                                  | 19

WKPETSAMP welcomed the presence in the RDBES data model of the variables pre-
viously suggested by SGPIDS 3 (ICES, 2013) and sees the move towards routinely pop-
ulation of these fields in future data calls as a step forward towards improving sam-
pling protocols and registration of incidental bycatch in national databases. WKPET-
SAMP spent significant time discussing the need for the RDBES data model to allow a
correct distinction of true zeros (no incidental bycatch) from missing values (situations
where on-board protocols either do not carry out observations on incidental bycatch
or do not ensure appropriate screening of the catch). Accurately distinguishing these
types of records is vital for accurate estimation of bycatch rates because assuming miss-
ing values represent true zeros may lead to significantly biased (low) estimates of inci-
dental bycatch.

In the RDBES data model, the distinction between these two situations when dealing
with landings or discards quantified during DCF sampling is mostly addressed by
means of species lists defined for each CatchFraction. The species lists are declared in
the SpeciesSelection and indicate for each CatchFraction the list of species (e.g., all
species, just fish species, fish and crustaceans) that are recorded during the sampling
procedure. The association of these species lists to each CatchFraction allows some ad-
ditional flexibility in the description of the sampling, e.g. for landings and discards it
is possible to have two distinct lists. Such lists also permit the idea of multi-purpose at-
sea sampling schemes in which some hauls might be primarily sampled for commercial
species while others are sampled specifically for bycatch of mammals, birds or other
protected species.

WKPETSAMP found the use of these lists promising with regard to the correct record-
ing of incidental bycatches. However, it was noted that a substantial amount of by-
catch, particularly megafauna, may be released or fall from the gear prior to the for-
mation of the two more common CatchFractions, e.g. during net hauling operations or
when trawl cod-ends are opened. Accordingly, WKPETSAMP recommends that the
creation of additional CatchFractions: one for “slipped” catch (i.e. catch and bycatch
that never came on board the vessel) and also pre-sorted catch (i.e. catch and bycatch
that was hauled on-board (e.g. in the cod-end of a trawl) but that is quickly thrown
overboard without entering what is typically considered the commercial catch sorting
process of the haul. The creation of these two additional CatchFractions would enable
not only the formation of different lists for different catch components but also the
possibility of, during estimation, accounting for potentially different gear specific mor-
tality rates (e.g., a dolphin that is released from a purse-seiner without ever being
hauled on board is likely to have a better survivability than one that is hauled and
released after a few minutes on deck). WKPETSAMP also welcomes the present exist-
ence in the FishingOperation table of two variables (FopercCoverageHauling,
FopercCoverageSorting) that aim to provide an approximate percentage of the hauling
operation and/or sorting operation effectively screened for bycatch. WKPETSAMP re-
quests that a more general indicator of the certainty of observation of incidental by-
catch in the haul/set is specified alongside an indicator of the quality of the observation
You can also read