Improving Victoria's Air Quality - March 2018 - Victorian Auditor-General's Office
←
→
Page content transcription
If your browser does not render page correctly, please read the page content below
Improving Victoria’s Air Quality
        Victorian Auditor -General’s Office
        —
        Level 31 / 35 Collins Street
        Melbourne Vic 3000

        T 03 8601 7000
        enquiries@audit.vic.gov.au
        www.audit.vic.gov.au
        —

                                                                                                                                                           Improving Victoria’s
                                                                                                                                                                   Air Quality
                                                                                 March 2018

                                                                                                                                                                                                      March 2018
                                                                                 2017–18:11

                                                                                                                    Independent assurance report to Parliament
                                                                                                                    2017–18:11

12539 VAGO 12539 VAGO Improving Victoria’s Air Quality_Cover.pdf | Page 1 of 1                                                                                    12539 VAGO 12539 VAGO Improving Victoria’s Air Quality_Cover.pdf | Page 1 of 1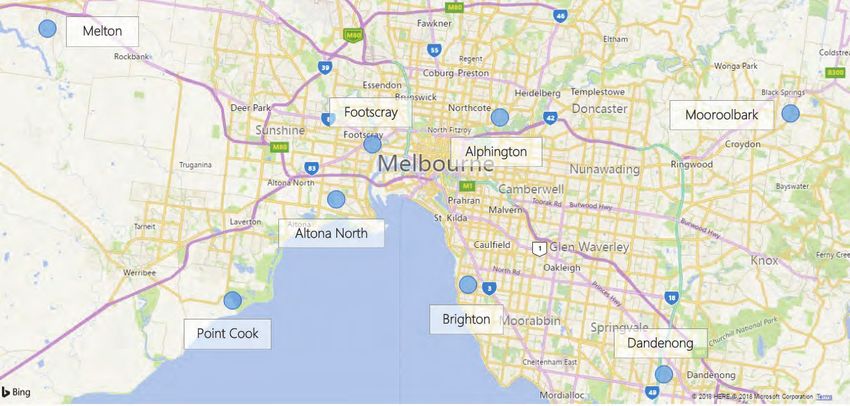

Improving
                          Victoria’s Air
                             Quality

Independent assurance report to Parliament
Ordered to be published
VICTORIAN GOVERNMENT PRINTER
March 2018
PP no 378, Session 2014–18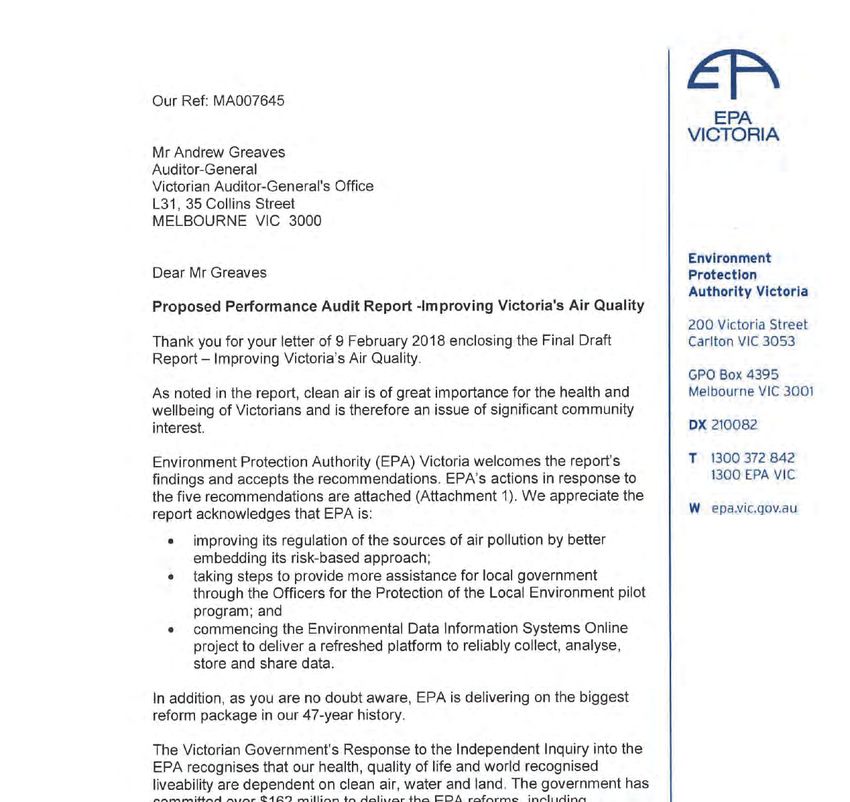
This report is printed on Monza Recycled paper. Monza Recycled is certified Carbon Neutral by The Carbon Reduction Institute
(CRI) in accordance with the global Greenhouse Gas Protocol and ISO 14040 framework. The Lifecycle Analysis for Monza
Recycled is cradle to grave including Scopes 1, 2 and 3. It has FSC Mix Certification combined with 55% recycled content.

ISBN 978 1 925678 10 9

The Hon Bruce Atkinson MLC                            The Hon Colin Brooks MP
President                                             Speaker
Legislative Council                                   Legislative Assembly
Parliament House                                      Parliament House
Melbourne                                             Melbourne

Dear Presiding Officers

Under the provisions of section 16AB of the Audit Act 1994, I transmit my report
Improving Victoria’s Air Quality.

Yours faithfully

Andrew Greaves
Auditor-General
8 March 2018

Contents
           Audit overview ............................................................................................................. 7
               Conclusion .........................................................................................................................................7
               Findings..............................................................................................................................................8
               Recommendations ...........................................................................................................................15
               Responses to recommendations .....................................................................................................16

           1 Audit context ......................................................................................................... 17
               1.1     Air quality ...............................................................................................................................18
               1.2     Health impacts of air pollutants ............................................................................................. 21
               1.3     Sources of poor air quality......................................................................................................22
               1.4     Policy and legislative framework ............................................................................................ 23
               1.5     Why this audit is important ....................................................................................................25
               1.6     What this audit examined and how .......................................................................................26
               1.7     Report structure .....................................................................................................................26

           2 Monitoring air quality............................................................................................ 27
               2.1     Conclusion ..............................................................................................................................28
               2.2     EPA’s monitoring network ......................................................................................................28
               2.3     Campaign and emergency monitoring ...................................................................................32
               2.4     Recommendation 6.3 of the 2016 EPA inquiry report ...........................................................33

           3 Reporting on air quality ......................................................................................... 35
               3.1     Conclusion ..............................................................................................................................35
               3.2     Reported air quality ................................................................................................................36
               3.3     Data considered in annual air quality monitoring reports .....................................................43
               3.4     Raw data .................................................................................................................................44
               3.5     Siting compliance....................................................................................................................47
               3.6     ICT infrastructure underpinning monitoring ..........................................................................48

           4 Regulating air quality ............................................................................................. 49
               4.1     Conclusion ..............................................................................................................................49
               4.2     Roles and responsibilities .......................................................................................................50
               4.3     Identifying sources of air pollution ......................................................................................... 51
               4.4     Use of regulatory tools ...........................................................................................................53
               4.5     Case study: Brooklyn Industrial Precinct ................................................................................61

Victorian Auditor‐General’s Report                                                                              Improving Victoria's Air Quality                   5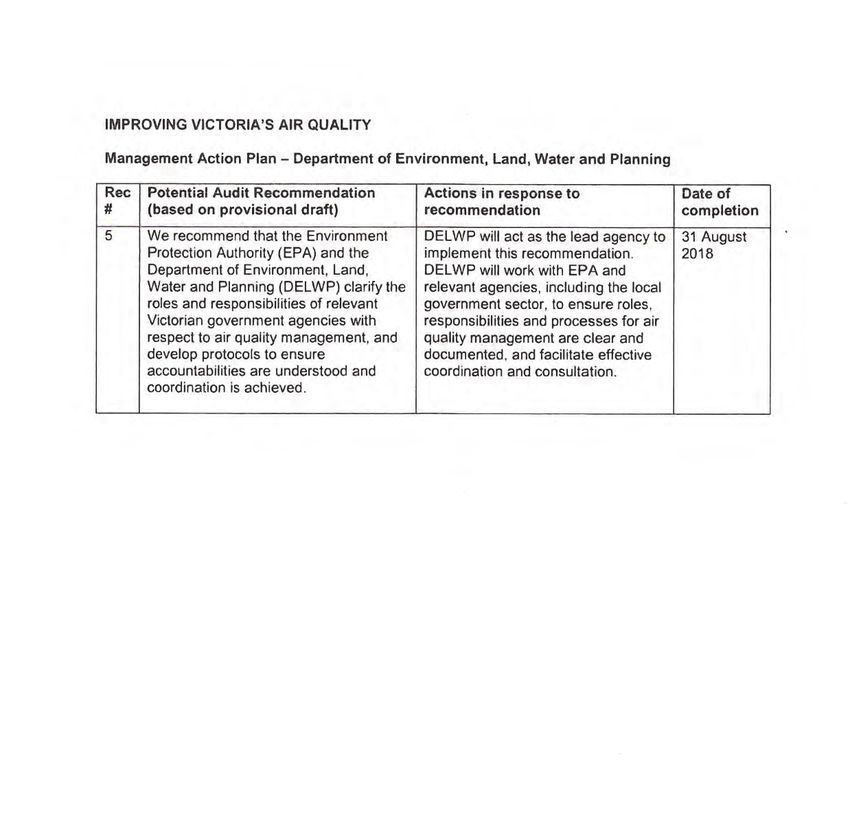
Appendix A. Audit Act 1994 section 16—submissions and comments ..................... 65

       Appendix B. EPA reporting on other indicator pollutants ......................................... 79

       Appendix C. Case study: City of Ballarat .................................................................... 83

       Appendix D. EPA remedial measures and sanctions.................................................. 85

       Appendix E. Monitoring stations’ siting requirements .............................................. 87

       Appendix F. Legislation and policies .......................................................................... 89

       Acronyms and abbreviations
       APS                      Annual performance statement
       AS/NZS 3580.1.1         Australian/New Zealand Standard 3580.1.1:2007 Methods for sampling and
                               analysis of ambient air—Part 1.1: Guide to siting air monitoring equipment
       BAM                      Beta attenuation monitoring
       DDO11                   Schedule 11 of the Design and Development Overlay
       DELWP                   Department of Environment, Land, Water and Planning
       EPA                      Environment Protection Authority
       IARC                     International Agency for Research on Cancer
       ICT                     Information and communications technology
       Monitoring Plan          Ambient Air Quality NEPM Monitoring Plan Victoria
       NEPC                    National Environment Protection Council
       NEPM AAQ                 National Environment Protection (Ambient Air Quality) Measure
       NEPM NPI                 National Environment Protection (National Pollutant Inventory) Measure
       OPLE                     Officers for the Protection of the Local Environment
       PM                       Particulate matter
       ppm                     Parts per million
       SEPP AAQ                State Environment Protection Policy (Ambient Air Quality)
       VAGO                     Victorian Auditor‐General’s Office
       WHO                      World Health Organization

6   Improving Victoria's Air Quality                                                  Victorian Auditor‐General’s Report
Audit overview
Clean air is important for health and wellbeing, and is an issue of community
concern. The World Health Organization (WHO) reports that statistically
significant evidence supports the correlation between poor air quality and
negative health impacts.
The air we breathe primarily contains nitrogen, oxygen, carbon dioxide, water
vapour and various inert gases. It also contains pollutant components, such as
ozone and particulate matter (PM), which arise from human and natural
processes and can affect human health.
In Victoria, the Environment Protection Authority (EPA) is the agency primarily
responsible for monitoring, regulating and reporting on the state’s air quality.
EPA is subject to a range of legislation including the Environment Protection
Act 1970 (the Act) and state environment protection policies that incorporate
national standards on ambient air quality.
EPA undertakes three types of air monitoring:
ambient air (external air environment) quality monitoring that provides EPA
with information on general air quality and regional pollution at designated
monitoring stations
campaign (local condition or investigation) monitoring that provides
information on local air quality and pollution issues
emergency (incident) monitoring, as part of the Victorian emergency
management system, to respond to major pollution events.
The Act provides EPA with a number of tools to regulate the activities of
commercial and industrial operators, including licensing and approvals,
compliance monitoring and enforcement instruments.
This audit assessed whether Victoria’s air quality meets ozone and PM
standards. We examined EPA’s monitoring of, reporting on and regulation of air
quality during the audit, including an analysis of EPA’s air quality monitoring
data from 2010 to 2016.
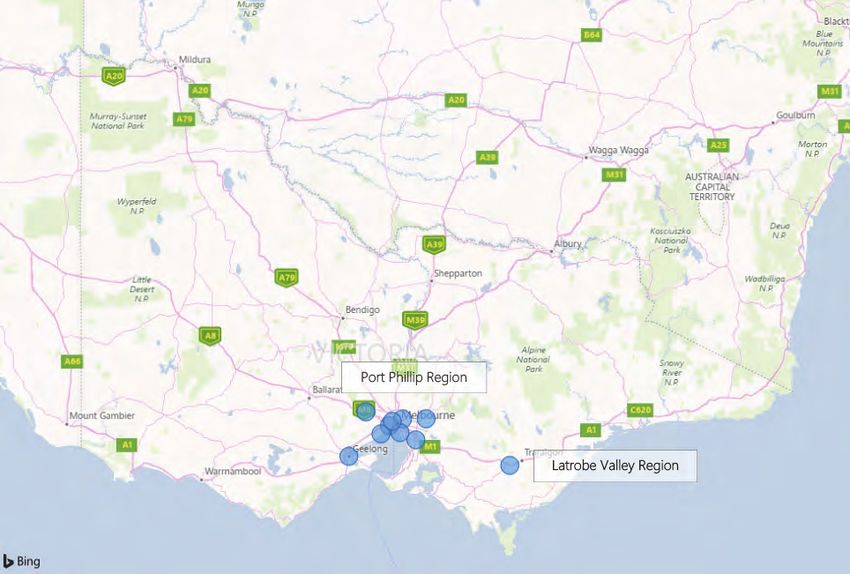
EPA’s annual air quality monitoring reports state that ambient air quality is
Conclusion generally good and within national standards. However, while this is true for the
parts of the Port Phillip and Latrobe Valley regions that it monitors, EPA’s limited
air monitoring coverage does not provide it with information on air quality for
most of the state, including many parts of metropolitan Melbourne. This relates
to both ambient air quality and localised air quality conditions.
The utility of EPA’s air quality reports is considerably diminished because EPA
has not been able to demonstrate that the air quality data it collects and reports
on is also representative of those areas it does not monitor.
Victorian Auditor‐General’s Report Improving Victoria's Air Quality 7
Contrary to the intent of its 2001 Ambient Air Quality NEPM Monitoring Plan
                                Victoria (Monitoring Plan), EPA has failed to provide a better understanding of
                                air quality outside the Port Phillip and Latrobe Valley regions. It has not updated
                                nor adjusted the plan over the last 17 years to reflect the changing risk profiles
                                that accompany both considerable population growth and changes in industrial
                                activities across the state.
                                In addition, while infrequent, we found some inaccurate assessments against
                                PM air quality standards—all of which overstated air quality, and so serve to
                                undermine confidence in publicly reported data.
                                The roles and responsibilities of agencies that contribute to air quality
                                management in the state also remain unclear and not well understood.
                                Consequently, attempts to address air quality issues have not always been well
                                coordinated and implemented. Nor has EPA kept itself fully informed of and
                                updated on air pollution sources. As a result, EPA risks not focusing its resources
                                on those air discharges that adversely impact air quality and potentially human
                                health.
                                More positively, EPA regulation of air pollution sources has begun to improve.
                                It has achieved this through better embedding its risk‐based approach into its
                                licensing requirements and developing programs to enhance its compliance
                                efforts—for example, with its major industry assessments and annual
                                performance statement (APS) audits.

                                Monitoring air quality
              Findings
                                Ambient air quality monitoring
                                EPA cannot demonstrate that its current monitoring provides a representative
                                measure of ambient air quality across the state.
                                Victoria’s State Environment Protection Policy (Ambient Air Quality) (SEPP AAQ)
                                and EPA’s Monitoring Plan require EPA to put in place a monitoring network that
                                provides a representative measure of the quality of air that Victorians are likely
                                to experience.
                                However, EPA does not collect information on the quality of ambient air for
                                most parts of the state, including many parts of metropolitan Melbourne. Its
                                network of ambient air quality monitors is limited to parts of the Port Phillip
                                and Latrobe Valley regions.
                                The Monitoring Plan requires EPA to monitor ambient air quality at all urban
                                centres with a population of at least 25 000. In 2001, using 1996 Australian
                                Bureau of Statistics data, EPA identified eight regions in the state where ambient
                                air monitors should be located. This has not occurred.

8   Improving Victoria's Air Quality                                               Victorian Auditor‐General’s Report
EPA does not measure ambient air quality in six of the eight regions it identified.
PM10 are inhalable
EPA explained that, based on previous assessments of these regions, it expects
particles, 10 µm in
diameter or smaller. pollution levels to be well below the standards outlined in the National
Examples include a Environment Protection (Ambient Air Quality) Measure (NEPM AAQ). However:
combination of coal and
EPA’s assessments were done at least 10 years ago and do not necessarily
fly ash, calcium
carbonate, sodium reflect current conditions
chloride, mould and not all indicator pollutants were monitored, with Mildura and Shepparton
spores. monitored for only one pollutant (PM10)
all stations recorded exceedance levels for at least one of the indicator
PM2.5 are fine inhalable pollutants
particles, 2.5 µm in
diameter or smaller. EPA has not monitored PM2.5 levels in any of these regions to date—the
Examples include sulfates, NEPM AAQ required assessment against PM2.5 standards from 2016.
nitrates, ammonium,
organic compounds, EPA has previously acknowledged the need for more extensive monitoring in
elemental carbon, metals these regions but this has not occurred to date. Its 2006 air quality monitoring
and trace elements. report indicated that regional campaign monitoring continues to record
elevated concentrations of PM10 and, therefore, future monitoring of this
pollutant should be considered.
Further, using 2016 Australian Bureau of Statistics data we identified some
40 urban centres with populations of at least 25 000 that are not covered by
EPA’s ambient air monitoring network.
Campaign and emergency monitoring
Many of EPA’s campaign monitoring stations have been in operation for several
years, such as the ones at Wangaratta and the Brooklyn Industrial Precinct. In
comparison, emergency monitoring stations operate for shorter durations as
required by the particular emergency incident.
Results from these other monitoring stations do not form part of EPA’s annual
air quality monitoring reports, as the data they record reflects conditions
specific to local issues and emergency events. EPA does, however, publish
reports on air quality results from time to time for some of these monitoring
stations. EPA also provides some air monitoring results on its EPA AirWatch
website.
However, publicly reported data is not quality reviewed for accuracy and
reliability, nor are any limitations clearly identified and explained. The AirWatch
website does not always clearly indicate units of measurement, and we found
some inconsistencies between the validated raw data provided to us by EPA and
the website data.
Routine public reporting of all the air quality information collected would
improve transparency and provide the community with additional insights
about the air pollution risks to which they are exposed.
Victorian Auditor‐General’s Report Improving Victoria's Air Quality 9Recommendation 6.3 of the 2016 EPA inquiry report
In 2016, a Ministerial Advisory Committee appointed by the then Minister for
Environment, Climate Change and Water completed its inquiry into EPA. The
committee’s report recommended that EPA ‘assess the adequacy of its air and
water monitoring networks, particularly in relation to air quality’ and ‘consider
options to improve data sharing and accessibility, and community
communication’.
In early 2017, the Victorian Government supported these recommendations,
and EPA is currently working on them through its Reform Project Plan:
Environmental Monitoring Capability Review. EPA advised that the project
plan aims to deliver a draft business case for proposed enhancements to its
monitoring capability.
Reporting on Victoria’s ambient air quality
EPA’s annual air quality monitoring reports publish EPA’s assessment of
collected air data against NEPM AAQ standards. Air quality meets or complies
with NEPM AAQ when:
the relevant standard was exceeded no more than the allowed number of
times
data was available for at least 75 per cent of each quarter of the year.
Air quality monitoring reports indicate that for the period 2010 to 2016, in the
parts of the Port Phillip and Latrobe Valley regions that EPA monitors, air quality
met ozone and PM NEPM AAQ standards for all seven years, except in 2015 for
PM10. Assessment against the NEPM AAQ standards for PM2.5 was not
required until 2016.
EPA’s 2015 air quality monitoring report states that possible causes for the
PM10 exceedances include localised or regional dust storms, smoke from
bushfires, planned or agricultural burning, motor vehicles or domestic wood
heaters.
Inaccurate assessments
Our analysis of EPA’s annual air quality monitoring reports against the actual
underpinning data shows that EPA’s assessments do not always accurately
reflect whether Victorian air quality complies with NEPM AAQ standards. For
example, in 2013, EPA assessed PM10 levels in Geelong South as meeting the
standard even though there were eight days when levels exceeded the standard
and EPA had sufficient data to report this.
10 Improving Victoria's Air Quality Victorian Auditor‐General’s ReportWe found three further instances of inaccurate assessments by EPA over the
seven‐year period we reviewed, where EPA should have reported a finding of
‘not met’ but instead reported a rating of ‘met’ or ‘not demonstrated’. In a
fifth instance, contrary to the requirement of the NEPM AAQ, no assessment
was made for PM2.5 in 2016. A ‘not met’ assessment should have been given
in this instance.
During the audit, EPA acknowledged that all five instances we raised should
have been assessed as ‘not met’.
These findings reflect weaknesses in EPA’s processes for assuring the accuracy
of its assessment and reporting.
Negative values included when assessing air quality
In computing average pollutant concentrations, EPA includes recorded values
that are below zero. EPA advised that this is consistent with NEPM AAQ
procedures.
Logically, however, the lowest possible value for air pollutant concentrations is
zero. Either it is present, even if in very small amounts, or it is not. Negative
values are an artefact of the measurement and recording process.
Leaving negative values in the data introduces a negative bias, which potentially
under represents actual concentrations of pollutants. We noted a considerable
number of negative values recorded. For example, in 2016, negative values
comprised 5.3 per cent of recorded hourly PM2.5 values, and 1.3 per cent of
hourly PM10 values. When we excluded negative values from the calculation of
one‐day averages, there were five more exceedance days for PM2.5 and one
more for PM10 during 2016.
Quality of EPA’s raw data
We found that EPA’s air quality data is not as reliable as would be expected.
Basic sample checking showed inconsistencies between EPA’s raw data and
what was published in its AirWatch historical data. EPA acknowledges
weaknesses in this historical data and advised that it intends to eventually
remove it from its website.
Moreover, when we highlighted a significantly high PM2.5 hourly value recorded
in 2015, EPA informed us that this was an error due to an instrument fault, and
that it should have removed this value from its air quality dataset. EPA further
advised that this was true for three other PM2.5 hourly values recorded on the
same day from the same monitoring station.
However, despite EPA identifying the instrument fault in 2015 on the same day
on which the data was recorded, the data was not tagged as inaccurate. Instead,
the data remained in EPA’s air quality dataset until it was provided to us for the
audit nearly two years later in mid‐2017.
Victorian Auditor‐General’s Report Improving Victoria's Air Quality 11EPA advised that it subsequently removed the invalid data from its system but is
unable to specify exactly when it made this correction. This is contrary to EPA’s
data validation procedure, which requires details of changes to air quality data
to be recorded.
EPA is also unable to provide advice on the number of air quality data changes
made on a yearly basis, or the reasons for any changes made.
Monitoring equipment, and information and communications
technology infrastructure
Ambient air quality monitors are designed to be located a certain distance from
direct pollution sources. While EPA’s ambient air quality monitoring stations and
equipment generally comply with NEPM AAQ standards, most monitors are
located closer to roads than is required by the standard. EPA advised that, as
the Victorian population lives and works close to roads, most of their stations
are in population centres next to roads. This potentially means that the air data
collected is impacted by pollutants from motor vehicles to a greater extent than
is envisaged by the standard.
The information and communications technology (ICT) infrastructure
underpinning EPA’s air quality monitors is ageing, no longer supported by
vendors and subject to security vulnerabilities. This is increasingly affecting the
reliability of the data collected and computed. EPA is aware of these weaknesses
and reports that it has started to address the issues.
Regulating air quality
Guided by previous Victorian Ombudsman and VAGO reports, and following an
EPA‐initiated Compliance and Enforcement Review in 2010 and an Approvals
Review in 2013, EPA has been better embedding its risk‐based approach into
its licensing requirements. It has also developed programs to enhance its
compliance efforts—for example, through its investigations of major industries
and APS audits.
EPA could achieve further improvements by ensuring it monitors all high‐risk
sources of ozone and PM pollutants and by reviewing its oversight of and
effectiveness in addressing unlawful air discharges.
Roles and responsibilities
The responsibility for regulating Victoria’s air quality rests primarily with EPA.
However, a number of other government agencies undertake functions that
impact air quality, including the Department of Environment, Land, Water and
Planning (DELWP), local government, the Commissioner for Environmental
Sustainability, VicRoads, WorkSafe Victoria, the Victorian Planning Authority,
emergency services, and a host of other agencies including the Commonwealth
Government.
12 Improving Victoria's Air Quality Victorian Auditor‐General’s ReportAcross the many relevant legislative and policy instruments that relate to air
quality regulation, there is a lack of clarity regarding roles and responsibilities,
what triggers the commencement of a particular responsibility, and when a
responsibility transfers to another agency.
In July 2013, the Statutory Policy Review prepared by the then Department
of Sustainability and Environment (now DELWP) and EPA acknowledged
weaknesses in this regard, noting that ‘a lack of coordinated and accountable
implementation’ of policies ‘has limited their effectiveness and exposed EPA and
other Victorian government agencies to legitimate criticism’. DELWP advised
that it is currently considering how to progress actions to implement the
recommendations from the Statutory Policy Review, to ensure that they align
with the recommendations of the 2016 EPA inquiry report.
Identifying sources of air pollution—air emissions inventory
EPA last conducted an air emissions inventory in 2006. An air emissions
inventory is a comprehensive evaluation that aims to understand the extent of
state pollutant emissions and their sources. Relying on a 12‐year‐old emissions
inventory is inconsistent with EPA’s approach of using science to inform its
activities. While EPA has other means to identify air pollution sources, the
completion of an up‐to‐date air emission inventory is critical for EPA’s
understanding of statewide point and diffuse air pollution sources that require
its attention.
Another consequence of EPA’s 12‐year‐old air emissions inventory is that
Victoria’s aggregated air emissions data on the Commonwealth Government’s
National Pollutant Inventory website remains unchanged since 2006.
Identifying sources of air pollution—unlawful discharges
EPA primarily relies on the community and industrial operators to report
inappropriate or noncompliant air discharges. EPA’s inspections look into these
reports to confirm whether any noncompliance has occurred.
Self‐reporting assumes that operators have appropriate processes to reliably
monitor air discharges and will voluntarily report any breaches of their licences.
However, many of the operators audited by EPA between 2014 and 2016
either did not have monitoring plans, had weak monitoring processes, or
under‐reported breaches. Further, EPA advised that obtaining sufficient and
reliable evidence to show operators’ noncompliance with air discharge
conditions is a major challenge for its enforcement efforts.
Victorian Auditor‐General’s Report Improving Victoria's Air Quality 13Improved processes
EPA has begun to embed a risk‐based approach into its regulatory activities to
better manage air pollutants. EPA has developed:
a framework to review and revise all licences to ensure the currency of
licence conditions and provide consistency in emission limits
the Licensed Operator Risk Assessment model to help prioritise compliance
inspections
new guidelines to assist operators to better understand their licence
conditions and how to comply with them
new and revised internal documentation to assist staff to apply compliance
and enforcement tools
a more rigorous approach to monitoring major industry facilities, based on
the scale of discharges, the quantity of materials stored or the complexity of
facilities’ industrial processes.
Focus on licensed operators
EPA undertook a project to reform its licensing process in 2009. One of the
intentions of this reform project was to review licence discharge limits and
conditions, and to continue reviewing them annually to ensure their currency
and to detect any emerging issues. An EPA internal briefing shows that this did
not take place due to changed organisational priorities. There are several
outstanding licensing issues:
Current licence conditions are generic, so assessing and enforcing
compliance is difficult.
Discharge indicators are not consistent for specific industry sectors.
Current discharge limits on many of the licences are based on limitations
of existing pollution treatment systems rather than what is acceptable for
release to the environment.
Numerous limit types have been used in licences without proper
assessment of their relevance.
Operators require industry‐specific guidance on how to design a monitoring
program to demonstrate compliance.
The perpetual nature of EPA licences does not encourage operators to
adopt the latest technology and does not reflect community expectations.
To address these issues, EPA launched a five‐year periodic licence review
program in 2015–16. The program aims to ensure the currency and efficacy of
licences and licence conditions, and to provide consistency in emission limits
and condition requirements. Following the 2016 EPA inquiry report, the
Victorian Government also committed to further improve EPA’s licensing
activities to minimise environmental impacts from potentially polluting
industrial activities.
14 Improving Victoria's Air Quality Victorian Auditor‐General’s ReportEPA largely targets its efforts at licensed operators—those that need to obtain
EPA approval to operate and commence work. In October 2017, there were
658 licensed operators in Victoria—but there are many more unlicensed
operators than licensed ones, over which EPA exercises limited oversight.
EPA focuses on licensed operators because it wants to direct its limited
resources to the biggest sources of potential harm to the environment.
However, some of the unlicensed operators are major contributors to air
pollution in Victoria. Unlicensed operators include several thousand smaller
operators that discharge air pollutants in their day‐to‐day operations. EPA’s
recent investigations that involved air discharge emissions included two
unlicensed premises, and we understand that EPA intends to gradually
cover more unlicensed premises in its regulatory efforts as resources allow.
Case study: Brooklyn Industrial Precinct
Poor air quality arising from the Brooklyn Industrial Precinct presents
a good example of the complex issues involved in air quality management.
It demonstrates how EPA needs to continue developing a close working
relationship with councils and other government agencies to address harmful
air emissions.
Notwithstanding some improvements, the precinct continues to experience
poor air quality with considerable exceedance days for PM10.
EPA and Brimbank City Council advise that up to 10 operators within the
precinct continue to be sources of inappropriate air emissions and noxious
odours. In response, EPA has commenced more rigorous enforcement actions,
including prosecution.
We recommend that the Environment Protection Authority:
Recommendations
1. expand its air monitoring network by:
reviewing and updating its current Monitoring Plan to reflect its
risk‐based approach to environmental regulation (see Sections 2.2
and 2.3)
in addition to its ambient air quality monitoring for purposes of the
NEPM AAQ, designing and implementing an air monitoring program
that better aligns coverage with air pollution risks that Victorian
communities are exposed to (see Sections 2.2 and 2.3)
2. improve its reporting on air quality by:
introducing a rigorous quality review process to ensure the accuracy
and reliability of the state’s air quality data and assessments against
NEPM AAQ standards as presented across its various reporting,
including on its AirWatch website (see Sections 3.2, 3.3 and 3.4)
developing readable and easily accessible annual reports on the results
collected from all air monitoring across the state, highlighting
assessments against standards and recorded exceedances (see
Sections 3.3 and 3.4)
Victorian Auditor‐General’s Report Improving Victoria's Air Quality 153. expand and update its knowledge of Victoria’s air quality by:
completing a comprehensive Victorian air emissions inventory to
identify current major point and diffuse sources of air pollution
(see Section 4.3)
determining and preparing an action plan on how best to (1) oversight
the air quality monitoring conducted by high‐risk operators to ensure
that monitoring plans are in place, and that these plans are
appropriately implemented; and (2) understand and effectively respond
to air emissions from lower risk sites (see Section 4.4)
4. work with all relevant councils to address air quality issues at the Brooklyn
Industrial Precinct by:
reducing exceedance days and achieving NEPM AAQ standards for
PM10, and considering the need to monitor other pollutants (see
Section 4.5)
agreeing on the installation and location of additional air monitoring
stations to measure the impact of air discharges on nearby residential
communities (see Section 4.5).
We recommend that the Environment Protection Authority and the Department
of Environment, Land, Water and Planning:
5. clarify the roles and responsibilities of relevant Victorian Government
agencies with respect to air quality management, and develop protocols to
ensure accountabilities are understood and coordination is achieved (see
Section 4.2).
We have consulted with EPA, DELWP, City of Ballarat and Brimbank City Council,
Responses to and we considered their views when reaching our audit conclusions. As required
recommendations by section 16(3) of the Audit Act 1994, we gave a draft copy of this report, or
parts thereof, to those agencies and asked for their submissions or comments.
We also provided a copy of the report to the Department of Premier and
Cabinet.
The following is a summary of those responses. The full responses are included
in Appendix A.
All four agencies welcomed the report’s findings and recommendations to
further improve Victoria’ air quality monitoring and management.
EPA accepted all five recommendations and provided an action plan on how it
will implement them.
DELWP accepted the recommendation addressed to it, noting that it will also
support EPA in its acquittal of the remaining recommendations.
There were no recommendations directed toward the Ballarat and Brimbank
city councils. Even so, noting that some of the recommendations have
implications for councils, the Brimbank City Council advised that it will continue
to work with the EPA to facilitate the implementation of these
recommendations.
16 Improving Victoria's Air Quality Victorian Auditor‐General’s ReportAudit context
Clean air is important for health and wellbeing, and is an issue of community
concern. WHO reports that statistically significant evidence supports the
correlation between poor air quality and negative health impacts.
The air we breathe primarily contains nitrogen, oxygen, carbon dioxide, water
vapour and various inert gases. It also contains pollutant components, such
as ozone and PM. These can arise from human sources, such as industrial
operations, domestic fires and motor vehicles, and from natural processes such
as lightning strikes, volcanic eruptions, and spontaneous bushfires.
In Victoria, EPA is the agency primarily responsible for monitoring, regulating
and reporting on the state’s air quality. EPA carries out this function in
accordance with a suite of statutory instruments including the Act and state
environment protection policies, which incorporate national standards on
ambient air quality. The Act provides EPA with a number of tools to regulate
the activities of commercial and industrial operators, including licensing and
approvals, compliance monitoring and enforcement instruments.
Victorian Auditor‐General’s Report Improving Victoria's Air Quality 17Air quality is good or optimal when the relative natural proportion of its
1.1 Air quality nitrogen, oxygen and other gas components is maintained at safe levels and
pollutant components are cleaned and filtered away through natural processes.
These include dilution and dispersion by wind, biochemical breakdown of
pollutants into harmless molecules, and washing out of the atmosphere by rain.
When there are too many pollutant components, and concentrations are too
high for natural processes to clean and filter them away, the pollution build‐up
degrades air quality to levels that could affect human health and wellbeing.
Ambient air quality and beneficial uses
The SEPP AAQ defines ambient air as the ‘external air environment’, specifically
excluding the air inside buildings.
The SEPP AAQ states that the desired outcome for improving and maintaining
the state’s ambient air quality is to protect the following ‘beneficial uses’:
human health and wellbeing
the life, health and wellbeing of other forms of life—that is, animals and
vegetation
visibility
the useful life and aesthetic appearance of buildings, structures, property
and materials
aesthetic enjoyment and local amenity.
‘Beneficial uses’ refers to environmental values and human activities that need
to be protected from the effects of pollution and waste, for the benefit of all
Victorians.
Indicators of air quality
The concentration levels of indicator pollutants are monitored and measured
against set standards to determine ambient air quality. The National
Environment Protection Council (NEPC), comprising environment ministers of
the Commonwealth, state and territory governments:
identifies indicator pollutants on the basis of what is widely occurring in the
air environment
sets standards for each indicator pollutant, at concentration levels that are
necessary to protect human health and wellbeing.
The SEPP AAQ, which incorporates the NEPM AAQ, provides standards for seven
indicator pollutants as shown in Figure 1A.
18 Improving Victoria's Air Quality Victorian Auditor‐General’s ReportFigure 1A
Victorian ambient air quality standards, under SEPP AAQ
Maximum concentration Maximum allowable
Item Pollutant Averaging period(a) standard exceedances
1 Carbon monoxide 8 hours 9.0 parts per million (ppm) 1 day a year
2 Nitrogen dioxide 1 hour 0.12 ppm 1 day a year
1 year 0.03 ppm None
3 Photochemical oxidants 1 hour 0.10 ppm 1 day a year
(as ozone) 4 hours 0.08 ppm 1 day a year
4 Sulfur dioxide 1 hour 0.20 ppm 1 day a year
1 day 0.08 ppm 1 day a year
1 year 0.02 ppm None
5 Lead 1 year 0.50 µg/m³ None
6 Particulate matter as PM10 1 day 50 µg/m³ None
1 year 20 µg/m³(b) None
6A Particulate matter as PM2.5 1 day 25 µg/m³ None
1 year 8 µg/m³ None
7 Visibility‐reducing particles 1 hour 20 km 3 days a year
(a) The averaging period is the period of time over which the pollutant must not exceed the set standards. For example, the one‐day
average standard for PM10 is 50 µg/m³. This means that the average value of the 24‐hourly PM10 readings on any particular day must
not exceed 50 µg/m³.
(b) The SEPP AAQ’s one‐year average standard for PM10, 20 µg/m³, is more stringent than the NEPM AAQ’s 25 µg/m³.
Source: Victorian SEPP AAQ.
Air toxics or hazardous air pollutants outside of the indicator pollutants included
in Figure 1A are also discharged to the air environment, but at relatively lower
concentrations. The State Environment Protection Policy (Air Quality
Management) defines and categorises these pollutants depending on how
hazardous they are. EPA has historically monitored some air toxics including
benzene, toluene and xylene.
It is not possible to eliminate air pollution altogether. A range of activities
necessary for humans to live and for society to function contribute to it, such as
energy generation, transport and industry operations. In addition, some air
pollution will occur from natural events such as bushfires or wind‐blown dust.
World Health Organization air quality guidelines
In 1987, WHO developed air quality guidelines—shown in Figure 1B—to provide
government policy‐makers with relevant targets for managing air quality and to
provide a uniform, scientific basis for understanding the effects of air pollution
on human health. These guidelines, which were updated in 1997 and 2005, are
based on the expert evaluation of current scientific evidence. The guidelines are
currently under review for another update.
While these guidelines are not legally binding for member countries including
Australia, they are regarded as authoritative.
Victorian Auditor‐General’s Report Improving Victoria's Air Quality 19Figure 1B
WHO air quality guidelines
Averaging Maximum
Pollutant period concentration
PM2.5 1 year 10 µg/m³
1 day 25 µg/m³
PM10 1 year 20 µg/m³
1 day 50 µg/m³
Ozone 8 hours 100 µg/m³
Nitrogen dioxide 1 year 40 µg/m³
1 hour 200 µg/m³
Sulfur dioxide 1 day 20 µg/m³
10 minutes 500 µg/m³
The SEPP AAQ is more stringent for the PM2.5 one‐year average at 8 µg/m³, compared to the
WHO guidelines’ 10 µg/m³. The WHO guidelines also use different units of measurement for ozone,
nitrogen dioxide and sulfur dioxide.
Source: WHO air quality guidelines for particulate matter, ozone, nitrogen dioxide and sulfur dioxide.
Particulate matter
PM is a complex mixture of solid and liquid particles of organic and inorganic
substances suspended in the air:
PM2.5 are fine inhalable particles, 2.5 µm in diameter or smaller. Examples
include sulfates, nitrates, ammonium, organic compounds, elemental
carbon, metals and trace elements. The average human hair, at about
70 µm in diameter, is almost 30 times bigger than the largest PM2.5.
PM10 are inhalable particles, 10 µm in diameter or smaller. Examples
include a combination of coal and fly ash, calcium carbonate, sodium
chloride, mould and spores.
PM can come directly from both natural and human sources including bushfires,
dust storms, construction sites, unpaved roads, wood burning, mining, industrial
processes and motor vehicles. PM may also be a secondary product resulting
from combustion and chemical reactions between gases such as sulfur dioxide
and nitrogen oxides, which are pollutants emitted by industrial operations and
motor vehicles.
Ozone
Ozone is a colourless gas composed of three atoms of oxygen. Ozone occurs in
the Earth’s upper atmosphere where it forms a protective layer, shielding Earth
from the sun’s harmful ultraviolet rays.
At ground level, however, ozone is a harmful air pollutant. Ground‐level ozone
forms due to photochemical reactions where sunlight and precursor pollutants
such as nitrogen oxides and volatile organic compounds are present. Bushfire
smoke, motor vehicles, power plants, industrial boilers, refineries and chemical
plants can release ozone.
20 Improving Victoria's Air Quality Victorian Auditor‐General’s ReportOzone is generally more prevalent on hot, sunny days, but can still reach high
levels during colder months. It tends to linger in the atmosphere and can be
transported long distances by wind. This means that even areas a fair distance
from busy roads and industrial places where ozone first forms may experience
high concentrations.
Limiting the harmful health impacts of air pollution is the primary objective of
1.2 Health air quality management. Poor air quality can increase respiratory illness and
impacts of air cardiovascular and cardiopulmonary diseases. Research has found that this
pollutants occurs even in jurisdictions considered to enjoy relatively good air quality, such
as Australia. In 2003, the Australian Institute of Health and Welfare estimated
that urban air pollution contributed to about 3 000 deaths in Australia.
In 2010, the Commonwealth’s former Environment Protection and Heritage
Council found that increased concentrations of air pollutants in Australian and
New Zealand cities, including Melbourne, are significantly associated with
increases in:
mortality from cardiovascular and respiratory diseases (impacting mostly
the elderly)
cardiovascular hospital admissions for a range of diseases including all
cardiac, ischaemic heart disease, myocardial infarction, and cardiac failure
(again, the impact on the elderly is the strongest)
arrhythmia hospital admissions for 15 to 64 year olds
respiratory hospital admissions for a range of diseases including all
respiratory, chronic obstructive pulmonary disease, pneumonia and acute
bronchitis (the impact on children is the strongest, except for chronic
obstructive pulmonary disease).
Health impacts of particulate matter
According to WHO, no threshold has been identified below which PM2.5 or
PM10 pollution has zero health impact.
Because they can be inhaled easily, PM10 and PM2.5 are known to lodge deeply
inside the lungs and enter the bloodstream. This means that even at very low
concentrations, vulnerable members of the population—including the elderly,
the very young and people suffering from respiratory infections—may
experience health impacts from PM exposure.
WHO’s International Agency for Research on Cancer (IARC) has evaluated PM
(as a component of outdoor air pollution) as a class 1 carcinogen—that is,
‘carcinogenic to humans’ similar to tobacco, asbestos and ultraviolet radiation.
IARC found that exposure to outdoor air pollution may cause lung cancer and
may lead to increased risk of bladder cancer. WHO estimates that outside air
pollution causes three million deaths annually worldwide.
Although levels of exposure and air pollution components vary significantly
between locations, IARC noted that its findings on PM pollution apply to all
regions of the world.
Victorian Auditor‐General’s Report Improving Victoria's Air Quality 21Health impacts of ozone
Short‐ and long‐term exposure to ozone has been found to decrease respiratory
and cardiovascular functions. This may cause throat irritation and inflammation,
coughing and chest pain.
Ground‐level ozone is known to potentially worsen bronchitis, emphysema and
asthma. Children, the elderly, people active outdoors and those with existing
respiratory conditions are more susceptible to the harmful effects of
ground‐level ozone.
WHO reports that research on short‐term exposure to ozone provides evidence
of its potential harmful impact on health, including deaths due to respiratory
and cardiovascular causes. WHO explains that these adverse health effects were
observed independent of the role of other pollutants.
Air pollution sources are classified as either ‘point’ or ‘diffuse’:
1.3 Sources of
Point sources are stationary and often major sources of air pollution. They
poor air quality include factories, power stations, incinerators, other industrial premises and
commercial businesses. Some industrial point sources discharge pollutants
through chimneys that are meant to be tall enough to allow for sufficient
dilution before they reach human communities.
Diffuse sources include mobile, non‐stationary sources such as motor
vehicles, aircraft, and bushfires. They also include more minor stationary
sources, such as wood fires and smaller industrial operators.
Data that EPA collected in 2006 shows that industrial activities, particularly
electricity generation, and emissions from motor vehicles are major
contributors to Melbourne’s air pollution.
National Pollutant Inventory
The Commonwealth Government’s NPI website provides annually updated
public information on emission estimates for 93 substances, including their
source and location. Some of these are air pollutants, including PM and ozone
precursors.
Under the National Environment Protection (National Pollutant Inventory)
Measure (NEPM NPI), operators, including large industrial facilities, that exceed
thresholds for the production or generation of any of the 93 listed substances
must report their emissions and transfers of these substances annually.
State and territory governments estimate emissions from smaller industries,
households and everyday activities in major population centres, and the
Commonwealth Government includes this data in the NPI. This includes
emissions from motor vehicles, wood heaters and smaller appliances such
as powered garden equipment. This information is subject to availability and
is not necessarily updated annually.
22 Improving Victoria's Air Quality Victorian Auditor‐General’s ReportVictorian legislation incorporates the NEPM NPI in the 2012 Waste Management
Policy (National Pollutant Inventory). EPA is responsible for collating the
required emissions data from commercial operators and reporting on aggregate
emissions from diffuse sources and smaller commercial operators to the
Commonwealth Government.
The Act established EPA as the principal agency responsible for the protection of
1.4 Policy and Victoria’s environment, including preventing or controlling pollution such as the
legislative discharge or emission of waste into the atmosphere.
framework There are complementary national and jurisdictional statutory frameworks to
manage air quality. The national framework:
sets underpinning requirements, including framing legislation, where
national consistency is needed but for which the Commonwealth has
limited statutory authority, such as national environment protection
measures
deals with matters most effectively regulated at a national level, including
certain standards for vehicles, equipment and appliances, such as Australian
design rules covering certain vehicle emissions and fuel quality standards
articulates policy and program priorities where governments have agreed
that a consistent national approach is preferable, such as the National Clean
Air Agreement
provides public access to national information, such as through the
NEPM NPI or annual NEPC reports.
States and territories, including Victoria, complement these national
approaches through a range of activities, including:
giving the necessary statutory effect to national standards or measures,
such as the SEPP AAQ giving effect to the NEPM AAQ
in some cases, further strengthening national requirements, such as the
SEPP AAQ having a lower or more stringent standard than the NEPM AAQ
one‐year average for PM10, and Victorian vehicle emission regulations
further limiting in‐use vehicle emissions
establishing policy and implementing statutory requirements, programs and
processes to monitor, manage and reduce emissions from a wide range of
sources
providing public access to information on local air quality, such as through
EPA AirWatch or emission alerts.
Victorian Auditor‐General’s Report Improving Victoria's Air Quality 23National Environment Protection (Ambient Air Quality)
Measure
NEPC approved the NEPM AAQ in 1998 to provide national air quality standards
that protect human health and wellbeing from the adverse effects of air
pollution. It set ambient air quality standards as well as mandatory monitoring
and reporting requirements for six indicator air pollutants.
NEPC last updated the NEPM AAQ in December 2015 to strengthen the
standards for PM based on the latest scientific understanding of the health risks
arising from airborne particle pollution. This update was a principal initiative
under the National Clean Air Agreement.
The NEPM AAQ requires each state and territory to monitor, assess and report
concentrations of seven air pollutants, including photochemical oxidants (as
ozone) and particles as PM2.5 and PM10, in accordance with a specified
protocol. The protocol requires that each jurisdiction:
prepare an air quality monitoring plan
establish a network of ‘performance’ air quality monitoring stations (or use
equivalent means) that are located in such a way that they contribute to
obtaining a representative measure of air quality that is likely to be
experienced by the general population
through these stations, monitor the concentrations of air pollutants
evaluate the concentrations of air pollutants in comparison with standards
set by the NEPM AAQ—as ‘meeting’, ‘not meeting’ or ‘not demonstrated’
report the results annually
operate each monitoring station in the same location for at least five years.
State Environment Protection Policy
The SEPP AAQ adopts the requirements of the NEPM AAQ and includes a
separate standard for visibility‐reducing particles.
In July 2016, the Victorian Government revised the SEPP AAQ to incorporate the
2015 variation to the NEPM AAQ and to provide for a more stringent PM10
annual standard.
Air quality monitoring
EPA undertakes air monitoring for different purposes.
Ambient air quality monitoring
Ambient air quality monitoring provides EPA with information on general air
quality and regional pollution at designated NEPM AAQ monitoring stations.
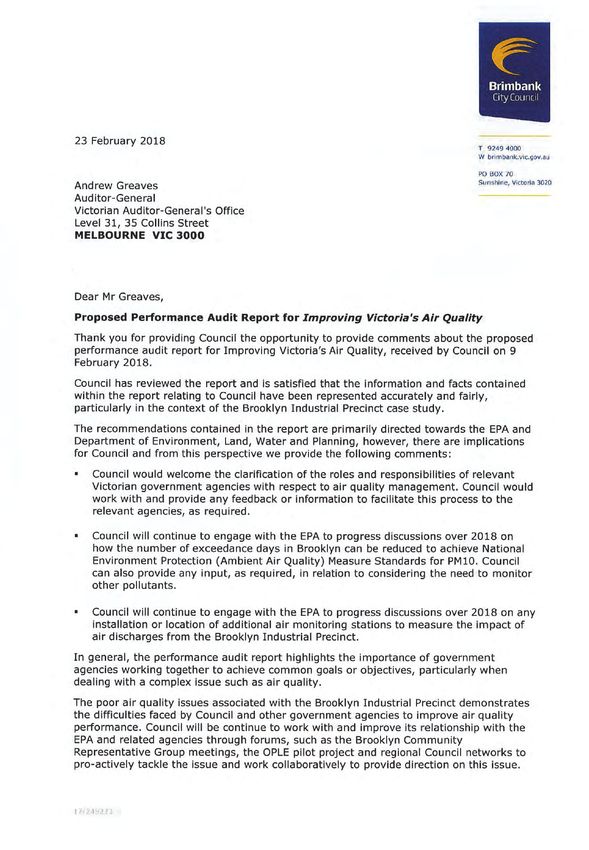
In 2016, stations were located at Alphington, Altona North, Brighton,
Dandenong, Footscray, Geelong South, Melton, Mooroolbark, Point Cook
and Traralgon.
EPA publishes the results in annual air quality monitoring reports, as
required by the NEPM AAQ.
24 Improving Victoria's Air Quality Victorian Auditor‐General’s ReportCampaign (local condition or investigation) monitoring
Campaign monitoring provides information on local air quality and pollution
issues.
At 30 January 2018, stations were located at Brooklyn, Box Hill, Wangaratta,
Melbourne CBD, Macleod, Churchill, Moe and Morwell.
EPA is not required to publish the results in its annual air quality monitoring
reports. From time to time, EPA publishes results from its campaign
monitoring stations on its website.
Emergency (incident) monitoring
EPA conducts emergency monitoring as part of the Victorian emergency
management system, to respond to major pollution events—for example,
the July 2017 Coolaroo fire and the 2014 Hazelwood mine fire.
EPA is not required to publish the results in its annual air quality monitoring
reports. From time to time, EPA publishes results on its website.
The EPA AirWatch website and map present available ambient air quality
information, along with some campaign and emergency air monitoring
information. EPA updates this information on an hourly basis and includes
health alerts where applicable.
Melbourne’s population is predicted to grow by 50 per cent by 2030 and to
1.5 Why this audit reach 10 million by 2050. Population growth means an increase in emissions
is important linked to domestic and business activities and, as a result, more people will be
exposed to air pollution.
This audit focused on ozone and PM pollutants. This is because, while EPA
monitoring shows that the concentration of many indicator pollutants has
decreased considerably and they have been consistently below the standards
for the last 10 years, exceedances in the levels of ozone and PM continue to
occur from time to time.
The 2016 EPA inquiry report recommended that EPA assess the adequacy of its
air monitoring networks, and consider options to improve data sharing and
accessibility, and community communications. The Victorian Government
accepted all the recommendations relating to air quality monitoring.
It is now timely to examine EPA’s monitoring, reporting and regulation of
Victoria’s air quality.
Victorian Auditor‐General’s Report Improving Victoria's Air Quality 25This audit examined whether Victoria’s air quality meets the standards for
1.6 What this ozone and PM discharges. We looked at:
audit examined the roles and responsibilities of Victorian agencies in air quality
and how management
monitoring and reporting on air quality
management of point and diffuse source discharges.
We conducted our audit in accordance with Section 15 of the Audit Act 1994
and ASAE 3500 Performance Engagements. We complied with the
independence and other relevant ethical requirements related to assurance
engagements. The cost of this audit was $590 000.
The remainder of the report is structured as follows:
1.7 Report
Part 2 examined EPA’s monitoring of air quality
structure
Part 3 examined EPA’s reporting on air quality
Part 4 examined EPA’s regulation of air pollution sources.
26 Improving Victoria's Air Quality Victorian Auditor‐General’s ReportMonitoring air quality
The NEPM AAQ requires each state and territory to monitor, assess and report
on concentrations of seven air pollutants, including ozone, PM2.5 and PM10, in
accordance with a specified protocol. The protocol requires that each
jurisdiction:
prepare an air quality monitoring plan
establish a network of ‘performance’ air quality monitoring stations (or use
equivalent means) located so they collectively provide a representative
measure of the air quality likely to be experienced by the general
population
operate each monitoring station in the same location for at least five years.
In this part of the report, we examine EPA’s monitoring of air quality in Victoria.
Victorian Auditor‐General’s Report Improving Victoria's Air Quality 27You can also read