Understanding peacefulness through the world news - arXiv
←
→
Page content transcription
If your browser does not render page correctly, please read the page content below

Vasiliki Voukelatou et al.

                                            RESEARCH

                                        Understanding peacefulness through the world
                                        news
                                        Vasiliki Voukelatou1* , Ioanna Miliou2 , Fosca Giannotti3 and Luca Pappalardo3
                                        *
                                          Correspondence:
                                        vasiliki.voukelatou@sns.it              Abstract
                                        1
                                          Scuola Normale Superiore, Pisa,
arXiv:2106.00306v3 [cs.AI] 1 Sep 2021

                                        Italy                                   Peacefulness is a principal dimension of well-being for all humankind and is the
                                        Full list of author information is      way out of inequity and every single form of violence. Thus, its measurement has
                                        available at the end of the article     lately drawn the attention of researchers and policy-makers. During the last
                                                                                years, novel digital data streams have drastically changed the research in this
                                                                                field. In the current study, we exploit information extracted from a new digital
                                                                                database called Global Data on Events, Location, and Tone (GDELT), to capture
                                                                                peacefulness through the Global Peace Index (GPI). Applying predictive machine
                                                                                learning models, we demonstrate that news media attention from GDELT can be
                                                                                used as a proxy for measuring GPI at a monthly level. Additionally, we use the
                                                                                SHAP methodology to obtain the most important variables that drive the
                                                                                predictions. This analysis highlights each country’s profile and provides
                                                                                explanations for the predictions overall, and particularly for the errors and the
                                                                                events that drive these errors. We believe that digital data exploited by Social
                                                                                Good researchers, policy-makers, and peace-builders, with data science tools as
                                                                                powerful as machine learning, could contribute to maximize the societal benefits
                                                                                and minimize the risks to peacefulness.
                                                                                Keywords: well-being; peacefulness; Global Peace Index; GDELT; news; Data
                                                                                Science for Social Good; SHAP

                                                                              1 Introduction
                                                                              Measuring well-being for adequate policy making is a crucial objectives of every
                                                                              country, as high or low levels of well-being reflect a country’s societal progress
                                                                              [1, 2]. Considering that well-being is a vague and multi-dimensional concept, it
                                                                              cannot be captured as a whole, but through a set of health, socio-economic, safety,
                                                                              environmental, and political dimensions [3, 4].
                                                                                The United Nations Development Programme (UNDP) embodies the aforemen-
                                                                              tioned dimensions into 17 Sustainable Development Goals (SDGs) [5, 6, 7], such
                                                                              as “No Poverty”, “Reduced inequalities”, “Peace, Justice, and Strong Institutions”.
                                                                              Apart from the SDGs, the UNDP has created the Human Development Index (HDI)
                                                                              [8] to capture well-being and human development. Similarly, the Organisation for
                                                                              Economic Co-operation and Development (OECD) created the Better Life Index
                                                                              (BLI) [3] to capture various well-being dimensions. Another prominent well-being
                                                                              tool is the Global Peace Index (GPI) [9], which specifically captures peacefulness
                                                                              in all countries around the world.
                                                                                Well-being indexes, such as the GPI, are traditionally captured by institutional
                                                                              surveys and governmental data, which are usually expensive and time-consuming.
                                                                              Additionally, these indexes are generally determined with a lag, and final estimates
Vasiliki Voukelatou et al.                                                                                  Page 2 of 31

                 are produced only after a series of revisions, usually a few months later. The revolu-
                 tion of digital data and artificial intelligence may help overcome the aforementioned
                 difficulties providing cost-efficient, time-efficient, and almost real-time estimates of
                 well-being. This was also highlighted by the United Nations, in 2014, that recog-
                 nized the importance of harnessing the data revolution to put the best available
                 tools and methods to work in achieving the SDGs [10].
                   Therefore, the objective of this study is to measure well-being in terms of peace-
                 fulness through the estimation of GPI [9] at a higher time frequency, as compared
                 to the official annual GPI score. To tackle this task, we exploit machine learning
                 and information extracted from a digital data source called Global Data on Events,
                 Location, and Tone (GDELT) [11]. In particular, we use news media attention from
                 GDELT as a proxy for estimating GPI, to complement the knowledge obtained
                 from the traditional data sources and overcome their limitations. Considering that
                 GDELT is free access database updated daily, it can contribute to the estimation
                 of GPI at a higher frequency as compared to the official GPI, which is updated
                 at a yearly level. Besides, GPI though GDELT is produced at a low cost and in a
                 time-efficient way, as compared to the traditional methodology. In this study, we
                 expand the approach introduced in [12].
                   Our results demonstrate that GDELT variables are a good proxy for measuring
                 GPI at a monthly level and that news media attention from GDELT can capture
                 GPI from 1-month-ahead up to 6-months-ahead. There are countries for which the
                 model’s performance is high, such as the United Kingdom, and others for which
                 the model’s performance is low, such as Estonia. The reasons for the low model’s
                 performance could be the limited GDELT news coverage for some countries. In
                 addition, we use explainable AI techniques [13] to identify the variables that most
                 affect peacefulness. Through these variables analysis we highlight each country’s
                 profile. For example, the most important variables for the United States indicate a
                 powerful country in military, socio-economic, and political terms. In contrast, the
                 most important variables for Iceland denote a peaceful country. We also identify
                 the events that drive the errors in the predictions, which is crucial since GDELT
                 events might reveal signals that the official GPI values could neglect.
                   Frequent estimation updates of the GPI score through the GDELT database could
                 be beneficial for researchers, policy-makers, and peacekeeping organizations, such
                 as the United Nations and its agencies UNESCO and UNICEF. In particular, al-
                 most real-time GPI estimations can reveal considerable month-to-month peaceful-
                 ness fluctuations, and significant events that would be otherwise neglected. As a
                 consequence, peace-makers could be additionally empowered to timely react on ap-
                 plying adequate policies, preventing detrimental societal effects, and contributing
                 effectively to social well-being and progress.
                   The remainder of the paper is structured as follows. Section 2 presents an overview
                 of the literature in peacefulness indicators and research conducted with the use of
                 the GDELT data. Section 3 describes the datasets used for the study, the prediction
                 models, the estimation framework, and the SHAP methodology. Section 4 presents
                 and analyzes the results. Finally, Section 5 discusses the conclusions derived from
                 the research, limitations, and future work.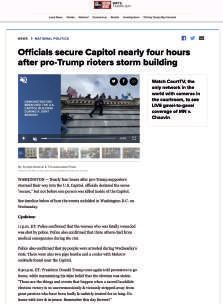
Vasiliki Voukelatou et al.                                                                                 Page 3 of 31

                 2 Related Works
                 Peacefulness is traditionally captured with official data, such as surveys and socioe-
                 conomic data [14, 15, 16]. In assessing peacefulness, the GPI explores the ongoing
                 domestic and international conflicts, and militarisation, at a country and yearly
                 level. It also seeks to determine a nation’s level of harmony or disagreement, through
                 indicators that evaluate safety and security in society (see A.1 Indicators of GPI
                 or [17] for a detailed list of the GPI indicators). For example, low level of vio-
                 lent crime, low number of homicides, low presence of police forces, and harmonious
                 relations with neighboring countries can be suggestive of peacefulness [18].
                   With the growth of technology, researchers are inclined to use new data sources
                 to measure the aforementioned GPI indicators, as an alternative or complement to
                 traditional data. To begin with, social media, such as Twitter, have been primarily
                 used to assess public safety, external conflicts, foreign policy, and migration phe-
                 nomena, as they render individuals’ online activities accessible for analysis. Given
                 this enormous potential, researchers use social media data to predict crime rates or
                 detect the fear of crime [19, 20, 21, 22] and to track civil unrest and violent crimes
                 [23, 24, 25, 26, 27]. Similarly, Twitter data are used to study early detection of the
                 global terrorist activity [28], military conflicts in Gaza Strip [29, 30], and foreign
                 policy discussions between Israel and Iran [31]. In addition, social media data are
                 useful in estimating turning points in migration trends [32] and stocks of migrants
                 [33, 34]. Finally, researchers have created a French corpus of tweets annotated for
                 event detection, such as conflict, war and peace, crime, and justice [35].
                   Besides social media data, many researchers use mobility data, such as mobile
                 phone records and GPS traces [36, 37, 38, 39, 40], in combination with traditional
                 data, to predict and prevent crime [41, 42, 43, 44, 45], compare how the different
                 factors correlate with crime in various cities [46], and estimate deprivation and well-
                 being [47, 48, 49, 50]. In addition, researchers combine social media data with phone
                 records to infer migration events and population [51, 52, 53, 54, 40] and use GPS
                 data, combined with subjective and objective data, to study perceived safety [55].
                   Additionally, the volume and momentum of web search queries, such as Google
                 Trends, provide useful indicators of periods of civil unrest over several countries
                 [56, 57], and contribute in capturing a decline in domestic violence calls per capita
                 when immigration enforcement awareness increases [58].
                   Moreover, crowdsourced data are used to map violence against women [59], for
                 police-involved killings [60], and for analyzing the international crisis between India
                 and Pakistan for the dispute over Kashmir [61]. Crowdsourced data are also used
                 for creating an efficient model in preventing crime events and emergency situations
                 [62], as well as to capture the fear of crime [63].
                   Recently, researchers have started exploring remote sensing data, such as satellite
                 images, to map refugee settlements [64, 65], to study conflicts, in particular in
                 zones where field observations are sparse or non-existent [65], ethnic violence [66],
                 and humanitarian crises [67].
                   Finally, researchers combine conflict-related news databases such as ACLED [68]
                 with other traditional data to capture peace indicators and measure conflict
                 risks [69, 70], or demonstrate the relatively short-term decline in conflict events
                 during the COVID-19 pandemic [71], or such as Arabia Inform [72] to extract vari-
                 ables for generating military event forecasts [73].
Vasiliki Voukelatou et al. Page 4 of 31
GDELT is another major news data source, yet barely explored. It describes the
worldwide socioeconomic and political situation through the eyes of the news media,
making it an ideal data source for measuring well-being indexes and indicators
related to peacefulness.
GDELT is mostly used to explore social unrest, protests, civil wars and coups,
crime, migration, and refugee patterns. Many researchers try to explain and predict
social unrest events in several geographic areas around the world, such as in Egypt
[74], in Southeast Asia [75], in the United States [76], in Saudi Arabia [77], or rec-
ognize social unrest patterns in the countries of India, Pakistan, and Bangladesh
[78], or reveal the causes or evolution of future social unrest events in Thailand [79].
GDELT is a valuable source of data for the detection of protest events [80] and
violence related social issues [81], as well as for detecting and forecasting domes-
tic political crises [82]. GDELT is also used for the exploration of severe internal
and external conflicts, such as the Sri Lankan civil war, the 2006 Fijian coup [83],
the Afganistan violence events [84], and helps understand the direct cooperative
and conflictual interactions between the dyads of China-Russia, Russia-USA and
USA-China since the end of the Cold War [85]. Last, news data from GDELT are
combined with other data sources, such as socioeconomic indicators [86], refugee
data [87] and housing market data [88], Google Trends and official migration data
[89], to analyze and produce short and medium-term forecasts of migration patterns.
The main contribution of our study is the use of GDELT to capture the monthly
peacefulness as a whole, through the estimation of the GPI. The wide variety of
GDELT event categories can cover most GPI indicators, and the daily updates of
its data allow the GPI estimation at a higher frequency.
3 Methodology
In this Section, we describe the data used in our study, highlighting their character-
istics and explaining how they are used in our analysis. Additionally, we describe the
five models we use to produce the GPI estimates: Elastic Net, Decision Tree, Ran-
dom Forest, Extreme Gradient Boosting, Support Vector Regression (SVR), and the
process of their rolling training. We provide the data and the code of our study for
reproducibility in https://github.com/VickyVouk/GDELT_GPI_SHAP_project.
3.1 GPI data
GPI [9] measures the relative position of nations’ and regions’ peacefulness. The
index ranks 163 independent states and territories according to their level of peace-
fulness, and it is created by the Institute for Economics & Peace (IEP). GPI score
data are available from 2008 until 2020 at a yearly level (see, e.g., GPI report 2020
[17]). The score for each country is continuous, normalized on a scale of 1 to 5,
where the higher the score, the less peaceful a country is. For example, in 2019,
Iceland has been the most peaceful country with GPI 1.072, whereas Somalia has
been the least peaceful country with GPI 3.574. The index is constructed from 23
indicators related to Ongoing Domestic and International Conflict, Societal Safety
and Security, and Militarisation domains (see A.1 Indicators of GPI or [17] for
a detailed list of the indicators). These indicators are weighted and combined into
one overall score. For GPI construction, data are derived from official sources, such
as governmental data, institutional surveys, and military data.Vasiliki Voukelatou et al. Page 5 of 31
For the purposes of this study, the frequency of the GPI increases from yearly to
monthly data. In particular, the GPI data are upsampled linearly. Every yearly GPI
value is assigned to March of the corresponding year. The upsampling is definitively
an assumption, since the monthly data generated do not correspond to the real
monthly GPI. However, considering that monthly data are not available, linear
upsampling is the simplest assumption. After upsampling, from 13 yearly values
(2008 - 2020), we obtain 145 monthly values in total (March 2008 - March 2020).
3.2 GDELT data
GDELT [11] is a publicly available digital news database related to socio-political
events, and it is supported by Google. In particular, it is a collection of international
English-language news sources, such as Associated Press, The New York Times, etc.
GDELT data are based on news reports coded with the Tabari system [90], which
extracts the events from the media and assigns the corresponding code to each event.
Events are coded based on an expanded version of the dyadic CAMEO format, a
conflict, and mediation event taxonomy [91]. GDELT compiles a list of 200 cate-
gories of events, from riots and protests to peace appeals and diplomatic exchanges,
from public statements and consulting to fights and mass violence. Examples of
identified events are “Express intent to cooperate”, “Conduct strike or boycott”,
“Use conventional military force”, and “Reduce or break diplomatic relations” (see
A.2 Topics of GDELT or [91] for a detailed list of the topics covered in GDELT).
The database offers various information for each event, such as the date, location,
and the URL of the news article the event is found in. We use GDELT 1.0 database,
which is updated on a daily basis. Therefore data are available at a daily, monthly,
and yearly frequency. Historical data are also available since 1979 [92].
In Figure 1 we present an example of the number of events related to engagement
in political dissent, such as civilian demonstrations, derived from the GDELT news
on the United States, from the middle of December 2020 to the middle of January
2021. We also present three examples of news articles published on the 6th and 7th
of January. The plot depicts a noticeable rise in these events on the 6th of January
2021, the day of the “Storming of the United States Capitol”, and a peak of news
related to the topic on the 7th of January 2021, demonstrating that GDELT news
can depict the worldwide sociopolitical and conflictual reality.
For the prediction of GPI, we derive several variables from GDELT. These vari-
ables correspond to the total number of events (No. events) of each GDELT category
at country and monthly level. On average, the total number of variables per country
is 87, varying from 25 to 141. This indicates that some event categories may not
be present in the news of a country. We use the BigQuery [93] data manipulation
language (DML) in the Google Cloud Platform to extract the GDELT variables
(see Listing 1).
Listing 1 Query for the extraction of GDELT variables.
SELECT ActionGeo_CountryCode , MonthYear , EventBaseCode ,
COUNT ( EventBaseCode ) AS No_events ,
FROM ‘ gdelt - bq . full . events ’
WHERE ( MonthYear >200802) AND ( MonthYear ‘ null ’)
GROUP BY ActionGeo_CountryCode , MonthYear , EventBaseCode
ORDER BY ActionGeo_CountryCode , MonthYear , EventBaseCodeVasiliki Voukelatou et al. Page 6 of 31
Number of political dissent events in the United States
300
200
100
0
15
17 Dec
1920
Dec
2120
Dec
2320
Dec
2520
Dec
2720
Dec
2920
Dec
3120
01
Dec
Jan
20
0321
Jan
0521
Jan
0721
Jan
0921
Jan
1121
Jan
13
1521
Jan
Jan 21
21
Figure 1 Number of political dissent events in the United States. Daily number of political
dissent events (blue curve) derived from the GDELT news in the United States, from the middle
of December 2020 to the middle of January 2021, and three examples of news articles published
on the 6th and 7th of January. GDELT depicts a noticeable rise of the events related to political
dissent on the 6th of January 2021, the day of the “Storming of the United States Capitol”, and a
peak of news related to the topic on the 7th of January 2021 (vertical dashed red line).
Table 1 shows some random examples of the United States variables in Febru-
ary and March 2018. For example, in February 2018, the No. events for the event
category “Investigate crime” is 680, and in March 2018 is 799. In February 2018,
the No. events for the event category “Conduct suicide, car, or other non-military
bombing” is 523, and in March 2018 is 1099. The latter variable’s value has in-
creased a lot from February to March 2018. This is explained by the “Austin serial
bombings” which occurred between March 2 and March 22, 2018, mostly in Austin,
Texas, where in total, five package bombs exploded.
3.3 Prediction models
Models handling time series are used to predict future values of indices by extract-
ing relevant information from historical data. Traditional time series models are
based on various mathematical approaches, such as autoregression. Autoregressive
models specify that the output variable depends linearly on its previous values and
a stochastic term. Considering that our data are upsampled linearly, it is not feasi-
ble to apply autoregressive models, because of the linear relationship between the
dependent variable (GPI) and its past values. Besides, our objective is not only to
measure GPI, but also to understand and explain how different peacefulness topics
captured by GDELT, such as militarisation, contribute to the GPI measurement.Vasiliki Voukelatou et al. Page 7 of 31
Table 1 Examples of the United States variables in February and March 2018. The event code and
category that describe the event are reported. The No. events that occurred are also presented.
Event Code Event Category No.events Date
.. .. .. ..
. . . .
022 Appeal for diplomatic cooperation 2168 2018/02
091 Investigate crime 680 2018/02
122 Reject, request or demand for material aid 501 2018/02
183 Conduct suicide, car, or other non-military bombing 523 2018/02
.. .. .. ..
. . . .
022 Appeal for diplomatic cooperation 2561 2018/03
091 Investigate crime 799 2018/03
122 Reject, request or demand for material aid 534 2018/03
183 Conduct suicide, car, or other non-military bombing 1099 2018/03
.. .. .. ..
. . . .
We use Elastic Net, Decision Tree, Random Forest, Extreme Gradient Boosting,
and Support Vector Regression models, to describe the relationship between the
GPI score and the GDELT variables at a country level. Specifically, the aim is to
develop GPI estimates at least one month in advance of the latest ground-truth
GPI value.
Elastic Net
Elastic Net is a regularized and variable selection regression method. One of the
essential advantages of Elastic Net is that it combines penalization techniques from
the Lasso and Ridge regression methods into a single algorithm [94]. Lasso regression
penalizes the sum of absolute values of the coefficients (L1 penalty), Ridge regression
penalizes the sum of squared coefficients (L2 penalty), while Elastic Net imposes
both L1 and L2 penalties. This means that Elastic Net can completely remove weak
variables, as Lasso does, or reduce them by bringing them closer to zero, as Ridge
does. Therefore, it does not lose valuable information, but still imposes penalties to
lessen the impact of certain variables.
Decision Tree
Decision trees are used to visually and explicitly represent decisions, in the form
of a tree structure. A Decision Tree is called regression tree when the dependent
variable takes continuous values [94]. The goal of using a Regression Decision Tree
is to create a training model that can predict the value of the dependent variable
by learning simple decision rules inferred from the training data. In particular,
Decision Tree divides the dataset into smaller data groups, while simultaneously,
an associated decision tree is incrementally developed. The final tree consists of
decision nodes and leaf nodes. A decision node has two or more branches, each
representing values for the variable tested. A leaf node represents a decision on the
value of the dependent variable. The topmost decision node, called the root node,
corresponds to the most important variable.
Random Forest
Random Forest limits the risk of a Decision Tree to overfit the training data [94]. As
the names “Tree” and “Forest” imply, a Random Forest Regression is essentiallyVasiliki Voukelatou et al. Page 8 of 31
a collection of individual Regression Decision Trees that operate as a whole. A
Decision Tree is built on the entire dataset, using all the variables of interest. On
the contrary, Random Forest builds multiple Decision Trees from randomly selecting
observations and specific variables and then combines the predictions into a single
model. Individually, predictions made by Decision Trees may not be accurate, but
combined, are, on average, closer to the true value.
Extreme Gradient Boosting (XGBoost)
XGBoost [95] is a scalable machine learning regression system for tree boosting. It
uses a gradient descent algorithm and incorporates a regularized model to prevent
overfitting. Comparing to Random Forest that builds each tree independently and
combines results at the end of the process, XGBoost builds one tree at a time and
combines results along the way. In particular, XGBoost corrects the previous mis-
takes made by the model, learns from it and its next step enhances the performance
until there is no scope of further improvements. Its main advantage is that it is fast
to execute and gives high accuracy.
Support Vector Regression (SVR)
SVR [96] is a regression learning approach which, comparing to other regression
algorithms that try to minimize the error between the real and predicted value,
uses a symmetrical loss function that equally penalizes high and low misestimates.
In particular, it forms a tube symmetrically around the estimated function (hy-
perplane), such that the absolute values of errors less than a certain threshold are
penalised both above and below the estimate, but those within the threshold do not
receive any penalty. The most commonly used kernels, for finding the hyperplane,
is the Radial Basis Function (RBF) kernel, that we also use for our analysis. One of
the main advantages of SVR is that its computational complexity does not depend
on the dimensionality of the input space. Moreover, it has excellent generalization
capability, and provides high prediction accuracy.
3.4 Estimation framework
Traditionally, before modeling, researchers start by dividing the data into training
data and test data. Training data are used to estimate and generate the models’
parameters, and the test data are used to calculate the accuracy of the models.
Because the test data are not taken into account to fit the model, they should be a
reliable indicator of the models’ predictive power on new data [97, 98].
Considering that the socio-economic and political situation around the world is
not stationary and more recent events are relevant for the prediction, we train our
models using the rolling methodology [99], widely used in business and finance [100].
The rolling methodology updates the training set by an add/drop process, while
keeping it stable, and retrains the model before each k-months-ahead predictions.
The rolling training’s set period of time for all models is half of our data, i.e.,
72 months. First, we train the model to predict 6-months-ahead GPI values. After
the first training, one month is dropped from the beginning of the training set
and another month is added to the end of the training set. Then, we perform
the training again to predict the next 6-months-ahead GPI values. We continue thisVasiliki Voukelatou et al. Page 9 of 31
rolling training’s first in/first out process for all subsequent months, until we predict
the last monthly value. This process ensures that the training set always covers the
same amount of time and it is always updated with the most recent information.
In particular, we use the data from March 2008 to February 2014 (72 values) to
train the model and predict the GPI values of March 2014 up to August 2014, the
data from April 2008 to March 2014 (72 values) to train the model and predict
the GPI values of April 2014 up to September 2014, and so on. We repeat this
procedure until the last training, which includes data from March 2014 to February
2020 (72 values), to make only 1-month-ahead prediction of the GPI, corresponding
to March 2020, the last value of the time series.
At every step, we obtain up to 6-months-ahead predicted GPI values. Specifically,
by the end of each rolling training described above, we have k-months-ahead GPI
predictions, where k = 1, 2, . . . , 6 months. By the end of all the trainings, we have 72
1-month-ahead GPI predictions[1] , 71 2-months-ahead GPI predictions, and so on.
We evaluate the accuracy of the predictions for each k-months ahead time horizon
with respect to the corresponding test set, that contains the real GPI values.
For each of the models mentioned in Section 3.3, we estimate the best hyperpa-
rameters in each training phase through 10-fold cross-validation. A.3 Hyperpa-
rameters includes all the details for the hyperparameters we tune for each model.
3.5 Model interpretation
Understanding a model’s prediction is important for trust, actionability, account-
ability, debugging, and many other reasons. To understand predictions from tree-
based machine learning models, such as Random Forests or XGBoosts, importance
values are typically attributed to each variable. Yet traditional variable attribution
for trees is inconsistent, meaning it can lower a variable’s assigned importance when
the true impact of that variable actually increases.
Therefore, for the interpretation of the importance of the model variables and for
understanding the drivers of every single GPI estimation we compute the SHAP
(SHapley Additive exPlanation) values, proposed by Lundberg et al. [101, 102].
SHAP is based on game theory [103] and local explanations [104], and it offers a
means to estimate the contribution of each variable. By focusing specifically on tree-
based models, the authors developed an algorithm that computes local explanations
based on exact Shapley values in polynomial time. On the one hand, this provides
local explanations with theoretical guarantees of local accuracy and consistency. On
the other hand, the ability to efficiently compute local explanations using Shapley
values over a dataset enables the development of a range of tools to interpret and
understand the global behavior of a model. Specifically, by combining many local
explanations, a global structure can be represented while retaining local faithfulness
[105] to the original model, which generates detailed and accurate representations
of model behavior.
4 Results
4.1 Model comparison
The five prediction models, Elastic Net, Decision Tree, Random Forest, XGBoost,
and SVR (see Section 3.3), are constructed for every country to produce the GPI
[1]
according to the initial test set’s lengthVasiliki Voukelatou et al. Page 10 of 31
estimates. In these models, each country’s GPI values are the ground-truth data
(dependent variable), and the GDELT variables are the exogenous (independent)
variables. We consider standard performance indicators to evaluate the performance
of the prediction models: the Pearson Correlation coefficient, the Root Mean Square
Error (RMSE), and the Mean Absolute Percentage Error (MAPE) [106, 107, 108, 40]
(see more details in A.4 Performance Indicators).
Pearson Correlation for all countries MAPE for all countries
XGBoost
Random Forest
SVR
Decision Tree
Elastic Net
−0.6 −0.4 −0.2 0.0 0.2 0.4 0.6 0.8 0 1 2 3 4 5 6 7 8
(a) 1-month-ahead (b) 1-month-ahead
XGBoost
Random Forest
SVR
Decision Tree
Elastic Net
−0.6 −0.4 −0.2 0.0 0.2 0.4 0.6 0.8 0 1 2 3 4 5 6 7 8
(c) 3-months-ahead (d) 3-months-ahead
XGBoost
Random Forest
SVR
Decision Tree
Elastic Net
−0.8 −0.6 −0.4 −0.2 0.0 0.2 0.4 0.6 0.8 0 1 2 3 4 5 6 7 8
(e) 6-months-ahead (f) 6-months-ahead
Figure 2 Pearson Correlation and MAPE for all country models. Pearson Correlation and MAPE
between the real and the predicted 1-, 3-, and 6-months-ahead GPI values at a country level, for
all prediction models. The boxplots represent the distribution of the aforementioned performance
indicators for all country models. The plots’ data points correspond to each country model.
Overall, XGBoost models outperform the rest of the four models.
The analysis is conducted for all 163 countries that have a GPI score. As discussed
in Section 3.4, our estimation framework is not limited to the 1-month-ahead pre-
dictions, but it generates GPI estimates up to 6-months-ahead. Figure 2 presents
Pearson correlation and MAPE performance indicators between the real and the 1-,Vasiliki Voukelatou et al. Page 11 of 31
3-, and 6-months-ahead predicted GPI values at a country level for all prediction
models. The boxplots represent the distribution of the aforementioned performance
indicators for all country models. The plots’ data points correspond to each country
model. Figure 17 in A.5 RMSE for all country models presents RMSE per-
formance indicator as well. We observe that XGBoost, Random Forest, and SVR
models show similar performance and outperform Decision Tree and Elastic Net
models. Overall, XGBoost shows the highest performance. This is more evident for
the 6-months-ahead predictions.
For the estimation of the GPI, the models use the historical data of the military,
social, and political situation of the corresponding country. For each additional fu-
ture estimation, we move further away from the last training data, while the coun-
try’s reality change, and we therefore expect a lower model performance. Indeed,
comparing Figures 2 a-b, with Figures 2 c-d, and with Figures 2 e-f, we demonstrate
that the performance of the models decreases for every additional month-ahead pre-
diction. For example, we observe a 13,43% increase of the median MAPE for the
3-months-ahead predictions, and a 25.61% increase of the median MAPE for the
6-months-ahead predictions, as compared to the 1-month-ahead predictions.
Concentrating our analysis on the XGBoost boxplot, it is noticeable that some
models show high performance and others show low performance. For example, the
models for Cameroon, Mali, Turkey, the United Kingdom, and Portugal indicate a
very strong correlation, higher than 0.8, and maintain this behavior even for the
6-months-ahead predictions. However, there are models, such as the models for the
Central African Republic, Estonia, Moldova, Mongolia, and Romania, that indicate
a negative correlation, even for the 1-month-ahead predictions. Notwithstanding
that the reasons for the low model’s performance are rather complicated, we deduce
that GDELT news coverage is not sufficient for some countries.
4.2 Predicting GPI with the XGBoost model
Since our analysis is worldwide, and each country has a different military, socio-
economic, and political history and current situation, it would be interesting to
present the performance indicators of various countries’ models, so that we cover a
variety of country profiles.
We present three of the most powerful countries (United States, United Kingdom,
and Saudi Arabia) since they shape global economic patterns and influence decision-
and policy-making (see, e.g., [109]). Additionally, we use various sources, such as the
official GPI ranking [17], to choose three of the most peaceful countries (Portugal,
Iceland, and New Zealand) and three of the most war-torn countries (DR Congo,
Libya, and Yemen).
Considering that XGBoost provides the best results on average across all coun-
tries, we choose it for the results presentation, as well as for the analysis that
follows. Table 2 reports the performance indicators for the XGBoost models for the
1-month-ahead up to 6-months-ahead GPI estimates for nine countries. Overall,
1-month-ahead GPI estimates are significantly more accurate compared to the rest
future estimates, especially to the 6-months-ahead time horizon. We observe that
there are countries, such as Portugal, for which the model performance remains
stable over all 6 months predictions, and countries, such as Yemen, for which theVasiliki Voukelatou et al. Page 12 of 31
Table 2 Performance indicators with respect to GPI ground-truth of the prediction models, for nine
countries. Overall, 1-month-ahead GPI estimates are significantly more accurate compared to the rest
future estimates, especially to the 6-months-ahead time horizon.
Performance
Countries Prediction framework Mean
indicators
1-month- 2-months- 3-months- 4-months- 5-months- 6-months-
ahead ahead ahead ahead ahead ahead
Pearson 0.876 0.838 0.813 0.782 0.750 0.710 0.795
United States MAPE(%) 1.197 1.367 1.465 1.592 1.700 1.899 1.537
RMSE 0.037 0.040 0.042 0.045 0.048 0.053 0.044
Pearson 0.880 0.849 0.848 0.845 0.853 0.850 0.854
United Kingdom MAPE(%) 0.632 0.742 0.787 0.821 0.826 0.981 0.798
RMSE 0.015 0.017 0.017 0.018 0.018 0.020 0.017
Pearson 0.864 0.848 0.849 0.814 0.772 0.781 0.822
Saudi Arabia MAPE(%) 3.213 3.406 3.733 4.126 4.396 4.590 3.911
RMSE 0.089 0.094 0.101 0.111 0.119 0.123 0.106
Pearson 0.876 0.868 0.868 0.838 0.835 0.820 0.851
Portugal MAPE(%) 3.691 4.241 4.539 5.221 5.067 5.538 4.716
RMSE 0.057 0.065 0.067 0.077 0.075 0.080 0.070
Pearson 0.840 0.833 0.827 0.810 0.770 0.731 0.802
Iceland MAPE(%) 1.867 2.014 2.114 2.256 2.283 2.367 2.150
RMSE 0.025 0.027 0.028 0.030 0.030 0.031 0.028
Pearson 0.780 0.748 0.725 0.692 0.689 0.650 0.714
New Zealand MAPE(%) 1.444 1.538 1.633 1.651 1.741 1.793 1.633
RMSE 0.023 0.024 0.025 0.026 0.026 0.027 0.025
Pearson 0.820 0.815 0.790 0.762 0.740 0.728 0.776
DR Congo MAPE(%) 2.409 2.792 2.856 2.899 2.957 3.120 2.839
RMSE 0.088 0.099 0.103 0.105 0.107 0.113 0.103
Pearson 0.854 0.846 0.777 0.835 0.752 0.709 0.796
Libya MAPE(%) 5.841 6.099 6.765 7.324 7.948 8.603 7.096
RMSE 0.210 0.225 0.258 0.259 0.289 0.314 0.259
Pearson 0.832 0.771 0.746 0.722 0.687 0.662 0.737
Yemen MAPE(%) 5.063 6.033 6.810 7.287 7.801 7.999 6.832
RMSE 0.207 0.243 0.267 0.283 0.300 0.309 0.268
Pearson 0.953 0.945 0.934 0.922 0.908 0.898 0.892
Yemen ∗ MAPE(%) 2.645 2.990 3.440 3.652 3.914 4.171 4.287
RMSE 0.116 0.129 0.144 0.154 0.166 0.176 0.180
* For the training of this model, the most recent 36 monthly values are used, as compared with the
rest of the countries’ models that are trained with the most recent 72 monthly values.
model performance falls for each additional in future prediction. An explanation to
these different model behaviors could be that, for example for Portugal the military,
socio-economic, and political situation remains stable over time, and therefore the
most important variables can contribute to a more accurate prediction even further
in the future. On the contrary, in war-torn countries, such as Yemen, the country
situation changes constantly, and as a consequence, the variables the model uses for
the future predictions are not that much relevant anymore. For this reason, for the
Yemen model we also conduct a training with the 36 most recent monthly values
(Yemen annotated in the Table 2 with an asterisk), as opposed to the 72 values
used for the rest of the countries’ models. The model’s performance improves con-
siderably: the mean Pearson Correlation increases from 0.737 to 0.892, the mean
MAPE drops from 6.832 to 4.287, and the mean RMSE decreases from 0.268 to
0.180. However, we do not observe the same improvement in the models’ perfor-
mance when decreasing the training set for the other war-torn countries, such as
Libya and DR Congo.
4.3 Case studies
We make a selection of four countries to study their level of peacefulness further.
We aim to capture various scenarios on the models’ accuracy and the models’ ex-
planation of the global and local predictive behavior. In particular, we choose Saudi
Arabia and Yemen to understand better and interpret the results and errors of the
predictive models based on historical data. Additionally, we choose the United King-
dom and the United States to estimate their future GPI values to gain some initial
insights into the country’s peace before the official GPI score becomes available.Vasiliki Voukelatou et al. Page 13 of 31
Saudi Arabia
Based on the World Population Review [109], Saudi Arabia is considered one of the
most powerful countries in the world in terms of military alliances, international
alliances, political influence, economic influence, and leadership. Consequently, for
the current research purposes, it is of great interest.
In particular, we focus on the 6-months-ahead predictions performance for the
Saudi Arabia XGBoost model. Figure 3 presents the percentage error of the Saudi
Arabia XGBoost model for the 6-months-ahead GPI estimations. We observe that
the model performance is high, even for the 6-months-ahead GPI predictions. The
percentage error varies, in absolute values, from 4.05% to 11.38%. A positive per-
centage error demonstrates that the estimated GPI is higher than the real GPI,
and therefore the model overshoots. On the contrary, a negative percentage error
illustrates that the estimated GPI is lower than the real GPI, and thus the model
undershoots. We obtain the largest negative percentage error for the GPI estimation
for October 2018.
Saudi Arabia XGBoost model for 6-months-ahead predictions
10 2018 Oct
Error (%)
0
−10
2015 2016 2017 2018 2019 2020
Figure 3 Percentage error for the Saudi Arabia XGBoost model. Percentage error for the Saudi
Arabia XGBoost model for the 6-months-ahead GPI estimations (blue curve). The model
performance is very high, and the percentage error varies, in absolute values, from 4.05% to
11.38%. We obtain the largest negative percentage error for the GPI estimation for October 2018
(vertical dashed red line).
The analysis of the variables importance through the SHAP methodology reveals
the country’s profile, but most importantly, it provides us with deeper insights to
better understand the larger errors of the model. Figure 4 shows the Global vari-
able importance plot that orders the variables based on their importance in the
estimation of the GPI score. Each importance is calculated by combining many lo-
cal explanations, and the model is trained between May 2012 to April 2018. Overall,
we show that the variables demonstrate a profile of a powerful country in military,
socio-economic and political terms. This is evident since the variables are related
to embargo, boycott, or sanctions, diplomatic relations, mediations, economic co-
operations, and appeals for aid, fights with military arms, military engagement,
assaults, and endorsements.
To better explain why the model has the worst performance in October 2018,
we need to deep into the analysis at a local level. Figure 5 displays the individual
SHAP plot for Saudi Arabia’s model. The local interpretability can help us explainVasiliki Voukelatou et al. Page 14 of 31
Global variable importance - Saudi Arabia XGBoost model
Impose embargo, boycott, or sanctions
Reduce or break diplomatic relations
Fight with artillery and tanks
Employ aerial weapons
De-escalate military engagement
Express intent to mediate
Praise or endorse
Appeal for aid
Physically assault
Cooperate economically
0.000 0.002 0.004 0.006 0.008 0.010 0.012
mean(|SHAP value|) (average impact on model output magnitude)
Figure 4 Global variable importance plot for the Saudi Arabia XGBoost model. Global variable
importance plot for the Saudi Arabia XGBoost model. The barplot orders the variables based on
their importance in the estimation of the GPI score. Overall, we show that the variables
demonstrate a profile of a powerful country in military, socio-economic, and political terms.
Figure 5 Individual SHAP Value plot for the Saudi Arabia XGBoost model. Individual SHAP
Value plot for the Saudi Arabia XGBoost model. It presents the model output value, i.e., the
estimation of the GPI for October 2018, and the base value, which is the value that would be
predicted if the variables for the current output were unavailable. The plot also displays the most
important variables that the model uses for the estimation, such as ‘Cooperate economically’ and
‘Appeal for aid’. The red arrows are the variables that push the GPI estimation higher, and the
blue ones push the estimation lower.
the estimation of the GPI for October 2018 through the most important variables
that the model uses for this estimation. The model output value is 2.12, and it
corresponds to the 6-months-ahead prediction. The base value is smaller than the
estimated GPI, and it is the value that would be predicted if the variables for the
current output were unavailable. The red arrows are the variables that push the
GPI estimation higher (to the right), and those blue push the estimation lower (to
the left). Considering that this month the model undershoots (see Figure 3), we
focus on the variables that push the GPI estimation lower.
The most important variables to this particular prediction are ‘Cooperate eco-
nomically’ and ‘Appeal for aid’, although they are 10th and 8th respectively in the
model’s overall ranking of importance (see Figure 4). In October 2018, the journal-Vasiliki Voukelatou et al. Page 15 of 31
ist Jamal Khashoggi was assassinated at the Saudi consulate in Istanbul, Turkey.
This event provoked a series of news on the topics mentioned above in Saudi Ara-
bia. Figure 6 presents Saudi Arabia’s model predictions with respect to the real
GPI score and the variable ‘Cooperate economically’. We notice that this variable
shows an abrupt increase this month and pushes GPI prediction lower, showing a
more peaceful month. Similarly, Figure 7 shows an abrupt increase of the variable
‘Appeal for aid’ in October 2018 and drives the prediction lower, showing a more
peaceful month. Considering that the assassination of the journalist is a negative
event, one would expect a less peaceful month. However, looking at the news, the
articles discuss possible spills into oil markets and economic cooperation between
Saudi Arabia and other countries, such as the United States, in an attempt to over-
come a dispute over Khashoggi. In addition, the news is also concentrated on the
investigation of the Khashoggi case, such as Amnesty International asking for a
United Nations inquiry. Therefore, considering that the variables ‘Cooperate eco-
nomically’, and ‘Appeal for aid’ have a negative relationship with GPI (see Figure
6, and 7 respectively) the model undershoots. Therefore, we observe that through
the eyes of the world news, the presentation of peace is not always at the level we
would intuitively expect.
Saudi Arabia XGBoost model
Assassination of
2.4 Jamal Khashoggi 1,000
2018 Oct
Cooperate economically
800
2.3
GPI score
600
2.2
400
2.1 200
2015 2016 2017 2018 2019 2020
GPI score 6-months-ahead predictions
Figure 6 Saudi Arabia XGBoost model predictions, with respect to the real GPI score, and the
variable ‘Cooperate economically’. Saudi Arabia XGBoost model 6-months-ahead predictions
(orange curve), with respect to the real GPI score (blue curve), and the variable ‘Cooperate
economically’ (green curve). This variable pushes the model to undershoot in October 2018
(vertical dashed black line). The reason for this error is the assassination of Jamal Khashoggi in
this specific month.
Yemen
In the current world, there is no absence of violent conflict and war. Therefore,
peace-builders need to understand the conflict dynamics in war-torn countries to
develop entry points for engagement. Based on the official GPI ranking [9], and the
World Population Review [110], Yemen is one of the most war-torn countries in the
world. Thus it would be interesting to understand in-depth such a country’s profile
model behavior.Vasiliki Voukelatou et al. Page 16 of 31
Saudi Arabia XGBoost model
300
Assassination of
2.4 Jamal Khashoggi
Appeal for aid (No. events)
2018 Oct 250
200
GPI score
2.3
150
2.2 100
50
2.1
2015 2016 2017 2018 2019 2020
GPI score 6-months-ahead predictions
Figure 7 Saudi Arabia XGBoost model predictions, with respect to the real GPI score, and the
variable ‘Appeal for aid’. Saudi Arabia XGBoost model predictions (orange curve), with respect
to the real GPI score (blue curve), and the variable ‘Appeal for aid’ (green curve). This variable
pushes the model to undershoot in October 2018 (vertical dashed black line). The reason for this
error is the assassination of Jamal Khashoggi in this specific month.
For all country models, the training dataset has 72 values (six years). However,
the situation in Yemen constantly changes due to the Civilian War that broke out
in September 2014. The change of peacefulness in the country is depicted in the
official GPI value, which abruptly increases in 2015 (see [9]). Therefore, as explained
in Section 4.2, it makes sense to shorten the training data from the most recent six
years to three years to use more representative data for the prediction. In this
case study, we focus our analysis using data from March 2015 to March 2020 to
understand the model’s behaviour during the Civil War period. Additionally, we
study the 1-month-ahead predictions for the Yemen XGBoost model.
Yemen XGBoost model for 1-month-ahead predictions
10 2018 June
Error (%)
0
−10
2018 2019 2020
Figure 8 Percentage error for the Yemen XGBoost model. Percentage error for the Yemen
XGBoost model for the 1-month-ahead GPI estimations (blue curve). The percentage error varies,
in absolute values, from 0.07% to 3.18%. We obtain the largest negative percentage error for the
GPI estimation in June 2018 (vertical dashed red line).Vasiliki Voukelatou et al. Page 17 of 31
Figure 8 presents the percentage error of Yemen’s model for 1-month-ahead GPI
estimations from March 2018 to March 2020 with a training period of 36 months.
The model has a high performance, with a low percentage error that varies from
0.07% to 3.18% with a median value of 1.66%. As discussed before, a positive
percentage error illustrates that the model overshoots. On the contrary, a negative
percentage error demonstrates that the model undershoots. We obtain the largest
negative percentage error for the GPI estimation in June 2018.
Figure 9 presents the global variable importance plot, which orders the variables
based on their importance in the estimation of the GPI score. Each variable im-
portance is calculated through the SHAP methodology, with a training period from
June 2015 to May 2018. As discussed previously, since each variable importance is
calculated with the combination of many local explanations, the plot can give us
an overview of the situation in Yemen relevant to the GPI estimation and a general
understanding of the model’s behavior. Overall, we see that the most important
variables reveal a war-torn country profile. Particularly, the variables are related
to military aid, territory occupation, bombing, as well as negotiations, discussions,
yields, visits, international involvements, and consults.
Global variable importance - Yemen XGBoost model
Provide military aid
Occupy territory
Express intent to meet or negotiate
Discuss by telephone
Appeal to yield
Host a visit
Consult
Conduct non-military bombing
Allow international involvement
Mediate
0.000 0.002 0.004 0.006 0.008 0.010 0.012
mean(|SHAP value|) (average impact on model output magnitude)
Figure 9 Global variable importance plot for the Yemen XGBoost model. Global variable
importance plot for the Yemen XGBoost model. The barplot orders the variables based on their
importance in the estimation of the GPI score. Overall, we show that the variables mostly
demonstrate a country with a war-torn profile.
Similarly to the Saudi Arabia case study, we need to analyze at a local level to
deeply understand why the model produces the highest percentage error for GPI
estimation in June 2018. Figure 10 presents the Individual SHAP value plot for
Yemen’s model, revealing that the GPI prediction and the variables that drive the
prediction in June 2018. The model output value is 3.23, and it corresponds to the
1-month-ahead prediction. As explained previously, the base value is the GPI value
that would be predicted if the variables for the current output were unavailable.
The red arrow represents the variable that pushes the GPI estimation higher, i.e.,
‘Conduct non-military bombing’. The blue arrow represents the variables that push
the GPI estimation lower, i.e., ‘Discuss by telephone’ and ‘Provide military aid’.Vasiliki Voukelatou et al. Page 18 of 31
Considering that in June 2018, the model undershoots (see Figure 8), we focus our
analysis on the latter variables.
This month the number of events on ‘Discuss by telephone’ is 55 and is higher
than the median value (14) of the previous three years’ training data. Similarly, the
number of events on ‘Provide military aid’ is 121, and it is higher than the median
value (72) of the previous three years’ training data. This specific month the United
Arab Emirates Armed Forces (UAE) announced a pause to the military operations
on 23 June 2018, because of UN-brokered talks. This is depicted in the increase
of the news on ‘Discuss by telephone’ topic. In addition, the United States turned
down UAE request for aid in the offensive against rebel-held Yemeni port, thanks
to the UN efforts. This denial has been discussed a lot on the news, which explains
the increase of the news on the ‘Provide military aid’ topic.
Figure 10 Individual SHAP Value plot for the Yemen XGBoost model. Individual SHAP Value
plot for the Yemen XGBoost model. It presents the model output value, i.e., the estimation of the
GPI for June 2018, and the base value, which is the value that would be predicted if the variables
for the current output were unavailable. The plot also displays the most important variables that
the model uses for the estimation, such as ‘Discuss by telephone’ and ‘Provide military aid’. The
red arrows are the variables that push the GPI estimation higher, and the blue ones push the
estimation lower.
Figure 11 and Figure 12 show that the variables’ higher monthly value and their
mostly negative relationship with the GPI drive the model to undershoot in June
2018. In other words, the model’s behavior reveals that this month the GPI value
should be lower, and consequently, the month results more peaceful. On the one
hand, the model fails to make the correct prediction, since in June 2018, the per-
centage error is the largest. On the other hand, the model might give an interesting
signal; although Yemen is involved in constant conflicts, this month results more
peaceful since the UN-brokered ceasefire agreement managed the withdrawal of the
warring parties from Al Hudaydah in Yemen. We would like to point out that al-
though we notice additional abrupt increases of the two variables’ values, e.g., in
November 2020 (see Figure 11 and Figure 12), the model does not reproduce an
abrupt decrease of the GPI. Consequently, the model demonstrates its power to
learn from its mistakes.
United States
The United States is considered the most powerful country in the world [109].
On that account, it could be very interesting to study this country beyond ourVasiliki Voukelatou et al. Page 19 of 31
Yemen XGBoost model
60
UN-brokered
3.40 ceasefire
agreement
Discuss by telephone
2018 June
3.35 40
GPI score
3.30
20
3.25
0
2018 2019 2020
GPI_score 1-month-ahead predictions
Figure 11 Yemen XGBoost model predictions, with respect to the real GPI score and the
variable ‘Discuss by telephone’. Yemen XGBoost model 1-month-ahead predictions (orange
curve), with respect to the real GPI score (blue curve) and the variable ‘Discuss by telephone’
(green curve). This variable pushes the model to undershoot in June 2018. The reason for this
error is the increase of the news on the topic in this specific month.
Yemen XGBoost model
150
UN-brokered
3.40 ceasefire
agreement
2018 June
Provide military aid
3.35 100
GPI score
3.30
50
3.25
2018 2019 2020
GPI score 1-month-ahead predictions
Figure 12 Yemen XGBoost model predictions, with respect to the real GPI score and the
variable ‘Provide military aid’. Yemen XGBoost 1-month-ahead model predictions (orange curve),
with respect to the real GPI score (blue curve) and the variable ‘Provide military aid’ (green
curve). This variable pushes the model to undershoot in June 2018 (vertical dashed black line).
The reason for this error is the increase of the news on the topic in this specific month.
ground-truth data, i.e., study its peacefulness after March 2020. The United States’s
model demonstrates a high performance (see Table 2), and therefore it could pro-
vide policy-makers and peace-builders with good initial insights into the country’s
peacefulness before the official GPI score becomes available. In particular, in this
case study, we focus our analysis on the murder of George Floyd, which took place
on May 25, 2020, in the United States. Other events followed this extreme event at
the end of May and for the whole of June 2020, such as protests, and it provoked an
amount of news concentrated on the topic. Thus, it would be interesting to studyVasiliki Voukelatou et al. Page 20 of 31
the United States’ level of peacefulness for June and the variables that drive the
predicted GPI value.
To start with, Figure 13 displays the global variable importance plot, which
presents the most important variables for the training period between April 2014
and March 2020. Overall, we obtain variables that indicate a country profile of a
strong player in the military, socio-economic, and political foreground. In particular,
we show that the most important variable is related to aerial weapons, and it mainly
concerns events that take place overseas. Additionally, the rest of the variables are
mostly related to fights with small arms, military de-escalations, embargoes, threats,
protests, cooperations, and relations.
Global variable importance - United States XGBoost model
Employ aerial weapons
Express intent to settle dispute
Express intent to provide diplomatic cooperation
Engage in judicial cooperation
Reject
Threaten to use military force
Reduce relations
Fight with small arms and light weapons
Impose embargo, boycott, or sanctions
De-escalate military engagement
Protest violently, riot
Expel or withdraw
0.0000 0.0025 0.0050 0.0075 0.0100 0.0125 0.0150 0.0175 0.0200
mean(|SHAP value|) (average impact on model output magnitude)
Figure 13 Global variable importance plot for the United States XGBoost model. Global
variable importance plot for the United States XGBoost model. The barplot orders the variables
based on their importance in the estimation of the GPI score. Overall, we show that the variables
indicate a country profile of a strong player in the military, socio-economic, and political
foreground.
Since we are interested in predicting the GPI value in June 2020, as well as under-
standing the most important variables that the model uses for this prediction, we
study the local results presented on the individual SHAP plot displayed in Figure
14. The local interpretability depicted in the figure illustrates that the estimated
GPI is 2.30 that corresponds to the model output value for 3-months-ahead predic-
tion. This value indicates that the GPI value will remain stably high in June 2020
compared with the last ground-truth value on March 2020 (2.31) and the median
GPI value of the previous three years (2.34). The base value is the same as the
model output value, and it is the value that would be predicted if the variables for
the current output were unavailable. The red arrows are the variables that push the
GPI estimation higher (to the right), and those blue push the estimation lower (to
the left). Particularly, the variable ‘Protest violently, riot’ is the variable that pushes
the GPI estimation lower. Indeed, in June 2020, the news was concentrated on a
series of protests, followed by the murder of George Floyd against police brutality
and racism. This variable pushes for a more peaceful month since it has a negative
relationship with the GPI. It seems that protesting in the United States contributesYou can also read