Annual oil palm plantation maps in Malaysia and Indonesia from 2001 to 2016
←
→
Page content transcription
If your browser does not render page correctly, please read the page content below
Earth Syst. Sci. Data, 12, 847–867, 2020
https://doi.org/10.5194/essd-12-847-2020
© Author(s) 2020. This work is distributed under
the Creative Commons Attribution 4.0 License.

               Annual oil palm plantation maps in Malaysia and
                         Indonesia from 2001 to 2016
                      Yidi Xu1 , Le Yu1,2 , Wei Li1 , Philippe Ciais3 , Yuqi Cheng1 , and Peng Gong1,2
         1 Ministryof Education Key Laboratory for Earth System Modeling, Department of Earth System Science,
                                        Tsinghua University, Beijing, 100084, China
                              2 Joint Center for Global Change Studies, Beijing 100875, China
              3 Laboratoire des Sciences du Climat et de l’Environnement, LSCE/IPSL, CEA-CNRS-UVSQ,

                                    Universite Paris-Saclay, Gif-sur-Yvette 91191, France
                                     Correspondence: Le Yu (leyu@tsinghua.edu.cn)

                                  Received: 7 August 2019 – Discussion started: 7 October 2019
                           Revised: 6 March 2020 – Accepted: 9 March 2020 – Published: 16 April 2020

      Abstract. Increasing global demand of vegetable oils and biofuels results in significant oil palm expansion in
      southeastern Asia, predominately in Malaysia and Indonesia. The land conversion to oil palm plantations has
      posed risks to deforestation (50 % of the oil palm was taken from forest during 1990–2005; Koh and Wilcove,
      2008), loss of biodiversity and greenhouse gas emission over the past decades. Quantifying the consequences of
      oil palm expansion requires fine-scale and frequently updated datasets of land cover dynamics. Previous studies
      focused on total changes for a multi-year interval without identifying the exact time of conversion, causing
      uncertainty in the timing of carbon emission estimates from land cover change. Using Advanced Land Observing
      Satellite (ALOS) Phased Array type L-band Synthetic Aperture Radar (PALSAR), ALOS-2 PALSAR-2 and
      Moderate Resolution Imaging Spectroradiometer (MODIS) datasets, we produced an annual oil palm area dataset
      (AOPD) at 100 m resolution in Malaysia and Indonesia from 2001 to 2016. We first mapped the oil palm extent
      using PALSAR and PALSAR-2 data for 2007–2010 and 2015–2016 and then applied a disturbance and recovery
      algorithm (Breaks For Additive Season and Trend – BFAST) to detect land cover change time points using
      MODIS data during the years without PALSAR data (2011–2014 and 2001–2006). The new oil palm land cover
      maps are assessed to have an accuracy of 86.61 % in the mapping step (2007–2010 and 2015–2016). During the
      intervening years when MODIS data are used, 75.74 % of the detected change time matched the timing of actual
      conversion using Google Earth and Landsat images. The AOPD revealed spatiotemporal oil palm dynamics every
      year and shows that plantations expanded from 2.59 to 6.39 × 10⁶ ha and from 3.00 to 12.66×10⁶ ha in Malaysia
      and Indonesia, respectively (i.e. a net increase of 146.60 % and 322.46 %) between 2001 and 2016. The higher
      trends from our dataset are consistent with those from the national inventories, with limited annual average
      difference in Malaysia (0.2×10⁶ ha) and Indonesia (−0.17×10⁶ ha). We highlight the capability of combining
      multiple-resolution radar and optical satellite datasets in annual plantation mapping to a large extent by using
      image classification and statistical boundary-based change detection to achieve long time series. The consistent
      characterization of oil palm dynamics can be further used in downstream applications. The annual oil palm
      plantation maps from 2001 to 2016 at 100 m resolution are published in the Tagged Image File Format with
      georeferencing information (GeoTIFF) at https://doi.org/10.5281/zenodo.3467071 (Xu et al., 2019).

Published by Copernicus Publications.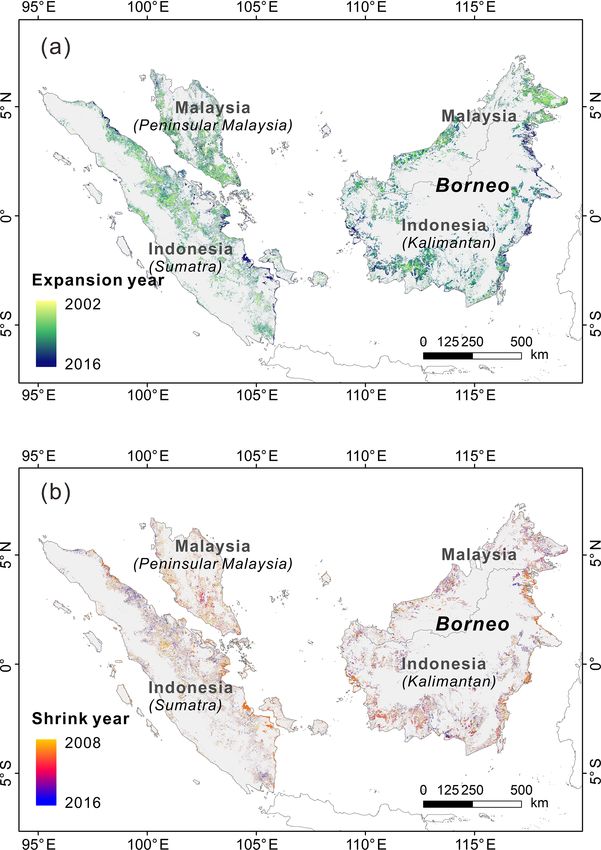
848                                                                               Y. Xu et al.: Annual oil palm plantation maps

1   Introduction                                                   satellite earth observations (Lee et al., 2016; Srestasathiern
                                                                   and Rakwatin, 2014) to microwave datasets such as the
The global demand for vegetable oil and its derivative prod-       Phased Array type L-band Synthetic Aperture Radar (PAL-
ucts calls for an increase in palm oil production, leading to      SAR; Cheng et al., 2018; Dong et al., 2015), (2) spatiotem-
oil palm expansion and intensification in southeastern Asia        poral resolutions from the regional to national scale (Miet-
(Sayer et al., 2012). According to the Food and Agricul-           tinen et al., 2017) and from single to multi-decadal map-
ture Organization (FAO), Malaysia and Indonesia account for        ping (Gaveau et al., 2016; Miettinen et al., 2016), (3) inter-
81.90 % of the global oil palm fruit production in 2017, an in-    pretation methods from manual to semi-automatic and fully
crease of 179.72 % from 2000 to 2017 (see http://faostat.fao.      automatic identification (Baklanov et al., 2018; Cheng et
org, last access: 20 December 2019) that is projected to con-      al., 2019; W. Li et al., 2017; Mubin et al., 2019; Ordway
tinue in the future (Murphy, 2014). The boom of oil palm in-       et al., 2019), and (4) products going from oil palm land
dustries caused and also raised the deforestation risks (Austin    cover maps to more detailed datasets on plantation struc-
et al., 2018; Vijay et al., 2018). In Malaysia and Indonesia,      ture, e.g. tree counting (Li et al., 2019; Cheang et al., 2017)
more than 50 % of the oil palm plantations were converted          age, yield estimation (Balasundram et al., 2013; Tan et al.,
from forest during 1990–2005 (Koh and Wilcove, 2008),              2013), etc. A few studies also focused on the continuous oil
and industrial plantations dominated by oil palm (72.5 % of        palm change detection (Carlson et al., 2013; Gaveau et al.,
all plantations) caused a ∼ 60 % decrease in peatland forest       2016; Vijay et al., 2018). These studies adopted visual or
from 2007 to 2015 (Miettinen et al., 2016). A series of con-       semi-automatic interpretation for oil palm plantations, which
sequences includes but is not limited to biodiversity decline      is labour-intensive and not appropriate for long-term annual
(Fitzherbert et al., 2008), peatland loss (Koh et al., 2011) and   oil palm plantation monitoring. Automatic identification can
carbon emission (Guillaume et al., 2018).                          overcome this difficulty by using classification algorithms
   Quantifying the spatiotemporal details of oil palm expan-       based on Landsat and PALSAR and PALSAR-2 data, which
sion is important for understanding the deforestation pro-         were successfully applied to produce the 2015 land cover
cess and its impacts on ecosystem services and promotes            map of insular southeastern Asia with discrimination of oil
progress in environmental governance and policy decisions          palm plantations (Miettinen et al., 2017). So far, however,
(Gibbs et al., 2010; Koh and Wilcove, 2008). However, an-          the annual dynamics of oil palm plantations (expansion and
nual information on the expansion of oil palm plantations is       shrinkage) remains unquantified for Malaysia and Indonesia.
poorly documented in Malaysia and Indonesia. The statisti-            The annual oil palm mapping in tropical areas such as
cal records (e.g. FAO, United States Department of Agricul-        insular southeastern Asia is a challenge due to the persis-
ture – USDA) give neither the detailed spatial distribution nor    tent cloudy conditions (Gong et al., 2013; Yu et al., 2013).
the young oil palm trees and smallholder plantations. Many         Multi-temporal optical images can help reduce cloud effects
efforts have been made to characterize the oil palm extent         (Yu et al., 2013), but it is still difficult to obtain effective
(Cheng et al., 2018; Gaveau et al., 2016; Miettinen et al.,        optical observations in Malaysia and Indonesia (51.88 % of
2017). For example, the Roundtable on Sustainable Palm Oil         the region is without annual Landsat images; Fig. S1 in the
(RSPO), whose members manage one-third of the world’s              Supplement). Microwave remote sensing is not affected by
oil palm, provided spatial information on oil palm distribu-       clouds and is considered to be the most efficient source in
tion in Malaysia and Indonesia (Gunarso et al., 2013). The         separating forested vegetation and oil palms (Ibharim et al.,
continuous mapping of oil palm on peatland in 1990, 2000,          2015; Teng et al., 2015). The long time span of 25 m reso-
2007 and 2010 described the dynamic change of oil palm on          lution PALSAR and PALSAR-2 data provides opportunities
peat during the past 30 years (Miettinen et al., 2012). But        for mapping oil palm at high spatiotemporal resolutions. Re-
these maps are given for a certain year or several time phases     cently the PALSAR and PALSAR-2 data have been success-
without capturing the exact time of oil palm changes. Dy-          fully used in characterizing oil palm change for the whole
namic global vegetation models use gross land-use change           country of Malaysia for 6 years using PALSAR (2007–2010)
and thus require high-resolution grid-cell-based annual oil        and PALSAR-2 (2015–2016; Cheng et al., 2019). However,
palm conversion maps rather than country-level inventories         the gap years (2011–2014) between PALSAR and PALSAR-
and bi-decadal land cover maps (Yue et al., 2018a, b). A lack      2 hampered continuous tracking of oil palm plantation dy-
of continuous change information may cause a wrong inter-          namics. One potential way to achieve annual mapping is to
pretation of land cover change time and significant bias in        use optical earth observation data, e.g. Landsat images for the
global carbon dynamic studies (Zhao and Liu, 2014; Zhao et         PALSAR gap period (Chen et al., 2018; Shen et al., 2019).
al., 2009). As a result, oil palm plantation maps at high tem-     However, this requires abundant Landsat images (> 4; Xu et
poral and spatial resolutions in Malaysia and Indonesia are        al., 2018a) that are not available in the humid tropical regions
urgently needed.                                                   and may cause “false changes” and “inter-annual inconsis-
   Remote sensing has been used in oil palm monitoring             tency” (Broich et al., 2011). Recently, a super-resolution
since the 1990s. Progress has been made in oil palm mapping        mapping method (X. Li et al., 2017; Qin et al., 2017; Xu
and change detection, including (1) data sources from optical      et al., 2017) was used to reconstruct missing forest cover

Earth Syst. Sci. Data, 12, 847–867, 2020                                            www.earth-syst-sci-data.net/12/847/2020/
Y. Xu et al.: Annual oil palm plantation maps                                                                                 849

change during 2011–2014 (Zhang et al., 2019) by fusing             Sabah in Malaysia and Kalimantan in Indonesia (Corley and
the PALSAR and PALSAR-2 and the Moderate Resolution                Tinker, 2008). Industrial oil palm plantations spurred the
Imaging Spectroradiometer (MODIS) normalized difference            economic sectors in southeastern Asian countries but also
vegetation index (NDVI) with dense temporal resolution and         raised concerns on the negative social and environmental im-
phenological information. However, it is difficult to separate     pacts (Obidzinski et al., 2012; Sayer et al., 2012). Recently,
oil palm and natural forest with similar NDVI variation us-        oil palm plantation expansion became one of the dominant
ing such classification-based fusion. A new approach based         drivers of deforestation in Malaysia and Indonesia (Austin et
on change detection in a given period using time-series ob-        al., 2018; Gaveau et al., 2016). Thus, we chose as a study area
servations (i.e. MODIS NDVI, GIMMS NDVI) was success-              the whole area of Malaysia and Sumatra and Kalimantan in
fully applied to fill the years with missing data in develop-      Indonesia, which encompass 96 % of the total oil palm pro-
ing a nominal 30 m annual China land-use and land cover            duction in Indonesia (Petrenko et al., 2016). Oil palm plan-
dataset (Xu et al., 2020). This approach takes advantage of        tations in these two countries account for 67.51 % of world’s
dense observations by detecting break points in a time series      total oil palm plantation area (FAOSTAT, 2017), and dra-
using change-detection algorithms, combined with the pre-          matic land cover conversion happened in this region due to
existing knowledge from the mapped years, and thus reduces         human-induced modifications.
the inter-annual inconsistency.
   The objectives of this study are (i) to develop a robust        2.2     Overview of the AOPD production
and consistent approach capable of detecting annual oil palm
changes in southeastern Asia using multiple remote-sensing         The development of AOPD includes two major stages:
datasets based on image classification and break point detec-      (1) oil palm mapping using PALSAR and PALSAR-2 data
tion, (ii) to produce a nominal 100 m annual oil palm area         (Sect. 2.3) and (2) change-detection-based oil palm updat-
dataset (AOPD) in Malaysia and Indonesia from 2001 to              ing using MODIS NDVI during the gap years in operation
2016, and (iii) to quantify the spatial and temporal patterns of   between Advanced Land Observing Satellite (ALOS) and
oil palm change dynamics since 2001. Specifically, we devel-       ALOS-2 (Sect. 2.4). The first stage aimed at producing the
oped the annual oil palm plantation dataset in Malaysia and        oil palm maps for 2007, 2008, 2009 and 2010 using PALSAR
Indonesia by using a two-stage method. The first step is ran-      and 2015 and 2016 using PALSAR-2 datasets. The detailed
dom forest-based image classification using PALSAR dur-            procedures include the pre-processing of the original PAL-
ing 2007–2010 and PALSAR-2 data during 2015–2016 (the              SAR and PALSAR-2 data, training sample collection and im-
periods with PALSAR and PALSAR-2 data available). Com-             age classification, and final production of oil palm maps for
bined with the oil palm maps produced in the first step during     the target years after post-processing using ancillary datasets.
the years with PALSAR coverage, MODIS NDVI was used                In the second stage, we combined oil palm maps produced
in a change-detection algorithm called Breaks For Additive         in the first stage with MODIS NDVI data. Time series of
Seasonal and Trend (BFAST; Verbesselt et al., 2010a) to fill       MODIS NDVI data and change maps were prepared in the
the data-gap years (2011–2014) outside the PALSAR years            data preparation step, followed by the break point test using
and extend the oil palm land cover mapping period back to          the change-detection algorithm, BFAST, to detect the change
2001. Oil palm in this study refers to both young and mature       year (change from other land cover types to oil palm and
oil palm trees from industrial plantations and smallholders        the reverse) in the PALSAR and PALSAR-2 missing-data pe-
with the minimum size of 1 ha (oil palm smallholders are de-       riod. After the post-processing, we derived the oil palm maps
fined as 50 ha or less of cultivated land producing palm oil       in these gap years and traced the oil palm distribution back
controlled by smallholder farmers – the definition used by         to 2001. Combining the results from the two stages, we ob-
the RSPO – with an average of 2 ha; World Bank; 2010).             tained the annual oil palm plantation maps from 2001 to 2016
                                                                   at 100 m spatial resolution, forming the AOPD. The whole
                                                                   workflow is shown in Fig. 1.
2     Datasets and method
                                                                   2.3     Oil palm mapping using PALSAR and PALSAR-2
2.1    Study area
                                                                           data
Insular southeastern Asia was originally occupied by ever-
                                                                   2.3.1    PALSAR and PALSAR-2 product and data
green moist tropical forest, which is one of the most bio-
                                                                            preparation
logically diverse terrestrial ecosystems on Earth. The natu-
ral environment, with humid tropical climates and low-lying        We used multi-source remote-sensing images to fully cover
topography, is suitable for the oil palm (Elaeis guineensis;       the study area; these included images from ALOS PAL-
Fitzherbert et al., 2008). Since 1911, when the first commer-      SAR, ALOS-2 PALSAR-2 and MODIS NDVI. The Landsat
cial oil palm plantation in southeastern Asia was founded          archives were not used because of the low data availability in
in Sumatra, oil palm plantations expanded rapidly in Suma-         this region caused by frequent thick cloud cover (Fig. S1 in
tra and peninsular Malaysia and then spread to Sarawak and         the Supplement).

www.earth-syst-sci-data.net/12/847/2020/                                             Earth Syst. Sci. Data, 12, 847–867, 2020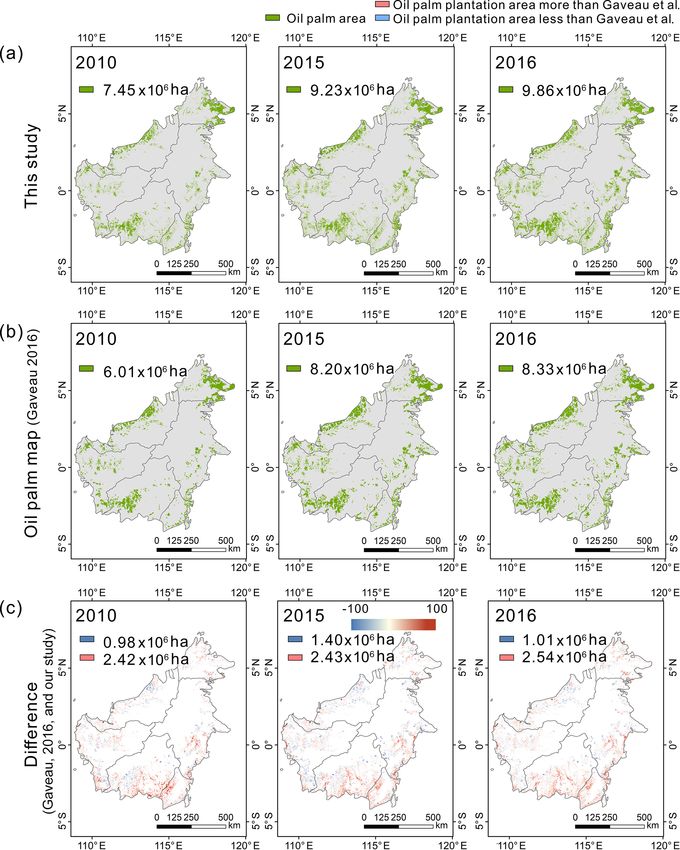
850                                                                               Y. Xu et al.: Annual oil palm plantation maps

Figure 1. Workflow of the annual oil palm mapping procedure. Stage 1 stands for oil palm mapping using PALSAR and PALSAR-2 data,
and Stage 2 stands for change-detection-based oil palm maps updated using MODIS NDVI.

   The Japan Aerospace Exploration Agency (JAXA) pro-              ers, the difference and ratio, were produced by calculating
vided the 25 m resolution global PALSAR and PALSAR-2               the ratio and difference from the HH and HV DN of deci-
mosaic by mosaicking SAR images of the backscattering co-          bels, following
efficient (http://www.eorc.jaxa.jp/ALOS/en/palsar_fnf/data/
index.htm, last access: 20 May 2019). Although the product         Difference = HH − HV,                                       (2)
was compiled at an annual frequency, one product a year is         Ratio = HH / HV.                                            (3)
sufficient to identify the oil palm changes, since oil palm is
a perennial crop without significant phenological variations          Although ALOS PALSAR and ALOS-2 PALSAR-2 have
in the tropics. To cover the whole study area, 15 patches of       different satellite microwave sensor properties (e.g. fre-
5◦ × 5◦ PALSAR and PALSAR-2 grids for 6 years (2007,               quency, off-nadir angle), the backscatter signals are relatively
2008, 2009 and 2010 from PALSAR; 2015 and 2016 from                stable for the given period (2007–2010 and 2015–2016), as
PALSAR-2) were used. Since ALOS stopped working in                 seen by comparing the distribution of backscattering values
2011, no data were available between 2011 and 2014 until the       (HH and HV) of 250 000 randomly generated pixels (us-
operation of ALOS-2. The product contains data of HH (i.e.         ing ArcGIS 10.3) in the study area between different years
horizontal transmit and horizontal receive) and HV (i.e. hor-      (see Fig. S2). The similar findings for the stability of PAL-
izontal transmit and vertical receive) digital numbers (DNs)       SAR and PALSAR-2 data were also given in previous stud-
acquired by PALSAR and PALSAR-2 in Fine Beam Dual                  ies (Cheng et al., 2019; Qin et al., 2017). Meanwhile, the
(FBD) mode with ortho-rectification and topographic cor-           HH and HV values for oil palm and forest are also shown
rection. For PALSAR and PALSAR-2, HH and HV DN val-                in Fig. S3 and indicate the separability between the two land
ues were converted to normalized backscattering coefficients       cover types for both PALSAR and PALSAR-2 data. There-
(unit: decibel – dB) using the following formula (Rosenqvist       fore, the consistency between ALOS PALSAR and ALOS-
et al., 2007):                                                     2 PALSAR-2 allows tracking the oil palm changes in the
σ 0 (dB) = 10 × log10 DN2 + CF,                            (1)     study period. One problem of using PALSAR and PALSAR-
                                                                   2 data, however, is the “salt-and-pepper” noise (Zhang et al.,
where CF is a calibration factor (−83.0 dB) in PALSAR and          2019), which may cause misclassification and false changes
PALSAR-2 data (Shimada et al., 2009). Two additional lay-          in the subsequent process. Previous studies showed that the

Earth Syst. Sci. Data, 12, 847–867, 2020                                            www.earth-syst-sci-data.net/12/847/2020/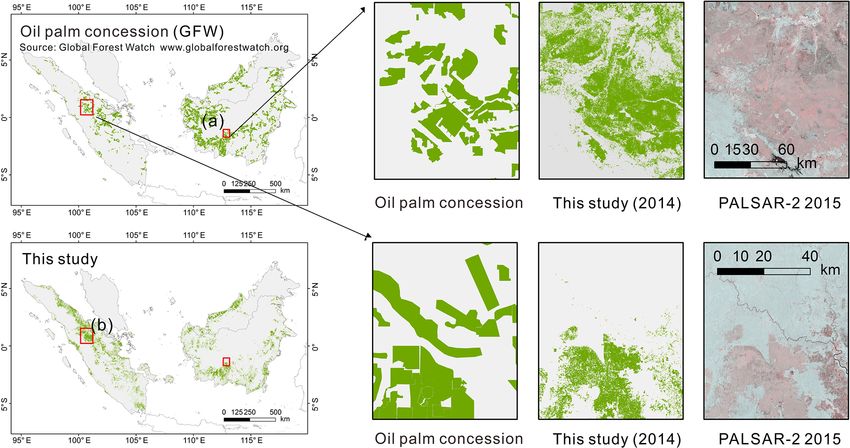
Y. Xu et al.: Annual oil palm plantation maps                                                                                 851

resampling method reached higher accuracy and better vi-          land surface. To obtain a reliable oil palm dataset, we adopted
sual results in oil palm mapping compared to the commonly         several steps, including mode filtering, terrain filtering, and
used filter method (Cheng et al., 2018). The identification       intact forest and mangrove filtering in post-processing to im-
and area estimation of oil palm plantations have also been        prove the final oil palm maps in Stage 1 for 2007, 2008, 2009,
proven to perform better at 100 m resolution (Cheng et al.,       2010, 2015 and 2016.
2018). Therefore, we resampled the original 25 m PALSAR              Mode filtering is used for the very small patches (mainly
and PALSAR-2 images to 100 m resolution for every year to         single pixels) in the initial results, since it is more likely to
reduce salt-and-pepper noise.                                     be errors or noise induced by PALSAR and PALSAR-2 data
                                                                  rather than real oil palm plantations. The topographic fac-
2.3.2   Training sample collection and image classification
                                                                  tors such as slope and elevation will cause the confusion of
                                                                  backscattering signals from satellite sensors, particularly in
In this study, a multi-year training sample set (2007–2010,       area with undulating terrain. Therefore, we applied terrain fil-
2015 and 2016) was used to map the oil palm extent in In-         tering to reduce the confusion by the topographic factor using
donesia and Malaysia from 2007 to 2016. We used the train-        the Shuttle Radar Topography Mission (SRTM) 30 m digi-
ing sample set for Malaysia from our previous study (Cheng        tal elevation model (DEM). The altitude threshold of 1000 m
et al., 2017) and interpreted the training datasets for Indone-   was applied, since the oil palm is mainly distributed in the
sia using the same interpretation method. The sample col-         lowlands (mostly < 300 m), and regions higher than 1000 m
lection was mainly based on the high-resolution (< 1 m) im-       are not suitable for oil palm cultivation (Austin et al., 2015;
ages from Google Earth with the assistance of PALSAR and          Carlson et al., 2013; Corley and Tinker, 2008). Subsequently,
PALSAR-2 images. We first visually interpreted the samples        we used two additional layers, intact forest landscape (IFL)
in 2015 and then manually checked the land cover types be-        in 2016 from (Potapov et al., 2008) and the Global Man-
fore and after 2015 if change happened. Here we used 636          grove Atlas (GMA; available at: http://geodata.grid.unep.ch/
and 748 polygonal regions of interest (ROIs; 4953–5660 and        results.php, last access: 15 March 2020) to filter out non-oil
7804–8147 pixels) for Malaysia and Indonesia as the train-        palm areas and reduce the misclassification. The intact for-
ing inputs instead of point sample-based training, since it       est map denotes natural forest ecosystems, without human-
achieved better results in regular plantations. Four land cover   caused disturbances, where oil palm plantations are not sup-
types in this training sample set were included: oil palm (ma-    posed to be cultivated. The mangrove swamp area is sub-
ture and young oil palm – identified by the canopy shape          sequently flooded by seawater, which is not suitable for oil
using very high resolution images from Google Earth), wa-         palm cultivation due to the significant negative impact on
ter, other vegetation (forest, shrubland and other plantations    the fresh fruit bunches and oil production (Henry and Wan,
such as rubber) and others (impervious, cropland and bare         2012).
land). Mixed land cover types were found in “other vegeta-           Another problem when developing oil palm maps is the
tion” and “others” because it is difficult to further separate    replantation of oil palm trees. Oil palm has a long life cy-
these types within the categories. The detailed distribution of   cle of 25 to 30 years. After that, the trees will be cleared
training data is presented in Table 1. Other vegetation types     and replaced because of a decrease in palm oil yield (Röll
consist of ∼ 52.9 % of the total sample, followed by the oil      et al., 2015). However, from the satellite observations, the
palm samples (26.7 %), while “others” and water types only        land cover type is bare land at the time of oil palm log-
account for ∼ 20.4 % of the total training samples, which is      ging, whereas the land-use property remains unchanged as
consistent with the real land cover distribution.                 oil palm plantations when checked before and after oil palm
   Thereafter, we used a random forest (RF) classifier in the     logging. Given the limitation of satellite observation, we pro-
image classification step. The HH and HV digital number           vided two versions of our oil palm datasets. The first version
of decibels and the derived difference (HH − HV) and ratio        is the oil palm datasets after the post-processing mentioned
(HH / HV) images were all used as inputs to the RF clas-          above. Here replantation is not considered, and this version
sifier to derive the original annual oil palm maps for the 6      includes conversion from other land cover types to oil palm
years. The MODIS NDVI is not used as input to the RF              (oil palm expansion) as well as the opposite (oil palm shrink-
model for classification because of the similarity between        age). In the second version, we assumed that oil palm expan-
tropical forest and oil palm and the low resolution, which        sion is a unidirectional activity due to the growing demand of
may negate the benefits of our classification based on higher-    palm oil. The time-series filtering was conducted by using the
spatial-resolution PALSAR data.                                   2007 oil palm extent to filter all pixels classified as “non-oil
                                                                  palm” in the subsequent years. As a result, this version of the
2.3.3   Post-processing and oil palm map
                                                                  oil palm plantation dataset has shown continuously expand-
                                                                  ing areas from 2007 to 2016. The second version includes
Post-processing after the initial results is necessary because    the impact of oil palm replantation and the thriving oil palm
of the limitation in the training set, unavoidable classifica-    industry in southeastern Asian countries but ignored any pos-
tion errors and the difficulty in describing heterogeneous real

www.earth-syst-sci-data.net/12/847/2020/                                            Earth Syst. Sci. Data, 12, 847–867, 2020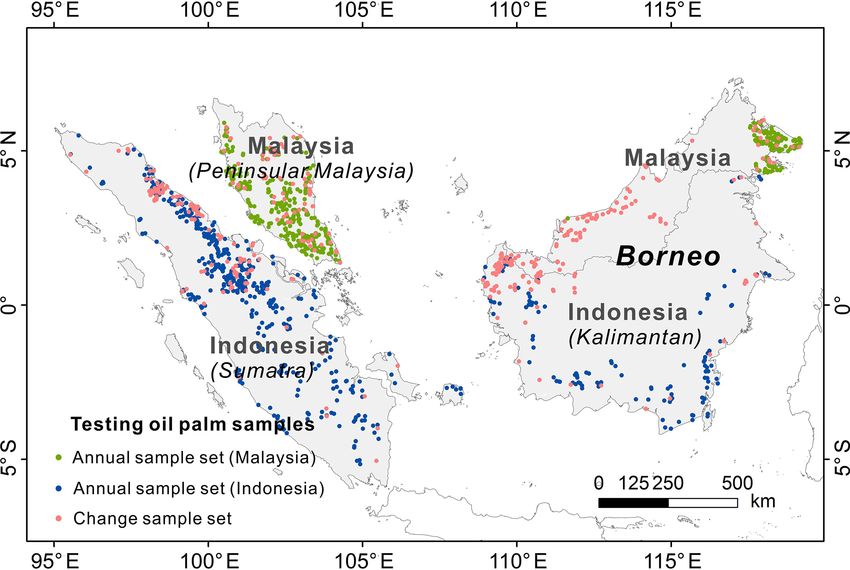
852                                                                                         Y. Xu et al.: Annual oil palm plantation maps

Table 1. The distribution of training data (unit: pixel). Malay.: Malaysia. Indon.: Indonesia.

                              Oil palm        Other vegetation           Water                Others             Total
                          Malay.    Indon.    Malay.     Indon.    Malay.      Indon.     Malay.   Indon.   Malay.   Indon.
                 2007       1228      2368      2970      3351        570           762     185     1323     4953        7804
                 2008       1279      1921      2994      3561        570           818     185     1039     5028        7339
                 2009       1387      2065      3179      3893        570           842     185     1161     5321        7961
                 2010       1405      2005      3228      3824        570           837     185     1076     5388        7742
                 2015       1475      2349      3430      4287        570           656     185     1360     5660        8652
                 2016       1475      2312      3430      4020        570           562     185     1253     5660        8147

sible decrease in oil palm (e.g. abandonment, conversion to                 using temporal NDVI files extracted from each change pixel.
cropland) in some areas.                                                    Frequent changes such as two or three shifts during the gap
                                                                            years were assumed to be of low probability and thus not
2.4     Change-detection-based oil palm updating using                      considered in this study. For the period during 2001–2006
        MODIS NDVI                                                          without PALSAR and PALSAR-2 data and oil palm distribu-
                                                                            tion in 2000, we assumed a unidirectional expansion of oil
2.4.1    MODIS NDVI time series and data preparation                        palm, and the oil palm extent in 2007 was used as the poten-
MODIS NDVI is an important index of vegetation condi-                       tial change regions in the next step. In total, we derived two
tions and has been widely used in vegetation and land cover                 versions of change maps (one with bi-directional change and
change studies (Clark et al., 2010; Ding et al., 2016; Estel                the other with only unidirectional oil palm expansion) for the
et al., 2015). NDVI in the recent updated MODIS vegetation                  two periods.
index data (MOD13Q1) collection 6 from 2000 to 2007 and
from 2010 to 2015 (downloaded from https://lpdaac.usgs.                     2.4.2     Break point test using change-detection algorithm,
gov/, last access: 20 July 2019) was used to fill the gap years                       BFAST
(2000–2006 and 2011–2014) of PALSAR and PALSAR-2
datasets using change-detection algorithms. The MOD13Q1                     Change-detection analysis was conducted in the change pix-
product has a spatial resolution of 250 m and is compos-                    els derived from the last step to identify the exact change
ited every 16 d. In total, six MODIS tiles with 23 scenes per               time within the two periods (2011–2014 and 2001–2006)
year (181 and 138 scenes for the two study periods: 2000–                   based on the time series MODIS NDVI from 2010 to 2015
2007 – P1 – and 2010–2015 – P2) were required to cover                      and 2000 to 2007, respectively. Here we aimed to capture
the study area (h27v08, h27v09, h28v08, h28v09, h29v08                      abrupt NDVI changes (break points) in the two given peri-
and h29v09). All the MODIS images were projected from                       ods, which are assumed to be caused by the conversion of
its original sinusoidal projection to a geographic grid with a              the original land cover type to the oil palm cultivation. Many
WGS 1984 spheroid and resized to 100 m to match the res-                    change-detection algorithms and their derivatives have been
olution of the oil palm maps using the nearest-neighbour re-                developed in recent years to detect subtle or abrupt changes
sampling approach. The pixel quality and reliability layers                 in dense time-series satellite profiles (Broich et al., 2011;
in the MOD13Q1 product were used to further exclude the                     Kennedy et al., 2010; Verbesselt et al., 2010b). Most of these
poor-quality pixels. During the whole study period, 53.64 %                 algorithms were applied in forest change monitoring, and all
of the observations are of high quality, while 46.36 % are in-              reach high consistency in detecting significant change (Co-
terpolated using spline interpolation. For those pixels with                hen et al., 2017). A recent algorithm, the Bayesian estimator
less than 30 high-quality observations (4.79 % in P1 and                    of abrupt change, seasonal change and trend (BEAST), ag-
9.64 % in P2 of the total change area), we did not apply the                gregating the competing models and then the conventional
BFAST algorithm. For the remaining area, 61.67 % (P1) and                   single best model, performed well in capturing multiple and
58.24 % (P2) of pixels had 12 (∼ 50 % in 23) high-quality                   subtle phenological changes (Y. Zhao et al., 2019b). Here we
observations annually.                                                      used BFAST to capture the oil palm conversion time within
   A change map for the microwave data gap period between                   the two study periods (2011–2014 and 2001–2006).
PALSAR and PALSAR-2 (2011–2014) was extracted using                            BFAST has been successfully applied in monitoring forest
the change pixels in 2010 and 2015 oil palm maps with spa-                  disturbance and regrowth and has proved robust with differ-
tial locations and “from–to” types. Here, we assumed that                   ent sensors (DeVries et al., 2015; Verbesselt et al., 2012).
the change from classification was reliable because of the                  Based on the structural change methods, the BFAST algo-
high resolution of PALSAR data. We then sought the exact                    rithm is able to find the structural break point between differ-
change year within the intervals in the next step (Sect. 2.4.2)             ent segments in the observation time series (DeVries et al.,

Earth Syst. Sci. Data, 12, 847–867, 2020                                                      www.earth-syst-sci-data.net/12/847/2020/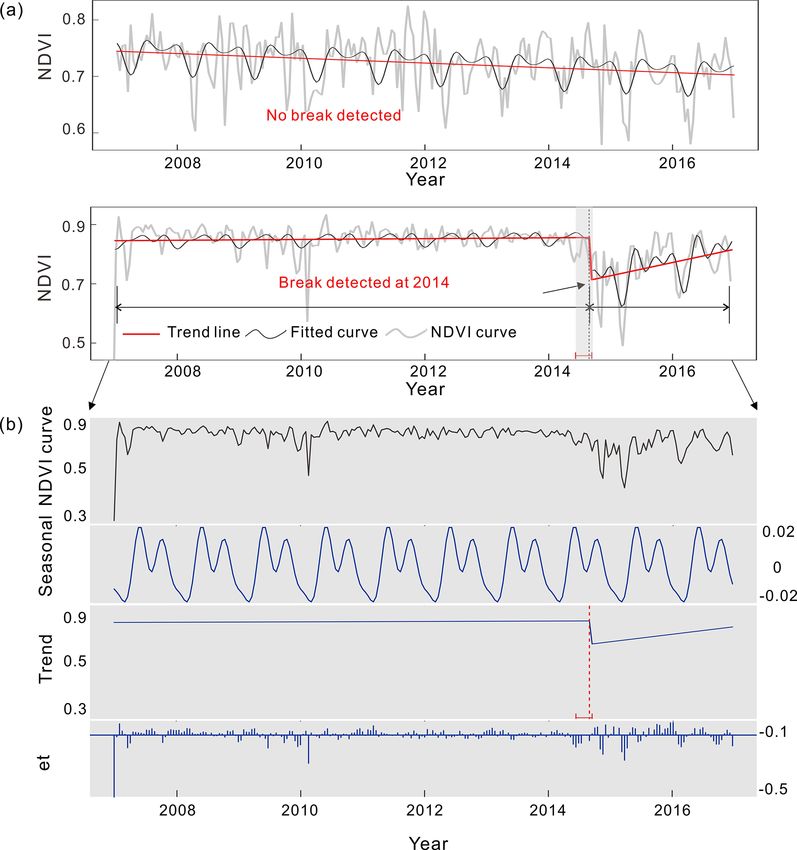
Y. Xu et al.: Annual oil palm plantation maps                                                                                             853

2015) and thus can be used to detect the time and number
of abrupt or gradual changes as well as to characterize the
magnitude and direction. The BFAST method decomposes
the time series into trend, seasonality and residual sections
(Verbesselt et al., 2010b). The model can be expressed as

Yt = Tt + St + et (t = 1, . . ., n) ,                                (4)

where Yt is the observed value at time t, Tt is the trend sec-
tion, St is the seasonal section and et is the noise section.
    An ordinary least-square-residual-based moving-sum test
(OLS-MOSUM; Zeileis, 2005) was used to test whether
break points occurred in the trend or seasonal components.
Then, the test was conducted to determine the number and
optimal position of the breaks using the Bayesian informa-
tion criterion (BIC) and the minimum of the residual sum of
squares. The trend and seasonal coefficients were then com-
puted using robust regression. A harmonic seasonality model
(with three harmonic terms) was used to describe the season-
ality of the satellite data (Eq. 6; Verbesselt et al., 2010b).
For each piecewise linear model (Tt ) from ti∗ to ti+1 ∗ , where
 ∗           ∗
t1 , . . ., tp is the assumed break points which define the p + 1
segment, Tt can be expressed as follows:
                                                                           Figure 2. Examples of the break point detection in the MODIS
Tt = αi + βi t (i = 1, . . ., p) ,                                   (5)   time series using the BFAST algorithm. (a) The two cases present
                                                                           when the algorithm is able to detect the break in the NDVI time se-
where i is the index of the breaks, and i = 1, . . ., p. αi and            ries. The NDVI curve is the original 16 d composite MODIS NDVI
βi are the intercept and slope of the fitted piecewise linear              time series. The fitted curve is the pre-processed NDVI after cloud
model.                                                                     masking and spline interpolation. Trend line shows the fitted trend
  For the t1# , . . ., tm
                        # seasonal break points, S is the harmonic
                                                  t                        for each segment after seasonal-trend decomposition using BFAST.
            #         #
model for tj to tj +1 :                                                    (b) The seasonal-trend decomposition of the 16 d NDVI time series
                                                                           using BFAST for the second example. The algorithm decomposes
       K                                                                 the time series into three components: trend, seasonality and resid-
       X                    2π kt
St =         αj,k sin             + δj,k       (j = 1, . . ., q) ,   (6)   uals (et).
       k=1
                             f

where j = 1, . . .q. k is the number of harmonic terms in the
                                                                           PALSAR images was shown in Fig. S4. The break time de-
periodic model (default value of 3), αj,k is the amplitude, f
                                                                           tected from MODIS NDVI showed the similar conversion
is the frequency and δj,k is the time phase. For the MODIS
                                                                           year compared with the microwave satellite images (a total
NDVI used in this study, the f value was 23 (i.e. 23 obser-
                                                                           of 86 % agreement with 62 % matched the same change year
vations of MODIS observations per year; Verbesselt et al.,
                                                                           and 24 % within a 1-year interval). Moreover, we did a test
2010b). Here, the maximum number of breaks was artifi-
                                                                           using the subsequent NDVI fragments to replace the original
cially set to 1 because of the assumption of one time change
                                                                           NDVI fragments after the detected break time and compared
for each period based on prior knowledge from the oil palm
                                                                           the break results to show the robustness of the algorithm con-
maps. Figure 2a shows two examples of the break point de-
                                                                           sidering the effect of the oil palm plantation standing age
tection of the MODIS NDVI using the BFAST algorithm. In
                                                                           (Fig. S5).
the first example, no obvious break is detected in the low-
resolution time series, whereas significant change was cap-
tured in the trend section after time-series decomposition in              2.4.3   Updating annual oil palm results
the second example (Fig. 2b). More details of the BFAST                    The previous steps generated annual oil palm maps for 6
algorithm are referenced in Verbesselt et al. (2010b, 2012).               years (Sect. 2.3) and the oil palm change time in the missing
To evaluate the validity of using coarse MODIS time series                 periods (2011–2014 and 2001–2016; Sect. 2.4.1 and 2.4.2).
in oil palm change detection, we visually interpreted an ex-               In the final step, all these data were combined to update the
tra 100 change points based on the PALSAR images from                      continuous oil palm dataset from 2001 to 2016 following Xu
2007 to 2010 and applied the BFAST algorithms using the                    et al. (2020).
MODIS NDVI. An example of the comparison between the
BFAST-based change results and visual interpretation from

www.earth-syst-sci-data.net/12/847/2020/                                                      Earth Syst. Sci. Data, 12, 847–867, 2020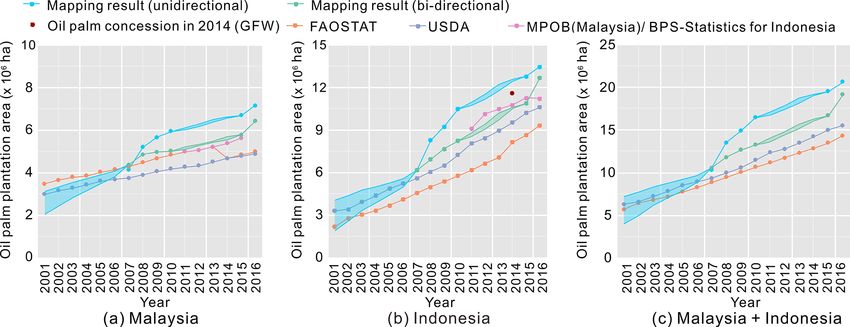
854                                                                                Y. Xu et al.: Annual oil palm plantation maps

   For the gap period from 2011 to 2014, the oil palm updat-          Two sets of annual oil palm samples set were used to val-
ing was based on the from–to land cover types (L1 and L2 ) of      idate the mapping results in Malaysia and Indonesia accord-
the start (t1 ) and the end years (t2 ) with the detected change   ing to the sampling protocol of Gong et al. (2013). The in-
time (ti ). Then L2 was allocated between ti and t2 , while L1     dependent annual sample set in Malaysia was from the pre-
was assigned before ti (t1 to ti ). For example, if a pixel were   vious studies (Cheng et al., 2019, 2017). All pixel-based
forest in 2010 and oil palm in 2015 with a change year of          samples were randomly produced in an equal-area hexago-
2013, then the land cover type would be forest during 2010–        nal grid (95.98 km2 for each grid cell); therefore the distri-
2013 and oil palm during 2014–2015, following the updat-           bution of the samples among different land cover types has
ing process. The rest of the area without oil palm changes         minimal bias with the real land cover composition. All the
remained unchanged from 2010 to 2015 (assigned L1 ). For           testing samples were manually checked using high-quality
the gap period during 2001–2006, the oil palm map in 2007          Google Earth (< 1 m) images in the first round and then
from PALSAR data was used as the potential change area (as         double-checked by the time-series PALSAR images (25 m),
mentioned in Sect. 2.4.2) without from–to types. Thus the          since it is easy to identify the crown of palm trees in the
land cover type between 2001 and change time (ti ) was clas-       high-resolution datasets and recognize the regular oil palm
sified as non-oil palm, and oil palm was assigned to the pe-       plantations in the microwave satellite datasets. Once the start
riod after ti (ti to t2 ). Thereafter, the oil palm maps between   and the end of the period of oil palm are determined from
2001 to 2016 were updated. Quality maps (Figs. S6 and S7)          Google Earth images or PALSAR data, the middle years can
were also generated to indicate the availability of valid NDVI     be checked by the stable spectral- and backscatter-coefficient
values (i.e. not under cloud cover), the spatial resolution of     information in the continuous PALSAR images. The annual
the dataset used and the consistency of change time detec-         sample set contains ∼ 3000 samples with four land cover
tion from different break point test approaches in BFAST al-       types (∼ 16 % were oil palm samples), and it covers the
gorithms (the OLS-MOSUM), the supremum of a set of La-             whole country of Malaysia (see the green points in Fig. 3;
grange multiplier statistics (SupLM) and BIC test (Zeileis,        only oil palm samples presented). The second annual In-
2005). The annual oil palm updating process was applied in         donesian sample set was developed following the protocol of
both the bi-directional and unidirectional versions, and two       Cheng et al. (2017). This sample set contains 7663 samples
versions of the oil palm datasets (AOPD-bi and AOPD-uni)           in total (601 were oil palms, and the rest were non-oil palm
were developed.                                                    types) during 2010 to 2016 (see the blue points in Fig. 3).
                                                                   The details of the number and spatial distribution of valida-
2.5   Evaluation
                                                                   tion samples are presented in Fig. 3 and Table 2. More infor-
                                                                   mation on the randomized sampling method can be found in
Our product of annual oil palm maps, AOPD, was evalu-              Cheng et al. (2019, 2017).
ated for three aspects: (1) the independent annual oil palm           The change sample set was developed to evaluate the de-
sample set for Malaysia (2007, 2008, 2009, 2010, 2015 and          tected change year by the break point detection analysis.
2016) and Indonesia (2010–2016) to evaluate the annual             Time lapses of high-resolution imagery from Google Earth
mapping results for the classified maps using PALSAR and           covering the change period were used to check the change
PALSAR-2 data and gap years using the change-detection             time detected by the BFAST algorithm. We randomly se-
method, (2) a change sample set aimed at assessing the ac-         lected 5000 points (implemented with ArcGIS 10.3 software)
curacy of detected change years, and (3) comparison with           in the change area, but there were only limited samples (370,
statistical inventories (e.g. FAO, USDA, Malaysian Palm Oil        25.07 % of the total 1476 oil palm samples) with continu-
Board – MPOB – 2011–2016, Badan Pusat Statistik – BPS-             ous high-resolution images from Google Earth and cloud-
Statistics Indonesia – 2011–2015, the existing oil palm maps       free Landsat time series. We compared our detected change
from Gaveau et al., 2016, and the Landsat-based deforesta-         years with the actual oil palm conversion time for these test
tion maps – Hansen et al., 2013). FAO and USDA agricul-            samples. A confidence interval of ±1 years was used consid-
tural statistical data provided the harvested area of oil palm     ering uncertainty in visual interpretation of the change time
using data collected by official and unofficial outlets. MPOB      (Dara et al., 2018). Detailed distribution of the testing sam-
is a government agency providing oil palm plantation area in       ples can be seen in Fig. 3.
Malaysia based on the data reported by state agencies, insti-
tutions, private estates and independent smallholders. BPS-
                                                                   3     Results
Statistics Indonesia, a non-ministry government agency, pro-
vided statistical data for the public including oil palm plan-     3.1    Spatial and temporal characteristics of oil palm
tation area compiled from the quarterly (SKB17-Oil Palm)                  expansion
and annual (SKB17-Annual) plantation estate survey, cus-
tom documents from the Directorate General of Customs,             The annual changes of oil palm plantations from 2001 to
and secondary data from the Directorate General of Estate          2016 are shown in Fig. 4. The spatial and temporal dynamics
Crops.                                                             of oil palm changes vary in Malaysia and Indonesia. In the

Earth Syst. Sci. Data, 12, 847–867, 2020                                             www.earth-syst-sci-data.net/12/847/2020/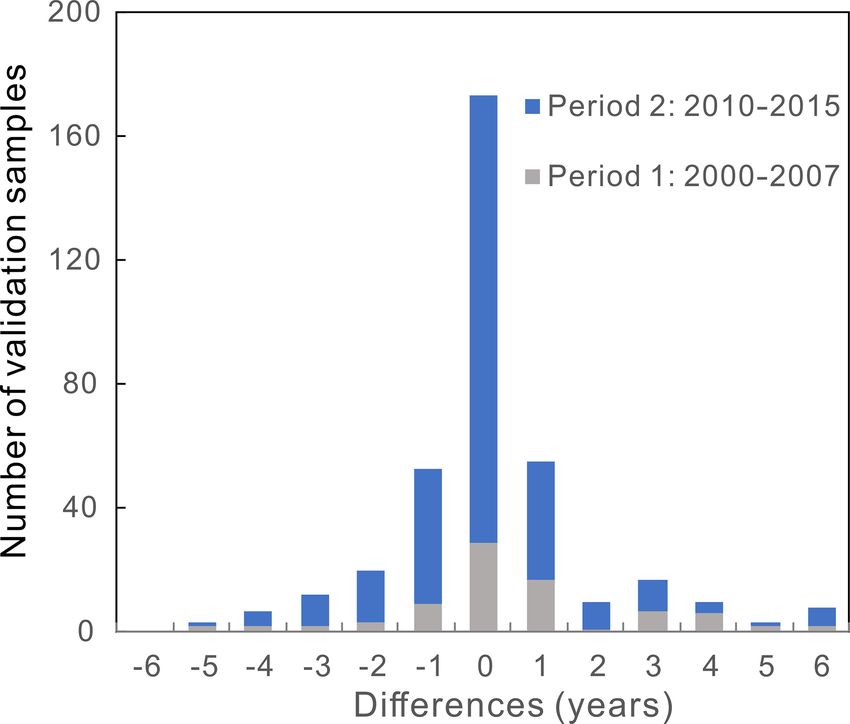
Y. Xu et al.: Annual oil palm plantation maps                                                                                          855

Table 2. The distribution of annual validation sample set for Malaysia and Indonesia (unit: pixel).

                                                Malaysia                                              Indonesia
                        Oil palm    Other vegetation     Water    Others      Total           Oil palm    Not oil palm   Total
               2007          371                2335        68          74     2848   2010         547            7066   7613
               2008          398                2334        71          76     2879   2011         559            7063   7622
               2009          418                2335        71          76     2900   2012         568            7068   7636
               2010          433                2335        71          76     2915   2013         575            7078   7653
               2015          505                2336        75          76     2992   2014         588            7072   7660
               2016          505                2334        71          73     2983   2015         594            7073   7667
                                                                                      2016         601            7066   7667

                                                                             are the changes in more recent years. Oil palm planta-
                                                                             tions expanded rapidly during the study period in peninsular
                                                                             Malaysia and Sumatra and Borneo. In Indonesia, rapid ex-
                                                                             pansion first occurred in Sumatra and was then surpassed by
                                                                             Kalimantan (Gunarso et al., 2013; Petrenko et al., 2016). This
                                                                             can also be observed in our maps, where more changes hap-
                                                                             pened in earlier years in Sumatra (lighter colours in Fig. 4)
                                                                             and later in Kalimantan (darker colours). The decrease in oil
                                                                             palm plantations was also detected (Fig. 4b), although it is
                                                                             difficult to separate the oil palm replantation after one rota-
                                                                             tion (i.e. still oil palm in land use) from the permanent oil
                                                                             palm loss (i.e. change to other land-use types). Compared to
                                                                             the period before 2007 using change detection in NDVI data,
                                                                             our data product in the gap period of 2011–2014 would be of
                                                                             higher quality, since the net changes were constrained by the
Figure 3. Spatial distribution of oil palm samples in the two val-
idation datasets. The annual sample set contains 2986 (in 2016)
                                                                             oil palm maps in 2010 and 2015 derived from PALSAR and
samples in Malaysia, which were interpreted for 2007, 2008, 2009,            PALSAR-2 data, respectively.
2010, 2015 and 2016, and 7667 (in 2016) samples in Indonesia, in-               Figure 5 displays the annual total area of oil palm in
terpreted from 2010 to 2016. These samples were used to validate             Malaysia and Indonesia from 2001 to 2016, with uncertainty
the annual maps developed from PALSAR and PALSAR-2 data.                     ranges (shaded area with boundary lines) during 2001–2006
Of the annual sample set in Malaysia, oil palm samples consist of            and 2011–2014. This uncertainty range is from the change-
16.92 % (505), while the forest, water and others consist of 78.16 %,        detection step; 9.45 % of the total changes from 2010 to 2015
2.48 % and 2.44 %, respectively. The Indonesian annual sample set            were not captured in the MODIS NDVI using the BFAST al-
contains 601 (7.84 %) oil palm samples, and the rest (92.16 %) were          gorithm because of the low resolution, cloud contamination,
other types. The change sample set includes 370 oil palm samples             the mapping error from the base maps, etc. Assuming that
which were converted in the interpolated period (2001–2006 and
                                                                             these missing changes all happened from 2010 to 2011, the
2011–2014). This sample set, with change year labelled, is used to
assess the change detection result in the gap years.
                                                                             oil palm area of the gap years should follow the trajectory of
                                                                             the upper boundary line. If all the missing changes happened
                                                                             in the last year of the period, the oil palm area curve would
                                                                             be the lower boundary line. Since the distribution of oil palm
study area, most oil palm plantations are located in lowland
                                                                             in 2001 was unknown, large uncertainty may exist before
areas (elevation < 250 m, slope < 2.5◦ ), and a few are dis-
                                                                             2007. Here, the uncertainty range during 2001–2006 was de-
tributed in gently undulating hills (elevation > 500 m, slope
                                                                             termined based on the data availability of MODIS NDVI and
> 5◦ ; Fig. S8). The newly developed oil palm has similar el-
                                                                             consistency of change time detection from the quality maps
evation and slope distribution to that in 2007 (slope: 1.97◦
                                                                             (Figs. S6 and S7). The oil palm area before 2007 follows
in 2007 and 1.99◦ in 2016; elevation: 228.98 m in 2007 and
                                                                             the upper boundary curve if the same breaks were detected
230.10 m in 2016). Specifically, the oil palm plantations are
                                                                             in all three structural change methods (OLS-MOSUM, Su-
mostly found in the southwestern coastal regions in penin-
                                                                             pLM, BIC) and there are more than 60 % valid NDVI values
sular Malaysia, northeast of Sumatra and coastal regions in
                                                                             available in this time period. If all the breaks were counted
Borneo (Fig. 4a).
                                                                             regardless of the number of valid MODIS NDVI values and
   Light colours in Fig. 4 indicate the oil palm changes (ex-
pansion and shrink) in early years, while the dark colours

www.earth-syst-sci-data.net/12/847/2020/                                                       Earth Syst. Sci. Data, 12, 847–867, 2020
856 Y. Xu et al.: Annual oil palm plantation maps
the increasing trend in oil palm plantations in Indonesia was
greater than Malaysia (0.573–0.716×10⁶ ha yr−1 compared
to 0.217–0.289×10⁶ ha yr−1 according to our mapping re-
sults), which illustrates the quick expansion of oil palm plan-
tations in Indonesia in recent years. The unidirectional ver-
sion has a higher increase in net area planted with oil palm
in Malaysia and Indonesia (71.71 % and 117.64 %) from
2007 to 2016 than the bi-directional version (46.62 % and
105.37 %). This is because the unidirectional version is tem-
porally filtered based on the assumption of one-way expan-
sion of oil palm plantations, while the bi-directional version
considered the conversion from oil palm to other land cover
types (Sect. 2.3.3).
3.2 Accuracy assessment
The mapping performance of AOPD was evaluated first using
an independent annual oil palm sample set for 2007, 2008,
2009, 2010, 2015 and 2016. The mapping accuracy from the
previously developed datasets over Malaysia (Cheng et al.,
2019) was also compared. The results of the annual accuracy
(F score) with producer accuracy (PA) and user accuracy
(UA) are shown in Tables 3 and 4. PA shows how correctly
the reference samples are classified and indicated the omis-
sion error (1-PA), while UA represents the percentage of the
classes that have been correctly classified and is linked with
commission error (1-UA). The average annual accuracy for
oil palm areas in Malaysia reached 86.22 %, which is 8.27 %
higher than the annual maps from the previous study (Cheng
et al., 2019). The improvement of the oil palm mapping per-
Figure 4. Year of oil palm change at 100 m resolution in the study
area from 2002 to 2016. (a) Expansion (2002–2016) and (b) shrink-
formance is mainly due to the different post-processing (one-
age (2008–2016). During 2011–2014, the from–to types of the way expansion and bi-directional oil palm change strategies)
change pixels were pre-defined in the 2010 and 2015 land cover and the introduction of the ancillary data (IFL and GMA).
maps derived from PALSAR and PALSAR-2 data, respectively. Meanwhile, there is no significant difference in the oil palm
Therefore, both the expansion and shrinkage year of oil palm were mapping accuracy among the 6 years in Malaysia (all above
available in this period using the change-detection method. During 85 % with less than 2 % difference; Table 3), indicating the
2001–2006, the oil palm distribution of the start year is unknown. stability and robustness of AOPD. The evaluation using the
Here we assumed one-way expansion of oil palm before 2007 and second annual oil palm sample set in Indonesia shows the av-
adopted the change-detection algorithms in the 2007 oil palm ex- erage mapping accuracy of 74.20 % and the F score of 0.74
tent. Thus, the expansion year was traced back to 2002. The grey during 2010–2016. The oil palm mapping accuracy was rel-
background refers to the study area.
atively stable during the gap years and the classified years
(higher than 72 % with 3 % fluctuation; Table 4).
Figure 6 shows the direct comparison of the change maps
the consistency of change methods, the oil palm area would with the images from Google Earth and Landsat, which docu-
be the lower boundary line. ment the change process. We use time lapse of images when
Generally, the net oil palm plantation area shows a the annual high-resolution images from Google Earth were
monotonous increasing trend from 2001 to 2016 for not available. Here time lapse means the images obtained
Malaysia (Fig. 5a) and Indonesia (Fig. 5b) in both the for intervals of > 1 year. For example, there are no high-
bi-directional (green lines) and unidirectional (blue lines) resolution images from Google Earth in 2011, so we used the
versions. During the past 16 years, the net oil palm 2010 images as a substitute in Fig. 6d, and the actual change
area across Malaysia increased from ∼ 2.59×10⁶ ha (2.05– time is limited within the period (2010–2013). The first three
3.13×10⁶ ha) to 6.39×10⁶ ha, which is a net increase selected regions in Sarawak, Malaysia (Fig. 6a and b), and
of 146.60 % (103.99 %–211.71 %). Indonesia has a much West Kalimantan, Indonesia (Fig. 6c), represent the typical
higher increase in oil palm area, from ∼ 3.00×10⁶ ha (1.92– process of oil palm change, i.e. the clearance of primary
4.07×10⁶ ha) to 12.66×10⁶ ha (∼ 4 fold). Correspondingly, forest and the replantation of oil palm cultivations. Overall,
Earth Syst. Sci. Data, 12, 847–867, 2020 www.earth-syst-sci-data.net/12/847/2020/Y. Xu et al.: Annual oil palm plantation maps 857
Figure 5. Comparison of the annual oil palm plantation area among FAO and USDA statistics, MPOB records for Malaysia, BPS-Statistics
and oil palm concessions from GFW for Indonesia and our mapping results in (a) Malaysia, (b) Indonesia, and (c) Malaysia and Indonesia
from 2001 to 2016. The blue lines represent the gross gain (unidirectional expansion), while the green lines show the net changes of oil palm
from 2007 to 2016. The shaded area within the two boundary lines is the uncertainty range of the oil palm area. The upper boundary lines
represent the upper limit area of oil palm within the two periods (2011–2014 and 2001–2006), whereas the lower boundary lines are the
lower limit according to our results. Note that during the gap between the two periods, no uncertainty could be derived, which does not mean
that the uncertainty was small.
Table 3. The comparison of the oil palm accuracy between our mapping results and Cheng et al. (2019) for the 6 mapping years in Malaysia.
UA: user’s accuracy. PA: producer’s accuracy.
Year Cheng et al. (2019) Our results
F score UA (%) PA (%) F score UA (%) PA (%)
2007 0.74 78.02 70.63 0.86 93.40 80.05
2008 0.78 82.5 73.83 0.88 93.22 82.91
2009 0.75 79.76 71.13 0.86 92.12 81.10
2010 0.79 80.92 77.02 0.85 93.89 78.06
2015 0.83 80.31 85.25 0.86 92.08 80.59
2016 0.79 78.5 79.13 0.86 87.47 84.36
Table 4. The oil palm accuracy in Indonesia from 2010–2016. UA: other type of oil change, from cropland to oil palm, in North
user’s accuracy. PA: producer’s accuracy. Sumatra, Indonesia.
Our detected change time is also consistent with the timing
Year Our results of change interpreted from Google Earth and Landsat im-
F score UA (%) PA (%) ages. The deviation of the detected change years – during
2001–2006 (grey) and 2011–2014 (blue) – from the valida-
2010 0.75 69.47 74.95 tion samples (change sample set) is shown in Fig. 7. Lim-
2011 0.75 70.38 74.83
ited change samples from 2001 to 2006 were collected be-
2012 0.75 71.48 75.05
cause of few high-resolution images being available during
2013 0.75 72.39 74.79
2014 0.74 72.58 74.28 the early years. Overall, an agreement between the detected
2015 0.72 68.46 71.83 and the actual change time was found in 75.74 % of the sam-
2016 0.72 69.97 72.33 ples (two-thirds of the detected change time matched the ac-
tual change time, while one-third was within a 1-year in-
terval). Further, the change time tended to be more accu-
rate during 2011–2014 (78.20 %) compared to 2001–2006
(67.07 %), given the constraints of the from–to type and the
most of the changes were captured within the range defined range of exact change area of oil palm from 2011 to 2014.
by time lapse of the Google Earth images (see the detected
change years in the highlighted regions; red shapes). Differ-
ent from the first three cases (Fig. 6a–c), Fig. 6d presents an-
www.earth-syst-sci-data.net/12/847/2020/ Earth Syst. Sci. Data, 12, 847–867, 2020858 Y. Xu et al.: Annual oil palm plantation maps
Figure 6. Visual comparison of the detected change years with the high-resolution images and medium-resolution Landsat images from
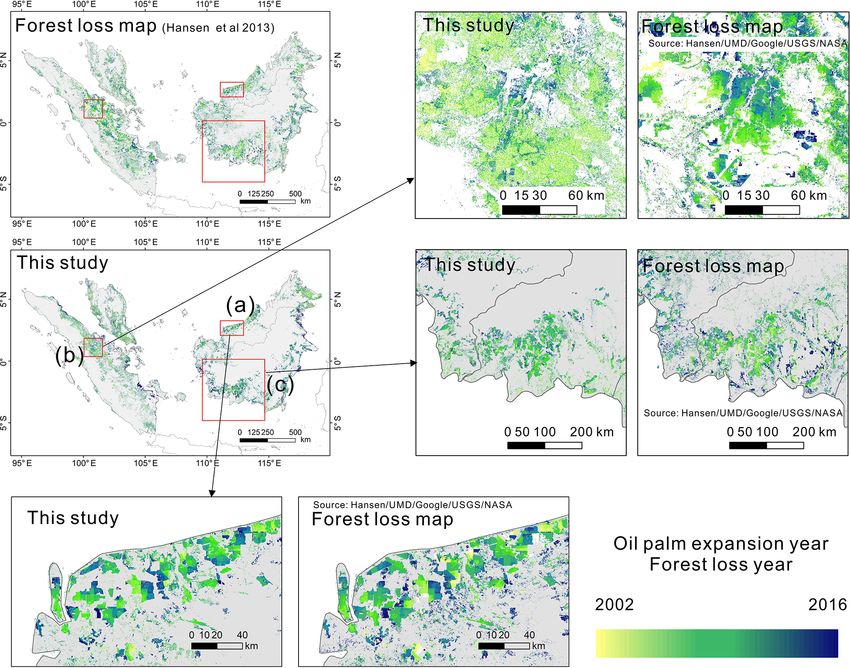
Google Earth. The colour of the first column represents the change-detected time in our results. The red shape highlights the change areas.
Panels (a) and (b) are two selected regions located in Sarawak, Malaysia. The Landsat images in the right indicate that the deforestation
and plantations of oil palm occurred between 2013 and 2015 and 2006 and 2008, respectively, and the change times (2014 and 2008) were
captured in the result maps. Panel (c) is an example of change detected in 2009 in West Kalimantan, Indonesia, where forest type is presented
in the Landsat images in 2007 and oil palm plantations shown in 2009; (d) is a case showing the conversion of cropland to oil palm in North
Sumatra, Indonesia, according to the high-resolution images from Google Earth. The young oil palm trees in the 2013 image indicate that
the conversion may have occurred 1 or 2 years before, which matched the results in our maps (detected change time in 2012).
3.3 Comparison of our results with statistics and other but were relatively higher in Indonesia (1.88×10⁶ ha com-
products pared to FAO and 0.60×10⁶ ha compared to USDA), prob-
ably because of more confusion from other plantations (i.e.
We first compared the oil palm plantation area from our coconuts, rubber and acacia) and/or more smallholder growth
AOPD product with oil palm harvested area from FAO and in Indonesia (Lee et al., 2014). There are also small dif-
USDA and the oil palm plantation area from MPOB (data ferences in oil palm plantation area in comparison with lo-
available from 2011 to 2015) and BPS-Statistics Indone- cal national statistics: MPOB (average annual difference of
sia (available from 2011 to 2016; Fig. 5). Note that the 0.20×10⁶ ha) and BPS-Statistics Indonesia (−0.17×10⁶ ha).
FAO inventory data for Malaysia from 2011 to 2015 and These differences only consist of 3.14 % and 1.37 % of the
the USDA statistics from 2011 to 2014 were derived from total oil palm plantation area in 2016 in the two countries.
MPOB (mainly mature area). The FAO statistics included Trends of oil palm expansion in our mapping results (up-
both mature and immature oil palm area during 2011–2013 per and lower boundary lines) are also compared with sta-
but only mature oil palm area during 2014–2015, resulting in tistical data (FAO and USDA from 2001 to 2016, MPOB
an abrupt decline in area in the FAO inventory in 2014 (the and BPS-Statistics from 2011 to 2015; Table S1 in the
orange line in Fig. 5a). Therefore, the areas from FAO inven- Supplement). Generally, the overall trends of our map-
tory should be used with caution due to the lack of reliable ping results (0.758–0.941×10⁶ ha yr−1 ) are higher than the
on-field data sources (Ordway et al., 2019). FAO (0.561×10⁶ ha yr−1 ) and USDA (0.630×10⁶ ha yr−1 )
Compared to FAO and USDA statistics, the annual mean records during the past 16 years, with larger discrepancy in
differences from 2001 to 2016 of our results in Malaysia and Malaysia (47.07 %–59.40 % higher than FAO and 39.45 %–
Indonesia are positive and amount to 2.00 and 1.18×10⁶ ha, 53.55 % higher than USGS) than Indonesia (16.84 %–
respectively. The differences were limited to an average of 31.68 % higher than FAO and 5.99 %–22.76 % higher than
0.08×10⁶ ha (FAO) and 0.55×10⁶ ha (USDA) in Malaysia USGS). The higher estimation may be induced by the confu-
Earth Syst. Sci. Data, 12, 847–867, 2020 www.earth-syst-sci-data.net/12/847/2020/Y. Xu et al.: Annual oil palm plantation maps 859
(1080.72 USD per tonne) in 2011 (Fig. S9) but subsequently
fell. The crop price is closely related to demand and may fur-
ther impact the oil palm market and production (Turner et al.,
2011). However, although there is a ∼ 10 %–20 % slowdown
of the conversion rate, oil palm plantation area continuously
increased after 2011. The land conversion to oil palm may
also be affected by multiple factors such as agricultural rent,
wages and market-mediated effects (such as tax; Furumo and
Aide, 2017; Taheripour et al., 2019), and the relationship be-
tween oil palm expansion and price fluctuation still requires
further exploration.
An industrial oil palm plantation dataset developed by a
previous study (Gaveau et al., 2016; Fig. 8) was also used
to compare our mapping results. The oil palm plantation
in Gaveau’s dataset was visually interpreted using Landsat
datasets in 1973, 1990, 1995, 2000, 2005, 2010 and 2015 in
Borneo. The overall distribution of oil palm extent in Borneo
Figure 7. Difference between the detected change years using is similar between our mapping results (the unidirectional
MODIS NDVI dataset and the exact change years from the refer- version) and Gaveau’s results (Fig. 8a and b). The differ-
ence dataset (Google Earth and Landsat). Negative values on the x ences were scattered across the whole island, with more oil
axis refer to the detected year being earlier than the actual change palm plantation areas in our results than in Gaveau’s results
year. in the south of Borneo (Fig. 8c; aggregated to proportional
maps at 5 km×5 km to zoom in on the difference). Generally,
7.45, 9.23 and 9.86×10⁶ ha of oil palm plantation area was
sion in other woody plantations such as coconuts and pulp. mapped in AOPD for Borneo during 2010, 2015 and 2016,
Although there is high separability between rubber, wattles which is 23.98 %, 12.61 % and 18.83 % larger than the es-
and palms in PALSAR data (Miettinen and Liew, 2011), timates from Gaveau’s dataset. Our higher estimation of oil
the coconuts which belong to palm trees and have a fan- palm plantation area is possibly because some of the small-
like shape showed fewer differences with oil palm compared holder oil palm plantations (1–50 ha in size) are captured in
to other plantations. Another possible reason is the differ- our results, whereas only industrial plantations were visually
ence in the oil palm plantation definitions (mature and im- interpreted in Gaveau’s results. Misclassification (commis-
mature oil palm or only mature oil palm included in FAO sion errors) in our results may, however, also contribute to
inventory). Compared to FAO and USDA statistics, increas- our estimation being higher.
ing trends in our mapping results (0.148–0.178×10⁶ ha yr−1 ) The oil palm concession area for Indonesia and Malaysia
are more consistent with national statistics from MPOB (Sarawak) for 2014 from Global Forest Watch (http://www.
(0.160×10⁶ ha yr−1 ) in Malaysia, which include both the globalforestwatch.org, last access: 20 May 2019) is also
mature and immature oil palm during 2011–2015. We should used in the comparison. This dataset indicated the bound-
also note that the unidirectional version would have a higher aries of areas allocated by government to companies for
estimation of oil palm plantation area since the assumption oil palm plantations. The oil palm concession area in In-
of one-way growth. The annual increasing rates of oil palm donesia and Malaysia (Sarawak) for 2014 is 12.98×10⁶ ha,
plantations between our mapping results and other datasets which is slightly higher (8.7 %) than our mapping results
also showed smaller differences in a recent period (2011– (11.85×10⁶ ha). However, since the concession data were
2015 with national statistics) compared to the whole study compiled from various countries and sources (such as gov-
period (2001–2016). For example, the increasing oil palm ernments and other organizations) with different quality lev-
expansion rate of 0.534–0.610×10⁶ ha yr−1 during 2011– els, some locations of the existing concessions may be inac-
2015 in our product is close to the statistical inventory curate (Fig. 9a) or omitted (Fig. 9b) compared to our map-
data, particularly the USDA records (0.536×10⁶ ha yr−1 ), ping results with PALSAR-2 data. Many concessions are
while the increasing rate of 0.573–0.674×10⁶ ha yr−1 is rel- not fully developed (i.e. not planted with oil palm yet), and
atively higher than the USDA (0.520×10⁶ ha yr−1 ) and FAO the number reached more than half of the total 11×106 ha
(0.460×10⁶ ha yr−1 ) inventory during 2001–2016 in Indone- (∼ 5.5×10⁶ ha) on the islands of Sumatra and Kalimantan in
sia. This is also consistent with the higher uncertainty in 2010 (Slette and Wiyono, 2011). Another possible reason for
the early period and higher reliability in recent years. Dur- the differences is the inclusion of very small oil palm planta-
ing the study period, the oil palm export price (total ex- tions in our dataset of less than 50 ha, while most of the oil
port value / export amount; data source: FAOSTAT) rapidly palm concessions (81.71 %) were larger than 1000 ha.
increased from 402.67 USD per tonne in 2006 to the peak
www.earth-syst-sci-data.net/12/847/2020/ Earth Syst. Sci. Data, 12, 847–867, 2020You can also read