Havering Community Safety Partnership Strategic Assessment

Page created by Carol Mcguire
 
CONTINUE READING
Havering Community Safety Partnership Strategic Assessment
Havering Community Safety Partnership Strategic Assessment 2015               1

      Havering Community Safety Partnership
               Strategic Assessment

                                 Havering Community Safety Partnership Strategic Assessment 2015, Public
    Title & Version
                                 Version
    Relevant to                  Havering Community Safety Partnership
                                 An analysis and overview of crime, disorder, substance misuse and offenders
                                 adversely affecting the residents of Havering. To be used as a background
    Summary / Purpose
                                 document for the development of the Havering Partnership Plan (crime
                                 reduction strategy).
    Author                       Iain Agar
    Unit                         Havering Community Safety Partnership
    Date Created                 October – December 2015

Iain Agar, Havering Community Safety Partnership Analyst
Havering Community Safety Partnership Strategic Assessment
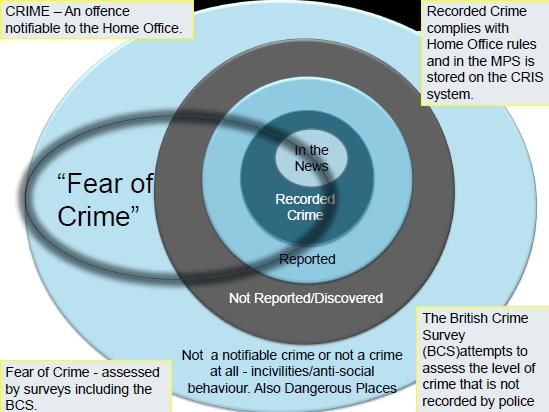
Havering Community Safety Partnership Strategic Assessment 2015   2

Table of Contents

1. Context                                                                                                 3
  1.1 Background                                                                                           3
  1.2 Purpose                                                                                              3
  1.3 Methodology and data sources                                                                         3
  1.4 Socio-economic and demographic profile                                                               3
2. Performance and recent trends                                                                           4
  2.1 Havering crime data                                                                                  4
  2.2 Police recorded crime summary                                                                        5
  2.3 Partnership data summary                                                                             7
  2.4 Reoffending, detections and outcome data                                                             9
  2.5 Crime Harm Index                                                                                    10
3. Community safety problems                                                                              11
  3.1 Victims and targets                                                                                 11
  3.1.1 Age, gender and ethnicity                                                                         11
  3.1.2 Repeat victimisation                                                                              13
  3.1.3 Hot Products                                                                                      14
  3.1.4 Risky facilities / environments                                                                   16
  3.1.5 Fears and perceptions                                                                             18
  3.1.6 Crime and health                                                                                  19
  3.1.7 Specific victim groups (CSE and VAWG)                                                             21
  3.2 Offenders                                                                                           23
  3.2.1 Age, gender and ethnicity                                                                         23
  3.2.2 Weapons                                                                                           26
  3.2.3 Criminogenic Needs                                                                                26
  3.2.4 Alcohol and Drugs                                                                                 30
  3.2.5 Known gangs or offending groups                                                                   32
  3.2.6 Reoffending                                                                                       33
  3.2.7 Detections and outcomes                                                                           34
  3.3 Places and locations                                                                                35
  3.3.1 Recorded crime                                                                                    35
  3.3.2 Incidents of Anti-Social Behaviour                                                                36
  3.3.3 Victim groups                                                                                     38
  3.3.4 Offenders known to police                                                                         41
  3.3.5 Offenders in treatment                                                                            42
  3.3.6 Gangs and serious violence                                                                        43
4. Priorities                                                                                             44
  4.1 Suggested strategic priorities                                                                      44
  4.2 Recommendations                                                                                     44
Appendix                                                                                                  45

Iain Agar, Havering Community Safety Partnership Analyst
Havering Community Safety Partnership Strategic Assessment
Havering Community Safety Partnership Strategic Assessment 2015                        3

1. Context

1.1 Background

The Strategic Assessment is an annual statutory requirement of all Community Safety Partnerships in England and Wales.

1.2 Purpose

The purpose of the strategic assessment of crime and disorder is to help decision makers set the strategic priorities for the
future. It should also be used to support future commissioning processes, including the commissioning of intelligence
products and more detailed problem profiles (e.g. for agreed priorities and where there are key information gaps), to gain a
better understanding of crime, fear of crime, anti-social behaviour and offenders.

1.3 Methodology and data sources

This assessment includes a comprehensive analysis of the level and patterns of crime, disorder and substance
misuse/offending in the London Boroughs of Havering.

It utilises a wide range of data from appropriate sources as detailed in the Appendix. Multi-agency data used includes
Metropolitan Police, National Probation Service, Public Health England, Ministry of Justice, Crown Prosecution Service,
British Transport Police, London Fire Brigade, London Ambulance Service, and Transport for London, Crime Survey for
England & Wales and London Public Attitude Surveys. Where possible, the data used is within the period October 2014 to
September 2015, however, exceptions to this are noted within the report.

Analysis included a range of techniques such as hotpot and thematic mapping, Figure 1.1 Problem Analysis Triangle
creation of indices which highlight disproportionality (Offender and Victim Index
Scores). Issues regarding data recording and accuracy are discussed within the
Appendix.

The assessment is structured around the Problem Analysis Triangle elements of:
    -   Victim/vulnerable people/vulnerable groups/targets
    -   Offenders
    -   Places/priority communities

Unlike some assessments, the purpose has not been to provide detailed analysis of
each and every crime and substance misuse problem in Havering. Rather, it has been used as a tool for strategic decision
makers. The information provided is a measure of the problem rather than a full analysis (which is the purpose of problem
profiles).

This approach enables the analysis to identify both cross-cutting issues and underlying drivers and motivations for
offending.

1.4 Socio-economic and demographic profile

A socio-economic and demographic profile of Havering is available here: http://www.haveringdata.net/research/jsna.htm

Factors which may contribute to increased levels of crime include increases in the main offending age demographic (15-24
year olds), increases in transient renters (i.e. renting a room), higher financial dependency, poor health including mental
and emotional health, levels of alcohol and drug consumption.

Iain Agar, Havering Community Safety Partnership Analyst
Havering Community Safety Partnership Strategic Assessment
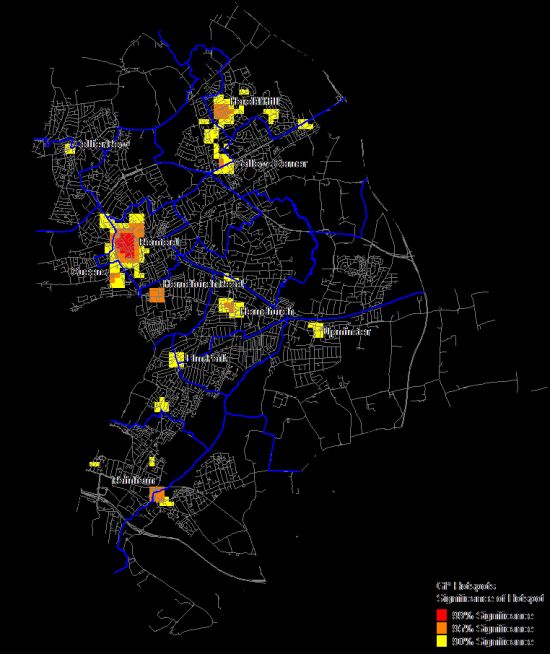
Havering Community Safety Partnership Strategic Assessment 2015                                                                                                                                                                                                                         4

2. Performance and recent trends

This section gives an overview of crime, disorder and anti-social behaviour (ASB) problems within the London Borough of
Havering, noting long and short term trends to highlight key performance issues. A breakdown of all data is included in
Appendix A along with details on where to retrieve performance data from online open source.

2.1 Havering crime data

Total notifiable offences reported to and recorded by the Metropolitan Police within Havering have reduced by -17.4% over
the past five years, whilst over the previous 12-months there has been a rise of 3.9%. Figure 2.1 below shows the trend in
recorded victim based crimes and state based (crimes without an identifiable individual victim, i.e. possession of cannabis
or offensive weapons) crimes since April 2010. Victim based crimes during this time have averaged 1,200-1,300 per month,
driven largely in recent months by improved recording of violent crimes. State based crimes have fallen rapidly in recent
years, correlating with significant declines in stop and searches of individuals. Long term trend charts, such as that shown in
Figure 2.1, are available for all categories of recorded crime in Havering using sources in Appendix A.
                                                                                            % Change             % Change
MPS Havering                  Oct-14 to Sep-15 Oct-13 to Sep-14          Variance
                                                                                         14-15 vs. 13-14      14-15 vs. 12-13
Total Notifiable Offences           15,845              14,984               861               5.7%                 -2.2%
Victim Based Crime                  14,459              13,662               797               5.8%                  0.4%
State Based Crime                    1,053               1,299              -246              -18.9%               -30.4%

                       Total Notifiable Offences (Victim Based & State Based)
                       250                                                                                                                                                                                                                                                                                                                                                                               1600

                                                                                                                                                                                                                                                                                                                                                                                                         1400

                       200
                                                                                                                                                                                                                                                                                                                                                                                                         1200

                                                                                                                                                                                                                                                                                                                                                                                                         1000

                                                                                                                                                                                                                                                                                                                                                                                                                 Victim Based Offences
State Based Offences

                       150

                                                                                                                                                                                                                                                                                                                                                                                                         800

                       100
                                                                                                                                                                                                                                                                                                                                                                                                         600

                                                                                                                                                                                                                                                                                                                                                                                                         400
                        50

                                                                                                                                                                                                                                                                                                                                                                                                         200

                         0                                                                                                                                                                                                                                                                                                                                                                               0
                                                    Aug 2010

                                                                                                                      Aug 2011

                                                                                                                                                                                        Aug 2012

                                                                                                                                                                                                                                                          Aug 2013

                                                                                                                                                                                                                                                                                                                            Aug 2014

                                                                                                                                                                                                                                                                                                                                                                                              Aug 2015
                                         Jun 2010

                                                                                                           Jun 2011

                                                                                                                                                                             Jun 2012

                                                                                                                                                                                                                                               Jun 2013

                                                                                                                                                                                                                                                                                                                 Jun 2014

                                                                                                                                                                                                                                                                                                                                                                                   Jun 2015
                                                                          Dec 2010

                                                                                                                                            Dec 2011

                                                                                                                                                                                                              Dec 2012

                                                                                                                                                                                                                                                                                Dec 2013

                                                                                                                                                                                                                                                                                                                                                  Dec 2014
                                                                                     Feb 2011

                                                                                                                                                       Feb 2012

                                                                                                                                                                                                                         Feb 2013

                                                                                                                                                                                                                                                                                           Feb 2014

                                                                                                                                                                                                                                                                                                                                                             Feb 2015
                              Apr 2010

                                                                                                Apr 2011

                                                                                                                                                                  Apr 2012

                                                                                                                                                                                                                                    Apr 2013

                                                                                                                                                                                                                                                                                                      Apr 2014

                                                                                                                                                                                                                                                                                                                                                                        Apr 2015
                                                               Oct 2010

                                                                                                                                 Oct 2011

                                                                                                                                                                                                   Oct 2012

                                                                                                                                                                                                                                                                     Oct 2013

                                                                                                                                                                                                                                                                                                                                       Oct 2014

                             State Based (SB) Offences                                                      SB Average                                      SB SD+1                                SB SD-1                               Victim Based (VB) Offences                                                          VB Average                                      VB SD+1                         VB SD-1

Figure 2.1 Victim Based and State Based crime trend in Havering, Metropolitan Police monthly data Apr-10 to Sep-15

Since the last strategic assessment there has been a rise in recorded crime locally, regionally and nationally. Havering
recorded a 5.7% increase in recorded crime, which was higher than the average for London (5.0%) but lower than that of
England and Wales (6.5%). This has largely been driven by increased reporting and improved recording of violent crimes,
with notable rises nationally. In Havering there was a rise of 25.3% since the last assessment, which was above the London
(19.9%) average and in line with England and Wales (26.3%). Serious acquisitive crimes, including burglary and vehicle
crime, in contrast have continued to decline with Havering recording a 6.7% decline since the last assessment. This was

Iain Agar, Havering Community Safety Partnership Analyst
Havering Community Safety Partnership Strategic Assessment
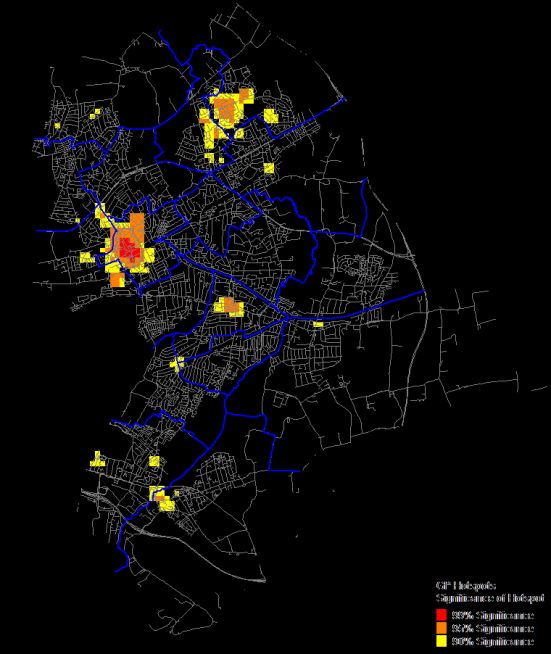
Havering Community Safety Partnership Strategic Assessment 2015                                                                 5

better than the reduction for England and Wales (-4.6%) although below that for London (-9.3%). Whilst the decline has
slowed in Havering during the previous 12-months, it should be noted that Havering has achieved more rapid declines than
both London and England and Wales, over the previous three years, reducing by twice as much.

Havering has lower rates of violence, serious                                      Rate of Offending By Category, 2014/15 Area Comparison
                                                          90.0
acquisitive crime and overall crime when compared                          85.5

to the London average, but higher than the average        80.0

for England and Wales. The overall rate of crime in       70.0
                                                                   64.2              64.4
Havering in 2014/15 was 64.4 per 1,000 residents,
                                                          60.0
marginally higher than the England and Wales
average of 64.2 and below the London average of           50.0

85.5, as shown in Figure 2.2.                             40.0

                                                                                                                                                       29.7
                                                          30.0
2.2 Police recorded crime summary                                                                                                           20.6                   21.8
                                                          20.0                                                  16.4
                                                                                                                          14.8
                                                                                                        9.7
The data table on the following page shows the            10.0

current trends for various categories of recorded          0.0
crime in Havering (Metropolitan Police Official Crime                     Crimes                      Serious acquisitive crime                    Violent crime
                                                                                             England & Wales     London          Havering
Data).
                                                         Figure 2.2 Rate of offences per 1,000 residents by category, ONS CSEW 2014/15

The table shows a variety of data including the volume of crime for each category, numerical and percentage changes over
rolling 12-month periods, proportionate breakdowns against the Havering total, short term direction of travel and how the
                                                              st                                            nd
rate of crime ranks among the 32 London boroughs, where 1 is the highest rate of offending (worst) and 32 is best. The
                                          st   th     th    th          th     th              th    nd
latter is shaded according to quartiles (1 to 8 red, 9 to 16 orange, 17 to 24 yellow and 25 to 32 green).

The column headed ‘% of TNO’ shows how each category of crime contributes to the volume of Total Notifiable Offences in
Havering. The biggest contributors to recorded crime in Havering in the rolling 12-months to September 2015 are Violence
against the Person (29.1%, 4,539 offences), Theft & Handling (24.0%, 3,741), Motor Vehicle Crime (13.3%, 2,083) and
Burglary (12.6%, 1,973). More serious crimes such as Rape (0.7%, 105), Child Sexual Exploitation (0.6%, 102) and Serious
Youth Violence (1.3%, 196) accounted for much less significant proportions of crime, although cause considerably more
harm to victims and communities (see section 2.5 Crime Harm Index). Crimes affecting businesses (Business Crime, which
includes all types of offending, with the main contributor being theft from shops) contributed to almost one in five (18.1%)
of crimes in Havering.

The column headed ‘variance’ highlights the numerical change in recorded crime in October 2014 to September 2015 when
compared with October 2013 to September 2014. The most significant reductions were recorded for burglary in a dwelling
(household burglary), 185 fewer offences, and theft from motor vehicles, 204 fewer offences. These have contributed
significantly to the overall reductions in serious acquisitive crime (burglary, vehicle crime and robbery). In the previous 12-
months there has also been a decline in the volume of domestic incidents with 249 fewer recorded. Domestic incidents are
expected to decline significantly in the current financial year as a result of improper use of code 304 (domestic incidents) by
999 call handling centres, which was being applied to all reports where disputes involved intimate partners and family
members, including those which by definition were not domestic abuse. The most significant increases were recorded for
violence against the person, 767 more offences, and robbery, 126 more offences.

The columns headed ‘% change’ show the change in volume of offences in October 2014 to September 2015 compared with
the previous two 12-month rolling periods. For the last two years there have been consecutive increases in the volume of
reported violence against the person, domestic abuse crimes, weapon enabled crime, sexual offences and robbery.
Amongst the largest percentage increases in the last 12-months are serious youth violence (81.5%), weapon enabled crime
(55.9%), personal robbery (51.8%), theft of pedal cycles (47.8%) and sexual offences (28.2%). A ‘direction of travel’ arrow is
also used to show change over the previous 12-months.

The final column indicates where Havering ranks among the 32 London boroughs in terms of rate of crime per 1,000
                                                                                                                          nd
residents. Child Sexual Exploitation is the only area where Havering ranks in the worst quartile for London, having the 2
highest rate behind neighbouring Barking & Dagenham. Havering’s rank has worsened for youth violence and serious youth
                                                             th                                        th
violence, moving into the second worst quartile, ranking 13 highest in London for both. Gun crime (13 ), Burglary Dwelling
   th                              th                        th
(13 ), Theft of Motor Vehicles (9 ), and Business Crime (9 ) are also in the second worst quartile for London. Despite an
increases of 46.8% in the last 12-months, rates of knife crime are in the lowest quartile.

Iain Agar, Havering Community Safety Partnership Analyst
Havering Community Safety Partnership Strategic Assessment
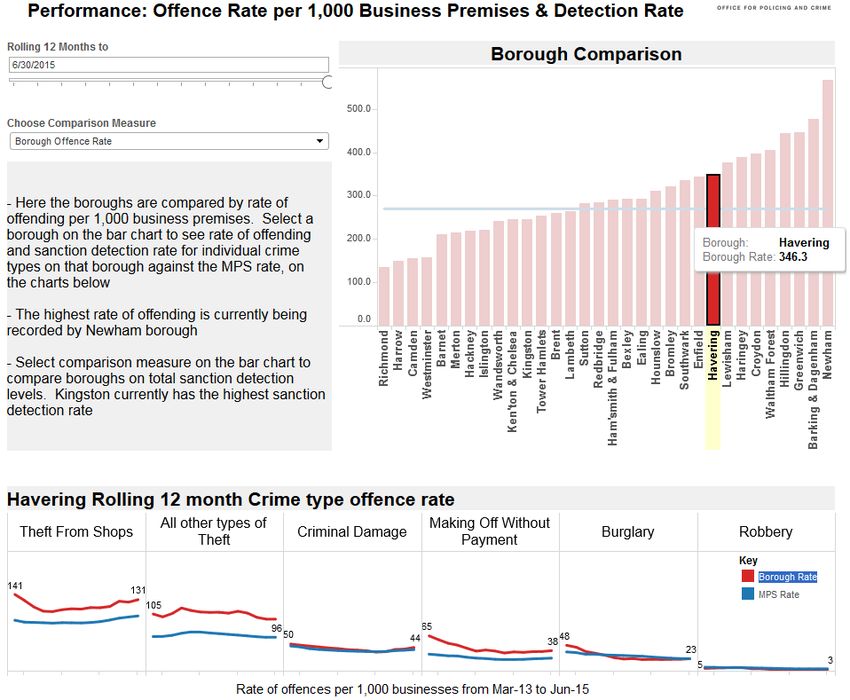
Havering Community Safety Partnership Strategic Assessment 2015                             6

Source: Metropolitan Police Recorded Crime

                               Oct 14     Oct 13                            % Change        % Change        Direction of    Rank of
                                                                  % of     (Oct-Sep 14-    (Oct-Sep 14-15      Travel      Rate MPS
                               to Sep-    to Sep-   Variance
                                                                  TNO      15 vs Oct-Sep   vs Oct-Sep 12-    12mnths       (1=worst)
                                 15         14                                13-14)             13)
 Violence with Injury          1,655      1,512        143        10.6          9.5            24.9                         23
 -of which Domestic Abuse       624        544          80         4.0         14.7            39.0                          18
 -of which Youth Violence       504        391         113         3.2         28.9            35.5                          13
 Violence without Injury       2,810      2,201        609        18.0         27.7            43.7                          28
 Offensive Weapon                70         66           4         0.4          6.1             1.4                         21
 Violence Against Person       4,539      3,772        767        29.1         20.3            35.8                          25

 Domestic Abuse Crimes         1,858      1,588        270        11.9          17.0           48.2                          19
 Domestic Abuse Incidents      3,621      3,870       -249        N/A           -6.4           11.9                          17
 VAWG*                           7          2            5        0.04         250.0           133.3             
 Domestic Abuse                5,486      5,460         26        N/A            0.5           22.1                          19

 Hate Crime                     281        260         21          1.8          8.1            20.1                          28

 Serious Youth Violence         196        108         88          1.3         81.5            86.7                          13

 Gun Crime                      52          26         26          0.3         100.0           23.8                          13
 Knife Crime                    185        126         59          1.2          46.8           20.1                          24
 Weapon Enabled Crime           237        152         85          1.5          55.9           20.9                          23

 Rape                           105         97          8          0.7           8.2           54.4                          26
 Other Sexual                   259        187         72          1.7          38.5           91.9                          21
 Sexual Offences                364        284         80          2.3          28.2           79.3                          22
 Child Sexual Exploitation      102         35         90          0.6         191.4          1600.0                         2

 Burglary Dwelling             1,442      1,627       -185         9.2         -11.4           -30.6                         13
 Burglary Non-Dwelling          531        533         -2          3.4          -0.4            -6.5                        27
 Burglary                      1,973      2,160       -187        12.6          -8.7           -25.4                         19

 Personal Robbery               334        220         114         2.1         51.8             4.7                          23
 Business Robbery               29          17          12         0.2         70.6            -14.7                         24
 Robbery                        363        237         126         2.3         53.2             2.8                          24

 Theft from M/V                1,063      1,267       -204         6.8         -16.1           -34.5                         29
 Theft/Taking of M/V            774        767          7          5.0          0.9             -6.1                          9
 M/V Interference               246        179         67          1.6         37.4            22.4                          20
 Motor Vehicle Crime           2,083      2,213       -130        13.3          -5.9           -21.3                         23

 Other Theft & Handling        2,115      2,176        -61        13.5          -2.8            -6.3                         25
 Theft from Shops              1,130       986         144         7.2         14.6            18.7                          15
 Theft of Cycle                 170        115          55         1.1         47.8             -1.2                         27
 Theft from Person              326        391         -65         2.1         -16.6           -14.0                         25
 Theft & Handling              3,741      3,668         73        24.0          2.0             -0.5                         26

 Business Crime                2,876      2,788        88         18.1         3.5              -1.9                          9
 Serious Acquisitive Crime     3,642      3,898       -256        23.3         -6.6            -25.3                         23

 Total Notifiable Offences     15,845     14,984       861        100.0         5.7            -2.2                          25

 *Sum total of Female Genital Mutilation, Forced Marriages, Honour Based Violence and Human Trafficking offences
 NB: No data is readily available locally for e-crime / cybercrime and fraud offences at a local level

Iain Agar, Havering Community Safety Partnership Analyst
Havering Community Safety Partnership Strategic Assessment 2015                                      7

2.3 Partnership data summary

The data table on the following page shows the current trends for various partnership datasets in Havering. This includes
Metropolitan Police Recorded Crime Data (abbreviated as MPS in the table), British Transport Police (BTP), Transport for
London (TfL), London Ambulance Service (LAS) and London Fire Brigade (LFB).

Similar to the crime data table in section 2.2, the table shows a variety of data including the volume of crime for each
category, numerical and percentage changes over rolling 12-month periods, short term direction of travel and how the rate
of crime ranks against the 32 London boroughs.

The largest volume of records is Anti-Social Behaviour and Disorder with 5,138 records in the 12-months to September
2015, of which 4,649 are logged by the Metropolitan Police. Criminal Damage (1,781), Alcohol Related illness/injury (1,569)
and Assault Patients (attended to by LAS, 791) were other major volume contributors. The columns headed ‘Variance’ and
‘Direction of Travel 12mnths’ highlight changes in the previous 12-months. Performance has differed across categories and
service areas. Overall anti-social behaviour and disorder, British Transport Police crime and Transport for London crimes
have recorded declines. Overall arson (recorded by the London Fire Brigade) and criminal damage have remained relatively
stable. Alcohol related crime, illness and injury have increased in the last 12-months, whilst the cumulative figures for drug
related deaths show a large percentage (although low numerical) increase.

The final column indicates where Havering ranks among the 32 London boroughs in terms of rate of crime per 1,000
residents. London Fire Brigade arson incidents and criminal damage recorded by Transport for London are the only areas
where Havering ranks in the worst quartile for London. Most indicators of partnership data were within the best quartile for
London, including overall anti-social behaviour and disorder, overall criminal damage, British Transport Police crime and
drug related deaths.

Figure 2.3 shows Havering rates of                          Rate of Offending/Incidents By Category, 2014/15 Area Comparison
incidents compared to London and         40.0                                         38.0
England & Wales for Alcohol Related
Crime, ASB and Criminal.                 35.0
                                                                                              32.0

                                         30.0
Havering (7.4) has a higher rate of
alcohol related crime than the
                                         25.0
national average (5.7), but is lower
than the average for London (8.6).       20.0                                                           18.9
                    rd
Havering ranked 23 of 32 London
boroughs for its rate of alcohol         15.0
related crime. For anti-social
                                         10.0                                                                             9.0
behaviour, Havering (18.9) has                               8.6
                                                                     7.4                                                         7.7
                                                                                                                                         6.4
significantly lower reported rates                   5.7
                                          5.0
than London (32.0) and England and
Wales (38.0). Finally, for criminal       0.0
damage, Havering (6.4) also has                     Alcohol Related Crime             Anti-Social Behaviour                Criminal Damage
lower rates than both the London                                            England & Wales    London          Havering
(7.7) and England and Wales (9.0)       Figure 2.3 Rate of offences/incidents per 1,000 residents by category, ONS CSEW 2014/15 and Local
averages.                               Alcohol Profiles for England 2014

Within London there is a discrepancy between perceptions of anti-social behaviour and reporting levels. The region has
amongst the highest perceptions of anti-social behaviour of all police forces in England and Wales, however, consistently
has average or lower than average rates of reported anti-social behaviour. In Havering we are discovering a number of anti-
social behaviour problems which arise due to complaints regarding service by residents, however, when research is
completed it has transpired that the anti-social behaviour problems had not previously been reported to either the
Metropolitan Police or officers within the local authority who deal with anti-social behaviour (i.e. Street Care, Housing and
Community Safety). This may be a reflection of wider concerns raised nationally about the effectiveness and knowledge of
the police non-emergency number 101. According to the latest Crime Survey for England and Wales more than half of the
respondents were unaware of the 101 number.

Iain Agar, Havering Community Safety Partnership Analyst
Havering Community Safety Partnership Strategic Assessment 2015                       8

Source: Metropolitan Police Recorded Crime & ASB, London Analyst Support Site (BTP, LAS, LFB, TfL Data Sets), Local Alcohol
Profiles for England (LAPE, Public Health England), Deaths related to drug poisoning in England & Wales by Office for
National Statistics

                                                                     % Change        % Change        Direction of    Rank of
                                Oct-14 to   Oct-13 to              (Oct-Sep 14-15   (Oct-Sep 14-15      Travel        Rate
                                                        Variance
                                 Sep-15      Sep-14                vs Oct-Sep 13-   vs Oct-Sep 12-    12mnths        London
                                                                         14)              13)                       (1=worst)
ASB & Disorder (BTP)               101        112          -11          -9.8             -7.3                        23
ASB (MPS)                         4,649      5,498        -849         -15.4            -40.0                         29
ASB & Disorder (TfL)               388        404          -16          -4.0            -15.5                        26
ASB & Disorder                    5,138      6,014        -876         -14.6            -38.2                         29

Criminal Damage (BTP)               37         30           7          23.3             27.6                          13
Criminal Damage (TfL)              128        184         -56          -30.4            -31.6                          2
Damage to Dwelling (MPS)**         335        291          44          15.1             12.0                          23
Damage to Vehicle (MPS)**          695        720         -25           -3.5             -5.3                         23
Damage Other (MPS)**               585        528          57          10.8             22.6                          23
Criminal Damage                   1,780      1,753         27           1.5              3.1                          26

Robbery                              2          1           1          100.0            -75.0                         24
Sexual Offences                      6          4           2          50.0             -53.8                         30
Theft                               77        105         -28          -26.7            -32.5                         29
Violence                            71         73          -2           -2.7            12.7                          24
Other Notifiable                    25         29          -4          -13.8            -35.9                         24
British Transport Police*          218        242         -24           -9.9            -18.0                         27

Alcohol Related                   1,569      1,423        146          10.3              4.2                          20
Assaults                           791        737          54           7.3              -5.7                         23
Gun/Knife/Weapon Injury             50         48           2           4.2             -12.3                         25
London Ambulance Service          2,410      2,208        202           9.1               0.3                         23

Deliberate Fires (Primary)          56         54           2          3.7              -8.2                          12
Deliberate Fires (Secondary)       120        122          -2          -1.6             16.5                           3
London Fire Brigade                176        176           0          0.0               7.3                           5

Fraud                              183        211         -28          -13.3            -38.0                         26
Robbery                              2          3          -1          -33.3            -33.3                         14
Theft                                0          4          -4         -100.0           -100.0                         31
Violence                            41         35           6          17.1             -12.8                         18
Transport for London*              354        437         -83          -19.0            -34.0                         23

Alcohol Related Crime***          1,791      1,775        16            0.9             -0.2                          23

Drug Related Deaths****            13          10          3           30.0             116.7                         22

*Includes Criminal Damage recorded by respective organisation
**Data is for the rolling 12-month periods between September and August
***Data used is 2012-13 and 2011-12, from the Local Alcohol Indicator Profiles for England
****Data used is 2012-14 and 2009-11 cumulative

Iain Agar, Havering Community Safety Partnership Analyst
Havering Community Safety Partnership Strategic Assessment 2015                                            9

 2.4 Reoffending, detections and outcomes data

 The table below shows the current trends for various datasets relating to reoffending, detection and punishment of crime
 in Havering. Data sources and all borough data broken down can be found in Appendix A.

 Proven Reoffending – Below are the official proven reoffending rates for Havering, where the rate of reoffending, rate of
 re-offences, and average number of previous offences follow a cohort over a 12-month period.

 For Adults, the Havering cohort increased by 124 offenders in the most recent available dataset, from 1,675 to 1,799.
 London wide there was a reduction of 215 adult offenders. Havering had one of the highest increases of all London
 boroughs. However, it should be noted that the rate of reoffending among adults in Havering overall (22.4%) is below both
 the London (25.1%) and England & Wales (25.3%) averages. The same is true for the average number of previous offences
 committed by adult offenders in Havering (7.65 compared to 9.47 in London and 13.59 in England & Wales).

 For Juveniles, Havering performed more closely with regional and national downward trends. There was a significant
 reduction in the number of offenders on the cohort (39% from 246 down to 150), which almost doubled the performance
 of London and England & Wales. This may be explained by a more rapidly falling sanctioned detection rate for offences with
 youth suspects, just 19.7% of crimes with a youth suspect were detected compared to 35.7% in the previous year. The
 reduction in reoffenders was 19.3% compared to 18% for London and 20% for England & Wales, whilst the reduction in
 reoffences was 12.8% compared to 12% in London and 16% for England & Wales. Juvenile reoffending rates and average
 numbers of previous offences were higher in Havering than both the London and England & Wales average.

 Source: Ministry of Justice                                                                                                Compared        Compared
                                                                                       Change               Change           against         against
                                              2013        2012       2011
                                                                                    (2013 vs. 2012)      (2013 vs. 2011)     National        London
                                                                                                                             Average         Average
 Adults: Number of offenders in cohort        1,799      1,675       1,848               124                     -49
 Adults: Number of re-offenders                403        378         388                 25                     15
 Adults: Number of re-offences                1,132      1,004       1,051               128                     81
 Adults: Re-offending rate                    22.4       22.6        21.0                -0.2                    1.4            Better        Better
 Adults: Average previous offences            7.65       8.47        7.13                -0.8                    0.5            Better        Better
 Juveniles: Number of offenders in cohort      150        246         367                -96                    -217
 Juveniles: Number of re-offenders              67         83         113                -16                     -46
 Juveniles: Number of re-offences              171        196         302                -25                    -131
 Juveniles: Re-offending rate                 44.7       33.7        30.8                11.0                   13.9            Worse         Worse
 Juveniles: Average previous offences         3.01       1.65        1.61                 1.4                    1.4            Worse         Worse

 Sanctioned Detections

 The table below shows the proportion of crimes by category which resulted in a sanctioned detection. Most crime recorded
 by police in Havering, London and nationally goes undetected. Overall in Havering 1 in 5 crimes were detected last financial
 year. Detection rates have fallen notably for violent crimes (Violence, Sexual Offences and Robbery) in recent years.

 Source: Metropolitan Police
                                         2014-15         2013-14        2012-13                 Change %               Change %            Compared
                                         Financial       Financial      Financial                Points                 Points           against London
                                          Year %          Year %         Year %             (14-15 vs. 13-14)      (14-15 vs. 13-14)        Average
Violence Against the Person                 27.2           36.0              36.3                 -8.8                   -9.1                Better
Sexual Offences                             14.3           20.0              23.2                 -5.7                   -8.9                Worse
Robbery                                     11.2           26.1              25.4                -14.9                  -14.2                Worse
Burglary                                    9.5            12.9              12.2                 -3.4                   -2.7                Better
Theft & Handling                            12.8           14.2              13.2                 -1.4                   -0.4                Better
Criminal Damage                             10.8           13.4              16.7                 -2.6                   -5.9                Worse
Total Notifiable Offences                   20.3           24.3              24.6                 -4.0                   -4.3                Worse

 Outcomes data is not readily accessible for all recorded crime beyond a national and regional level.

 Iain Agar, Havering Community Safety Partnership Analyst
Havering Community Safety Partnership Strategic Assessment 2015                                 10

2.5 Crime Harm Index
                                            1
The Cambridge Crime Harm Index (CHI ) has been used in this year’s assessment to improve understanding of harm from
crime. CHI research argues that higher volume crimes (such as criminal damage and theft) do not contribute to the most
harm in communities. Just a small percentage of crime is responsible for the greatest percentage of harm suffered by
victims and communities. CHI shows that when using a weighting based on sentencing structures, the crimes with the
greatest harm include wounding, robbery and sexual violence. These areas of crime account for just 15% of the total
volume of recorded crimes in Havering, but equate to 73% of crime harm.

Figure 2.4 shows that the greatest proportion of                      Top categories of recorded crime responsible for 76% of the crime count
crimes in Havering are other theft, wounding,
criminal damage, common assault and
harassment, shoplifting, vehicle crime and                                                                         Other Theft
                                                                                                                      13%
burglary. These crimes account for 76% of all
recorded crime in Havering during the previous
12-months. In broader categories criminal                                                                                        Wounding
                                                                                                                                   11%
damage, less serious violence and theft
contribute to most crime in Havering.                                            Theft/Taking of M/V
                                                                                         5%
                                                                                                                   Criminal Damage and Arson
                                                                                                                              10%

                                                                                   Theft From M/V
The CHI is based on the Criminal Justice System                            6%

sentencing guidelines. The principle is that not all                        Theft From
                                                                                                           Common Assault
                                                                              Shops
crimes are equal in terms of harm, e.g. 1                                      6% Burglary in a
                                                                                                               9%
                                                                                       Dwelling
homicide has a greater impact than 1 shoplifting                                         7%
                                                                                                Harassment
                                                                                                    8%

offence. To calculate the harm score, the number
of offences is multiplied by the harm score for
that crime type. Therefore, the weighting for arson without endangering life = 33 and for rape = 1825 – if an area records 10
arsons and 10 rapes, the harm score for arson is 330 (33x10) and for rape 18,250 (1825x10). This has been completed for all
                                                                   2
offences in Havering in order to calculate the ‘proportion of harm’ .

When the CHI is used to weight crime in                                         Top 5 harm crimes and their percentage of all harm
Havering, different categories of crime are
identified. The top harm categories were rape,
wounding, sexual assault, robbery and burglary in
a dwelling. The high harm categories have shown                                                                                  Rape
significant increases in recent years in Havering,                                                                               30%

particularly within domestic abuse and sexual
violence.
                                                                                 Burglary in a Dwelling
                                                                                           4%

The main point of discussion from considering                                      Robbery (personal)
crime counts and crime harms are about what                                              11%

crime should be prioritised by community safety
partnerships? The impact from high harm crimes                                                    Sexual Assault
                                                                                                                         Wounding
                                                                                                                           20%

is often longer lasting for both victims and                                                          12%

offenders, with evidence pointing to greater
recidivism, vulnerability, repeat victimisation and
repeat locations.

Although ASB isn't considered to be a serious crime, persistent ASB can result in significant harm to certain groups, such as
the older people and people living with disabilities. The level of harm caused to victims by ASB doesn’t always match the
perceived seriousness of the incident. Mental health, physical disability and repeat victimisation can all increase the risk of
                                                                                                               3
becoming a victim of ASB. ASB should be considered as a significant harm for community safety partnerships .

1
  Sherman, L. et al (2015) The Cambridge Harm Index
2
  Keay, S (2015) Lancashire Police strategic assessment technical report
3
  Ibid

Iain Agar, Havering Community Safety Partnership Analyst
Havering Community Safety Partnership Strategic Assessment 2015                                                                               11

3. Community safety problems

The following sections give a broad overview of all victims and targets, offenders, places and locations of crime, disorder
and anti-social behaviour incidents across Havering.

3.1 Victims and targets

This section identifies those people who are most vulnerable to crime and ASB, or alternatively where relevant, those
properties and products which are most sought after by offenders in Havering.

                                                      Age profile of victims in Havering                                                                                                    3.1.1 Age, gender and ethnicity
   1.4                                                                                                                                                                                300
                                                                                             % of all Victims                                                                               Figure 3.1 shows the age profile
                                                                                             Victim Population Index
   1.2                                                                                                                                                                                      of victims in Havering (based on
                                                                                             Victim Population Index is Proportionate to Resident Population                          250
                                                                                                                                                                                            the victim age on recorded crime
   1.0
                                                                                                                                                                                            reports from Oct-14 to Sep-15)
                                                                                                                                                                                      200   by volume and population index
                                                                                                                                                                                            score (whereby if the % victims is
   0.8
                                                                                                                                                                                            equally proportionate to the
                                                                                                                                                                                      150
                                                                                                                                                                                            population this equates to an
   0.6
                                                                                                                                                                                            index score of 100, which is
                                                                                                                                                                                      100   average). Any index score above
   0.4
                                                                                                                                                                                            100       equates      to      an
                                                                                                                                                                                            overrepresentation (higher than
                                                                                                                                                                                      50
   0.2                                                                                                                                                                                      average) by a particular age
                                                                                                                                                                                            group and any score below 100
   0.0                                                                                                                                                                                0     equates            to          an
          Age 5

                                                                                                                                                                         Age 90 and
                                    Age 20

                                                        Age 30

                                                                 Age 35

                                                                                    Age 45

                                                                                                                   Age 60

                                                                                                                                              Age 75
                  Age 10

                           Age 15

                                             Age 25

                                                                          Age 40

                                                                                                 Age 50

                                                                                                          Age 55

                                                                                                                            Age 65

                                                                                                                                     Age 70

                                                                                                                                                       Age 80

                                                                                                                                                                Age 85

                                                                                                                                                                                            underrepresentation (lower than
                                                                                                                                                                            over

                                                                                                                                                                                            average).
Figure 3.1 Age profile of victims in Havering, MPS CRIS Data Oct-14 to Sep-15
                                                                                          Crime victimisation rates are
above average for those aged 18 to 40 in Havering. The peak ages for victims early 20’s and early 30’s with victimisation
rates declining with age beyond this group. Those aged 20 to 30 are at the greatest risk of becoming victims of crime in
Havering generally, although this may vary by type of crime and location as will be discussed below. In the last 12-months
the index score has increased within the 30-39 age groups in Havering, particularly driven by higher volumes of recorded
violence with injury and domestic abuse.

Table 3.1 below shows the most vulnerable age groups for violent crime categories. Here vulnerable refers to those ages
which contribute to a disproportionate share of crime in comparison to their share of the total Havering population (where
average index scores exceed 150, one-and-a-half times more at risk than average).

The most vulnerable age group row highlights the broad age ranges whereby victims are at greater risk, whilst the
predominant age range highlights where the greatest percentage volume of victims are recorded. For example Personal
Robbery highlights the 14-20 ages as being most vulnerable, and the age group 10-24 accounts for approximately 55% of all
recorded robbery victims despite making up just fewer than 20% of Havering’s population.

Table 3.1 Vulnerable groups and ages for violent and personal crime categories in Havering (based on Metropolitan Police Crime
Recording Information System/CRIS data rolling 12-months to September 2015)
                                    Violence With
                      Domestic                            Serious          Violence          Personal        Sexual           Hate
   Crime Type                         Injury (Non
                        Abuse                            Wounding       without Injury       Robbery        Offences         Crime
                                          DV)
Most vulnerable
                       18-32 /                                                                               13-21 /
   age (Index                            12-25             16-30            16-30             14-20                          27-34
                        35-41                                                                                 30-35
      Score)
  Predominant
                        18-34            18-34             10-29            10-29             10-24           10-24          18-34
 age range (% of
                        (50%)            (53%)             (58%)            (43%)             (55%)           (48%)          (45%)
     victims)

Iain Agar, Havering Community Safety Partnership Analyst
Havering Community Safety Partnership Strategic Assessment 2015                            12

Since the last assessment there have been some changes in the most vulnerable age groups for violent crimes, generally
that victims in their late 20’s and early 30’s are appearing more prominently within the categories of serious wounding and
sexual offences, which may in part be influenced by changes in the way allegations are recorded by the Metropolitan Police.
With regard to sexual offences it may also be partially a result of historical allegations being recorded. Excluding domestic
abuse, around half of all violence, robbery and sexual offence victims are aged 10-29 despite only accounting for a quarter
of Havering residents. For robbery (29%) and sexual offences (33%), the largest single age group affected is those who are
10-17.

Table 3.2 provides similar information on victim ages for property and acquisitive crime categories within Havering.

Table 3.2 Vulnerable groups and ages for selected property / acquisitive offences in Havering (based on Metropolitan Police Crime
Recording Information System/CRIS data rolling 12-months to September 2015)
                          Burglary                                                  Theft from      Vehicle Crime     Vehicle Crime
    Crime Type                           Criminal Damage       Other Theft
                        (residential)                                                 Person         (Theft from)        (Theft of)
 Most vulnerable
                        30-44 / 50+            30-45              18-29            16-25 / 75+          25-50              20-35
 age (Index Score)
 Predominant age
                        30-44 / 50+            30-44              18-24               18-29             30-49              18-34
    range (% of
                        (30% / 47%)            (31%)              (10%)               (34%)             (42%)              (40%)
      victims)

With the exception of theft/taking of a motor vehicle and theft from the person, those under the age of 25 are at much
lower risk of being victims of acquisitive crimes or criminal damage. Those aged 30-44 are the most vulnerable in terms of
becoming victims of burglary, criminal damage and vehicle crimes overall. For other theft offences, victimisation rates are
the least linked to specific age groups, with index score being only marginally above average for the 18-29 age group. Theft
from person offences tend the youngest age groups (18-29, with a strong link to the night time economy) and oldest age
groups (60 and over, with a strong link to town centre day time ecomonies).

Figure 3.2 provides a breakdown of                                                Gender breakdown of victims in Havering
                                                                                                           Female   Male
victims by gender for selected
                                          Violence Against the Person   53%                                                       47%
categories of crime in Havering.
                                                     Domestic Abuse
Overall crime is divided near                                           77%                                                 23%

equally, with 52% of victims being                           Burglary   46%                          54%

female and 48% being male. There                    Criminal Damage     47%                    53%

are however notable variations by                        Other Theft    55%                    45%

crime type. For example, victims of                  Theft From M/V     30%              70%

domestic abuse (77%), sexual                   Alcohol Related Crime    51%        49%

offences (88%) and other theft                   Theft/Taking of M/V    27%       73%
person (66%) crimes were more                      Serious Wounding     32% 68%
likely to be female. In contrast,
                                                     Sexual Offences    88% 12%
serious wounding (68%), robbery
                                                  Other Theft Person    66% 36%
(74%), theft of and from motor
                                                          Hate Crime    47% 53%
vehicles (70-73%) was more likely
                                                            Robbery
to have a male victim.                                                  26% 74%

                                          Theft/Taking of Pedal Cycles 23% 77%

Vehicle crime victimisation rates                       0      1000     2000     3000      4000   5000      6000     7000

are of particular interest, given Figure 3.2 Gender breakdown of victims in Havering, MPS CRIS Data Oct-14 to Sep-15
that the breakdown of vehicle
owners (based on DVLA registrations in Havering) is almost 50/50 for males and females, yet males account for over 70% of
reporting victims. This may be down to the types of vehicles targeted for thefts of (i.e. mopeds and motorcycles in which
female ownership is only 10% of total) and theft from (i.e. work vans in which male ownership/usage is also significantly
higher than for females).

The Self-Defined Ethnic (SDE) appearance field was completed for victims in 60% of police crime records in Havering. The
data shown below provides a breakdown of victims using the 16 ethnic group categories for total notifiable crime. Figure
3.3 shows a breakdown of Havering victims of crime, by SDE, compared against the actual population ethnicity breakdown
based according to the 2011 Census. The largest ethnic group who report being a victim of crime in Havering are White

Iain Agar, Havering Community Safety Partnership Analyst
Havering Community Safety Partnership Strategic Assessment 2015                                                                   13

British, accounting for 76.3% of victims, marginally underrepresented against a total resident population share of 83.3%.

                        Victim Self-Defined Ethnicity, % of Havering Total Notifiable Offences                                                          There are no communities
                                                                                                                                                        in Havering which are
                         White - British                                                                                      76.3
                                                                                                                                     83.3               notably underrepresented
    White - Any other White background                 5.9
                                                 3.1                                                                                                    as victims for total
                         Black - African         3.4
                                                 3.2                                                                                                    notifiable crime; however,
     Asian - Any other Asian background      2.3
                                            1.1                                                                                                         there are disparities when
                Any other Ethnic group       2.0
                                           0.6
                                                                                                                                                        looking      at     specific
                         Asian - Indian      2.0
                                             2.1
                                                                                                                                                        categories of crime (see
     Black - Any other Black background      1.9                                                                                                        Table 3.3). For example,
                                           0.4
                                            1.6
                                                                                                                                                        Asian or Asian British
                      Black - Caribbean     1.2
                                            1.5
                                                                                                                                                        communities           were
                       Asian - Pakistani   0.6
                                                                                                                                                        underrepresented        for
                           White - Irish   0.8
                                            1.3                                                                                                         sexual offences and White
                    Asian - Bangladeshi    0.8
                                           0.4                                                                                                          British       or      Other
                                           0.6
             Chinese or Other - Chinese    0.6                                                                                                          communities           were
     Mixed - White and Black Caribbean     0.4
                                           0.8                                                                                                          underrepresented for hate
   Mixed - Any other Mixed background      0.4
                                           0.5
                                                                                                                                                        crimes.
        Mixed - White and Black African    0.2                                                              % Total Havering Crime Victims
                                           0.3
                 Mixed - White & Asian     0.1                                                  Communities which were
                                                                                                            % Total Havering Population
                                           0.5
                                                                                                overrepresented          as
                                0       10      20     30     40      50     60      70  80 90
                                                                                                victims of total notifiable
Figure 3.3 Self-defined ethnicity of victims in Havering, MPS CRIS Data Oct-14 to Sep-15
                                                                                                crime in Havering included
White Other (i.e. EU Accession countries or Eastern European – 5.9% of victims and 3.1% of residents), Black Other (1.9% of
victims and 0.4% of residents) and Asian Pakistani (1.5% of victims and 0.6% of residents). All Black and Minority Ethnic
Communities in Havering were significantly overrepresented as victims of hate crimes, whilst Asian or Asian British and
Black or Black British communities were both overrepresented as victims of other theft, theft person, and violence against
the person overall (see Table 3.3).

Table 3.3 Victim Index Score by crime and ethnic group in Havering (based on Metropolitan Police Crime Recording Information
System/CRIS data rolling 12-months to September 2015) – White Black Asian only, which account for 97% of Havering residents.
Ethnic Group / Crime Type
                                                                                              Other Theft

                                                                                                                                                                                    Hate Crime
                                                                                                                                                            Notifiable

                                                                                                                                                                         Domestic
                                                                                   Offences

                                                                                                                                             Violence
                                                                         Robbery
                                                              Criminal
                                                   Burglary

                                                              Damage

                                                                                                                               Vehicle
                                                                                                                  Person
                                                                                    Sexual

                                                                                                                                                                          Abuse
                                                                                                                               Crime
                                                                                                                   Theft

                                                                                                                                                              Total

Asian or Asian British                            187          147       199        78        166                  205           96          166             156           96       666
Black or Black British                            106          154       144        114       156                  179           97          168             144          140       554
White British or Other                             97          95         93        101       89                    88          100           94              95           99        39

3.1.2 Repeat Victimisation

The highest levels of repeat victimisation in Havering, identifiable from recorded crime data, are experienced by business
and retail venues. For example, just fewer than half of all retail premises who reported offences of shoplifting did so on
more than one occasion in the last 12-months. Those businesses which were most likely to report thefts were larger
national and regional stores, such as supermarkets and well-known high street chains. These businesses are more likely to
have the means to identify and report crime – such as CCTV and security guards. Smaller businesses, including local shops
and convenience stores, were unlikely to report repeat offending and in many cases would be less likely to have
mechanisms in place to prevent the incidence of crime.

It should be noted that the British Retail Consortium 2013 survey estimates that over 90% of customer thefts (shoplifting)
are not reported to the police, therefore the extent of repeat victimisation against businesses may be even greater. For a
breakdown of such victims / targets of crime in Havering, please refer to the sub-section Risky Facilities.

Figure 3.4 provides a breakdown of Repeat Victims data for Havering in the 12-month rolling period to August 2015.
Domestic Abuse is the area of crime whereby victims are most likely to have reported a repeat offence, with 29.5% of

Iain Agar, Havering Community Safety Partnership Analyst
Havering Community Safety Partnership Strategic Assessment 2015                                                               14

victims reporting repeat offences in Havering, compared to an average of 25.5% within London. Repeat rates of Domestic
Abuse were highest in boroughs with the highest proportion of White British residents. Anti-Social Behaviour was the next
highest category in terms of repeat victimisation, with 11.4% of callers being repeat callers in Havering. Crimes such as
Burglary (2.3%), Sexual Offences (3.5%) and Robbery (1.2%) had very low reported rates of repeat victimisation.

Havering overall had a                                      Repeat Victimsation Rate (%) by Crime/ASB Type Havering
repeat victimisation rate
                                                                                                                                            25.5
of 15.8% which was above                 Domestic Abuse
                                                                                                                                                    29.5
the London average of
                         th                                                                        10.4
13.0%, and ranked 6                 Anti-Social Behaviour
                                                                                                      11.4
highest of the 32 London
                                                                                        7.8
Boroughs. As highlighted,     Violence Against the Person
                                                                                          8.4

Domestic Abuse victims
                                                                           3.3
accounted      for     the              Criminal Damage
                                                                           3.2

majority of repeats, with
                                                                          2.7
                                         Sexual Offences
an average of 108 repeat                                                     3.5

victims per month in
                                                                        3.1
                                        Theft & Handling
Havering (118 per month                                               2.5

for all other crime types                                           1.7
                                                Robbery
combined). Havering also                                          1.2

had higher than average                                                     3.3
                                                Burglary
repeat victimisation rates                                            2.3

for anti-social behaviour                                                                                    13.0
                                                                                                                                                           London
                                Total Notifiable Offences                                                                                                  Havering
and sexual offences.                                                                                                   15.8

                                                            0.0                   5.0       10.0                15.0          20.0   25.0          30.0               35.0

                              Figure 3.4 Havering repeat victimisation rate for crime/ASB (MPS CRIS/CAD Data 12-months to Sep-15)

3.1.3 Hot Products / CRAVED items (Concealable, Removable, Available, Valuable, Enjoyable, and Disposable)

There have been significant changes in the longer term regarding the types of items stolen. Mobile phones continue to be
the most frequently stolen item with substantial increases in the volume stolen since 2008/09, coinciding with the mass-
uptake of smart phones. There is more desire than ever for more portable items, noted particularly in shifts of burglary
where once frequently taken items such as TV, Desktop Computers and Stereos have now been overtaken by Laptop
computers and jewellery. There is a wealth of evidence to support the theory that better security drives down thefts of
particular items, whilst the targeting of particular items by criminals is strongly linked to consumer demand and ownership
(see Opportunity/security as a driver of crime).

Table 3.4 gives a broad overview of the types of items most commonly stolen across selected crime types in Havering. The
percentage for each crime type relates to the proportion of crimes in which the stated property was taken. For example,
jewellery was taken in 28% of burglary dwelling offences and 11% of all acquisitive crimes. Some items are targeted across a
variety of crime types, for example cash is one of the most CRAVED items regardless of offence, whilst other items relate to
more specific crimes or targets, for example the theft of vehicle registration plates from motor vehicles.

In Havering, the most frequently stolen products are mobile phones (taken largely in other theft, street robbery and theft
person offences), jewellery (taken predominantly in burglary dwelling and street robbery offences); computers including
laptop, desktop and games consoles (taken predominantly in burglary dwelling offences) and personal documents or credit
cards (often contained within bags, purses and wallets during other theft and theft person offences).

The volume of items taken has declined year on year in line with reductions in higher volume acquisitive crimes such as
burglary and motor vehicle crimes, so for example there were 182 fewer laptop computers stolen in Havering during the
last 12-months compared to the same period three years ago, 143 fewer licence plates stolen from vehicles and 102 fewer
satellite navigations systems stolen predominantly from vehicles and from burglaries to a lesser extent.

Items which have increased in volume include food, alcohol and confectionary (resulting from rising shoplifting offences)
and fuel or petrol (resulting from making off without payment offences at petrol stations). Proportionately, and in volume

Iain Agar, Havering Community Safety Partnership Analyst
Havering Community Safety Partnership Strategic Assessment 2015                                                                                                                                                                                             15

        terms, there has been an increase in currency being taken in theft person and robbery offences.

                                Table 3.4 Type of Property Stolen by Crime Type, Havering Oct-14 to Sep-15 (Metropolitan Police CRIS Data)
                                                                               st                                    nd                                               rd                                                                     th                                                                         th
                   Crime Type                                               1                                        2                                            3                                                                     4                                                                          5
                                          Jewellery            Currency                Laptop                                                                                                                        PC                                                                      Mobile Phone
            Burglary (Household)
                                             28%                  24%                   11%                                                                                                                          8%                                                                          6%
                                          Currency         Hand/Power Tool           Pedal Cycle                                                                                                                   Alcohol                                                                     TV/DVD
          Burglary (Non-Dwelling)
                                             17%                  15%                   10%                                                                                                                          4%                                                                          3%
                                            Petrol           Mobile Phone             Currency                                                                                                                   Credit Card
               Other Thefts
                                             23%                  19%                   19%                                                                                                                         11%
                                           Mobile              Currency         Purse/Wallet/Bag*                                                                                                                 Jewellery
              Street Robbery
                                             33%                  31%                   13%                                                                                                                          6%
             Theft from Motor           Licence Plate          Currency          Hand/Power    Tool                                                                                                            Other MV Parts                                                                   Sat Nav
                  Vehicles                   26%                  14%                   13%                                                                                                                          8%                                                                            7%
                                           Mobile              Currency         Purse/Wallet/Bag*                                                                                                                Credit Card                                                                Driving Licence
             Theft from Person
                                             44%                  42%                   37%                                                                                                                         28%                                                                           11%
                                      Food/Groceries            Clothing               Alcohol                                                                                                                   Cosmetics                                                                  Mobile Phone
             Theft from Shops
                                             22%                  12%                    8%                                                                                                                          8%                                                                            4%
            Total of Acquisitive          Currency           Mobile  Phone            Jewellery                                                                                                              Purse/Bag/Wallet*                                                               Credit Card
                 Offences                    15%                  12%                   11%                                                                                                                          9%                                                                            6%
         *Includes other items, most frequently credit card, currency and driving licence

        Theft of mobile phones in the east London area (which includes Havering) predominantly relate to Apple iPhones,
        accounting for 57.0% of the total, with Samsung (predominantly Galaxy models) a distant second with 26.0%. When
        compared against the market share, Apple is the only mobile phone product which is overrepresented in terms of a target
        for theft (57% of thefts and 45% of market share). The more secure operating system iOS7 released in September 2013
        coincided with a decline in Apple mobile phone thefts of -31% over a 12-month period in London. However, in the 15-weeks
        post the release of iPhone 6 in September 2014 there was a surge in Theft Person offences of the new model of +31%.

        Figure 3.5 below show the most commonly stolen mobile phone handsets in Havering, and the most targeted vehicles for
        thefts of and from motor vehicles. In Havering almost two-thirds of mobile phones stolen were Apple iPhones (61%), with
        Samsung a distinct second accounting for just over a fifth (22%). In terms of vehicle makes and models, for theft from
        vehicles Ford makes were notably overrepresented as a target, accounting for 28% (despite only making up 13% of the UK
        vehicle market share). Of those, Ford Transit vans were the most commonly stolen from. For thefts/taking of motor vehicles
        Ford (42%) and Honda (predominantly motorcycles, 5%) were the most targeted makes. Ford Fiesta and Ford Transit vans,
        predominantly post 2005 models, combined accounted for 31% of all vehicles stolen in Havering.

                            Make of Mobile Phone Handsets Stolen in Havering                                                                                                             Make of Vehicles Stolen/Stolen From in Havering
                                                                                                                                  45.0
 70.0
          61.0                                                                                                                    40.0
 60.0
                                                                                                                                  35.0
 50.0                                                                                                                             30.0

 40.0                                                                                                                             25.0

                                                                                                                                  20.0
 30.0              27.0
                                                         22.0                                                                     15.0
 20.0                                                                                                                             10.0
                                14.0

 10.0                                        8.0                                                                                   5.0
                                                                    5.0
                                                                            3.0             3.0   3.0                    2.0
                                                                                                               1.0
                                                                                                                                   0.0
  0.0
                                                                                                                                                                                                   Nissan

                                                                                                                                                                                                                                                                                                                                               Piaggio
                                                                                                                                         Ford
                                                                                                                                                Vauxhaul
                                                                                                                                                           Mercedes

                                                                                                                                                                                   BMW
                                                                                                                                                                                         Peugeot

                                                                                                                                                                                                                                                                                                 Land Rover
                                                                                                                                                                                                                                                  Audi

                                                                                                                                                                                                                                                                                          Fiat

                                                                                                                                                                                                                                                                                                                        Volvo
                                                                                                                                                                                                                    Toyota
                                                                                                                                                                                                                              Renault

                                                                                                                                                                                                                                                          London Taxi
                                                                                                                                                                                                                                                                        Yamaha
                                                                                                                                                                                                                                                                                 Suzuki

                                                                                                                                                                                                                                                                                                                                        Mini
                                                                                                                                                                                                            Honda

                                                                                                                                                                                                                                        Citroen

                                                                                                                                                                                                                                                                                                              Hyundai

                                                                                                                                                                                                                                                                                                                                                         Other
                                                                                                                                                                                                                                                                                                                                Mazda
                                                                                                                                                                      Volkswagen
                                                                    Nokia
           Apple

                    I Phone 5

                                 I Phone 6

                                             I Phone 4

                                                                                                               LG
                                                          Samsung

                                                                            Sony Ericsson

                                                                                            HTC

                                                                                                  Blackberry

                                                                                                                          Other

                                                                                                                                                                                                                             Theft from                  Theft of

Figure 3.5 Stolen property data, phones and vehicles targeted in Havering, MPS CRIS Data Oct-14 to Sep-15

        An area to note, where local and sub-regional data was unavailable, is financial fraud (credit and bank cards). Whilst debit
        and credit cards were often lost during other theft and theft person offences, bank card crime has actually been overtaken
        by card not present crime, where e-payments are facilitating fraud. Victim data is not readily accessible for Havering.

        Iain Agar, Havering Community Safety Partnership Analyst
Havering Community Safety Partnership Strategic Assessment 2015                                                                                                                           16

Internet and cybercrime information and threat assessments also are unavailable at a local level, for example, online child
sexual exploitation, payment fraud, criminal finance and communication online and data breaches.

Most goods and items are disposed through multiple avenues such as second hand stores and pawnbrokers, fences, and
street traders, the internet and legitimate businesses looking to maximise profits. Stolen property markets and the disposal
of stolen items is a key cross-cutting area of crime.

Another area to note, although not                        Property Damaged during Havering Criminal Damage and Arson Crimes
specifically hot products, is the type 900                            Damage to Dwelling          Damage to Vehicle Other Damage
of property targeted by vandals or 800
property destroyed during offences
of criminal damage in Havering. 700                  Large proportion of damage to vehicle
                                                     affects the body of the vehicle (i.e. denting)                  Other items which are recorded within
Figure 3.6 provides a breakdown of 600               and paintwork (i.e. scratches)                                  other categories include a number of
                                                                                                                     household items and belonging damaged
the property recorded as being 500                                                                                   within dwellings, including mobile phones,
                                                                                                                     mirrors, TV/DVD equipment and electrical
damaged in Havering criminal                                                                                         items, furniture and computers

damage offences. A significant 400
volume of crimes (31%) are recorded 300
without inputting the property field, 200
predominantly damage to motor
vehicle offences (shown as red and 100
rising to over 75% for all damage to      0

                                                                                                                              Oth MV Part/Access
                                                                                                               Fence

                                                                                                                       Wall
                                                                           Window

                                                                                    Door
                                                            Not Recorded

                                                                                           Property-other/NK

                                                                                                                                                                      Gate

                                                                                                                                                                             Other Building/Part
                                                                                                                                                   Plant/Tree/Shrub

                                                                                                                                                                                                   MV Window/W`screen

                                                                                                                                                                                                                        Other (65 variables)
vehicle offences) – these offences
include a number of reports where
the bodywork/paintwork has been
dented or scratched. The Crime
Survey for England and Wales (2014) Figure 3.6 Property damaged in Havering, MPS CRIS Data Oct-14 to Sep-15
found that 63% of all damage to
vehicles involved some form of damage to bodywork. Often it is unknown whether or not the damage was deliberate and
committed with criminal intent, or accidental.

A further 18% of criminal damage offences involve a window being damage, often a dwelling window or garage / shed or
business address window; and 10% involve damage to a door, internal or external doors of dwellings and non-dwelling. All
other items damaged account for less than 5% each with over 65 variables. A significant proportion of items which are
reported as criminally damaged are household items and belongings such as mobile phones, furniture and electrical goods
which have been damaged in homes. There is a concern that certain reporting and investigating methods are open
significant abuse by people who wish to make false reports for insurance reasons (for example, telephone investigations).

3.1.4 Risky facilities and environments

Most crime in Havering is recorded as occurring at the victims place of residence (38%), for example a burglary, sexual
offences or violence (domestic violence for example), criminal damage (a dwelling window, door or wall) or harassment
(which could be done via malicious communications online or via phone, although the location would be recorded as the
victim home address). More than a quarter (27%) of crime took place in an open public space (predominantly in the street,
but also including parks for example) and similar proportions occurred in business, retail and service industry venues (27%).
Table 3.5 provides a breakdown for acquisitive crime (burglary and theft and handling), violent crime (robbery, sexual and
violence against the person) and total notifiable crime.

Table 3.5 Venue location description for crime recorded in Havering (based on Metropolitan Police Crime Recording Information
System/CRIS data rolling 12-months to September 2015)
Location Type                                    Acquisitive Crime (%)       Violent Crime (%)        Total Notifiable Crime (%)
A place of residence                                       35                        41                           38
Business, retail and service industry                      37                        19                           27
Street or public open space                                21                        34                           27
Other (i.e. hospital, school, police station)               7                         6                            8

Facilities and environments with specific functions, for example a variety of shops, services, businesses and extending to

Iain Agar, Havering Community Safety Partnership Analyst
Havering Community Safety Partnership Strategic Assessment 2015                                                                                                                                                                                                                                                                                                                                                                                                                                           17

transport hubs, in Havering were the setting for over a quarter of all recorded crime in the 12 months rolling to September
2015. The reporting and recording of these offence categories varies by type with many of these facilities experiencing
more crime than is actually recorded. For example, of every 100 shoplifting calls made to police only 50-60% are recorded
as crimes, this rises to over 70% for motor vehicle crimes and over 95% for offences of burglary and robbery.

                                                                                                                                                       No. Offences Per Business in Havering                                                                                                                                                                                                                                                                                                                                        Violence Against the Person
                                                                 Day-Time Economy (mainly acquisitive crime)                                                                                                                                                                                                                                                                                                                                                                                                                        Theft and Handling
      600
                                                                                                                                                                                                                                                                                                                                                                                                                                                                                                                                    Sexual Offences
                                                                                                                                                                                                                                                                                                                                                                                                                                                                                                                                    Robbery
      500                                                                                                                                                                                                                                                                                                                                                                                                                                                                                                                           Other Notifiable Offences
                                                                                                                                                                                                                                                                                                                                                                                                                                                                                                                                    Fraud or Forgery

      400                                                                                                                                                                                                                                                                                                                                                                                                                                                                                                                           Drugs
                                                                                                                                                                                                                                                                                                                                                                                                                                                                                                                                    Criminal Damage
                                                                                                                                                                                                                                                                                                                                                                                                                                                                                                                                    Burglary
      300

                                                                                                                                                                                                                                                                                                                                                                                                                                                                                                                                                                                                 Petrol Theft
      200
                                                                                                                                                                                                                                                                                                            Night-Time Economy (mainlyviolence)

      100

        0

                                                                                                                                                                                                                                                                                                                                                                                                                                                                                                                                                          Queens Hospital

                                                                                                                                                                                                                                                                                                                                                                                                                                                                                                                                                                                                          Texaco Petrol Stations
                                                                                                                                                                                                                                                                                                                                                                               Goose Public House
                                                                                                                                                Primark Stores Ltd

                                                                                                                                                                                                                                                                                                                                                                                                    Yates Wine Lodge Public House

                                                                                                                                                                                                                                                                                                                                                                                                                                                                                                                                    Metropolitan Police
                                                                                                                                                                                                 Marks & Spencer Plc

                                                                                                                                                                                                                                                                                                                                          Kosho Nighclub
            Superdrug Stores Plc

                                                                                                         Next Retail Ltd

                                                                                                                                                                                     B & Q Plc

                                                                                                                                                                                                                                                                                                                                                                                                                                                                                                                                                                                                                                                          BP Petrol Stations
                                                       TK Maxx

                                                                                                                                                                                                                                                Co-operative Stores
                                                                                    Carphone Warehouse

                                                                                                                                                                                                                                                                                                                                                                                                                                    Missoula Nightclub
                                                                                                                                                                                                                       Boots the Chemists Ltd

                                                                                                                                                                                                                                                                                                                                                                                                                                                         McDonalds Restaurants Ltd

                                                                                                                                                                                                                                                                                                                                                                                                                                                                                                                 National Express
                                                                  Asda Stores Ltd

                                                                                                                                                                                                                                                                                                    Tesco

                                                                                                                                                                                                                                                                                                                                                                                                                                                                                                                                                                                                                                   Esso Petrol Stations
                                   Iceland Foods Plc

                                                                                                                           Aldi Foodstore Ltd

                                                                                                                                                                                                                                                                      Sainsburys Supermarkets Ltd

                                                                                                                                                                                                                                                                                                                                                                                                                                                                                     Fiction & Cameo Nightclub
                                                                                                                                                                                                                                                                                                                                                           Circuit Nightclub
                                                                                                                                                                     Debenhams Plc

                                                                                                                                                                                                                                                                                                            The Worlds Inn Public House

                                                                                                                                                                                                                                                                                                                                                                                                                                                                                                                                                                            Collier Row Service Station
Figure 3.7 Offences by business venue in Havering, MPS CRIS Data Oct-14 to Sep-15

Types of facilities which attract or generate high volumes of crime include petrol stations, department stores and
supermarkets, late opening licenced venues within
the night time economy and collectively
educational establishments for example. Figure 3.7
highlights some of the business venues which
report the highest volume of crimes in Havering.
There are 30 businesses shown in the chart, which
combined are the setting for 16% of all recorded
crime in Havering and 42% of all crime recorded at
facilities/venues. These are grouped on the chart
as ‘Day-Time Economy’ (offences predominantly of
theft occurring during core business hours of 9am-
6pm),      ‘Night    Time     Economy’     (offences
predominantly of violence occurring mainly from
10pm-4am) and ‘Petrol Theft’ (high volume
locations for petrol drive off offences reported and
recorded in Havering).

Infinite factors will contribute to the volume of
crime reported by each named business, such as
number of individual venues, footfall, floor space,
accessibility and so on, therefore this should not                                                                                                                                                                                       Figure 3.8 MOPAC Business Crime data dashboard to June 2015

Iain Agar, Havering Community Safety Partnership Analyst
Havering Community Safety Partnership Strategic Assessment 2015                                    18

interpreted as a list of the ‘worst’ contributors. An index score would provide a more accurate indication as to which
premises are the riskiest; however, data needed to perform this analysis is unavailable.

Rates of crime affecting businesses overall are higher in Havering, particularly customer thefts (shoplifting) and making off
without payment (petrol theft) offences. Figure 3.8 shows comparator data for Havering and London, as taken from the
MOPAC Business Crime Dashboard. The bar chart shows that rates of crime against businesses are above the borough
                                                 th
average across London, with Havering ranking 9 highest (346 crimes per 1,000 businesses). Rates are considerably above
average for theft from shops (131 in Havering compared to 101 in London), other thefts (96 compared to 62) and making
off without payment (38 compared to 24). Burglary, criminal damage and robbery rates against businesses were
comparable with the London average.

3.1.5 Fears and perceptions

It is not just crime that drives fear. A range of physical and social disorders can impact on feelings of safety (i.e. signal crime
perspective and incivility theories, ‘Broken Windows’). Minor crime (graffiti) and anti-social behaviour create messages that
are destructive to communities causing fear, worry and anxiety and a belief that the area is degenerating. As shown in
Figure 3.9, recorded levels of crime potentially has one of the smallest impacts on fear of crime.

The Metropolitan Police commission a quarterly Public Attitude
Survey (PAS), which gauges the opinions of approximately 400
residents per borough, per year, on topics including worry about
crime and anti-social behaviour, police effectiveness and
engagement.

A summary of some of the questions pertaining confidence found
that people in Havering had better perceptions to London as a
whole. Almost three-quarters of respondents in Havering (71%,
compared to 66% for London) were confident that the police
were doing a good job, whilst marginally more respondents in
Havering felt that the police provided a visible policing presence
(55%, compared to 54% for London).

Whilst perceptions of confidence were better than average in Figure 3.9 Fear of crime diagram, Paul Richards UCL
Havering, and much improved on this time last year (71% up from 58%), responses relating to drivers of confidence were
below the London average. For example, respondents in Havering were less likely to agree that police understand issues
                                                                                                           affecting     the    local
                                             How much of a problem in your area is? (% problem)
                                                                                                           community            (73%
 Rubbish or litter lying around on the street                                            23
                                                                                                  30       compared to 77% in
                                                                                                     34
                                                                                                           London), that police deal
                             Crime generally
                                                                                         23
                                                                                                        40 with things that matter to
                                                                                               26
                                                                                                           the community (71%
                                                                             18
                          Drug use or dealing                                               25
                                                                                            25
                                                                                                           compared to 73% in
                                                                                                           London) and that police
                                                                       14
                                       Gangs                8
                                                                                      21                   can be relied upon to
                                                                       14
                                                                                                           deal with minor crimes
    People being drunk or rowdy in public                                       19
                                                                                   20                      (61% compared to 66% in
                                                                    13                                     London).
  Teenagers hanging around on the street                                                             19
                                                                                                          20

 Vandalism, graffiti and deliberate damage
                                                                           10
                                                                                                16
                                                                                                                                             When      asked     about
                                                                                           14
                                                                                                                                             perceived       problems,
           Anti-Social Behaviour generally
                                                                  8
                                                                                11
                                                                                                                                             respondents in Havering
                                                                                      13
                                                                                                                                             were less likely to think
          Noisy neighbours or loud parties
                                                                  8
                                                                           10                                                                that something was a
                                                                                      13
                                                                                                                                             problem in their area
                                             0            5           10                   15        20        25        30   35   40   45
                                                                                                                                             than when compared to
                                                 Havering Jun-Jul 14/15              Havering Jun-Jul 13/14     London
                                                                                                                                             London as a whole
Figure 3.10 Havering Public Attitude Survey responses Q1 2015/16

Iain Agar, Havering Community Safety Partnership Analyst
You can also read