Surface Water Flood Forecasting - Flood Forecasting on Trunk Roads Transport Scotland - The ...
←
→
Page content transcription
If your browser does not render page correctly, please read the page content below
Surface Water Flood Forecasting
Flood Forecasting on Trunk Roads
Transport Scotland
March 2020
Notice
This document and its contents have been prepared and are intended solely as information for Transport
Scotland and use in relation to Final for ISSUE
Atkins Limited assumes no responsibility to any other party in respect of or arising out of or in connection with
this document and/or its contents.
This document has 51 pages including the cover.

Document history
                                                 Origin-
  Revision          Purpose description           ated     Checked     Reviewed      Authorised         Date
 Rev 0.2         For Comment                     MSH          RT          EG                        03/06/2019
 Rev 1.0         Final for Issue                 MSH          RT          RW             RT         25/03/2020

Client signoff
 Client                     Transport Scotland
 Project                    Surface Water Flood Forecasting
 Job number                 5152195

 Client signature /
 date

Contains sensitive information
Doc-001 | 1.0 | March 2020
Atkins | Flood Forecasting Final Report V2.0                                                              Page ii of li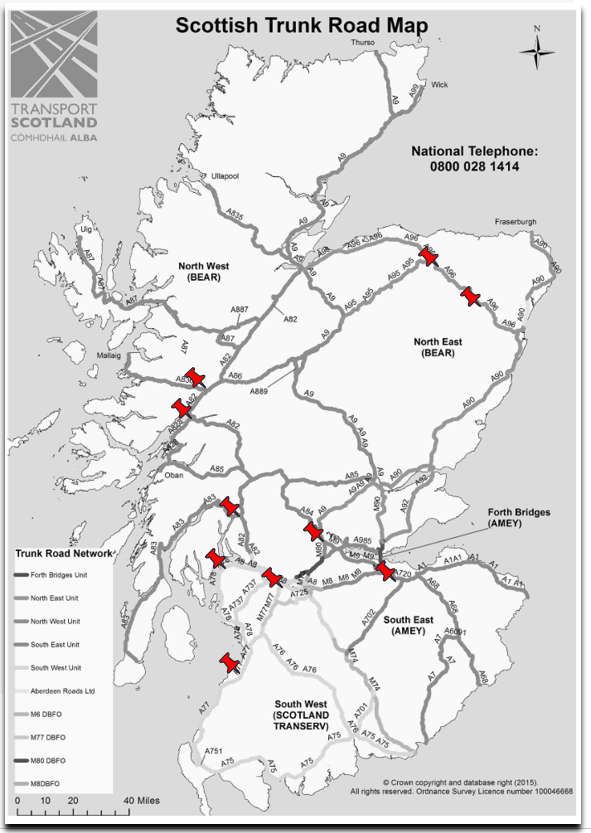
Contents
Chapter                                                                     Page
Glossary and Abbreviations                                                     1
1.       Introduction                                                          1
2.       Background                                                            2
2.1.     Flood Risk Management Act, 2009                                       2
2.2.     Flood Hazard Maps                                                     2
2.3.     National Flood Risk Assessment                                        3
2.4.     Flood Forecasting                                                     3
3.       Flood Risk Impact to Trunk Roads                                      5
3.1.     Operating Company Incident Data Analysis                              9
3.2.     Climate Change                                                       11
4.       Flood Forecasting                                                    14
4.1.     What is flood forecasting                                            14
4.2.     What are the benefits                                                14
4.3.     What flood forecasting for surface water currently exists            15
4.4.     The CREW Study                                                       17
5.       Requirements of a flood forecasting system                           24
5.1.     Operational Requirements from TS                                     24
5.2.     Operational Requirements from the Road Maintenance Operators         26
5.3.     Summary                                                              26
6.       Next stages                                                          30
6.1.     Approach to flood forecasting surface water                          30
Bibliography                                                                   1

Appendices                                                                     2
Appendix A.                                                                    3
A.1.     Table of Incidents Recorded per Trunk Road (Scotland)                 3
Appendix B.                                                                    6
B.1.     Questionnaire for Operating Companies                                 6
Appendix C.                                                                    7
C.1.     Shanghai Case Study:                                                  7
C.2.     Poland Case Study                                                     9
C.3.     Review of EWS Worldwide Study                                        10

Tables
Table 2-1 - Flood Risk Scenarios                                               2
Table 3-1 - ClimateXChange Road Network at Risk of Flooding                    5
Table 3-2 - Available Data                                                     9
Table 3-3 - Flooding Hotspot Locations                                        10
Table 3-4 - Trunk Road with Highest Predicted Flooding Exposure               12
Table 4-1 - Summary of Case Studies from the UK and the Rest of the World     15

Contains sensitive information
Doc-001 | 1.0 | March 2020
Atkins | Flood Forecasting Final Report V2.0                                       Page iii of li
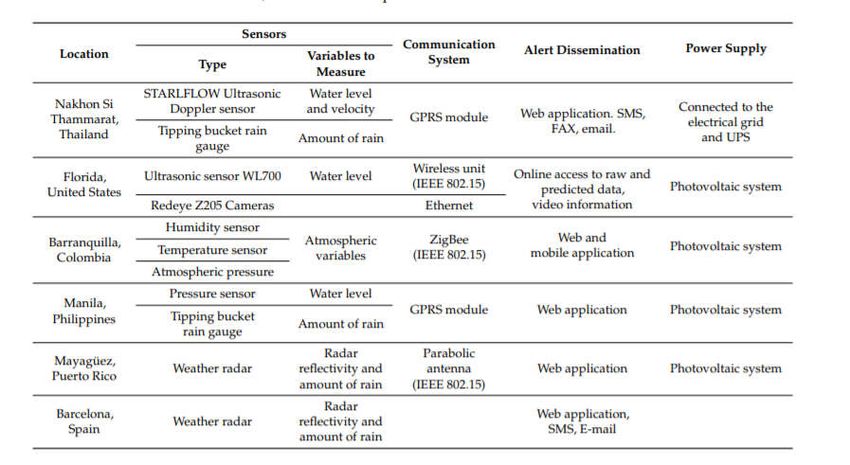
Table 5-1 - Recommended Action to Define and Establish a Transport Scotland FREWS.            27

Figures
Figure 2-1 - Location of Existing and new Flood Warning Schemes                                4
Figure 3-1 - Total Incidents Recorded per Region/Operating Company                             6
Figure 3-2 - Total Incidents Recorded per Trunk Road                                           7
Figure 3-3 - DRAT Assessment Tool                                                              8
Figure 3-4 - Trunk Road with Highest Predicted Flooding Exposure                              12
Figure 4-1 - Overview of the forecasting process and examples of probabilistic outputs produced for pilot study
(CREW, 2015)                                                                                 21
Figure 5-1 - Key Areas of Flood Risk Management                                               27
Figure A-1 - Research framework of Pluvial Flood Risk Assessment (PFRA)                        9
Figure A-2 - Instruments, communication protocols and alert dissemination                     12

Contains sensitive information
Doc-001 | 1.0 | March 2020
Atkins | Flood Forecasting Final Report V2.0                                                          Page iv of li
Executive Summary

Flooding on the trunk roads network in Scotland have significant disruption and costs to economy and society,
as well as being a cause of potential roads infrastructure damage during severe flooding events. According to
the new UK Climate Projections released in 2018 by the Met Office & Environment Agency, Scotland in
particular has had an 11% increase in average annual rainfall over the most recent decade, with projections of
even greater rainfall intensity and duration which can contribute to more flooding events.
Fluvial and coastal flood forecasting approaches have been traditionally employed in Scotland to mitigate the
effects of flooding in areas that interact with fluvial or tidal reaches, however surface water forecasting is not as
well researched or trialled due to the complexity of this type of flood modelling. A trial of this was conducted by
SEPA’s Scottish Flood Forecasting Service on a small study area in Glasgow during the 2014 Commonwealth
Games held in the city, with a successful outcome of providing adequate warning for anticipated surface water
flash flooding with a 24 hour lead time.
Atkins was appointed by Transport Scotland to investigate the feasibility and benefits of a pluvial flood
forecasting system for the trunk road network. This comprised of a literature review of published research on
flood forecasting system case studies in the UK and worldwide, an assessment of the methodology and
lessons learned from the 2014 Commonwealth Games flood forecasting as well as a desk study using data
supplied by Transport Scotland to determine trial areas for where such a tool would be of most benefit.
A GIS methodology was applied for the hotspot analysis with data provided by Transport Scotland from an in
house tool called Disruption Risk Awareness Tool (DRAT) as well as historical incident data from roads
Operation Companies that are responsible for the maintenance of the trunk roads network. These datasets
were geolocated and compared against the SEPA national pluvial flood hazard maps and mapping provided
from a previous study by AECOM on the impact of climate change on Transport Scotland’s roads network.
Road gradient data was used to determine where pooling was likely to be most severe. Ten locations were
identified as areas that would have a high likelihood of being impacted by surface water flooding from this
analysis.
The main conclusion reached from the subsequent literature review of international and local case studies of
roads flood forecasting showed that there is no precedent for large scale pluvial flood forecasting due to the
localised nature of flood events. Localised early warning systems are in use in multiple countries, primarily in
urban hotspots and using on-site telemetry which can be a costly in terms of up-front capital outlay and ongoing
maintenance costs. Examples of large scale pluvial flood modelling for flood forecasting are lacking, and small
scale models can be processor and data hungry as modelling for this can be complex. Examples of pluvial
flood modelling is often not real-time, and sufficient past flood data or local knowledge is required for calibration
to ensure model accuracy.
The 2014 Commonwealth Games flood forecasting was also observed to be of a small study area, with
intensive skilled manpower, data and IT infrastructure as well as coordinated communication efforts between all
stakeholders for the event. This study concludes with some actions and recommendations for Transport
Scotland to define a scope and a strategy for implementing a surface flood forecasting tool, given the common
limitations and required inputs from case studies of such forecasting systems. Data collection specifications,
data requirements and consultation with other stakeholders, targeted decision making on level of investment
into such a tool and further research on appropriate communication methods for an Early Warning System are
recommended to be able to create a system that would serve Scottish needs unique to its geography and
climate for the future.

Contains sensitive information
Doc-001 | 1.0 | March 2020
Atkins | Flood Forecasting Final Report V2.0                                                               Page v of 51
Glossary and Abbreviations
 Abbreviation                        Description
 CEH                                 Centre for Ecology and Hydrology
 CREW                                Centre for Expertise in Water
 DBFO                                Design-Build-Finance-Operate
 DMRB                                Design Manual for Roads and Bridges
 DRAT                                Disruption Risk Assessment Tool
 EWS                                 Early Warning System
 FEWS                                Flood Early Warning System
 FREWS                               Flood Risk Early Warning System
 FRM                                 Flood Risk Management
 GIS                                 Geographic Information Systems
 NWP                                 Numerical Weather Prediction
 OC                                  Operating Companies
 SEPA                                Scottish Environment Protection Agency
 SRRB                                Strategic Roads Research Board
 STEPS                               Short Term Ensemble Prediction System
 NERC                                National Environment Research Council
 NFRA                                The National Flood Risk Assessment
 TS                                  Transport Scotland
 UKCP18                              UK Climate Projections 18
 UKV                                 UK Variable

Contains sensitive information
Doc-001 | 1.0 | March 2020
Atkins | Flood Forecasting Final Report V2.0                                  Page 1 of 51
1. Introduction
Transport Scotland through the Strategic Roads Research Board (SRRB) appointed Atkins Limited to
determine the merit and benefits of a flood warning tool that can be applied to surface water flood hazards on
the trunk road network.
The aim of this study is to:
Understand the flood risk to the current Trunk Road network from surface water flooding;
Understand the operational response to flooding on the Trunk Road;
Draw from experiences from the rest of the world;
Investigate how an existing surface water forecasting system can be developed;
Understand what information from a forecasting tool would be beneficial; and
Make recommendation on the way forward.
A key element of the study has been engagement and collaboration with the Scottish Environment Protection
Agency (hereon referred to as SEPA) Flood Unit. Their input, suggestions and contributions to this report have
been very valuable.
Transport Scotland have provided the following data, which will be utilised as part of the study.
SEPA Flood Maps;
Operating Companies flood incident data for 2016-2018;
Road gradients for the Trunk Road Network;
Centre of Expertise for Waters (CREW) ,2015 Surface Water Flood Forecasting for Urban
Communities report; and
AECOM, 2016, Potential Impacts of Climate Change on the Trunk Road Network.
Contains sensitive information
Doc-001 | 1.0 | March 2020
Atkins | Flood Forecasting Final Report V2.0 Page 1 of 51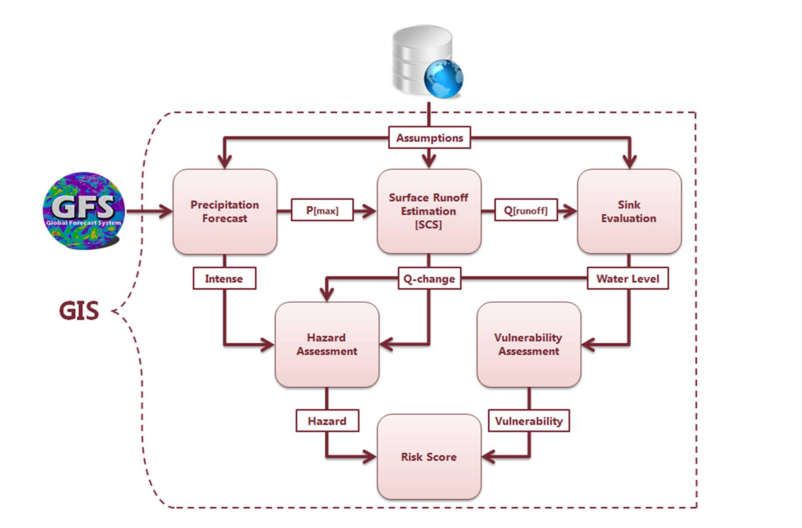
2. Background
2.1. Flood Risk Management Act, 2009
The impacts of flooding are well documented and are often devastating regarding the cost of repairs, replacement
of damaged property and loss of business. The Scottish Government is working to create a sustainable approach
to flood risk management and the impact of climate change, through the implementation of the Flood Risk
Management (Scotland) Act 2009.
The Act introduces a sustainable approach to flood risk management taking into consideration the impact of
climate change. It creates a joined up and coordinated process to manage flood risk at both national and local
level. SEPA are the overarching authority and have a strategic role for flood risk management, including flood
warning systems. SEPA are working closely with local authorities, Scottish Water, and other responsible
authorities to deliver flood risk management planning in Scotland.
Transport Scotland is not specifically named within the FRM, however the Act requires all responsible
authorities to act with a view to achieving the objectives set out in flood risk management plans, and to have
regard to the social, environmental, and economic impact of the exercise of those functions in the Act. In
particular, the act requires responsible authorities to deliver the following.
• Act in the way best calculated to manage flood risk in a sustainable way;
• Promote sustainable flood risk management;
• Act with a view to raising public awareness of flood risk;
• Act in the way best calculated to contribute to the achievement of sustainable development; and
• So far as practicable, adopt an integrated approach by co-operating with each other so as to co-
ordinate the exercise of their respective functions.
Key outputs of the FRM act, which will enable a sustainable approach to flood risk are:
Flood mapping of the hazards;
National flood risk assessment; and
Flood forecasting.
2.2. Flood Hazard Maps
A key milestone within the FRM Act was the development and production of flood hazard and risk maps. The
maps include Fluvial, Coastal and Surface Water flooding, providing a likelihood of flooding from high to low.
The maps are viewed as a tool to support flood risk management decisions, land-use planning and to help raise
public awareness.
Flood risk is reported for the following incidences High, Medium and Low. Table 2-1 relates the scenarios to
likelihood of flooding incidence.
Table 2-1 - Flood Risk Scenarios
Likelihood Return period in years Annual Exceedance Probability
Low 1 in 1000 chance 0.1
Medium 1 in 200 chance 0.5%
High 1 in 10 chance 10%
Contains sensitive information
Doc-001 | 1.0 | March 2020
Atkins | Flood Forecasting Final Report V2.0 Page 2 of 51
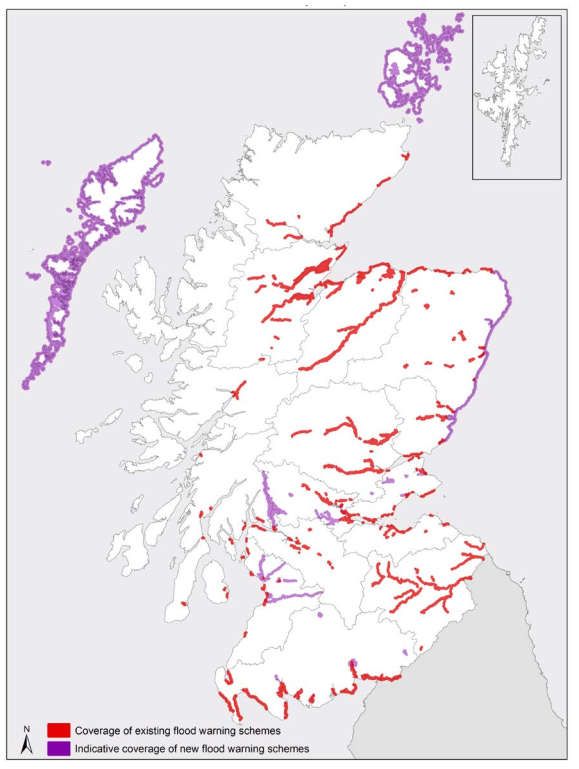
As part of this study Transport Scotland and SEPA provided access to the flood hazard maps, and these have
been reviewed to understand the potential extent of surface water flooding on the trunk road network.

2.3.          National Flood Risk Assessment
The National Flood Risk Assessment (NFRA) was the first step in developing a Flood Risk Management
Strategy and Local Flood Risk Management Plans. The assessment increased the understanding of the
sources of flooding and the impacts, allowing areas at the greatest risk to the impact of flooding to be identified.

As part of this assessment, the potential flood risk to transport infrastructure has been assessed by individual
sources. Under a Medium likelihood scenario (1 in 200 year/0.5% AEP) it is estimated that approximately
559km of all roads are affected by coastal flooding, 866km of road is affected by fluvial flooding and 466km of
road is affected by surface water flooding (SEPA NFRA, 2018).

2.4.          Flood Forecasting
SEPA is Scotland’s national flood forecasting and warning authority, providing coverage for 269 communities
(SEPA Flood Forecasting Framework) with Figure 2-1 showing the current and proposed coverage, extracted
from SEPA’s 2017-2021 Flood Warning Development Framework. The existing flood forecasting systems
primarily cover coastal and fluvial flooding. However, in 2014, SEPA’s Scottish Flood Forecasting Service
successfully piloted a surface water flooding forecast tool in conjunction with the Centre for Expertise in Water
(CREW) based on SEPA’s Regional Pluvial (rainfall-related) Flood Hazard maps. The tool was tested during
the Commonwealth Games in Glasgow in 2014 to inform surface water flooding impact on the cycling road
race. As a result, SEPA have produced the UK’s first operational surface water flood risk forecast with a 24-
hour lead time (predicting in real time). This tool only covers a relatively small urban area and ongoing
research is required to extend coverage to more or larger areas. SEPA are currently commissioning their own
research into flood forecasting for surface water flooding.

Contains sensitive information
Doc-001 | 1.0 | March 2020
Atkins | Flood Forecasting Final Report V2.0                                                             Page 3 of 51

Figure 2-1 - Location of Existing and new Flood Warning Schemes

Contains sensitive information
Doc-001 | 1.0 | March 2020
Atkins | Flood Forecasting Final Report V2.0                                               Page 4 of 51
3.            Flood Risk Impact to Trunk Roads
The NFRA Scotland highlights that the trunk road network is vulnerable to flooding from all sources (fluvial,
pluvial, and coastal), with the trunk road and motorway network comprising of 3507km of road and
roundabouts, an understanding of the risk and means to have a sustainable approach to flood risk is required.

Flooding can disrupt the operation of the road network with knock-on consequences for many social and
economic functions (delaying deliveries, preventing or delaying people from accessing employment or
disrupting vital healthcare services). Communities located in remote areas are particularly vulnerable to road
network disruption as they rely more heavily on road transport than those living and working in other parts of
Scotland and alternative routes (where these exist) often require long diversions. ClimateXChange provides
independent advice research and analysis to support the Scottish Government as it develops and implements
policies on adapting to climate change. The ClimateXChange have developed a series of indicators which are
being used to show how Scotland is performing against its climate change objectives. The indicators include
“Road network at risk of flooding”, Table 3-1 below, illustrates the scale of the flooding challenge with around
5% of the network directly at risk from fluvial flooding (river) and around 52% likely to be affected from pluvial
(surface water) flooding. They also report that in 2014-2015 flooding was the fourth most common cause of
trunk road incidents after broken down vehicles, road traffic accidents and damaged road or street furniture.

                           Table 3-1 - ClimateXChange Road Network at Risk of Flooding

                   Risk of Flooding            Road Type             Percentage at risk
                   from a 1:200 year
                   event [1]                               Fluvial       Pluvial          Coastal
                   Directly                    All          0.81          1.23             0.34
                                               Trunk        5.24          2.13             0.73
                     Would be                  All          7.87          13.41              -
                     affected                  Trunk       24.89          51.89              -

                   [1] The assessment of this indicator has been undertaken for 0.5% probability
                   (1:200 year) flood events only.

An analysis of the Transport Scotland Operating Companies (OC) flood incident data confirms that a total of
1612 flooding incidents were recorded between 2016 and 2018, 11 of which resulted in road closure. Of the
total records, 545 were attributed explicitly to flooding, with the words “flooding” or “flooded” used in the incident
record description. A further 111 records used the word “blocked” in the incident record description, which may
be indicative of incidents related to operational or structural issues with the road drainage system.

The analysis of this data shows that the worst-affected regions with most incidents appear to be South West
and North East units, with a total of 566 and 532 incidents reported for these areas respectively. However, the
areas with the largest sum attributed to flooding/flooded are in the North East and North West units, with 318
and 111 recorded incidents respectively. The distribution of incidents per region is shown in Figure 3-1 below.

Contains sensitive information
Doc-001 | 1.0 | March 2020
Atkins | Flood Forecasting Final Report V2.0                                                               Page 5 of 51
Figure 3-1 - Total Incidents Recorded per Region/Operating Company Figure 3-2 gives an overview of the number of incidents recorded per trunk road in Scotland, with the worst affected road being the A90, followed by the M8, A82 and A85. Appendix 6.1.A.1 then breaks down the number of incidents as recorded by Transport Scotland since 2016 and the Met Office named storm incidents by road name. It also indicates the number of key words found in the descriptions from Operating Companies from each incident record. Contains sensitive information Doc-001 | 1.0 | March 2020 Atkins | Flood Forecasting Final Report V2.0 Page 6 of 51
Figure 3-2 - Total Incidents Recorded per Trunk Road
As part of the asset management approach to assessing flood risk management, the flooding incident database
is used to inform the Transport Scotland Disruption Risk Assessment Tool (DRAT). The DRAT tool assesses
the impact of disruption (including flooding disruption) using the following inputs.
Type of closure;
Duration of closure;
Route Hierarchy; and
Quality of Diversion Route.
An output from the DRAT tool is shown in Figure 3-3 below.
Contains sensitive information
Doc-001 | 1.0 | March 2020
Atkins | Flood Forecasting Final Report V2.0 Page 7 of 51Figure 3-3 - DRAT Assessment Tool
Based on risk from the DRAT assessment the tool then identifies appropriate actions as follows:
Exposure Reduction (Detect Notify Act);
Hazard Reduction (Capital Works); and
Monitoring and Further Investigation.
As part of this study we became aware Transport Scotland had commissioned AECOM to examine the
potential impacts of climate change and severe weather on the Trunk Road Network, and to identify the most
effective ways in which Transport Scotland can respond to these risks. The findings from the AECOM study will
inform improvements in the Asset Management process and will be tested in the DRAT. As a ‘next step’, it was
recommended that Transport Scotland undertake further work to identify and quantify the costs and benefits of
adaptation measures to provide indicative information relating to the expected costs and benefits of specific
responses. The key flood related findings of the AECOM report were as follows
76 trunk road network sections (approximately 2% of all sections) are currently at the highest level of
exposure to flooding (‘Extreme Exposure’);
Climate projections indicate that 179 sections will be classed as having ‘Extreme Exposure’ by the
2030s and, 568 sections by the 2050s; and
Contains sensitive information
Doc-001 | 1.0 | March 2020
Atkins | Flood Forecasting Final Report V2.0 Page 8 of 51 The number of sections classified as having little or no exposure to flooding decreases dramatically
over time.
3.1. Operating Company Incident Data Analysis
One of the key objectives of the project brief was to identify sections of the trunk road network that were
particularly sensitive to surface water flooding. It was hoped that using a range of data sources, supplied by
Transport Scotland and SEPA, we would be able to identify a shortlist of locations that would be suitable for a
future more detailed investigation.
In addition to the data provided in Section 1, desk study work for this report also acquired the following data
sources shown in Table 3-2.
Table 3-2 - Available Data
Data Stakeholder
1 Historical flooding information Operating Companies
2 GIS layer of gradient of the trunk Transport Scotland
road
3 Flood Maps SEPA
4 Climate Change Report AECOM
The historical flooding records kept by Transport Scotland were limited and of varying quality, and as a result
selecting locations based on this data alone was challenging. An alternative approach was a hotspot analysis,
which could be undertaken due to the spatial nature of the data, to narrow down locations where flooding caused
most disruption. The hotspot analysis excludes unsuitable locations based on other datasets provided as well as
interrogating the historical flooding incident records. Details of the data sources used for analyses are described
below.
Historical flooding data – Transport Scotland
Transport Scotland supplied Atkins with historical flood incident data in the form of an excel spreadsheet
containing 1612 incident report details. All entries were recorded by the Transport Scotland appointed trunk road
operators and later collated by Transport Scotland into spreadsheet format. The data was plotted in Geographic
Information Systems (GIS) using coordinates supplied against each data record to enable identification of spatial
trends that were not apparent from the data in its existing form.
Data was extracted based on key words, included in the descriptions associated with each incident record, that
were considered to be relevant to trunk mains flooding in Scotland. Descriptions of the incident and corresponding
mitigation was variable across the regions and were not consistent in reporting format. As such, a first pass
selection of appropriate key words from the descriptions in the data had to be undertaken. The key words that
were identified as being of particular importance were “Flooded”, “Flood”, “Blocked” “Closed”. Any records that
had descriptions which were considered not to be of high significance (e.g. “Erected traffic light site”) or did not
provide clarity on the type of incident were eliminated from the data that was plotted as ESRI shapefiles.
Spatial data was then analysed for clusters of incident records, to identify locations where recurring flooding had
been reported. This was used to determine whether locations had potential to be used as sites for further
investigation. The production of these additional layers also allowed us to identify the Operating Company
responsible for recording each flooding incident. From this analysis we found a wider than expected variation in
the recording of flooding incidents across each Operating Company, when length of trunk road, and weather
patterns, were taken into account. It is unclear whether this variation in the number of incidents recorded relates
Contains sensitive information
Doc-001 | 1.0 | March 2020
Atkins | Flood Forecasting Final Report V2.0 Page 9 of 51to the Unit’s approach to flood incident reporting, or whether the Units are affected by a disproportionate amount
of flooding.
Road Gradient Data
Road gradient data was supplied by Transport Scotland in ESRI shapefile format which mapped the entire trunk
road network in 10m lengths. Each of the 10m lengths was assigned the attribute of a percentage gradient
accurate to 2 decimal places. The gradient network was split into separate layers so that locations with similar
gradients were grouped together. The gradients recorded in the original data supplied ranged from -13.19% to
14.93 %.
As locations with steeper gradients would likely encourage runoff and not have issues with standing surface
water, identification of potential hotspots was limited to areas with gradients of values between 0% and +/- 2%,.
The resulting gradient layer was split into 16 individual layers ranging from -2% to +2% in 0.25% increments.
These layers were compared with the filtered flooding incident data from Transport Scotland and locations that
had high concentrations of incidents in corresponding reaches of low gradient, were identified and shortlisted as
potential areas for further investigation.
SEPA Indicative Flood maps
Transport Scotland additionally supplied Atkins with SEPA’s indicative flood maps in ESRI shapefile format, which
outline locations that SEPA have identified as being at risk of flooding from surface water. The surface water
flood outlines were cross referenced against the incident data and gradient data as detailed above. Having these
maps also allowed the exclusion of locations that were recorded in the historical flooding incident data but fell
within the fluvial and coastal flooding zones. The reason for excluding these locations was that the source of the
flooding could not categorically be identified as originating from surface water, and there was not sufficient
evidence from previous datasets that surface water flooding causes disruption in the trunk road.
Selecting Surface Water Flooding Hotspots
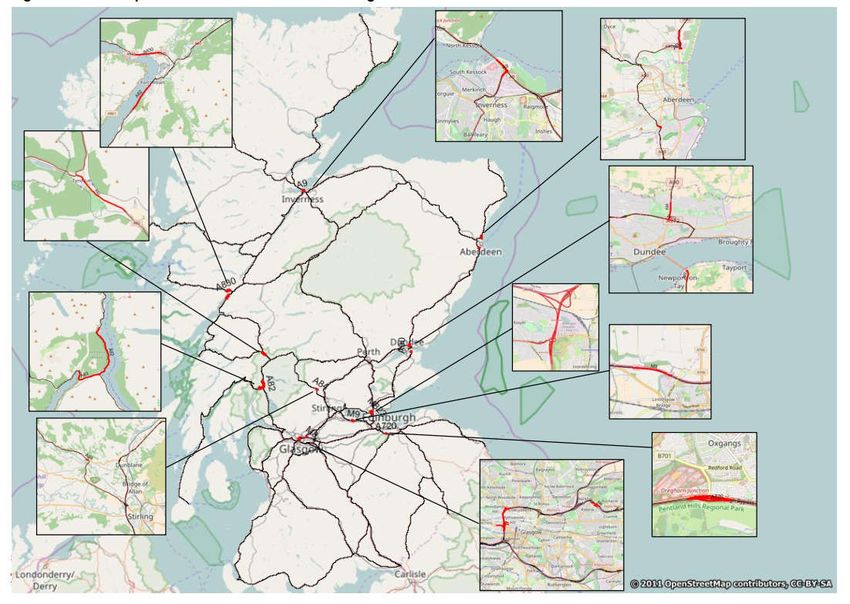
Several locations where all data sets overlapped were identified from the above spatial analysis, which gives an
increased confidence that these areas have a high likelihood of being impacted by surface water flooding. Ten
locations are listed in Table 3-3 below were selected as suitable areas for use as trial sites for surface water flood
forecasting. These locations are detailed below and shown in Figure 3-3.
Table 3-3 - Flooding Hotspot Locations
Location Route Unit
Tarbet A82 North West
Loch Leven M90 North East
Fort William A82 & A830 North West
Kintore A96 North East
Greenock A78 South West
Maybone A77 South West
Glasgow Andersons M8 South West
Bannockburn M90 North East
Oxgangs A720 South East
Keith-Huntly A96 North East
Contains sensitive information
Doc-001 | 1.0 | March 2020
Atkins | Flood Forecasting Final Report V2.0 Page 10 of 51Figure 3-3 – Flooding Hotspot Map
3.2. Climate Change
In 2016 Transport Scotland commissioned AECOM to examine the potential impacts of climate change on the
Trunk Road Network and identify how Transport Scotland and the supply chain should respond to these risks to
become more resilient. The proposed outputs were as follows.
A collated list of recommendations, actions and next steps;
Briefing paper on key climate change threats to the trunk road network; and
An inventory of most at risk assets, operations and interconnected services and infrastructure, based
on location, recent events and future projections.
The identification of these sections of trunk network that are considered more vulnerable was envisioned to be
for informing which parts of the network require the most attention, with regards to minimising future disruption
and the cost associated with response and repair. It also aims to inform and facilitate the development of
adaption plans and support future investment decisions.
AECOM assessed the current level of vulnerability of TS trunk road network assessed for flooding, landslides,
high winds and snow and ice. This was done using an analysis of severe weather-related incidents over a 3-
year period (2013-2016) as recorded in TS incident database. The study found that flooding was the type of
disruptive severe-weather event that is most projected to affect significant parts of the Scottish trunk road
network.
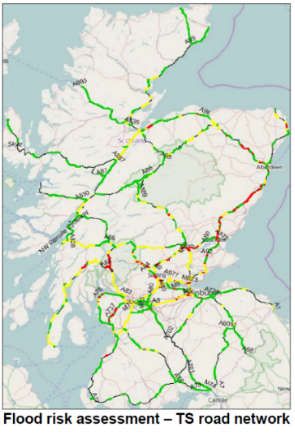
The future assessment has identified 76 sections of trunk road network that are at highest level of (Extreme
Exposure) vulnerability to flooding. When climate change is applied - 179 sections have Extreme Exposure in
Contains sensitive information
Doc-001 | 1.0 | March 2020
Atkins | Flood Forecasting Final Report V2.0 Page 11 of 512030s and 568 sections have Extreme Exposure by 2050. Sections classed as having no to little exposure to
flooding decreases over time (839 to 126 sections). Thirteen of these are mapped to reflect sections with the
highest level of exposure to flooding (Figure 3-4), with the sections listed in Table 3-4. These are areas where
intervention is likely to be required, to increase resilience to future flood events.
Figure 3-4 - Trunk Road with Highest Predicted Flooding Exposure
Table 3-4 - Trunk Road with Highest Predicted Flooding Exposure
Location Route Unit
1 Fort William A82 & A830 North West
2 Tyndrum A82 North West
3 Tarbet A82 North West
4 Stirling A84 North West
5 Glasgow M8 South West
6 Oxgangs A720 South East
7 Linthingow Bridge M9 South East
8 Queensferry M9 FBOC
Crossing
9 Dundee A90 North East
10 Newport on Tay A92 North East
11 Blackdog A90 North East
Contains sensitive information
Doc-001 | 1.0 | March 2020
Atkins | Flood Forecasting Final Report V2.0 Page 12 of 5112 Kirkton of A90 North East
Maryculter
13 Inverness A9 North West
UK Climate Projections 18
UKCP18 climate projections were released by the Met Office in November 2018, as a major upgrade to the
UKCP09 projection tools with updated observations and climate change projections to the year 2100 and
globally. A summary of the UKCP18 findings for the UK in general are detailed below:
1. In general, the trend of warmer, wetter winters and hotter, drier summers continue to be predicted for
the entirety of UK in UKCP18, which reflects previous projections in UKCP09;
2. Warming is projected to be greater in the summer than in winter, and to affect all areas of the UK;
3. Precipitation is anticipated to decrease significantly in the summer, and increase significantly in the
winter – with more intense storms predicted during summer rainfall; and
4. Sea levels continue to rise, as projected in UKCP09, with the south of the UK expecting greater
increases in sea level than the north.
Future analysis should be done to incorporate the numerical uplift projections from UKCP18, including better
quality data that may be recorded/collected in future in terms of historical flooding. It is advised to use caution
when utilising the results of the assessment due to the complex nature of climate change projections. Where
possible, empirical evidence and local knowledge and expertise should be cross-referenced against the
assessment to ensure reliability of the output.
SEPA Climate Change Guidance,
SEPA has taken account of the revised perception of climate change, including the new findings from UKCP18
within their “Climate Change allowances for Flood Risk Assessment in land use planning” document which was
published in May 2019. The purpose of the document is to inform spatial strategy of development plans based
on the best evidence available allowing Scotland to move towards delivering climate resilient places.
A key output of the guidance document is the revised uplifts to account for climate change. Some of the uplift
figures suggested are as high as 56% for Argyll, Western Isles and the West Highlands (river flooding) and a
rainfall uplift of 55% for the west of Scotland region when applied to pluvial flooding, which is a significant
increase in design standards. Advice in the guidance will be applied to the trunk road design in line with the
advice in the DMRB. The DMRB is currently being updated to reflect a number of changes in design standards.
It is anticipated that it will state that latest guidance on climate ”Shall” be considered rather than “Must” this
would in theory allow departures from the standard possible. However, in practice, it would be appropriate to
use the new allowances in all situations.
Contains sensitive information
Doc-001 | 1.0 | March 2020
Atkins | Flood Forecasting Final Report V2.0 Page 13 of 514. Flood Forecasting
4.1. What is flood forecasting
Flood forecasting is generally defined as a method of estimating the magnitude, timing and duration of flooding
in any given area. The main component of the forecast, as opposed to a flood warning is the “collection of real-
time data for the prediction of flood severity, including time of onset and extent and magnitude of flooding”
(Manual on Flood Forecasting and Warning, WMO, 2011). Whilst flood forecasting feeds into flood warning
systems as part of wider flood risk reduction or flood management strategy, flood warning tends to focus on the
interpretation, communication and advanced dissemination of information regarding the flood severity,
expected impacts and actions around this to affected parties.
The WMO (2011) manual states that flood forecasting is a required part of flood management, as prevention
and defence measures can never be completely effective due to the possibility of failure or exceedance in
capacity of said defences. It also sets out the various elements that comprise a flood warning system. The key
elements that need to be considered for good flood forecasting design are:
a) The hydromorphological characteristics of the basin, topography, geology and soils, and the degree of
structural development;
b) The main physical processes occurring during hydrometeorological events; and
c) The type of service that is required and can be achieved technically and economically.
The minimum data required for a basic flood forecast include hydrological data/models, meteorological forecast
or rainfall data and topographic data for the area under study. More complex studies may also require technical
infrastructure, human resources and physical catchment data such as geology, soil and vegetation, as well as
data on local sewerage systems that may interact with the hydrological catchment.
The complexity of a flood forecast is dependent on the drivers and characteristics of the location being
assessed, as well as often being influenced by the governance and stakeholders involved in the management
of river basins or drainage catchments in the area. The area of focus can range as large as cross-boundary
locations where river basins cross local or national boundaries, flood risk assessments on a national scale
down to small-scale local areas of known risk.
In addition to the above physical processes that influence the most appropriate modelling approach,
consideration should be given to the type of communication and lead times required for the target population in
the area for which forecasting is considered. The latter variables are specifically related to flood warning
systems, rather than flood forecasting, however they are an important part of the picture in terms of reducing
risk and appropriate hazard response. This is arguably the main driver for the establishment of flood forecast
systems for many areas known to be prone to flood risk.
4.2. What are the benefits
The benefits of flood forecasting are the reduction of risk and damages to communities, property, life and
economic activity from flooding. When communicated in a timely manner, flood forecasts enable authorities and
the general public to prepare for flood events and the associated losses that may be caused by them. This can
take the form of:
Better management of assets;
The establishing of flood defences, or ;
Protection and loss reduction of property and life (in the form of evacuation and local short-term flood
defence strategies).
Contains sensitive information
Doc-001 | 1.0 | March 2020
Atkins | Flood Forecasting Final Report V2.0 Page 14 of 514.3. What flood forecasting for surface water currently exists
Flood forecasting for surface water often takes the form of flood risk modelling and assessments, in areas with
a high level of urbanisation or infrastructure which reduces natural permeable areas. Flooding in these areas
often occurs when drainage systems are overwhelmed by intense rainfall, overwhelming sewer design
capacities. In addition to the variables described in the section above surface water modelling often
incorporates urban infrastructure such as buildings and roads to represent the overland flow that occurs when
networks are overwhelmed and enables the identification of housing or road assets that may be affected by
ponding of out-of-sewer flows.
The majority of the case studies examined as part of this study from the UK and the rest of the world appear to
focus on surface water forecasting in highly urbanised areas, specifically city centre locations where traffic
disruption would be significant in the event of road closure. In most cases the risk, and consequently impact of
surface water flooding was assessed using flood models of varying detail often using design or observed
rainfall events.
One of the studies focussed on the use of telemetry for early warning systems in known flood hotspots in 6
different countries, using a variety of different methodologies. Another case study assessed the efficiency of the
UK Met Office Flood Forecasting Centre services, for Category 1 and 2 responders which was the only nation-
wide study, which noted that surface water flood forecasting is particularly challenging due to the localised
nature of such events. This was exemplified in the CREW pilot of a Grid to Grid (G2G) model in Glasgow where
blending of rainfall inputs had to be undertaken prior to the modelling exercise to allow for differences in local
variance. In addition to this the model had to be calibrated using good quality data and often with local
knowledge as the model was underpredicting flooding in some known flooding hotspots in the East End of
Glasgow.
4.3.1. UK & Rest of the world
A number of research papers related to the modelling of surface water flooding and its impact on transportation
were examined as part of this study to understand current and past approaches in different parts of the world
as well as in the UK. The summary of findings for these research papers are provided as part of Appendix C,
whilst the conclusions are presented below in Table 4-1.
Table 4-1 - Summary of Case Studies from the UK and the Rest of the World
Location Title Author Journal Key Findings
Shanghai, “Evaluating the impact and Jie Yin, Journal of Study combines pluvial flood
China risk of pluvial flash flood on Dapeng Yu, Hydrology, numerical modelling with a GIS based
intra-urban road network: A Zhane Yin, 637, pp. 138- roads failure analysis. Design rainfall
case study in the city center Min Liu and 145 events used in 2D modelling with
of Shanghai, China” Qing He allowance for channelling of flows by
(2016) roads, drainage capacity taken into
consideration. Data requirements for
this exercise were large, and reliable
past flood data is required for
calibration of the model for desired
accuracy in the output.
Roads failure analysis could be
transposed to Scotland’s trunk road
network if sufficient data and
resources are available for pluvial
Contains sensitive information
Doc-001 | 1.0 | March 2020
Atkins | Flood Forecasting Final Report V2.0 Page 15 of 51Location Title Author Journal Key Findings
flooding, however would not be real
time.
Dobrzykowice, “Pluvial Flood Risk Sweranski, Water, 10, 386, This paper details the development of
Poland Assessment Tool (PRFA) S., pp 1-20 a flood risk assessment tool in
for Rainwater Management Chruscinski, ArcGIS, utilising a Python script to
and Adaptation to Climate J., Kazak, J., automate output from models within
Change in Newly Swiader, M., the ArcGIS environment.
Urbanised Areas” Tokarczyk-
Dorociak, K.,
and Zmuda, Risk scoring was undertaken based
R. (2018) on intensity of rain in local areas in
gridded rainfall inputs, level of
property and potential damage to
assets. Roads were seen to be at the
highest risk of inundation at all levels
of rainfall. Potential areas of flood that
were not reported previously in the
model, it is also hard to account for
human measures that mitigate
flooding which lead to lack of
reporting.
Size of model was small however still
data and processor hungry and might
not be suitable for area as wide as
entire trunk road network in Scotland.
Multiple “Real-Time Early Warning Acosta-Coll, Sensors, 2018, Study examines and details early
System Design for Pluvial M., 18, 2255 warning systems, with case studies of
Flash Floods – A Review” Ballester- EWS implemented in areas with high
Merelo, F., risk of flash flooding in urban areas in
Martinez- multiple countries including Thailand,
Peiro, M. USA, Colombia, Philippines, Puerto
and De la Rico and Spain.
Hoz-Franco,
E. (2018)
Most case studies in this paper rely on
telemetry or monitoring of on-ground
conditions using sensors or weather
radar in known hotspots, with an alert
system enabled when set thresholds
for the variables monitored (rainfall,
reflectivity, water level or velocity) are
exceeded.
Methodology from this study could be
transposed to known areas of flooding
on the roads network in Scotland.
York, UK “Beyond ‘flood hotspots’: Coles, D., Journal of This paper took a roads network
Modelling emergency Yu, D., Hydrology, approach similar to Shanghai study,
service accessibility during Wilby, R. L., 546, pp. 419- with a pluvial and fluvial flood model
flooding in York, UK” Green, D., 436 linked to an “accessibility model” for
Herring, Z. first responders in the city of York in
(2017) the form of ambulance and fire and
rescue service.
GIS was used for network analysis,
which was overlain with areas that
were predicted to have >25cm and
>100m2 of flooding, taking into
account statutory 8- and 10- minute
target response times for high priority,
life threatening incidents. Historical
Contains sensitive information
Doc-001 | 1.0 | March 2020
Atkins | Flood Forecasting Final Report V2.0 Page 16 of 51Location Title Author Journal Key Findings
events were used for this analysis.
Modelled surface water flooding had a
larger spatial spread than fluvial flood
event analysed.
Conclusions add that performance of
model had to be calibrated against
reports and pictures of flooding that
were not flooded in the model, like in
previous studies. Further to this, when
historical traffic flow data was
recommended as an additional source
of data to increase accuracy as
normal traffic flow assumptions may
underestimate response times during
flood events.
UK (Various) “Surface water flood Ochoa- Journal of This paper details the progress made
warnings in England: Rodriguez, Flood Risk in surface water flood forecasting
overview, assessment and S., Wang, Management, since severe flood events in the UK in
recommendations based on L.P., 11, S211-S221 2007, caused primarily by surface
survey responses and Thraves, L., water flooding. The purpose of the
workshops” Johnston, A. study was to establish the usefulness
and Onof, C. of FFC services by the Met Office and
(2018) EA that relay extreme rainfall alerts to
Category 1 and Category 2
responders and Surface Water Flood
Risk Assessment which is a tool that
gives a risk weighted score at country
and local authority level, issued daily
to recipients with a 5-day lead time.
The main finding of this was that
although recipients found some level
of usefulness in the alerts provided,
many found that the nationwide nature
of these forecasts were too broad and
did not enable more accuracy in timing
and location considering the localised
nature of surface water flooding.
Probability of likelihood and impact
was also considered to be
insufficiently emphasised leading to
frustration due to “over-reaction” in
responders. Local data and a more
targeted approach was favoured by
almost all respondents and workshop
attendees interviewed during the
study.
4.4. The CREW Study
This study was conducted by a consortium of research providers from the Centre for Ecology and Hydrology,
The James Hutton Institute, the Met Office and SEPA for CREW to expand SEPA’s surface water forecasting
capabilities at the time. The aim of the study was to establish an appropriate forecasting and warning system
for surface water flooding in urban areas, which was then subsequently piloted at the 2014 Commonwealth
Games in Glasgow.
Contains sensitive information
Doc-001 | 1.0 | March 2020
Atkins | Flood Forecasting Final Report V2.0 Page 17 of 51The methodology of the approach chosen specifically used nationally available datasets and developed an
operational surface water flood risk forecast with a 24-hour lead time for a 10km by 10km area in Glasgow’s
East End. The process was split into 3 stages:
1. Creation of an appropriate rainfall prediction model;
2. Development of an appropriate surface water flood model; and
3. Development of an impact assessment to create a forecast impact library for an operational model
The pilot operated from June to August 2014 over a 10km by 10km area over the East End of Glasgow, in an
area previously affected by major flooding in July 2002. It provided strategic flood guidance to the Games
organisers and emergency responders in real-time, throughout the Games.
Using state of the art weather and hydrological models, the forecasting system integrated the real time intensity
and pattern of rainfall forecast over a 24h period with detailed information on land use and risk of flooding to
properties and transport links.
The project assessed how this approach could be integrated into SEPA’s existing flood forecasting
mechanisms to deliver real-time information on the severity of surface water flooding impacts in urban areas.
4.4.1. Research on Existing Forecasting Methods
Intensive Rainfall Forecasting
As part of the research for the study current approaches for intensive rainfall and surface water flooding and
developments in this field were reviewed. High resolution intensive rainfall inundation models were already
existing at the time, and heavily used for surface water flooding design applications. However, these are not
appropriate for real time forecasting. At the point of research, the existing method of surface water forecasting
in real time was found to be a combination of rainfall threshold exceedance and use of flood planning maps.
Beyond 6 hours ahead, Numerical Weather Prediction (NWP) provided the most accurate forecast of rainfall. In
addition to this, a UK Variable (UKV) grid precipitation model was available from the Met Office at a 1.5km grid.
This used together with NWP was found to be skilful at predicting maximum rainfall accumulations, but timing
and location can be high uncertain (1hr and 25km respectively).
For very short lead times, Short Term Ensemble Prediction System (STEPS) nowcast provides useful radar-
rainfall extrapolation ensemble forecasts, blended with the deterministic UKV model up to 6 hours ahead. In
addition to this, MOGREPS-UK 12km grid ensemble was available for Scotland (SEPA) to conserve data
volumes but UK wide MOGREPS-UK updated in 2012 to provide 2.2km grid resolution, with better results than
previous MOGREPS-R system (12km grid).
The main problem encountered in all the rainfall data was related to accuracy of modelling, where verification
and calibration are dependent on good quality rainfall observations from telemetry. In Scotland in particular,
significant areas are under-observed due to;
a) a lack of real-time reporting rain gauge networks;
b) distance from weather radar with factors present influencing radar's ability to estimate ground level rainfall;
and
c) Remote and mountainous terrain in some parts of the country.
At the time, improvements to rainfall observation across Scotland was being made by work in progress to use
real time polling of SEPA's tipping bucket rain gauge network and to complete the UK radar network update.
This would enable better rainfall predictive capability in real time in Scotland at the completion of this
improvement works.
The study noted that further work was required to optimise the use of the new radar technology, particularly its
dual-polarisation capability, and to combine rain gauge and radar observations more effectively. To date it is
not known if this work has taken place.
A blended precipitation ensemble forecast was further introduced in October 2013, combining:
2km STEPS extrapolation forecasts with the MOGREPS-UK 2.2km forecasts. This will provide the best
probabilistic forecast up to 36 hours ahead on a 2km grid; and
Contains sensitive information
Doc-001 | 1.0 | March 2020
Atkins | Flood Forecasting Final Report V2.0 Page 18 of 51 Hourly precipitation forecast using an enhanced data assimilation method implemented at the Met
Office in 2015/6.
However, this data is also highlighted to have a spatial uncertainty of more than 10km which can be
problematic for accurate surface water flood forecasting given the localised nature of this type of flooding in
particular.
Urban Surface Water Flood Forecasting
As with the worldwide research, this study notes that real time surface water flood forecasting model run times
need to be short to allow production of longer lead-time ensemble forecasts required to facilitate effective
mitigation actions. Current approaches of modelling both surface runoff and underground sewerage network
are detailed and demand long run times, making them unfeasible for this purpose.
In order to work around this, an estimate of sewer capacity is ideally used. Even with the use of sewer capacity
estimates, 2D modelling of surface water currently still fails to meet real-time forecast run-time requirements.
Moreover, the investment required, both in computing facility as well as time inputs from qualified personnel to
support a real time model with appropriate verification is substantial. This is particularly the case when
considering the continuous running of a model and model maintenance across all time-steps for model states.
As such it was concluded that current inundation models implemented for design and planning are not well
suited for real-time application and require development and restructuring of the software. In the majority of
cases inputs to these models relate to an effective rainfall design storm profile and do not include an explicit
space-time representation of runoff production and water loss accounting. Flood Modeller (previously ISIS)-
FAST was considered by the study to be the most suitable of these models for surface water inundation in
terms of model run time, however it was also stated to require significant further development, testing and
verification for use as an operational tool.
Surface Water Flood Forecasts
Real time surface runoff forecasts can be provided by CEH's Grid to Grid (G2G) distributed hydrological model.
G2G is used currently real-time across Scotland for fluvial flooding by Scottish Flood Forecasting Service.
Surface runoff in the model is routed through the river network to get fluvial flood forecasts and is available to
be configured as an output to enable forecasting of surface water flooding.
Most existing approaches for real time surface water flooding warnings are based on rainfall threshold
exceedance methods and identify risk areas in map form. G2G models can provide further accuracy on this
type of approach by taking into account factors such as surface cover, soil properties and antecedent moisture
conditions.
Other existing, more local approaches examined by the study include a more detailed hydraulic model JFlow+
that was being used primarily for the Glasgow Pluvial Flood Mapping project. The outcome of this modelling is
detailed datasets on pluvial flooding associated with a suite of design storms of varying severity. The goal of
the project was to link the offline flooding datasets with G2G methodology to enable better resolution in real
time G2G surface water forecasts. Further to this, CEH and SEPA were also working on combining the G2G
flooding hazard footprints with impact datasets. This data was pulled through to the CREW project to provide
strategic surface water hazard impact maps for the Commonwealth Games scenario.
4.4.2. Pilot Study – Commonwealth Games
The aim of the pilot study was to ensure key responders in Glasgow inclusive of the City Council, Transport
Scotland, Scottish Water, the Scottish Government and the Commonwealth Games organisers were able to
react and mitigate effects of surface water flooding during the Commonwealth Games event. SEPA organised a
steering group made up of these organisations detailed the needs of these parties from a forecasting and
corresponding alert system. These were detailed as being:
Contains sensitive information
Doc-001 | 1.0 | March 2020
Atkins | Flood Forecasting Final Report V2.0 Page 19 of 51 A 6 to 24-hour lead time for the forecast to ensure sufficient time for preparations;
Guidance on flood event locations, timings, possible impacts and severity; and
Stand-down messages when events were over, or a risk-level reduced
To address these needs a G2G model approach was considered the most appropriate in terms of lead times
requested for by the steering group. A location in Glasgow’s East End, with an approximate area of 10km by
10km grid was selected for the pilot study, with rainfall inputs from an ensemble STEPS nowcast system and a
blended MOGREPS-UK precipitation ensemble forecast, at a grid of 2km for the STEPS radar data and 2.2km
for the MOGREPS-UK forecast. These were provided by the Met Office to SEPA at a 2km resolution, for 15-
minute rainfall accumulations on a 22km by 22km domain over Glasgow, 4 times daily. In addition to this,
observed gridded rainfall based on telemetry rain gauges within the vicinity of the Glasgow pilot study area
were used as input to the model in the period between the daily G2G Scotland states and the start of a G2G
Glasgow forecast.
The G2G model approach is already used by FEWS Scotland as well as in England and Wales to provide
fluvial flood forecasts, however it can also generate surface water outputs. These are represented by a soil,
slope-controlled, probability-distributed, storage-capacity and scheme subject to land-cover (e.g. urban) effects.
G2G runoff production is shaped by storm pattern and spatial datasets on known landscape properties, as well
as continuous water accounting (changing antecedent soil moisture). The outputs from G2G models are
gridded surface runoff estimates.
As this type of modelling doesn’t provide impact assessments, offline inundation maps were used to
supplement the G2G model in the form of SEPA’s pluvial flood hazard maps. A 1km grid-cell impact definition
map was developed specifically for the Glasgow pilot study by SEPA to assess disruption to 6 different receptor
types:
1. Population (number of properties affected by 1km pixel);
2. Community Services;
3. Utilities;
4. Commercial Properties;
5. Railway; and
6. Roads.
The potential impacts in this grid were combined with likelihood to assign an overall risk level. The impacts
were grouped into people and property impacts (first 4 receptors) and transport impacts (railway and roads),
with transport being a separate category due to the interconnected nature of transport networks leading to
disruption in wider areas than just the cell where impact is greatest. Minimum effective rainfall thresholds were
established for each group of receptors and severity levels then compared against real-time forecast surface
runoff as estimated in the G2G model.
Manual checking and supplementation with local knowledge of flooding in the study area was necessary to
verify the 1km grid cell impact definitions. A site visit was conducted by a local expert from Scottish Water to
identify particular hotspots for surface water flooding. For example, London Road in the East End of Glasgow
as determined to be a high risk area even at low rainfall totals, however was mapped only to be at risk at a 200
year plus climate change uplift scenario, highlighting the importance of local stakeholder knowledge in flood
mapping. The study also recommends new urban areas undertake manual checking as well for impact
assessments to enable better accuracy.
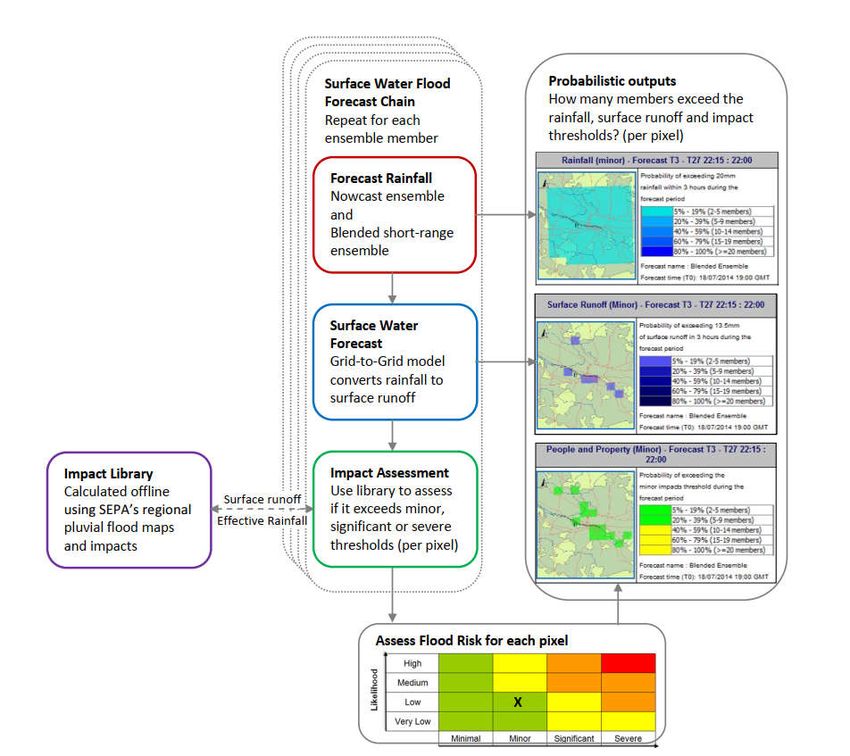
Further to this, probabilistic outputs from the model were produced in gridded format (rainfall, surface runoff,
transport impacts, people and property), supplemented with surface runoff time-series per grid cell for each
time-step of the whole forecast. These referenced the probability of exceedance of set thresholds for each
Contains sensitive information
Doc-001 | 1.0 | March 2020
Atkins | Flood Forecasting Final Report V2.0 Page 20 of 51receptor in the gridded formats and of surface runoff accumulation exceeding 13.5mm to 16mm in 3 hours at
any time within the whole forecast, and 6 hour forecast windows for the time-series format.
The overall process is visualised in Figure 4-1 below:
Figure 4-1 - Overview of the forecasting process and examples of probabilistic outputs produced for
pilot study (CREW, 2015)
Communication of Outputs
The model outputs were produced as web reports within the FEWS Glasgow system (Flood Early Warning
System) developed by Deltares, a SEPA supplier who provides the platform for the FEWS Scotland system.
Due to the small study area for Glasgow (22km by 22km) the processing time for outputs was approximately
2.5 minutes. Outputs were issued every day at 1700 to responders based on the blended ensemble forecasts
at 1300 from the Met Office. This report evaluates the FEWS Glasgow output on the following elements:
1. A Surface Water Flood Risk Summary (based on Flood Risk Matrix) for next 24 hours;
Contains sensitive information
Doc-001 | 1.0 | March 2020
Atkins | Flood Forecasting Final Report V2.0 Page 21 of 51You can also read