On the fine vertical structure of the low troposphere over the coastal margins of East Antarctica - Atmos. Chem. Phys
←
→
Page content transcription
If your browser does not render page correctly, please read the page content below
Atmos. Chem. Phys., 19, 4659–4683, 2019
https://doi.org/10.5194/acp-19-4659-2019
© Author(s) 2019. This work is distributed under
the Creative Commons Attribution 4.0 License.

On the fine vertical structure of the low troposphere over
the coastal margins of East Antarctica
Étienne Vignon1 , Olivier Traullé2 , and Alexis Berne1
1 EnvironmentalRemote Sensing Laboratory (LTE), École Polytechnique Fédérale
de Lausanne (EPFL), Lausanne, Switzerland
2 DSO-DOA, Météo France, Toulouse, France

Correspondence: Étienne Vignon (etienne.vignon@epfl.ch)

Received: 15 November 2018 – Discussion started: 2 January 2019
Revised: 25 March 2019 – Accepted: 26 March 2019 – Published: 8 April 2019

Abstract. In this study, 8 years of high-resolution radiosonde      structure of the low troposphere over coastal East Antarctica,
data at nine Antarctic stations are analysed to provide the         this study gives insights into the reliability and accuracy of
first large-scale characterization of the fine vertical structure   two major reanalysis products in this region on the Earth.
of the low troposphere up to 3 km altitude over the coastal         The paper further underlines the difficulty of modeling the
margins of East Antarctica. Radiosonde data show a large            low-level flow over the margins of the ice sheet with a state-
spatial variability of wind, temperature and humidity pro-          of-the-art atmospheric model.
files, with different features between stations in katabatic re-
gions (e.g., Dumont d’Urville and Mawson stations), stations
over two ice shelves (Neumayer and Halley stations) and re-
gions with complex orography (e.g., McMurdo). At the Du-            1   Introduction
mont d’Urville, Mawson and Davis stations, the yearly me-
dian wind speed profiles exhibit a clear low-level katabatic        The margins of East Antarctica are a region of great inter-
jet. During precipitation events, the low-level flow generally      est in meteorology particularly due to the fierce katabatic
remains of continental origin and its speed is even reinforced      winds that fascinated and severely tested the pioneering sci-
due to the increase in the continent–ocean pressure gradient.       entific expeditions in the far south. These so-called kata-
Meanwhile, the relative humidity profiles show a dry low tro-       batic winds that flow over the sloping surfaces of the ice
posphere, suggesting the occurrence of low-level sublimation        sheet can attain very high speeds in confluence regions such
of precipitation in katabatic regions but such a phenomenon         as the Adélie Land (Mawson, 1915; Wendler et al., 1993;
does not appreciably occur over the ice shelves near Halley         Parish and Walker, 2006) or the Lambert Glacier (Parish and
and Neumayer. Although ERA-Interim and ERA5 reanalyses              Bromwich, 1987).
assimilate radiosoundings at most stations considered here,            In winter, the strong radiative deficit of the surface leads
substantial – and sometimes large – low-level wind and hu-          to persistent, intense and directionally constant near-surface
midity biases are revealed but ERA5 shows overall better per-       winds from the interior of the continent. Beyond the coastal
formance. A free simulation with the regional polar version         slopes the atmospheric boundary-layer flow considerably
of the Weather Research and Forecasting model (Polar WRF)           thickens in response to a piling up of cold air downstream
(at a 35 km resolution) over the entire continent shows too-        over the sea ice or the ice shelves. This accumulation of cold
strong and too-shallow near-surface jets in katabatic regions       air is responsible for a pressure gradient force opposing the
especially in winter. This may be a consequence of an under-        katabatic wind that is particularly intense under weak synop-
estimated coastal cold air bump and associated sea–continent        tic forcing (Van den Broeke et al., 2002; Van den Broeke and
pressure gradient force due to the coarse 35 km resolution of       Van Lipzig, 2003). In some regions of the ice sheet, like in
the Polar WRF simulation. Beyond documenting the vertical           Adélie Land or in Coats Land, the flow regime transition can

Published by Copernicus Publications on behalf of the European Geosciences Union.
4660                                                  É. Vignon et al.: On the fine vertical structure of the low troposphere

be abrupt (Pettré and André, 1991; Gallée et al., 1996; Gallée    batic winds significantly diminish the precipitation amount
and Pettré, 1998; Renfrew, 2004) and is therefore interpreted     that actually reaches the ice sheet surface. As katabatic winds
as a hydraulic jump, often referred to as a katabatic jump or     are relatively dry, they sublimate an important part of the pre-
Loewe’s phenomenon. Such jumps are however rarely im-             cipitation before it reaches the ground surface. This dry layer
portant in other sectors of the Antarctic periphery like Terra    manifests with low values of relative humidity in the bound-
Nova Bay (Parish and Bromwich, 1989).                             ary layer during snowfall events. From a model simulation
   In summer, the absorption of shortwave radiation by the        with the Integrated Forecast Model (IFS), the authors esti-
surface diminishes the katabatic forcing and the large-scale      mate that sublimation corresponds to 17 % of the precipita-
pressure gradient force dominates the overall momentum            tion over the entire continent. This term reaches up to 35 %
budget of the boundary layer (Van den Broeke et al., 2002;        when considering only the margins of the ice sheet.
Parish and Cassano, 2003). The lower sea-ice concentration           The reliable representation of the Antarctic climate in re-
and sea-ice extent generally diminish the offshore extent of      gional and global climate models as well as atmospheric re-
the land flow due to the development of diurnal sea breezes       analyses therefore strongly depends on their ability to repro-
(Pettré et al., 1993) and because of the thermal and mechan-      duce the low-level atmospheric flow at the Antarctic periph-
ical erosion of the flow at the ocean surface. In Adélie Land     ery. A significant body of literature has focused on the near-
and in Queen Maud Land, a typical summertime diurnal cy-          surface atmosphere in Antarctica (Parish and Bromwich,
cle of the low-level flow has been evidenced. Nocturnal kata-     2007; Nicolas and Bromwich, 2014; Bracegirdle and Mar-
batic forcing alternates with a combination of thermal wind       shall, 2012) and its representation in meteorological reanal-
forcing and surface radiative heating that leads to a weaken-     yses and models. In particular, Wille et al. (2017) have high-
ing of downslope diurnal flow or even to a diurnal anabatic       lighted an excessive wind speed and a dry bias in the bound-
flow (Gallée and Pettré, 1998; Parish et al., 1993; Bintanja,     ary layer over the Ross Ice Shelf in the Antarctic Mesoscale
2000).                                                            Prediction System (AMPS; http://www2.mmm.ucar.edu/rt/
   The interactions between the low-level atmospheric flow        amps, last access: 1 April 2019), which is based on simu-
from the interior of the ice sheet and the oceanic air masses     lations from the polar version of the Weather Research and
over – or coming from – the austral ocean are varied and          Forecasting model (Polar WRF). Sanz Rodrigo et al. (2013)
complex. For instance, it has been shown that katabatic           have further stressed that the near-surface wind speed in es-
winds are stronger when an anticyclone sets over the plateau      carpment areas is strongly underestimated in ERA40 and
or when the pressure over the ocean is low as during the          ERA-Interim reanalyses, and to a lesser extent in model
approach of deep cyclones (Parish and Bromwich, 1998;             simulations with the Regional Atmospheric Climate Model
Naithani et al., 2003; Orr et al., 2014). On the other hand,      (RACMO). The simulations with the EC-Earth global cli-
katabatic winds have been shown to be a key driver of the         mate model in Bintanja et al. (2014) and in the LMDZ gen-
mesoscale cyclogenesis off Adélie Land and the Ross Sea           eral circulation model in Vignon et al. (2018) concur with
(Gallée and Schayes, 1994; Bromwich et al., 2011) or over         these conclusions, especially at low horizontal resolutions
the Weddell Sea (Carrasco et al., 2003).                          due to the coarse representation of terrain slopes.
   From a meteorological and climate perspective, the low-           The vertical structure of the atmosphere over the coastal
level atmospheric dynamics over the coastal margins of            regions of the ice sheet and its representation in models
Antarctica plays a key role for the energy and mass bud-          have been less documented. Using radiosonde data, Streten
gets of the atmosphere over the ice sheet. The low-level          (1990) and König-Langlo et al. (1998) study the climatolog-
horizontally diverging and northward drainage flow from           ical structure of the whole troposphere and low stratosphere
Antarctica drives a thermally direct zonal circulation. Sub-      at the Mawson and Dumont d’Urville (hereafter DDU), Neu-
sidence – and associated upper cyclonic vorticity – takes         mayer and Halley stations, respectively. However, they do
place over the central ice sheet, while rising motions occur      not give specific details on the structure of the boundary layer
over the ocean, leading to an active mass exchange between        or on the low troposphere. Significant advances in our un-
Antarctica and subpolar latitudes (Parish and Bromwich,           derstanding of the low-level flow have been achieved due to
1998, 2007). Moreover, the low-level circulation over coastal     the case studies – often in summer – using a combination of
Antarctica is critical for the surface mass balance of the ice    tethersonde and radiosonde observations (e.g., Sorbjan et al.,
sheet. While transient eddies are responsible for the mois-       1986; Bintanja, 2000) and thanks to the deployment of so-
ture transport towards the continent, the export of moisture      dars in Coats Land (Renfrew and Anderson, 2007), in Adélie
by the mean circulation mostly occurs in the low troposphere      Land (Argentini et al., 1996; Gera et al., 1998) and in the
(Connolley and King, 1993; Van Lipzig and Van Den Broeke,         Terra Nova Bay area (Argentini and Mastrantonio, 1994). A
2002; Genthon and Krinner, 1998; Dufour et al., 2019). This       climatological perspective has been provided by Zhang et al.
export can be even more pronounced when considering the           (2011) and Nygård et al. (2013), who investigated the fre-
moisture export due to blowing snow in the boundary layer         quent temperature and specific humidity surface-based in-
(Lenaerts et al., 2012). Using radar measurements and model       versions over Antarctica using radiosonde data from the In-
simulations, Grazioli et al. (2017b) further show that kata-      tegrated Global Radiosonde Archive (IGRA). In particular,

Atmos. Chem. Phys., 19, 4659–4683, 2019                                            www.atmos-chem-phys.net/19/4659/2019/
É. Vignon et al.: On the fine vertical structure of the low troposphere                                                          4661

Nygård et al. (2013) show that over coastal regions, roughly           the Ross Island region is complex, with steeply rising terrains
half of the humidity inversions are associated with temper-            corresponding to the two main mountains: Mount Erebus and
ature inversions, while the other half is due to a horizontal          Mount Terror. Black Island and White Island with respective
advection of water vapor increasing with height.                       maximum elevation of 1040 and 740 m are located 30 km
   Nonetheless, little is known about the spatial and temporal         south of McMurdo. The Transantarctic Mountains, whose al-
variability of the fine vertical structure of the temperature,         titude can exceed 2000 m, are located west of Ross Island at
humidity and wind over the coastal margins of Antarctica.              a distance of about 80 km. Mario Zucchelli station is located
Although the lower tropospheric dynamics in this region is             on the coast of Terra Nova Bay, 355 km north of McMurdo,
critical for the global climate, its representation in state-of-       at the northeastern side of the confluence zone of the Priest-
the-art climate models and atmospheric reanalyses has not              ley and Reeves glaciers and at the south of an orographic
been assessed hitherto.                                                jump of more than 1200 m associated with the abrupt slopes
   The aim of the present paper is twofold: to characterize            of the Transantarctic Mountains. Mawson station is situated
the vertical structure of the low atmosphere over several lo-          on the coast of an isolated horseshoe-shaped rocky area. The
cations of coastal East Antarctica and to present a first multi-       ice sheet surface steeply rises from the coastal ice cliffs sur-
station evaluation of model simulations and meteorological             rounding the station towards the plateau. Davis is a coastal
reanalyses in this region. More specifically, the main objec-          station that lies to the east of the Amery Ice Shelf in the
tives are to                                                           Vestfold Hills, the largest coastal ice-free area of Antarctica.
                                                                       The land rises progressively to the southwest towards the ice
    1. document and decipher the fine vertical structure of            sheet, and a ridgeline in the ice topography is located around
       the lower tropospheric temperature, humidity and wind           60 km to the northeast of the station (Alexander and Murphy,
       over coastal East Antarctica using radiosonde data; and         2015). Casey station is located on the coast of the Wilkes
    2. evaluate the ability of the ERA-Interim and ERA5 re-            Land, at 12 m altitude. The Law Dome, which lies to the east
       analysis products and of the Polar WRF regional atmo-           of Casey and which rises to an altitude of 1395 m, shields
       spheric model to reproduce the observed mean structure          the base from the easterly winds that predominate in the re-
       and its variability.                                            gion. Dumont d’Urville station is located at 41 m altitude on
                                                                       Petrel Island, approximately 5 km off Adélie Land and the
   The paper is structured as follows: Sect. 2 introduces the          ice sheet proper. The climate at the station is very influenced
data sets and details the methodology. Section 3 presents the          by strong katabatic winds blowing from the interior of the
results, and the latter are further discussed in Sect. 4. Sec-         ice sheet. Neumayer station lies on the Ekström Ice Shelf, at
tion 5 closes the paper with a conclusion.                             a few kilometers from the shoreline. The shelf extends more
                                                                       than 100 km to the south with an inclination of approximately
                                                                       0.1 ‰. Halley station is situated towards the seaward edge of
2     Data and methods                                                 the Brunt Ice Shelf, Coats Land, on the southeastern shore of
                                                                       the Weddell Sea at about 30 m altitude. The Brunt Ice Shelf
2.1    Radiosonde data at nine Antarctic stations                      extends to the southeast of the station for over 40 km, and the
                                                                       uniform surface rises very gradually over this distance until
The low troposphere over coastal East Antarctica has been
                                                                       the hinge zone where the land steeply rises up to the conti-
sampled for a few decades by daily radiosoundings at several
                                                                       nental plateau. Unlike all the other stations of interest here –
stations1 . In this study, we analyze daily radiosonde data at
                                                                       that are located close to the coast and near sea level – PE is
seven permanent Antarctic stations on the coast – McMurdo,
                                                                       220 km away from the coast at 1382 m altitude. The station
Mawson, Davis, Casey, DDU, Neumayer and Halley – and at
                                                                       has been built on a small granite ridge just north of the Sør
two summer stations – Mario Zucchelli and Princess Eliza-
                                                                       Rondane Mountains in the Dronning Maud Land and it is lo-
beth stations (hereafter MZ and PE stations, respectively) –
                                                                       cated at approximately 1 km north of the Utsteinen Nunatak
over the 8-year period (2010–2017). The specific locations
                                                                       that culminates at an elevation of 1564 m.
of all the stations are indicated in Fig. 1, and the exact co-
                                                                          Although fairly short for a climatological study, the 2010–
ordinates and altitudes are given in Table S1 in the Supple-
                                                                       2017 analysis period was chosen because it fits the period for
ment. The landscape surrounding the different stations shows
                                                                       which ERA5 reanalysis was available at the time of carrying
a great morphological diversity.
                                                                       out the analysis (see Sect. 2.2) and because it corresponds to
   McMurdo station lies on the southwestern edge of Ross
                                                                       the period for which the model of radiosonde used at most
Island, close to the interface between the Ross Ice Shelf –
                                                                       stations was Vaisala RS-92. The RS-92 sonde is currently
that extends over 900 km to the south with a slight rise in el-
                                                                       the most used sonde type over the globe and it is consid-
evation – and the Ross Sea to the north. The topography of
                                                                       ered the reference radiosonde by the Global Climate Observ-
   1 See http://amrc.ssec.wisc.edu (last access: 1 April 2019) for a   ing System Reference Upper-Air Network. This model has
complete list of Antarctic stations with a continuous radiosounding    also been shown to be slightly affected by common dry bi-
program.                                                               ases in cold and dry environments (Milosevich et al., 2004)

www.atmos-chem-phys.net/19/4659/2019/                                                   Atmos. Chem. Phys., 19, 4659–4683, 2019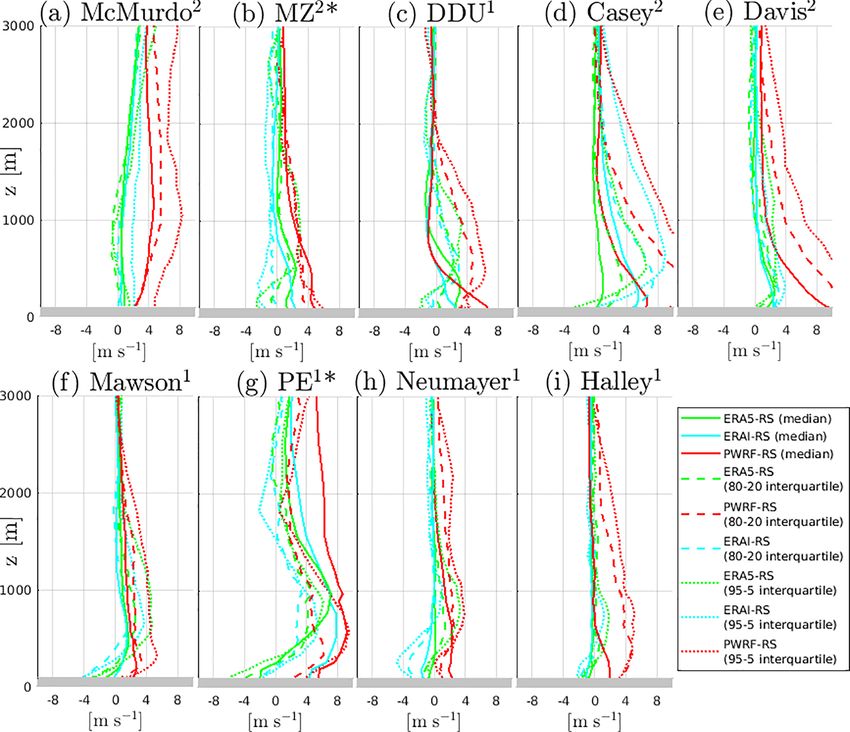
4662                                                   É. Vignon et al.: On the fine vertical structure of the low troposphere

particularly due to its two humidity sensors being heated al-      dle and Marshall (2012) show that ERA-I is the most re-
ternately (Tomasi et al., 2006; Ingleby, 2017). Note that at       liable for mean sea level pressure and 500 hPa geopoten-
the DDU and PE stations, the types of radiosonde are Mo-           tial height values and trends. ERA-I analyses are available
dem M2K2-DC and Graw DFM-09, respectively. Bock et al.             at four times per day: 00:00, 06:00, 12:00 and 18:00 UTC.
(2013) showed a low bias in relative humidity between 2 %          Secondly, we will use the last-generation reanalysis prod-
and 10 % in Modem M2K2-DC measurements compared to                 uct from the ECMWF: ERA5. Major improvements from
those obtained with RS-92 at the Observatoire de Haute-            ERA-I include a better spatial resolution (31 km on average
Provence, southern France. Since 2013, a correction algo-          on the horizontal, 137 vertical levels up to 0.01 hPa among
rithm on moisture measurements from DDU has therefore              which 33 are in the first 3000 m a.g.l.), a more elaborated
been applied, but this has limited impacts on the statistics       model physics (IFS cycle 41r2), more consistent sea sur-
shown in the present paper. Technical information on all the       face temperature, sea-ice cover and additional model inputs
radiosonde types can be found at https://www.graw.de (last         from observations. A summary of the changes between ERA-
access: 1 April 2019), https://www.vaisala.com (last access:       I and ERA5 can be found at https://confluence.ecmwf.int/
1 April 2019) and http://www.meteomodem.com (last ac-              pages/viewpage.action?pageId=74764925 and the physics of
cess: 1 April 2019). The specifics of the radiosoundings at        the IFS model used for ERA5 is described in the techni-
each station including the sounding times are summarized           cal notes on the ECMWF website (https://www.ecmwf.int).
in Table 1. As the aim of this study is to characterize the        ERA5 analyses are available at a 1 h granularity.
fine vertical structure of the low troposphere, we could not          It is worth mentioning that radiosonde data at all the con-
make use of data from IGRA, which are subsets restricted           sidered Antarctic sites – except PE – have been assimilated
to the so-called “mandatory” pressure levels completed by a        by the IFS model to make both ERA-I and ERA5. The reanal-
few additional levels with significant deviation from linear-      ysis data sets are therefore not purely independent from ra-
ity of temperature and dew point between mandatory levels          diosonde data. Nevertheless, only the meteorological fields at
(so-called “significant levels”). Here, we rather use data sets    mandatory and significant levels are assimilated. Hence, the
provided by local meteorological organizations or polar in-        fine-scale vertical structure of the boundary layer in ERA-I
stitutes that have a higher vertical resolution. The sole treat-   and ERA5 is expected to remain strongly dependent on the
ment made on the raw data is a 15 s – ≈ 75 m – smoothing           model configuration.
(applied twice) of the wind data, 15 s being the averaged pe-
riod of oscillation of the sonde in the first 3000 m above the     2.3   Polar WRF simulations
surface. This allows to remove the oscillations in the data due
to the natural pendulum motion of the payload after launch-        Numerical simulations were carried out with the regional
ing. Temperature, humidity and wind measurements in the            model Polar WRF v3.9.1 (e.g., Bromwich et al., 2013).
first 100 m are also excluded from the data sets for two main      The simulation domain size is 5810 km × 5810 km (see blue
reasons. First, the analysis of temperature and humidity data      square in Fig. 1). It is centered over the South Pole and en-
potentially affected by thermal lag error – if the radiosonde      compasses the whole Antarctic continent. Simulations are
was not perfectly equilibrated outdoor before launching, for       run at 35 km horizontal resolution over the period (2010–
instance – is avoided. Second, below an altitude of 100 m, the     2017) (with a 1-week spinup). Initial conditions and lateral
balloon may have not reached the flow velocity yet and may         boundary forcings, as well as sea-ice cover and sea surface
thus be still in a transitory state. Yurchak (2013) shows that,    temperature are provided by the ERA5 reanalysis data set. As
for a typical balloon with an ambient wind speed of 20 m s−1       recommended in Deb et al. (2016), we use the Bedmap2 to-
(5 m s−1 ), the adaptation timescale is approximately 5 s (20 s)   pography from Fretwell et al. (2013). The model is run with
corresponding to an altitude range of 25 m (100 m).                66 vertical levels, among which 23 are located in the first
                                                                   3000 m above the ground surface. As in the standard con-
2.2    ECMWF reanalysis products                                   figuration of the AMPS, the shortwave and longwave radi-
                                                                   ation schemes are the Rapid Radiative Transfer Model for
Two reanalysis data sets from the European Centre for              general circulation models (RRTMG) scheme (updated ev-
Medium-Range Weather Forecasts (ECMWF) will be com-                ery 15 min) and the cumulus scheme is the Kain–Fritsch
pared to radiosonde data over the period 1 January 2010–           scheme. We use the two-moment microphysical scheme of
31 December 2017. Firstly, the ERA-Interim (ERA-I; Dee             Morrison et al. (2009) that leads to the best Polar WRF sim-
et al., 2011) reanalysis is a third-generation reanalysis prod-    ulations compared to cloud and radiation measurements over
uct with an averaged horizontal resolution of 79 km and            the Antarctic Peninsula (Listowski and Lachlan-Cope, 2017).
60 vertical levels up to 0.1 hPa, among which 17 are in            For the turbulent diffusion in the boundary layer, we use the
the first 3000 m a.g.l. The reanalysis is based on simula-         2.5-level Mellor–Yamada–Nakanishi–Niino (MYNN) turbu-
tions with the IFS model cycle 31r2 using a 4D-Var as-             lent kinetic energy (TKE) scheme (Nakanishi and Niino,
similation. Comparing second- and third-generation reanal-         2006) coupled with the MYNN surface layer scheme, as
ysis products with Antarctic station observations, Bracegir-       in Bromwich et al. (2013). Notwithstanding that MYNN is

Atmos. Chem. Phys., 19, 4659–4683, 2019                                             www.atmos-chem-phys.net/19/4659/2019/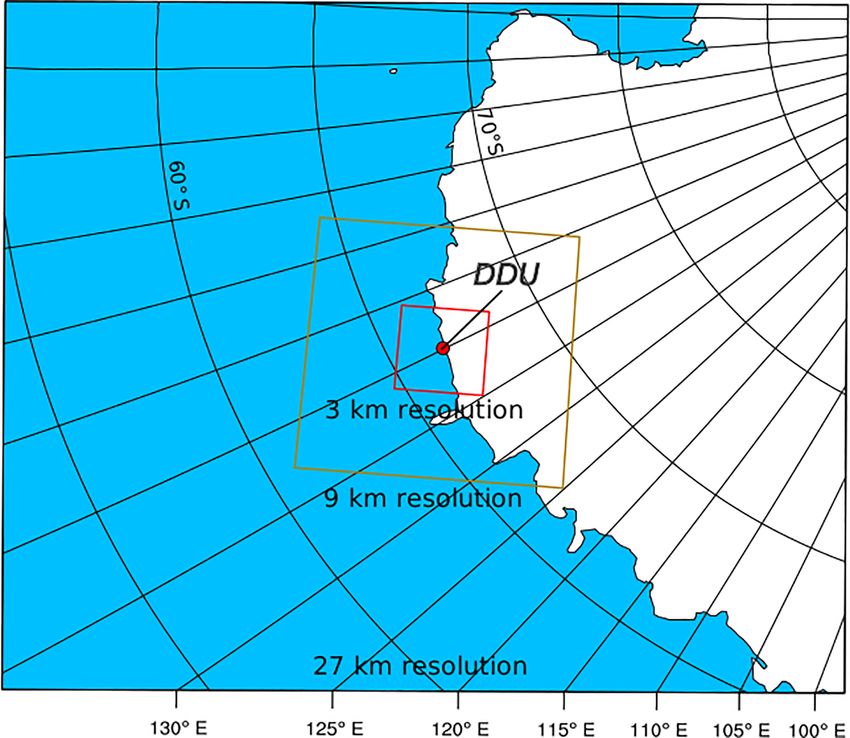
É. Vignon et al.: On the fine vertical structure of the low troposphere 4663
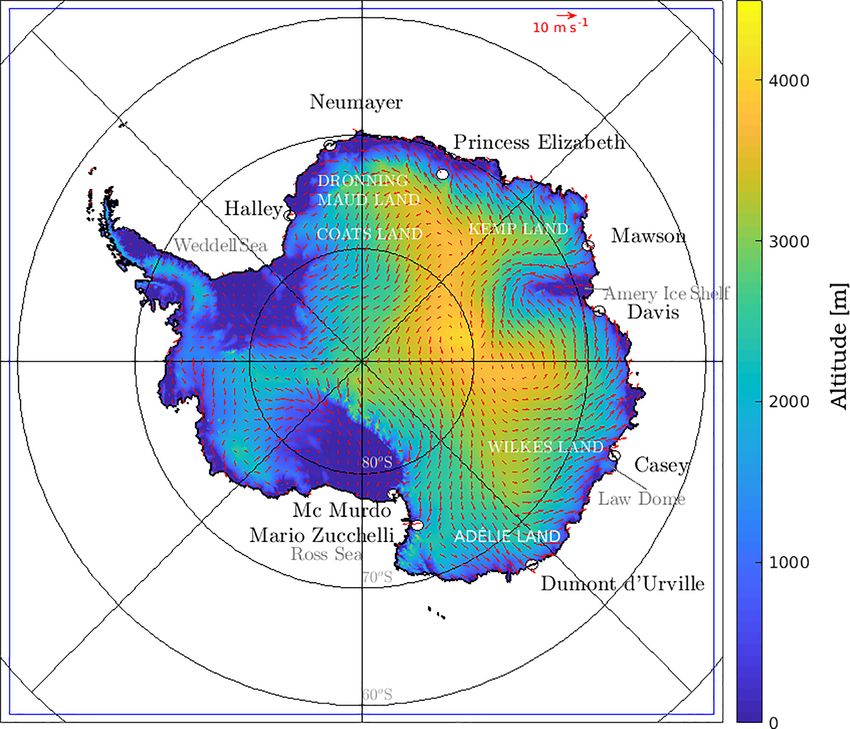
Figure 1. Topography of the Antarctic continent from the Bedmap2 data set at 10 km resolution (Fretwell et al., 2013). Black dots indicate
stations from which radiosonde data are used in this study. The blue line delimits the Polar WRF simulation domain. Red arrows show the
2010–2017 mean wind vector from ERA5 reanalyses.
Table 1. Characteristics of radiosonde data used in this study. “DDU” refers to Dumont d’Urville, “MZ” to Mario Zucchelli and “PE” to
Princess Elizabeth station. The indicated time corresponds to the official observation time. Note that sondes are usually launched 45 min or
1 h before. For each station, the percentage of data indicates the percentage of available radiosoundings in the corresponding period. When
two numbers are indicated, the first (second) one corresponds to the percentage of sounding at 00:00 UTC (12:00 UTC). In the Casey and
Mawson data sets, measurements are not provided at constant time or vertical resolution. Subsequently, the averaged number of vertical
levels in the first 3000 m a.g.l. is indicated in the “resolution” column.
Station name Sonde type Period Vertical resolution Percentage of data UTC time
(dd/mm/yyyy) (local time)
Halley Vaisala RS-92 01/01/2010–12/02/2017 2 s (≈ 10 m) 90.8 12:00 (12:00)
DDU Modem M2K2-DC 01/01/2010–31/12/2017 1 s (≈ 5 m) 90.8 00:00 (10:00)
McMurdo Vaisala RS-92 01/01/2010–31/12/2017 2 s (≈ 10 m) 85.0, 50.5 00:00 (12:00),
12:00 (00:00)
Neumayer Vaisala RS-92 01/01/2010–31/12/2017 5 s (≈ 25 m) 95.6 12:00 (13:00)
Mawson Vaisala RS-92 01/01/2010–31/12/2017 23 levels in 3000 m 95.2 12:00 (16:00)
Casey Vaisala RS-92 01/01/2010–31/12/2017 23 levels in 3000 m 89.3, 86.9 00:00 (11:00),
12:00 (23:00)
Davis Vaisala RS-92 01/01/2010–31/12/2017 2 s (≈ 10 m) 84.2, 75.6 00:00 (07:00),
12:00 (19:00)
MZ Vaisala RS-92 Dec, Jan, Feb 2010–2016 2 s (≈ 10 m) 67.2, 75.3 00:00 (11:00),
12:00 (23:00)
PE Graw DFM-09 Dec 2014, 2015, 2017 5 s (≈ 25 m) 51.9 12:00 (17:00)
and Jan, Feb 2015, 2016
www.atmos-chem-phys.net/19/4659/2019/ Atmos. Chem. Phys., 19, 4659–4683, 2019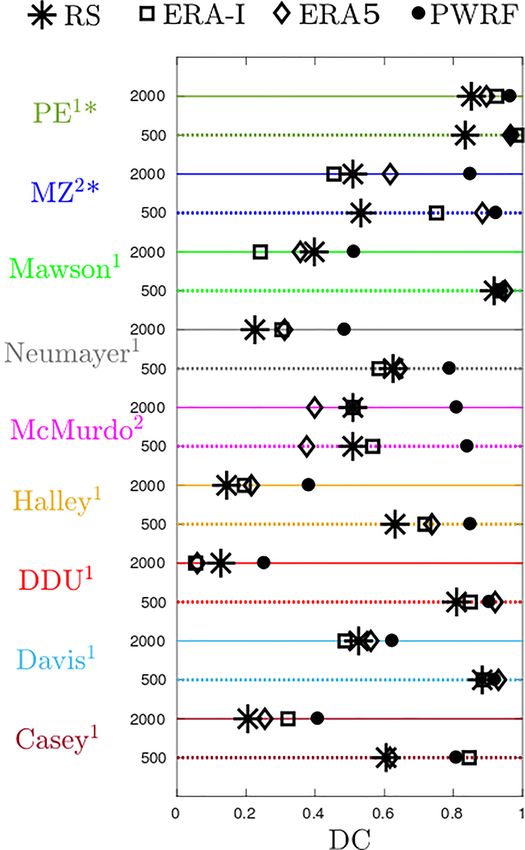
4664                                                    É. Vignon et al.: On the fine vertical structure of the low troposphere

an advanced version of the Mellor–Yamada–Janjic (MYJ)               cess – which is a crucial process over coastal East Antarctica
scheme – with improved formulation of mixing length – Deb           – mostly manifests in the relative humidity profiles. Informa-
et al. (2016) noticed better WRF performance in terms of            tion about the specific humidity profiles will be nevertheless
surface temperature over West Antarctica using the original         given in Fig. S1 in the Supplement.
MYJ parameterization. To assess the sensitivity to the turbu-          In addition to yearly and seasonal statistics, we will con-
lence scheme and the vertical resolution, we have also car-         sider for each station a “precipitation events” ensemble,
ried out a simulation with the MYJ scheme coupled with the          which gathers all profiles for which substantial precipita-
η-similarity surface layer scheme and one simulation with a         tion reaches the ground surface (precipitation rate is greater
refined vertical resolution close to the surface (see Sect. 4.3).   than 0.1 mm h−1 ). For radiosounding profiles, the precipita-
                                                                    tion conditioning is made using ERA5 reanalyses.
2.4    Analysis methods                                                The statistics of wind, humidity and temperature profiles
                                                                    in reanalyses and Polar WRF have been evaluated by com-
Our analysis will focus on the low troposphere that we de-          paring the median profiles as well as the 80–20th and 95–
limit as the layer between 0 and 3000 m a.g.l. This atmo-           5th interquartiles at every model or reanalyses level height.
spheric layer was chosen because it includes the bound-             The ERA-I and ERA5 performance at the sounding time have
ary layer at all stations and because it is slightly deeper         also been evaluated using mean bias and root mean square er-
than the mean depth of the equatorward mass flux layer              ror calculations at their respective vertical level heights. The
(Van Lipzig and Van Den Broeke, 2002). Note also that               variability in wind direction has also been evaluated using
z = 3000 m a.g.l. corresponds approximately to the altitude         the directional constancy parameter (DC), defined as
from which the zonal mean circulation over coastal Antarc-
                                                                                         1/2
tica reverses (from anticyclonic to cyclonic; see Van Lipzig                  u2 + v 2
and Van Den Broeke, 2002).                                          DC =                 1/2
                                                                                                ,                                 (1)
   We will compare radiosoundings at each Antarctic sta-                      u2 + v 2
tion with the simulated and reanalyzed profiles at the nearest
                                                                    where u and v are the zonal and meridional components of
model grid point. Details about the geographical characteris-
                                                                    the wind, respectively, and the overbar indicates the time av-
tics of the specific grid points are given in Table S1. Other-
                                                                    erage.
wise mentioned, reanalysis and model profiles will be com-
pared to radiosonde data at each station at the same time as
sonde launchings, i.e., at 00:00 and/or 12:00 UTC, depend-
                                                                    3     Results
ing on the station (see Table 1). It is worth mentioning that
the World Meteorological Organisation guidelines state that         In this section, we present the main features of the vertical
sondes should be launched at a time such that they reach the        structure of the low troposphere over coastal East Antarctica
tropopause at the synoptic hour (00:00 or 12:00 UTC). To            using radiosonde data and we assess the ability of reanalyses
achieve this in the Antarctic, where tropopause height is typ-      and Polar WRF in reproducing the profiles statistics.
ically between 8000 and 9000 m, sondes are launched around
45 min before the targeted hour. In the lowest 3000 m a.g.l.,       3.1     General features of the vertical structure of the low
one might expect the best comparison with model data 1 h be-                troposphere from radiosonde data at nine
fore the notional synoptic hour. However, the statistical eval-             Antarctic coastal stations
uation in Sect. 3.2 is not appreciably sensitive to a ±1 h shift
in the time sampling of reanalyses and Polar WRF data sets          3.1.1    Annual statistics
(not shown).
   Three atmospheric variables will be analysed: the wind           A broad view of the yearly vertical structure of the wind
(speed and direction), the temperature and the relative hu-         speed (U ), temperature (T ) and relative humidity with re-
midity calculated with respect to ice, as temperatures are          spect to ice (RHi) in the low troposphere from radiosonde
most of the time below freezing at all stations. We will mostly     data at each station is depicted in Fig. 2. The reader can refer
focus on the relative humidity and less on the specific hu-         to Fig. S2 for separate statistics of the zonal and meridional
midity (or mixing ratio) for four reasons. First, the relative      wind components and for further information about the wind
humidity is the variable directly measured by radiosondes.          direction. It is worth remembering that only summer data are
Second, the specific humidity is a variable that spans sev-         available for MZ and PE stations. One particularly striking
eral orders of magnitude during the year due to its strong          feature in Fig. 2 is the diversity of profiles around the coast of
dependency upon temperature making the annual statistics            East Antarctica. In the Ross Sea sector (McMurdo and MZ
dominated by high summer values. The third reason is that           stations), one can notice the low and nearly constant wind
the critical variable for cloud and precipitation formation         speed. As shown in Seefeldt et al. (2003) and Monaghan et al.
and subsequently for the surface energy and mass balance            (2005), the atmospheric flow at McMurdo is strongly influ-
is the relative humidity. Last, the low-level sublimation pro-      enced by orographic effects like the blocking of the dominant

Atmos. Chem. Phys., 19, 4659–4683, 2019                                                   www.atmos-chem-phys.net/19/4659/2019/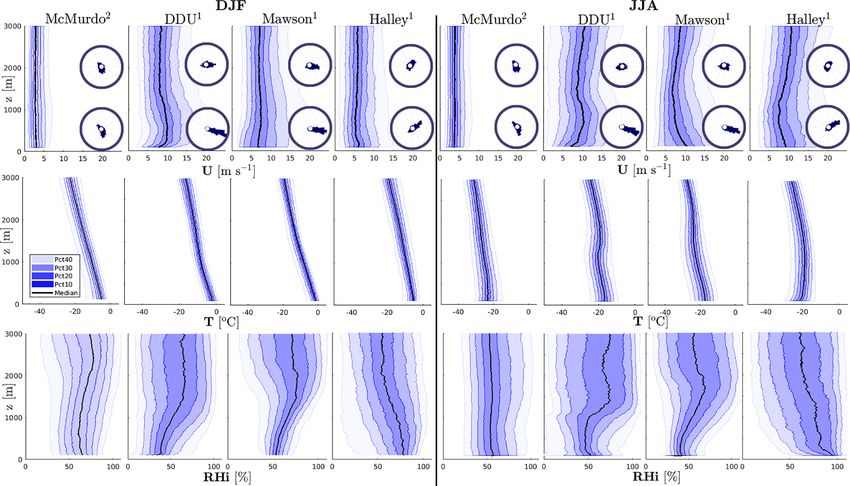
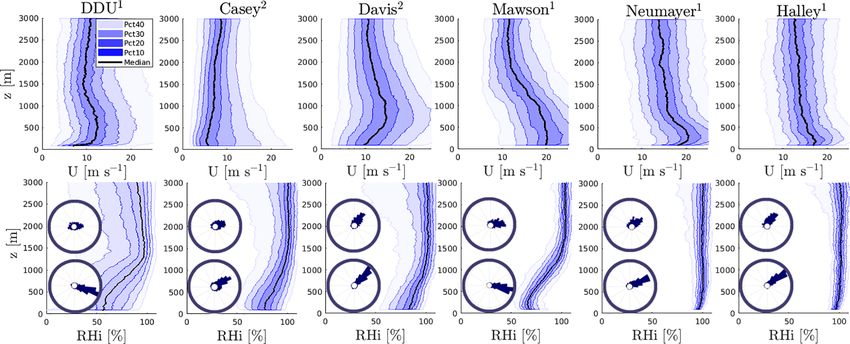
É. Vignon et al.: On the fine vertical structure of the low troposphere                                                       4665

katabatic southerly flow by the Ross Island. At the MZ sta-         station, radiosonde data reveal nearly constant median pro-
tion, the observed profiles are often the results of the conflu-    files of wind speed and RHi in summer. Pattyn et al. (2010)
ence of katabatic flows from the Reeves and Priestley glaciers      underline that the PE station site is sheltered by the Sør Ron-
affected by local mountains (Bromwich et al., 1993). Moving         dane Mountains in the south and it is thus protected from
westward (from left to right in the Fig. 2) to Adélie Land and      strong katabatic jets. Albeit deflected, the flow originating
DDU station, a clear katabatic layer can be seen in the pro-        from the plateau shows a high directional constancy (> 0.8)
files. This layer is characterized by high wind speeds (with        over a depth exceeding 2000 m (see Sect. 3.2). While the me-
an annual median around 10 m s−1 ) with a southeasterly di-         dian temperature linearly decreases with increasing height,
rection and capped by a temperature inversion at about 1000–        the 80th and 90th percentiles of temperature show constant
1500 m altitude. Figure S2 also shows a clear transition from       and slightly increasing values close to the surface, respec-
a low-level easterly flow to a mid-tropospheric westerly flow       tively, evidencing the occurrence of surface-based inversions
at an altitude of about 2300 m. Still more to the west in Fig. 2,   in summer during calm wind conditions (not shown). Neu-
Casey station generally experiences light outflow from the          mayer and Halley stations are both located on ice shelves
northeast, off Law Dome (Adams, 2005). This is visible in           and the respective vertical structures of the low troposphere
radiosonde data with a median wind speed between 4 and              are reasonably similar. King (1989) shows that the low-level
10 m s−1 monotonically increasing with increasing height.           flow at Halley is forced by both synoptic-scale pressure gra-
Note the relatively high value of the 90th percentile in the        dients and the pressure gradient due to the stable air over
first 500 m a.g.l. This observation recalls the results of Turner   the gently sloping surface of the Brunt Ice Shelf. Kottmeier
et al. (2001) that explained one extraordinarily very strong        (1986) draw similar conclusions for Neumayer station over
wind event (10 m speed exceeded 50 m s−1 ) at Casey asso-           the Ekström Ice Shelf, emphasizing the role of baroclinic-
ciated with a deep low north of the coast in concert with a         ity via the thermal wind effect in shaping the wind structure.
high surface pressure inland. At the Davis station, the yearly      Figure 2 shows that the median wind speed at both stations
median wind profile reveals a deep katabatic layer with a           exhibits a shallow maximum close to the surface that cor-
moderate median wind speed maximum of 7 m s−1 at ap-                responds to a northeasterly flow. The wind speeds show a
proximately 800 m altitude and with a northeasterly direc-          large intra-annual variability and they are slightly stronger at
tion. At the Mawson station, Fig. 2 shows that both the me-         Neumayer than at Halley, with medians at z = 200 m close
dian wind speed and the variability is maximum close to the         to 11 and 8 m s−1 , respectively. RHi is nearly constant or
surface. This observation echoes the conclusions of Dare and        slightly decreasing with increasing height. Unlike stations in
Budd (2001) stating that the near-surface wind at Mawson is         coastal katabatic regions, the median temperature profiles re-
driven by shallow surface drainage flows – thereby explain-         veal a surface-based inversion in the first kilometer above the
ing the low-level maximum and its northeasterly direction           ground.
(Fig. S2) – and modulated by the vertical transfer of momen-
tum from the mid-troposphere that largely depends on the            3.1.2   Seasonal statistics
synoptic pressure gradient which can strengthen or weaken
the surface drainage flow. Surface-based temperature inver-         A comparison of the wind, temperature and relative hu-
sions are a common climatological feature of the Antarctic          midity profiles between the two extreme seasons – summer
troposphere. Interestingly, for all the stations considered, no     (December–January–February, DJF) and winter (June–July–
surface-based inversion can be pointed out in the yearly me-        August, JJA) – is depicted in Fig. 3. We consider here two
dian profiles from radiosoundings. However, surface-based           stations at which the typical flow is katabatic – DDU and
temperature inversions are present in the first 100 m above         Mawson – one station over an ice shelf – Halley – and the
the surface in ERA-I, ERA5 and Polar WRF (see Sect. 3.2).           McMurdo station where the vertical structure of the tropo-
As the first 100 m of radiosonde data are not analysed here         sphere is influenced by the complex terrain at the foot of the
due to the low reliability of radiosonde data in this layer, this   Transantarctic Mountains. One can point out stronger wind
may explain the absence of inversion in the yearly median           speed at low levels in winter than in summer at the Maw-
temperature profiles at the McMurdo, DDU, Casey, Davis              son and Halley stations, consistent with more stable bound-
and Mawson stations.                                                ary layers on the plateau and subsequent stronger katabatic
   At the DDU, Casey, Davis and Mawson stations, one can            winds as well as stronger large-scale pressure gradients (Van
further point out that the yearly median RHi profiles show          den Broeke and Van Lipzig, 2003). Such an increase is not
lower values in the first kilometer above the ground surface.       visible at the DDU station neither in the median nor in the
This bottom layer of drier air corresponds to the advection         percentiles. The absence of strong seasonality in the low-
of absolutely dry air masses by katabatic winds that adiabat-       level wind speed at DDU is in agreement with surface obser-
ically warm during their descent from the interior of the con-      vations in König-Langlo et al. (1998), while measurements
tinent. At DDU, this process is sufficiently strong to exhibit      at meteorological stations a few tens of kilometers further in-
a clear signature in the yearly statistical profiles of specific    land reveal significantly stronger wind speed in winter than
humidity (Fig. S1). Moving westward and inland towards PE           in summer (e.g., Vignon et al., 2018). This suggests that a

www.atmos-chem-phys.net/19/4659/2019/                                                Atmos. Chem. Phys., 19, 4659–4683, 2019
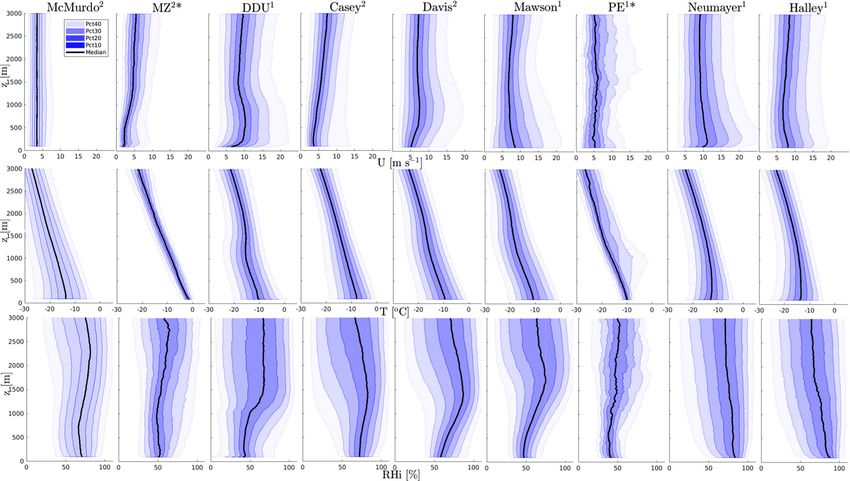
4666                                                        É. Vignon et al.: On the fine vertical structure of the low troposphere

Figure 2. Vertical profiles of the annual wind speed (top row), temperature (middle row) and relative humidity with respect to ice (bottom
row) from radiosonde measurements at nine Antarctic stations. Black lines are the medians, colored lines refer to the 10th, 20th, 30th, 40th,
60th, 70th, 80th and 90th percentiles. In the legend, “Pctx” refers to the shaded area that covers x percent of the data greater than the median
and x percent of the data lower than it. The altitude z is above ground level. Numbers in exponential form next to station names in the title
indicate the number of radiosoundings per day at the corresponding station. The “∗ ” symbol labels the two stations for which only data from
December to February are shown.

slowing down mechanism at the coast that should be par-                   of the insolation during the summer season, summer verti-
ticularly active in winter – like the pressure gradient force             cal profiles may depend on the local time of the sounding
associated with the piling up of cold air over sea ice – may              and may not be considered as climatologically representa-
damp the seasonal cycle. At the Halley, Mawson and DDU                    tive. The temporal representativity of radiosoundings will be
stations, the wind direction at z = 500 m is almost constant              further discussed in Sect. 4.1. The relative humidity profile
throughout the year, reflecting the strong orographic influ-              at McMurdo shows a clear seasonality, with more humid air
ence in shaping the low-level flow at these three locations. It           (relatively) above 2000 m in summer. This is consistent with
is also worth noting that, unlike in summer, the JJA median               the summer wind rose at z = 2000 m with more frequent flow
profile of wind speed at DDU, Mawson and Halley show                      from the east compared to the winter season. Easterly winds
a significant increase with increasing height above 2000 m.               at McMurdo generally correspond to the advection of air
This may be explained by the location of the edge of the po-              masses that transit over the Ross Ice Shelf or Ross Sea and
lar vortex – which is stronger in winter – that lies closer to            that do not directly come from the dry atmosphere over the
edge of the continent in winter and can be responsible for                ice sheet. The relatively dry katabatic layer at the DDU and
a significant vertical gradient of the wind speed even in the             Mawson stations is well visible in the summer and winter
mid-troposphere (König-Langlo et al., 1998).                              RHi profiles, with an especially pronounced “dry concavity”
   At the McMurdo station, the wind speed is slightly                     in winter at DDU. Interestingly, the winter median profile
stronger in winter and it is vertically homogeneous over                  of RHi at the DDU station slightly increases with decreas-
the first 3000 m in both DJF and JJA seasons. Temperatures                ing height in the first few hundred meters above the surface.
at the four stations are naturally warmer in summer than                  Stronger water turbulent fluxes at the surface in winter are
in winter, but the capping inversion at DDU and Mawson                    hardly probable since there is no open ocean close to the sta-
above the katabatic layer is more pronounced in JJA. Like-                tion in winter, while it is often the case in summer. This local
wise, the surface-based temperature inversion over Halley is              maxima in the profiles may thus be attributed to the presence
not present in summer. Note that, due to the diurnal cycle                of blowing snow in the near-surface flow, which is more fre-

Atmos. Chem. Phys., 19, 4659–4683, 2019                                                      www.atmos-chem-phys.net/19/4659/2019/
É. Vignon et al.: On the fine vertical structure of the low troposphere                                                        4667

quent in winter due to stronger katabatic winds on the ice          rences of precipitation and low near-surface relative humidity
sheet and to a better snow surface erodibility (Amory et al.,       at DDU.
2017).                                                                 Figure 4 shows that, despite enhanced wind speed at the
                                                                    Neumayer and Halley stations, the first 3000 m of atmo-
3.1.3   Statistics during precipitation events                      sphere are completely saturated during precipitation events,
                                                                    reflecting the likely absence of the LSP mechanism at these
Grazioli et al. (2017b) have stressed the role of katabatic         stations. For instance, the wind rose at z = 500 m at Halley
winds in sublimating a significant part of the precipitation        shows that the wind at this station during precipitation events
falling on the margins of the ice sheet. In this section, we ex-    is northeasterly, indicating a flow from the coastal edge of the
amine the vertical structure of the wind and relative humidity      Brunt Ice Shelf and not from the interior of the ice sheet. This
during precipitation events at the six stations with the most       observation sheds light on the geographical discrepancies of
intense winds. In agreement with Grazioli et al. (2017b), the       the LSP around the coast of East Antarctica.
second row of Fig. 4 shows that even during precipitation
events, the atmosphere is unsaturated close to the surface at       3.2     Evaluation of the vertical profile statistics in
DDU, Casey, Davis and Mawson. The first row of Fig. 4 also                  ERA-I, ERA5 and Polar WRF
shows that the wind is generally enhanced during precipita-
tion events at the latter four stations (in comparison with the     In this section, we assess the ability of ERA-I, ERA5 and
climatology in Fig. 2). Moreover, wind roses at z = 500 m in        Polar WRF to accurately reproduce the vertical structure of
the bottom row of Fig. 4 show that the flow at this altitude        the low troposphere at the nine Antarctic stations. It is worth
is mostly southeasterly, northeasterly, easterly and northeast-     remembering that, unlike the free-running Polar WRF simu-
erly at DDU, Casey, Mawson and Davis, respectively. This            lation, ERA-I and ERA5 reanalyses are not fully independent
means that the low-level flow remains of continental origin         from radiosoundings since they frequently assimilate them at
during most of the precipitation events (see map in Fig.1).         low vertical resolution (except at the PE station). Note also
The strengthening of the continental low-level flow at the          that for complementing the figures presented in this section,
Antarctic coast during precipitation events is consistent with      the reader can refer to figures similar to Fig. 2 for the ERA-I,
the general picture of moisture advection by synoptic cy-           ERA5 and Polar WRF data sets as well as a figure showing
clones documented in Naithani et al. (2002, 2003). As a syn-        median and interquartile differences for all stations and all
optic weather system transits eastward off the Antarctic coast      variables in the Supplement (Figs. S3, S4, S5, S6 and S7).
and approaches a station, it advects oceanic air with clouds
towards the continent at its eastern flank. Note that largest       3.2.1    Wind
amounts of moisture and precipitation are brought by large
frontal systems not necessarily associated with very intense        Figure 5 shows the differences of yearly median, 80–20th
cyclones but with low-pressure systems with a large radius          interquartile and 95–5th interquartile of wind speed with re-
(Uotila et al., 2011). Meanwhile, the surface pressure over         spect to radiosonde data at the nine stations. This figure can
the ocean decreases, the downslope pressure difference in-          be analysed in parallel with Fig. 6, which compares the direc-
creases, and subsequently the near-surface wind flow from           tional constancy at z = 500 m (dotted axes) and z = 2000 m
the continent increases. Strong near-surface winds and low          (solid axes) in the different data sets. Figure S6 also provides
relative humidity are thus very favorable conditions for the        the comparison of the statistics for the zonal and meridional
occurrence of the mechanism of low-level sublimation of             components of the wind separately. Above 2000 m a.g.l., the
precipitation (LSP; Grazioli et al., 2017a) at the DDU, Maw-        median and interquartile absolute differences of the wind
son, Davis and Casey stations. Note that even during precip-        speed are generally less than 3 m s−1 in ERA-I and ERA5.
itation events, the relative humidity can be as low as 25 %         The mid-troposphere circulation and its variability are thus
(26 %) above z = 2000 m (below z = 500 m) at the DDU sta-           reasonably well reproduced over the coastal East Antarctic
tion. These situations often correspond to precipitation from       margins in the reanalyses. Polar WRF often shows slightly
clouds – associated with northerly warm advection – above           higher values of the interquartile differences and it signifi-
3000 m and moving above a remaining deep layer of conti-            cantly overestimates the directional constancy at z = 2000 m
nental flow from the interior of the ice sheet. The low near-       at all stations and especially in the Ross sector (McMurdo
surface humidity values could be partially attributed to the        and MZ stations; see Fig. 6). This too directionally constant
precipitation conditioning by ERA5 data that may lead to the        flow combined with an overestimation of the variability of
inclusion of spurious profiles (i.e., not corresponding to ac-      the wind speed at McMurdo (Fig. 7a) particularly questions
tual precipitation at the station) in the “precipitation subset”.   the ability of a model running at 35 km resolution to repre-
However, Durán-Alarcón et al. (2019) also show low values           sent the local flow, even at z = 2000 m, in Antarctic regions
of RHi in the first 3000 m a.g.l. at DDU when conditioning          with complex orography. This also suggests that in reanal-
the radiosonde profiles to precipitation and virga events from      yses with similar or coarser horizontal resolution, the data
in situ radar data, confirming the actual concomitant occur-        assimilation may play a substantial role in reproducing the

www.atmos-chem-phys.net/19/4659/2019/                                                  Atmos. Chem. Phys., 19, 4659–4683, 2019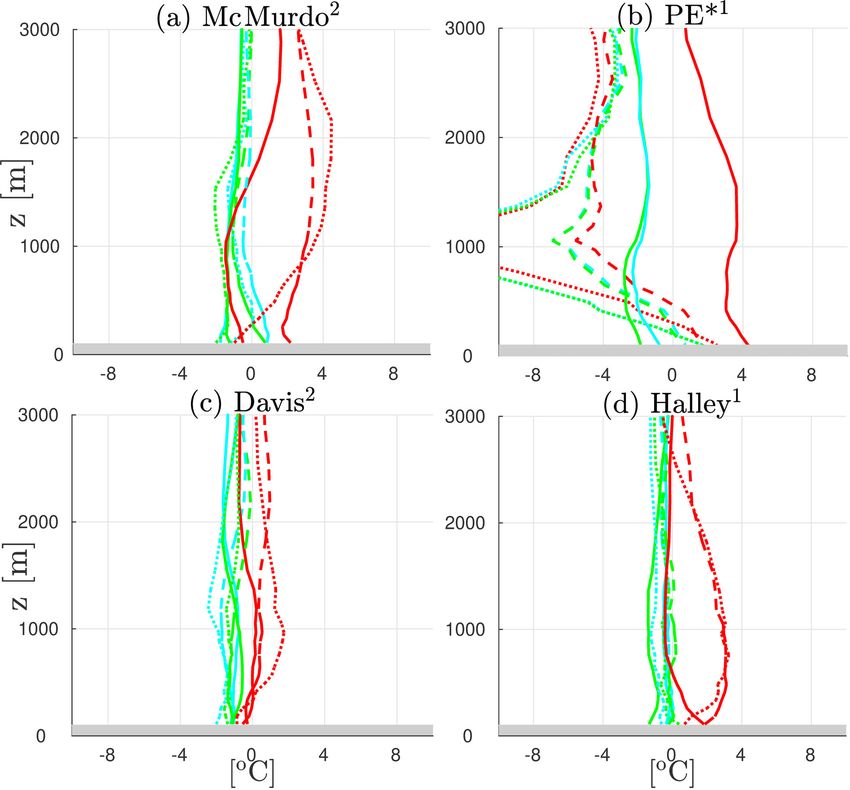
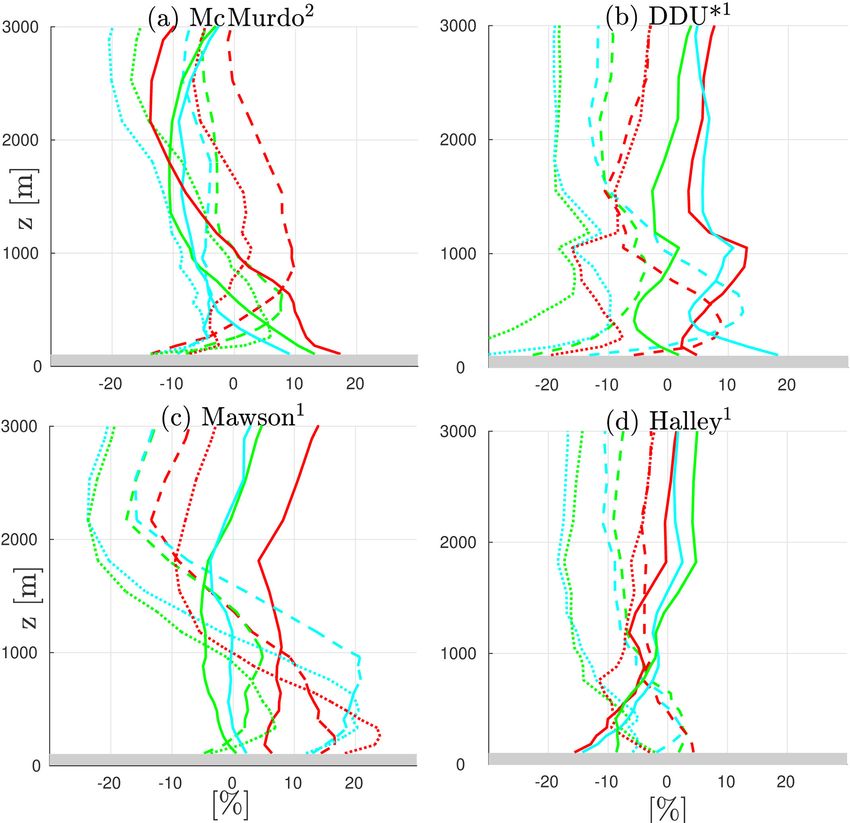
4668                                                         É. Vignon et al.: On the fine vertical structure of the low troposphere

Figure 3. DJF (left panels) and JJA (right panels) vertical profiles of the of the wind speed (top row), temperature (middle row) and relative
humidity with respect to ice (bottom row) from radiosonde measurements at four Antarctic stations. Black lines are the medians, colored
shadings refer to the 10th, 20th, 30th, 40th, 60th, 70th, 80th and 90th percentiles. In the legend, “Pctx” refers to the shaded area that covers
x percent of the data greater than the median and x percent of the data lower than it. The altitude z is above ground level. Wind roses at
z = 500 and at z = 2000 m are also plotted in the top row panels. Numbers in exponential form next to station names in the title indicate the
number of radiosoundings per day at the corresponding station.

Figure 4. Vertical profiles of the wind speed (top row) and relative humidity with respect to ice (bottom row) from radiosonde measurements
at five Antarctic stations along the eastern Antarctic coast. Data sets are restricted to precipitation cases. Black lines are the medians, colored
lines refer to the 10th, 20th, 30th, 40th, 60th, 70th, 80th and 90th percentiles. In the legend, “Pctx” refers to the shaded area that covers
x percent of the data greater than the median and x percent of the data lower than it. The altitude z is above ground level. Wind roses
(conditioned to precipitation events) at z = 500 and z = 2000 m are plotted in the lower row panels. Numbers in exponential form next to
station names indicate the number of radiosoundings per day at the corresponding station.

Atmos. Chem. Phys., 19, 4659–4683, 2019                                                        www.atmos-chem-phys.net/19/4659/2019/
É. Vignon et al.: On the fine vertical structure of the low troposphere                                                           4669

wind statistics at the McMurdo and MZ stations. In katabatic         3.2.2   Temperature
regions, Polar WRF and reanalyses represent reasonably well
the sharp increase in directional constancy from z = 2000            Figure 7 is similar to Fig. 5 but for temperature profiles at
to z = 500 m that shows the contrast between the synoptic            four stations with very different yearly temperature statistics
and the katabatic flows. However, significant deficiencies can       (see Fig. 2). At Davis, not only the median but also the vari-
be noted for the low-level wind speed, especially at DDU,            ability is well reproduced by ERA-I, ERA5 and Polar WRF.
Casey and Davis stations. At these three stations, the median        This result can be extended to the stations in katabatic re-
and the interquartiles are overestimated in the three data sets.     gions: Mawson, DDU and Casey. A cold median bias be-
At the Davis and Casey stations, the simulated median low-           tween 2 and 4 ◦ C can however be noticed at Mawson in ERA-
level flow has an excessive westward velocity, while at DDU          I (see Fig. S7), which can be partly explained by the more
the median low-level wind has a too-pronounced southward             inland location of the nearest ERA-I grid point. At the Hal-
component (Fig. S6). Smallest differences are generally ob-          ley station, ERA-I and ERA5 profiles are very close to those
served for ERA5, even though large values of the 95–5th in-          from radiosonde data. Polar WRF also shows realistic me-
terquartile differences are noticeable, for instance, at Casey,      dian profiles, but it overestimates the interquartiles in the first
where the value exceeds 5 m s−1 at z = 500 m in the two              2000 m. Similar observations can be made for Neumayer sta-
ERA reanalyses. The largest differences are noticeable for           tion (Fig. S7). These two results are actually a consequence
Polar WRF, especially near the ground surface. These differ-         of a warm (and moist) bias in summer and a cold bias in win-
ences actually reflect a too-shallow and too-strong katabatic        ter that compensate on average over the year (not shown).
jet. Albeit observed in both summer and winter seasons, the          The cold winter bias can be explained by too-frequent low-
near-surface wind speed overestimation is more pronounced            level easterly flows in the model, whereas the warm summer
in winter at the three stations and it only occurs in winter at      bias is probably due to the location of the nearest grid point in
the Mawson station (see Table 2). Section 4.3 will investi-          Polar WRF, which is closer to the ocean. The model is hence
gate the possible underlying causes of this strong katabatic         more prone to oceanic influences when the ocean is free of
wind deficiencies in Polar WRF. At the Neumayer and Hal-             ice. At the McMurdo station, ERA-I and ERA5 also show
ley stations, the statistics of the wind structure are well repro-   realistic temperature median profiles and variability, consis-
duced by the ERA5 reanalysis, while ERA-I underestimates             tently with the bi-daily assimilation of radiosonde at this sta-
the variability in the first 500 m above the surface with in-        tion. Polar WRF shows a reasonable median profile, but it
terquartile differences around −4 m s−1 . Polar WRF shows            overestimates the variability. This overestimation can be ex-
correct statistics at Neumayer, but it overestimates the in-         plained by too-frequent warm (and moist) oceanic influences
terquartiles as well as the directional constancy at Halley at       in spring and autumn (not shown).
both z = 500 and z = 2000 m (Fig. 6). This suggests an un-              The strongest temperature differences between reanalyses
derestimation of the synoptic variability in the Halley region       and Polar WRF with respect to radiosonde data are at the PE
in the model and particularly an underestimation of large-           station (in summer). Low-level median profiles are too cold
scale southwesterly flows from the Weddell Sea (not shown).          by ≈ 2 ◦ C in reanalyses and too warm by slightly higher val-
At the PE station, the summer distribution of the wind speed         ues in Polar WRF. The interquartile difference – especially
in reanalyses and Polar WRF significantly differs from the           the 95–5th interquartile difference – are underestimated with
one from radiosonde data. At z = 1000 m, the median dif-             absolute values exceeding 10 ◦ C at z ≈ 1000 m (out of graph
ference is close to 8 m s−1 for the three data sets and Po-          limits). This observation actually reflects the absence of deep
lar WRF shows a much stronger median wind speed over-                surface-based inversions in Polar WRF and reanalyses at PE
estimated by 4–8 m s−1 up to 3000 m. ERA-I shows a very              in summer at radiosonde launching time. In radiosonde data,
excessive median wind speed in the first 1000 m, while in            the summer inversions are mostly observed in February, i.e.,
ERA5, the wind speed and variability are strongly overesti-          at the end of the summer period, when the length of the day
mated between z = 300 and z = 1500 m. Note that these de-            period has already been reduced. Note that reanalyses and
ficiencies are mostly due to an overestimation (in absolute          Polar WRF do reproduce surface-based inversions at the PE
value) of the westward component of the flow (Fig. S6). As           station during calm summer nights, but their timing does not
PE is the sole station from which radiosonde data are not as-        exactly correspond to radiosounding times.
similated, these strong biases question the ability of the free
IFS model at the considered horizontal resolution in repro-          3.2.3   Humidity
ducing the dynamics of Antarctic boundary layer, at least in
the PE region where the air flow is strongly affected by the         ERA reanalyses generally represent well the water vapor
topography of the Sør Rondane Mountains.                             content in the low troposphere at all stations. One excep-
                                                                     tion is at the MZ station, where ERA-I and ERA5 signifi-
                                                                     cantly underestimate the specific humidity in the first kilo-
                                                                     meter above the surface in summer, with median differences
                                                                     reaching approximately −0.50 and −0.85 g kg−1 , respec-

www.atmos-chem-phys.net/19/4659/2019/                                                  Atmos. Chem. Phys., 19, 4659–4683, 2019
4670 É. Vignon et al.: On the fine vertical structure of the low troposphere
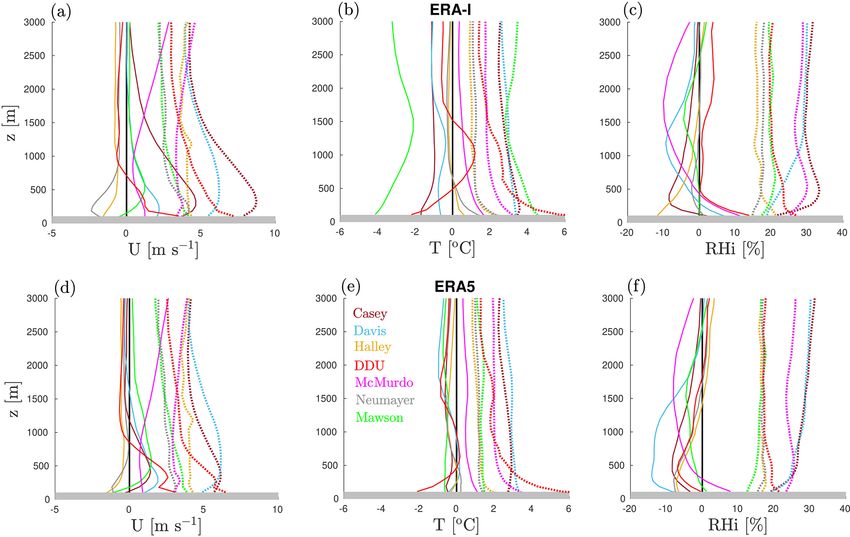
Figure 5. Yearly median differences (solid lines), 80–20th interquartile difference (dashed lines) and 95–5th interquartile difference (dotted
lines) with respect to radiosoundings for wind speed at nine Antarctic stations. Red, green and cyan lines refer to Polar WRF, ERA5 and ERA-
I, respectively. Grey strips delimit the first 100 m above the ground surface. Polar WRF and ERA reanalyses are conditioned to radiosounding
times. Numbers in exponential form next to station names in the title indicate the number of radiosoundings per day at the corresponding
station. The “∗ ” symbol labels the two stations for which only data from December to February are shown.
Table 2. Values of the median difference/80–20th interquartile difference/95–5th interquartile difference with respect to radiosonde wind
speed data at z = 250 m (in m s−1 ) at four Antarctic stations in katabatic regions. DJF and JJA subsets are distinguished.
Station name Season ERA-I ERA5 Polar WRF
DDU DJF 0.021/−0.174/−2.03 1.29/−0.98/−2.40 −1.13/0.85/−0.20
JJA 3.12/1.20/−0.97 4.02/1.73/0.026 8.41/3.76/6.34
Davis DJF 0.73/1.94/3.01 1.27/1.94/1.93 0.97/4.18/6.92
JJA 3.56/4.77/3.41 3.20/2.46/3.19 12.2/10.3/12.4
Casey DJF 2.80/3.43/1.01 0.41/1.23/−1.37 3.43/8.69/8.33
JJA 8.65/7.70/5.44 1.82/6.02/6.33 9.03/17.2/17.8
Mawson DJF 1.23/−1.71/−0.67 0.36/−0.03/1.23 −0.57/−2.14/−0.67
JJA 1.22/−0.81/0.20 1.50/−0.11/1.02 6.20/3.33/5.16
tively. Polar WRF show reasonable yearly median profiles ing, for instance, 0.5, 1.1 and 0.65 g kg−1 at the Davis, DDU
of specific humidity, but the interquartiles are overestimated and Mawson stations, respectively. One likely cause for this
in the first 1000 m at almost all stations (see Fig. S1). This is moist bias is an overestimation of the surface water fluxes
actually explained by a summertime (DJF) overestimation of due to overestimated near-surface wind speed at most sta-
the water vapor content near the surface, with values reach- tions (see Sect. 3.2.1). It should also be noted that near the
Atmos. Chem. Phys., 19, 4659–4683, 2019 www.atmos-chem-phys.net/19/4659/2019/You can also read