WEATHERSMART NEWS - South African Weather Service
←
→
Page content transcription
If your browser does not render page correctly, please read the page content below
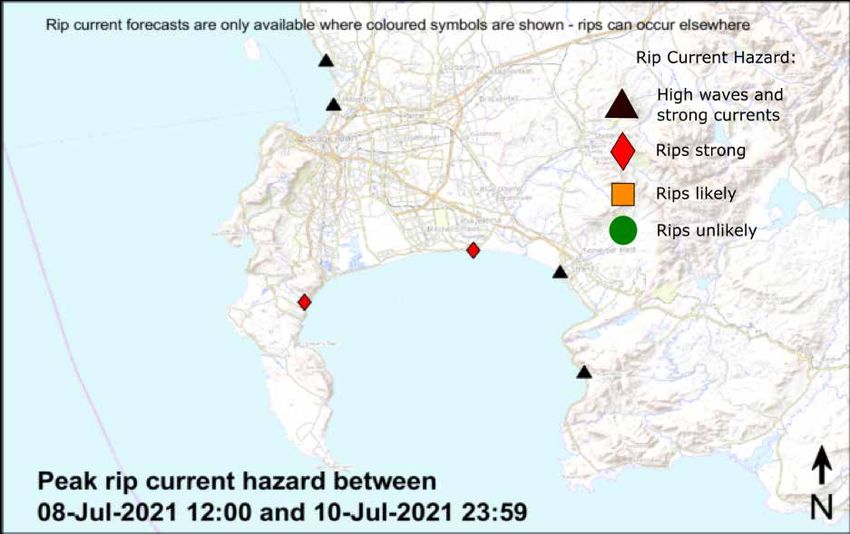
WEATHERSMART
 NEWS Scientific meteorological and climatological
 news from the South African Weather Service

 October 2021
 New regional Weather and
 Climate Summaries: Gauteng
 Province
 Adverse winter weather over the
 Eastern Cape: 1 to 3 June 2021
 Devastating fires on Table
 Mountain at the University of
 Cape Town: 18 to 20 April 2021
 Pilot Operational Rip Risk
 Warning System

WEATHERSMART
 NEWS Scientific meteorological and climatological
 news from the South African Weather Service

 Impact-Based
 Severe Weather Warning System
 WHAT IS IMPACT-BASED FORECASTING?

Severe weather is a regular occurrence across South Africa which often negatively affects humans. Due to the vast
distribution of vulnerabilities across the country, the same weather hazard can result in different impacts in two
areas, depending on the specific vulnerability of the area.

Impact-Based warnings combine the level of impact the hazardous weather conditions expected with the level of
likelihood of those impacts taking place

 Moving from To

 What the weather will be: What the weather will do:
 (Meteorological thresholds) (Impact Warnings)
 - 50mm in 24 hours - 35 knot winds - Roads flooded - Communities cut off

 Date of issue:
 October 2021

 Frequency:
 Bi-annual Publisher:
 South African Weather Service
 ISSN: Address:
 2414-8644 Eco Glades Block 1B, Eco Park,
 Corner Olievenhoutbosch and
 Compiler and editor: Hannelee Doubell Ribbon Grass Streets,
 Centurion, 0157

2 WeatherSMART News August 2021

TABLE OF
CONTENTS
Foreword by the Chief Executive Officer, Mr Ishaam Abader........2

New Regional Weather and Climate Summaries: Gauteng
Province by Andries Kruger................................................................3

Presenting the South African Weather Service (SAWS)
Lightning Detection Network and related services to the
South African Institute of Electrical Engineering (SAIEE)
Lightning Chapter (LC) by Rydall Jardine and Morné Gijben...................9

Adverse winter weather over the Eastern Cape – 1 to 3
June 2021 by Ayabonga Tshungwana and Nompumelelo Kleinbooi..........12

The Performance Assessment of Six Global Horizontal
Irradiance Clear Sky Models in Six Climatological Regions
in South Africa by Brighton Mabasa, Meena D. Lysko, Henerica
Tazvinga, Nosipho Zwane and Sabata J. Moloi .......................................18

The Ångström–Prescott Regression Coefficients for Six
Climatic Zones in South Africa by Brighton Mabasa, Meena D.
Lysko, Henerica Tazvinga, Sophie T. Mulaudzi, Nosipho Zwane and
Sabata J. Moloi................................................................................25

Devastating fires on Table Mountain at the University of
Cape Town: 18 to 20 April 2021 by Ntshalle Stella Nake, Cape
Town Weather Office. .......................................................................32

Pilot Operational Rip Risk Warning System by Carla-Louise
Ramjukadh.....................................................................................38

Meet the Authors........................................................................44

 WeatherSMART News February 2021 1

Foreword by the Chief Executive Officer
As CEO of this prestigious and internationally recognised were published in Multidisciplinary Digital Publishing
entity since April 2021, I am delighted to welcome our Institute (MDPI) Energies should satisfy their curiosity in
readers to the Weathersmart News of October 2021. this regard.
This publication contains scientific weather news and is
published twice a year to share some of our scientific An article on the devastating fires on Table Mountain
work with the public. and at the University of Cape Town talks to the bush
 fire disaster that occurred from 18 to 20 April 2021,
This edition covers the new Regional Weather and causing huge damage to some historical buildings at the
Climate Summaries for Gauteng, developed by our University of Cape Town, among other damage.
scientists in our Climate Service department. The series
provides a broad overview of the climate and weather We end this edition with a very interesting article on a
of different regions in South Africa, especially those project in its pilot phase which seeks to operationalise a
regions that are of relative greater economic and/or Rip Risk Warning System in South Africa. As rip currents
demographic significance in the country. are currently not being operationally forecast and
 warned for in South Africa, and more than 30 drownings
The article on the South African Weather Service (SAWS) occur annually due to rip currents, work in this regard is
Lightning Detection Network and related services to the of future significance to protect the lives of beach goers,
South African Institute of Electrical Engineering (SAIEE) especially during the holiday seasons.
Lightning Chapter (LC), which demonstrates the value of
this system to weather sensitive energy industries. I would like to congratulate our scientific personnel
 for their contributions to the WeatherSMART news of
From 1 to 3 June 2021, adverse weather conditions that October 2021 and hope that the content is enjoyed by
occurred over the Eastern Cape, brought welcome relief a wide audience of weather enthusiasts, scholars and
to some areas in the region. A ridging high-pressure researchers.
system, coupled with a cut-off low (COL) over the eastern
parts of the country formed the dominant systems. These
two systems resulted in showers and thundershowers Ishaam Abader
over the southern and eastern parts of the Eastern October 2021
Cape and very cold conditions were experienced. SAWS
issued warnings, including for snowfall, for the system
which had a likelihood of significant impacts. The way
in which this system was forecast and warnings issued
demonstrates the importance of local forecasting skills
to accurately forecast impacts related to expected
adverse weather.

For those interested in the deeper levels of scientific
research by our scientists, two scientific articles on
The Performance Assessment of Six Global Horizontal
Irradiance Clear Sky Models in Six Climatological Regions
in South Africa and The Ångström–Prescott Regression
Coefficients for Six Climatic Zones in South Africa that

2 WeatherSMART News August 2021
New Regional Weather and Climate
 Summaries: Gauteng Province
 by Andries Kruger
 Department: Climate Service

Introduction Topics covered

The Climate Service department of the South African Topics for inclusion in the series broadly are similar to
Weather Service (SAWS) recently released the first those included in the series of SAWS publications that
publication in a new series of Regional Climate and provide overviews of the South African climate and
Weather Summaries (https://www.weathersa.co.za/ are mainly divided into a range of common weather
home/regionalweatherclimate), which focuses on the parameters. The first of these publications was
Gauteng province. The series provides a broad overview completed in 2002 on surface winds and covered the
of the climate and weather of different regions in South whole country. The publications that followed were
Africa, especially those regions that are of relative developed according to the same principle, with the last
greater economic and/or demographic significance in one, published in 2008, on surface temperature. The
the country. The first in the series focuses on the Gauteng above publication series covered their individual topics
province as it is the most populous of the nine provinces in fair detail and it was envisaged in the planning phase
of South Africa and the main economic hub of the that the regional climate publications will at least cover
country. The publication is comprehensive and consists most of the relevant aspects of the climate included in
of 53 figures and graphs, 15 tables and comprises almost the last series. In addition a range of additional content
60 pages. This article presents a summary of the contents that could potentially be included in the new publication
of the publication and those aspects of the weather and was identified from the desktop analysis of international
climate which, in general, can be expected to be included publications. Thereafter, the proposed content was
in forthcoming publications for other regions. arranged into a coherent structure.

During the planning phases of the series a thorough Content
needs analysis was done to explore the possible content
to include in the publication. This process involved The content of the publication follows a logical structure,
mainly the examination of available regional climate with an introduction explaining the factors that control
publications internationally, thereby obtaining ideas the region’s climate and therefore the general climate
and approaches which will be useful in the development in relation to other climate regimes in South Africa.
of the format of the publication. All possible countries This is followed by detailed chapters about the main
which could have comprehensible information climate parameters in which the envisaged audience will
language-wise, were investigated. However, the focus mostly be interested in. A conclusion chapter discusses
remained on the publications which are produced by the impact of climate change on the region through
National Meteorological and Hydrological Services who, evidence of observed climate change and its impacts.
in most instances, have access to most climate data in a Introduction
particular country In conclusion the envisaged content
was divided into additional information and alternative The factors influencing the weather and climate are
formats to those presented in the current SAWS general presented, how the province is situated in relation to the
climate publications, which could possibly be considered diverse climate regions of South Africa and the
for the publication. In addition, it was also considered differences in weather experienced on a seasonal basis.
that these publications should present baseline For example, according to the Köppen Climatic
information on the weather and climate of a particular Classification System, Gauteng is situated in the interior
region, to support the information already available in the eastern half of South Africa, experiencing relative
from the information portal of the National Framework moderate weather and climate conditions, classified as
for Climate Services (NFCS). Cwa (summer rain with hot summers) in the north and

 WeatherSMART News August 2021 3
Cwb (summer rain with cool summers) in the south.. A more detailed classification system developed by SAWS places
Gauteng mostly in the Moist Highveld Grassland region and the Central Bushveld in the north, as presented in
Figure 1.

Figure 1: The Climatic Regions of South Africa: 1. Northern Arid Bushveld 2. Central Bushveld 3. Lowveld Bushveld 4. South-Eastern Thornveld
5. Lowveld Mountain Bushveld 6. Eastern Coastal Bushveld 7. KwaZulu-Natal Central Bushveld 8. Kalahari Bushveld 9. Kalahari Hardveld
Bushveld 10. Dry Highveld Grassland 11. Moist Highveld Grassland 12. Eastern Grassland 13. South-Eastern Coast Grassland 14. Eastern
Mountain Grassland 15. Alpine Heathland 16. Great and Upper Karoo 17. Eastern Karoo 18. Little Karoo 19. Western Karoo 20. West Coast
21. North-Western Desert 22. Southern Cape Forest 23. South-Western Cape 24. Southern Cape.

Wind

The climate controls described in the previous section
have a direct influence on the general wind field over
the province. The high-resolution wind resource map
developed by the Wind Atlas for South Africa project
(WASA: www.wasaproject.info) is included and sheds
more light on the spatial variation of the average wind
speed in the province. In the north-west winds tend to
be lightest, while in the south-west the winds are the
strongest. The mean wind speed tends to follow the
topography of the province with the northern parts
generally lower than the south, as presented in Figure 2.

 Figure 2: WASA High Resolution Wind Resource Map for Gauteng
 province. Mean wind speed (m/s) at 50 m above ground with
 lower wind speeds in green (< 3 m/s) and higher wind speeds in red
 (> 7 m/s) (www.wasaproject.info).

 4 WeatherSMART News August 2021
Also discussed are the annual and diurnal variation of wind speed and strong winds of short duration, the causes
thereof and the likelihood and documented occurrences of tornadoes. For example, Figure 3 presents the 5-minute
measurements of wind gust (m/s), wind direction (degrees), surface temperature (°C), rainfall (mm) and surface
pressure (hPa) at the Irene weather office on 30 December 2017, when one of the strongest wind gusts was recorded
at the station.

Figure 3: 5-minute measurements of wind gust (m/s), wind direction (degrees), surface temperature (°C), rainfall (mm) and surface pressure
(hPa) at the Irene Weather Office on 30 December 2017.

Surface temperature

The average surface temperature is governed by the
general circulation patterns and topography, amongst
others. The mean seasonal temperatures as well as
minimum and maximum temperature, are presented
in map format, from which it can be deduced that the
northern parts of the province generally experience
higher temperatures than the south (this feature of
surface temperature is related to the topography, where
lower (higher) elevations experience higher (lower)
temperatures). As an example, Figure 4 presents the
mean winter (JJA) minimum temperature (°C) over
Gauteng, based on topography and data for the period
1991 – 2020. Figure 4: Mean winter (JJA) minimum temperature (°C) over Gauteng,
 based on topography and data for the period 1991 – 2020.

Extreme temperatures and the synoptic
conditions that occurred during the recording
of all-time maximums and minimums are
discussed in detail. Figure 5 presents the
highest ever temperature recorded at the
UNISA automatic weather station.

Figure 5: 5-minute graph of surface temperatures
measured on 7 January 2016 at Pretoria UNISA
automatic weather station.

 WeatherSMART News August 2021 5
In addition, frequency tables of temperature in specified available from the Global Solar Atlas web portal (https://
ranges of 5 °C, at specified times for some weather globalsolaratlas.info/), endorsed by the World Bank, and
stations in the province, are included and the topics of presented in the publication.
apparent temperature and the likelihood of frost are
discussed. Precipitation

Sunshine and Cloudiness As an introduction, the annual and seasonal distribution
 of rainfall is presented in map format (see Figure 7).
Gauteng receives a relative high amount of sunshine,
compared to the rest of the world, but not particularly
so for South Africa. The province receives just more than
70% of the maximum possible sunshine, which equates
to an annual average of more than 8 hours of sunshine
per day. In comparison, the western interior receives
more than 80% and the east coast mostly below 55%.
This spatial variation of mean sunshine received over
the country is presented in map format, with additional
monthly maps. An analysis of daily sunshine shows that,
on an annual basis, Gauteng experiences fewer than 10
overcast days, in the region of 20 cloudy days, just over
300 sunny days and more than 150 fine days, with the
last-mentioned mostly occurring in the winter and early
spring. The monthly variation of the days is presented
graphically in Figure 6.

 Figure 7: Mean spring (SON) rainfall (mm) based on topography and
 data over the period 1991 – 2020.

 The frequencies of wet and dry years, the Standardised
 Precipitation Index (SPI) and the Standardised
 Precipitation Evaporation Index (SPEI) and trends
 thereof over the long-term are discussed (see Figure 8).
 In addition, the role of El Niño/South Oscillation on the
 rainfall over the province is discussed.

Figure 6: Average number of cloudy days in Gauteng per month
(1991 – 2020).

With the drive from fossil fuels to renewable energy
sources, wind and solar energy have become increasingly
important for our future energy needs. Gauteng’s
position in the north of South Africa restricts the local
exploitation of wind for energy generation, compared
to the relatively windy south. Solar energy is a very
viable source of energy in the province. Solar energy
resource information is widely available, particularly
in atlas format. Developers and users of solar energy
are mostly interested in the direct normal irradiation,
global horizontal irradiation and resultant power Figure 8: 12-month SPEI for OR Tambo International Airport
potential. Atlases with this information are readily (1953 – Jan 2021).

6 WeatherSMART News August 2021
Following on the above the average number of rainy days Climate change
per month, above-specific thresholds are presented as
well as the likelihood of rainfall during specific hours of Due to the increase in greenhouse gases since the
the day in the different seasons. Industrial Revolution, of which carbon dioxide is the
 most important, the atmosphere has been gradually
Floods are usually caused by persistent rainfall of various warming over a long period of time. The increase in
intensity over a prolonged period or a lot of rainfall over atmospheric warming can be traced back for centuries
a short period. In Gauteng floods are usually caused by and has increased over the last 100 years by about 1
the latter. The automatic weather station technology °C. This warming of the atmosphere obviously causes
that SAWS utilises provides the rainfall amounts to a warmer surface temperatures in general but also
frequency of five minutes. The frequencies with which changes other atmospheric properties, e.g. changes
the rainfall exceeded 5 mm, 10 mm and 15 mm within in the general circulation and the likelihood of climate
a five-minute period over the 1991 – 2020 period extremes, amongst others. The change in the global
were analysed and are presented in tabular format. In climate is expected to accelerate and there are already
addition, the mean monthly frequencies of reported clear signals that this is happening. The long-term
heavy precipitation events are presented. changes in the climate and extreme weather occurrences
 are discussed. For example, Figure 9 presents the annual
 average surface temperature deviation at OR Tambo
 International Airport for the period 1955 to 2020, which
 clearly indicates a warming trend close to 0,2 °C per
 decade over the analysis period.

Figure 9: Annual average surface temperature deviations at OR Tambo International Airport for the period 1955 to 2020
(base period: 1981 – 2010).

 WeatherSMART News August 2021 7

As mentioned, climate change is mostly experienced weather event causes also influences its coverage in the
through increased occurrences of anomalous weather media. In spite of the above shortcomings it is important
events, e.g. very hot days. The trends in the frequencies to analyse these reports to assess the most prevalent
of extreme events in the province, in comparison to the events and whether a trend in these events can be
rest of the country, are discussed. discerned. It is shown that in Gauteng, most significant
 weather reports are on floods, hail and strong wind and
An assessment of the frequencies of specific weather their related impacts. The annual number of reports
events (e.g. large hail or floods) over a long period of on floods, hail and strong wind were analysed over the
time can only be done through an analysis of media period 1961 – 2020 and presented graphically. For all
reports. SAWS produces the CAELUM publication which these types of events increasing trends are noticeable,
provides a geocoded list of significant weather events as shown for heavy rain and flooding in Figure 10. These
which were reported in South Africa from 1647. It should trends can be ascribed to an increase in population
be noted that such reports are highly dependent on density (and therefore more people are affected and can
demographics and population density, where a relatively report events) as well as a probable increase in severe
high population density and the presence of the print weather events, e.g. stronger thunderstorms. The
media and other documenters makes the documentation last-mentioned hypothesis can be linked to the results
of significant weather events more probable. Also, the presented in the previous section, which indicates an
amount of damage and/ or loss of life that a significant intensification in rainfall events over the province.

Figure 10: The annual number of reports on heavy rain and flooding in the Gauteng province over the period 1961 – 2020.

Way forward

It is envisaged that the regional weather and climate series will continue in the 2021/22 financial year, with the
next publication that will focus on the South-Western Cape. For each of these publications, special emphasis will
be placed on the weather and climate that significantly impact the region. For example, the South-Western Cape
publication will include a section on veld fires, which is a regular occurrence in the winter rainfall regions of South
Africa. This series is envisaged to be regarded as the reference point of climate information for the country and will
be disseminated as a SAWS public good service through the National Framework for Climate Services.

 8 WeatherSMART News August 2021
Presenting the South African Weather Service
 (SAWS) Lightning Detection Network and related
 services to the South African Institute of Electrical
 Engineering (SAIEE) Lightning Chapter (LC)
 by Rydall Jardine and Morné Gijben

The South African Weather Service (SAWS) Lightning that more than 90% of CG lightning flashes can be
Detection Network (LDN) was initiated through a detected), while the Location Accuracy (LA) refers to the
stakeholder engagement process with Eskom in 2005 distance in which a detected lightning stroke is placed
and consists of sensors designed to detect Cloud-to- with regard to the actual lightning stroke.).
Ground (CG) lightning activity with great accuracy. CG
lightning, as the name suggests, is the lightning that
occurs between the cloud and the ground and is also the
lightning that affects us. Although designed for detecting
CG lightning, the sensors in the network are also capable
of detecting a portion of cloud lightning, which is the
lightning occurring inside clouds.

The existing network has 24 SAWS-owned sensors and
one owned by the Eswatini Meteorological Service.
Currently, 17 of the SAWS-owned sensors and the
Eswatini-owned sensor are the Vaisala LS-7000 version.
Another four SAWS-owned sensors are the Vaisala LS-
7001 version, while three of the SAWS-owned sensors
were upgraded to the Vaisala LS-7002 version in 2020,
with further upgrades planned over the next three years.
SAWS has also upgraded its Total Lightning Processor
(TLP) software in 2019 with enhanced algorithms. Figure
1 shows the existing positions of the LDN sensors across
South Africa.

 Figure 2: Detection Efficiency (left) and Location Accuracy (right)
 projections of the network.

 From a lightning data application perspective, real-time
 observations of lightning across South Africa play an
 important role in the monitoring and nowcasting of
 thunderstorms. Since all thunderstorms contain
 lightning, real-time data is used to monitor the position,
Figure 1: Existing positions of LDN sensors across South Africa. movement and how electrically active a storm is. This
 information is also used to supplement other observation
The network coverage maps in Figure 2 provide an platforms such as weather radar and satellite
indication of the area being serviced, with an indication observations and is used to assist with storm tracking
of the projected Detection Efficiency (DE) and the and nowcasts. Lightning information is very useful in
Location Accuracy (LA). The DE represents the percentage areas not covered by radars or when a radar is not
of all lightning flashes that can be detected (90% means available. In such cases lightning tracking can be utilised.

 WeatherSMART News August 2021 9
As per the example below, the current storm cell tracks can be provided within the redline outlay and the movement
of the storm cells can be nowcasted for the next 30 minutes (blueline outlay) and 60 minutes (greenlined outlay).
This is very helpful for nowcasting the expected movement of storms in the next hour whenever radar is not available
or to supplement radar observations and nowcasts.

Figure 3: The tracking and nowcasting of lightning cells.

Historical lightning information from the SAWS LDN has been available since 2006 and is useful for many applications.
One such an example is for the development of lightning prediction models. Historical lightning observations were
used to train a model by using machine learning techniques to provide a daily probability forecast for lightning from
Numerical Weather Prediction (NWP) model parameters. This model forecast is available early in the morning and
provides a probability outlook of where lightning could be expected during the day. Figure 4 is an example for
20 December 2013, where the model on the left shows the forecast for the day, while on the right the actual
observed lightning activity for this day is shown.

Figure 4: The model-based lightning probability forecast (left) and the actual observed lightning (right).

10 WeatherSMART News August 2021
The historical lightning data is utilised for climatological purposes, where various maps such as the Average Lightning
Ground Flash Density, Median Peak Kiloampere, Average Flash Multiplicity (number of strokes in a flash) and several
lightning risk maps are produced and updated annually. This information is extremely useful for climatological studies
as well as for design and planning purposes by many industries. Figure 5 shows examples of typical lightning
climatology maps.

Figure 5: Typical lightning climatology maps produced by SAWS and updated annually.

With a diminishing Government Grant, SAWS implemented a cost recovery strategy across its infrastructure
technology applications. Eskom utilises lightning data for overhead line design (route selection), performance analysis
during design, asset management of existing lines and fault correlation. The aviation industry requires the lightning
activity in the vicinity of an airport in order to stop operations during storms. The insurance industry receives many
lightning-related claims and SAWS’ lightning data is used extensively for claim verification purposes. The graph in
Figure 6 (left) provides a typical indication of the number of lightning activity enquiries from the insurance sector as
indicated by the blue line, in relation to all queries received from the insurance sector as indicated by the orange line.
This shows lightning enquiries form a large component of insurance-related queries received by SAWS. Figure 6
(centre) represents an Overhead High Voltage Cable path from a power utility such as Eskom, and the spatially-
correlated lightning occurring in a buffer zone around the line. Figure 6 (right) represents a lightning alert system
over O.R. Tambo International Airport where activities in and around airport are broken into 5 km rings expanding to
15 km around the airport.

Figure 6: The typical amount of lightning (blue line) and total number (orange line) of queries received from the insurance
sector (left), example of correlated lightning to power lines (centre) and a lightning alert system over O.R. Tambo International
airport (right).

 WeatherSMART News August 2021 11
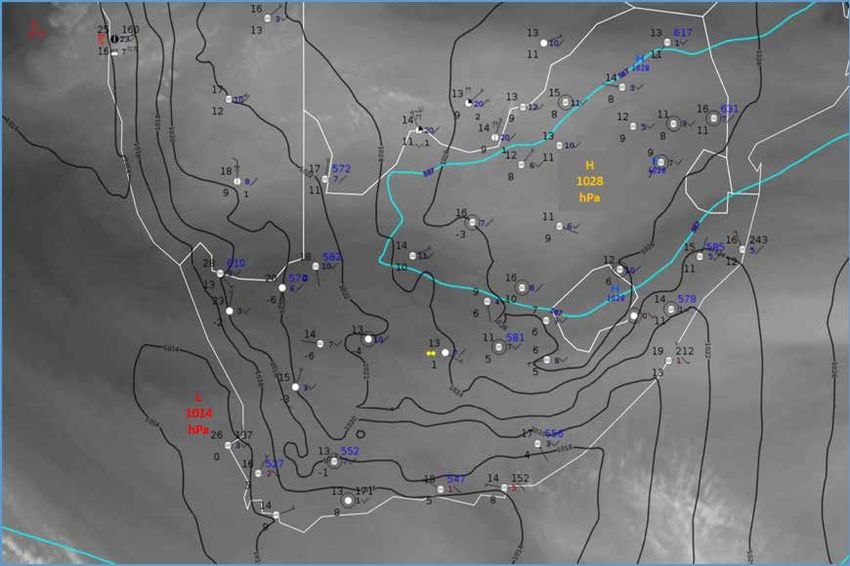
Adverse winter weather over the
 Eastern Cape: 1 to 3 June 2021
 by Ayabonga Tshungwana and Nompumelelo Kleinbooi

From 1 to 3 June 2021, adverse weather conditions that Individual parameters
occurred over the Eastern Cape, brought welcome relief
to some areas in the region. A ridging high-pressure Rainfall
system, coupled with a cut-off low (COL) over the eastern
parts of the country formed the dominant systems, as
seen in Figure 1. These two systems were expected to
result in showers and thundershowers over the southern
and eastern parts of the province from Tuesday, 1 June
2021, with good chances for showers along the Wild
Coast and adjacent interior. Further, these systems were
advecting cold air over the province, with very cold
conditions over the north-eastern high ground where
snowfalls were expected.

 Figure 2: Model outputs showing expected precipitation for
 01 June and 02 June 2021

 Significant amounts of rainfall were expected to result
 in flooding of roads and settlements, low-lying areas as
 well as bridges. Traffic disruptions, damage to property
 and infrastructure and isolated incidents of rockfalls
 were expected over the OR Tambo District Municipality
 (DM), Alfred Nzo DM, places over Amathole DM and the
 eastern parts of Chris Hani DM. The expected rainfall
 amounts can be seen in Figure 3 below.
 Table 1: Observed rainfall amounts for 1 to 3 June 2021 in places over
 the eastern parts of the province.

 Observed rainfall amounts (mm)
 Station
 1 June 2 June 3 June Total
 Coffee Bay 67.4 81.4 15.4 164.2
 Port Edward 78.2 57.6 22 157.8
 Mthatha 17.4 30.8 1.8 50
Figure 1: Dominant systems over South Africa on 1 June 2021 Barkley East 2.4 0.8 24 27.2
 Elliot 13.6 6.8 3.2 23.6

12 WeatherSMART News February
 August 2021
 2021
Snowfall

Low freezing levels were expected over the north-
eastern high ground, where snowfall was expected.
Accumulations of 0.5 to 5 cm were expected, with 6 to
15 cm over the Sakhisizwe Local Municipality (LM),
Elundini LM and Matatiele LM as shown in Figure 3.

 Figure 4: Satellite image showing snowfall over the southern
 Drakensberg on 4 June 2021 (EUMETSAT, 2021)

 Daytime temperatures

 These systems resulted in the first cold to very cold
 conditions of the winter season, with the daytime
 temperatures ranging between 5 to 10 °C over the
Figure 3: Expected snow accumulations over the north eastern high north-eastern high ground from 1 to 3 June.
ground from 1 June to 2 June 2021 (UM SA4km)

 WeatherSMART
 WeatherSMARTNews
 NewsFebruary
 August 2021 13
Warnings Issued and observed impacts

 Issued warnings

 Figure 6 shows the warnings that were issued for the
 event, with the first warnings sent out on 31 May 2021,
 valid from 1 to 3 June 2021. Two snowfall warnings were
 issued, with a high likelihood of minor impacts (yellow
 level 2) and a medium likelihood of significant impacts
 (orange level 5). Moreover, three rainfall warnings were
 sent out, a yellow level 2 and an orange level 5. The
 orange level 5 was later upgraded to a high likelihood of
 significant impacts (orange level 6).

Figure 5: Expected daytime temperatures for 1 to 2 June 2021 over
the Eastern Cape (UM SA4km)

Table 2: Observed daytime temperatures over the north-eastern
highground.

 Temperature observations (°C)
 Station
 01 June 02 June 03 June
Barkley East 07 09 09
Elliot 08 09 07
Molteno 10 09 09

 Figure 6: Issued IBF warnings for 1 to 3 June 2021

14 WeatherSMART News August 2021
Table 3: Expected and observed rainfall impacts.

 Rainfall
 Impacts expected Impacts observed

Flooding
(settlements)

Flooding
(low-lying bridges/roads)

Communities
cut-off/loss of livelihood

Rockfalls

 WeatherSMART News August 2021 15
Table 4: Table showing expected and observed snow impacts.

 Snow
 Impacts expected Impacts observed

Slippery roads

Traffic disruptions

Loss of livestock and crops

Accumulation of snow

16 WeatherSMART News August 2021
Conclusion

The dominant systems which resulted in adverse weather conditions were captured well by the models, which
then gave the forecasters confidence to issue snow and rainfall warnings ahead of time. Areas between Coffee
Bay and Port Edward reported flooding of roads, settlements and low-lying bridges. Some communities were
temporarily cut-off, with traffic disruptions observed due to flooded bridges.

Moreover, rockfalls and localised landslides were also observed. The accumulation of snow over the southern
Drakensberg and surrounding areas resulted in slippery road conditions, traffic disruptions and loss of crops.
Some incidents of livestock losses were also expected, although no reports were received.

Finally, an increased knowledge and skill in the different vulnerabilities and sensitivities of the various areas over
the province will be of benefit in forecasting future impacts related to expected adverse weather.

 WeatherSMART News August 2021 17
The Performance Assessment of Six Global
 Horizontal Irradiance Clear Sky Models in Six
 Climatological Regions in South Africa
 by Brighton Mabasa , Meena D. Lysko*, Henerica Tazvinga, Nosipho Zwane and Sabata J. Moloi*

1. Introduction The dynamic nature of the atmosphere results in biases
 when the modelled data are compared to data recorded
Clear sky models are used to estimate the amount of using a reference pyranometer under clear skies.
solar irradiance that reaches the Earth’s surface under
cloudless atmospheres. The global horizontal irradiation The biases in different locations can only be quantified
(GHI) clear sky radiation model is an algorithm that is by the validation of models. Badescu et al., 2013 [10]
solved by providing inputs that describe the state of emphasised the need for the validation of models
the cloudiness atmosphere at a specific location and because some models have never been validated in some
time to output theoretical GHI at that location and time regions with differences in atmospheric constituents
[1]. In this study, the cloudless atmosphere is meant to to the areas where the models were developed. On
exclude clouds but include aerosols. Clear sky irradiance the other hand, Antonanzas-Torres et al., 2019 [7]
data are important for various applications such as solar emphasised testing different models on a site because
radiation forecasting and the calculation of maximum models perform differently. The validation of models is
possible output yield of solar photovoltaic systems the best way to assess the suitability of different models
[1–9], cloudiness index calculation [2,3,5,7] and data in different areas other than where they were developed,
quality control [3–7,10]. Clear sky solar irradiance is also for instance, in areas with different atmospheric content,
used as the basis for deriving solar radiation estimates albedo, latitude, and altitude.
from satellite images [1,5,8,10], the calibration of sensors
[3,4], the evaluation of cooling loads of commercial According to Polo et al. [1], the major challenges in clear
structures [1,4,5,8], the building of databases for sky radiation model validation are the unavailability of
testing radiation separation models [2,5], determining high spatio-temporal atmospheric input parameters
geographical areas where irradiance estimates are and not having access to specialised databases to be
uncertain [4] and for the filling of missing historical data able to derive some of the atmospheric inputs that are
records [10]. not measured. The detection of clear sky days was also
 another challenge highlighted by [1]. In this study, to
There are no sensors to measure clear sky irradiance nor mitigate the challenges in the reviewed literature and to
a universal model; the only way to generate clear sky improve on what has been done, measured temperature,
irradiance data is by filtering in-situ readings taken from pressure and humidity from each of the stations have
pyranometers for periods when there are no clouds been used as inputs to the models. Meteorological input
or by trying different models at different locations. parameters which are not measured in-situ are attained
Various models have been developed, improved, and from specialised databases. In this study, satellite albedo
validated to estimate clear sky GHI data. Even though data are used instead of a suggested default value, such
there are advanced methods to derive GHI data, as 0.2 in Bird et al. [17,18].
ground monitoring using a pyranometer remains the
most accurate way to collect data [11,12]. However, The clearness index threshold (KT), which is the ratio
pyranometer measurements are limited or scarce due to of        , is one of the methods that is used to classify
the high costs involved in the installation, maintenance, clear sky times. From the studies, it has become evident
and calibration of the sensors. The optical transparency that different areas or climates have different ratios.
of the atmosphere, physics of the model inputs and There is no standard scale and since KT varies per site,
the effects thereof are still not fully understood [13], the chosen ratio per site might not be accurate and
making it difficult to accurately model clear sky GHI. might result in the classification of cloudy times as clear,
 introducing biases in the results.

* Non-SAWS

18 WeatherSMART News August 2021
Clear sky times can be detected using observation cloud sky models. The validation of clear sky models is ongoing
data or data from sky imagers. The challenge with this worldwide, but limited work has been performed in
method is that observation cloud data are scarce or only South Africa where all climatic zones are considered
available at certain times and places. Moreover, clear to determine the most suitable and better performing
sky imagers are not available to some meteorological model which can be used to estimate minute GHI under
institutions because they are expensive. In the area clear sky conditions. In this paper, the performances of
of study, there were no observation cloud data, no six GHI clear sky models, namely: Bird (1981) [17,18],
clear sky imagers and no standard ratio KT for areas Simple Solis (2008) [24,25], McClear (2013) [15],
of the study. Clear sky days are therefore detected by Ineichen–Perez (2002) [26,27], Haurwitz (1945) [28,29]
using total cloud cover data from the fifth generation and Berger–Duffie (1979) [30], are investigated relative
European Centre for Medium-Range Weather Forecasts to in-situ data from 13 South African Weather Services
(ECMWF) atmospheric reanalysis of the global climate (SAWS) reference stations and across the diverse
(ERA5) [19] reanalysis dataset. Based on the literature macro-climates in South Africa. This validation study
review, no study has previously used this dataset to covers more stations and uses more clear sky days than
detect cloudless days for clear sky model studies. ERA5 previous studies and enables a fuller assessment of
data allow for more clear sky days to be detected and clear sky models. The models were chosen based on the
used. An additional methodology by Reno and Hansen availability of inputs, implementability with open source
(2016) [20] has been applied to filter out not clear sky (Python, from Amsterdam in the Netherlands), and their
times and outliers introduced by factors other than presence in the literature to enable the comparison with
clouds which are too small to be detected by quality other validation results.
control methodologies.
 2. Data and Methodology
From the different clear sky model validation studies
reviewed, different models performed differently in 2.1 Data
different climates and the performances of the models The study area was determined by considering the
were found to be influenced by the input parameters. locations of the SAWS radiometric stations which
It was also found that measured input parameters measure the 1-min GHI data. The area of study is thirteen
produced better results compared to default inputs sites located in all six macro-climate regions in South
and that some specialised gridded reanalysis databases Africa. These macro-climate regions and the location of
are good model inputs. In South Africa, a few studies the 13 sites in the study area are shown on the map in
have been performed by [21–23]. They all used 1-year Figure 1 (in the previous study). GHI data were collected
reference GHI data to validate the models, and at most using secondary standard, CMP11, Kipp and Zonen
eight locations were used by Zhandire (2017) [21]. pyranometers. Hourly average values of temperature,
However, those locations did not cover all climatic humidity and pressure from areas corresponding to GHI
regions of the country and only four clear sky models measures were also collected.
were validated. Patel and Rix (2019) [22] validated two
clear sky models in Stellenbosch using only one clear sky The various clear sky models require different input
day per season and used the default inputs and not the parameters. Some input parameters are common.
real measurements. Javu et al., 2019 [23] used only five All the input parameters required by the six different
clear sky days for five locations and highlighted that it models are summarised in Table 1.
was not enough to fully assess the performance of clear

 WeatherSMART News August 2021 19
Table 1. Model and input parameters required.

 Input/Model Bird Simple Solis Ineichen- McClear Haurwitz Berger-
 Perez Duffie
 Zenith Angle X X X X X X
 Albedo X - - X - -
 AOD1240nm X X - - - -
 AOD550nm X X - X - -
 AOD380nm X - - - - -
 AOD500nm X - - - - -
 AOD700nm - X - - - -
 Temperature X X - X - -
 Humidity X X - X - -
 DNITOA X X X X - X
 D (Julian day) X X X X X X
 1367 (solar constant) X X X X (1362) - -
 Pressure X X X X - -
 Altitude X X X X X X
 Linke Turbidity - - X - - -
 Ozone X - - X - -
 Absolute airmass - - X - - -
 Relative airmass X - X - - -
 Apparent Elevation - X - - - -
 Asymmetry X - - - - -
 Total inputs 16 13 9 12 3 4

2.2 Methodology 6. Matching common time steps of observation and
 modelled data;
The methodology used in this study is summarized in the 7. Division of the common time steps into 5 degree
flow chart in Figure 1 below. The methodology consists zenithal angles; and
of eight steps as follows: 8. Calculation of statistical metrics for each 5 degree
1. Detection of clear sky days using the ERA5 hourly zenith bin.
 reanalysis data set [19]; The statistical metrics that were used to compare
2. Preprocessing of observation data and BSRN quality estimated 1-min clear sky GHI data with the observed
 check [55,56]; 1-min GHI data were relative Mean Bias Error (rMBE),
3. Identification of 1-min clear sky periods; relative Root Mean Square Error (rRMSE) and Coefficient
4. Configuration and running models on clear sky days; of Determination (R2).
5. Application of the additional clear sky periods
 detection method [20];

20 WeatherSMART News August 2021
START

 Detection of clear-sky days using ERA5 reanalysis data
 (hourly, 0.25˚ x 0.25˚)

 Remove Preprocessing of 1 minute GHI 1 minute clear sky irradiance modelling (only on
 outliers measured data and QC using BSRN clear sky days detected by ERA5 dataset)

 Apply (Reno and Hansen, 2016) methodology and McClear model as a Remove
 reference clear sky model to identify clear sky minute periods outliers

 Find common clear sky timesteps between he
 observation and modelled 1 minute datasets

 Divide timesteps into 5˚ solar zenithal angle bins and
 calculate statistical metrics for each 5˚ bin

 Statistical metrics calculated (rMBE, rRMSE, R2)

 Classify models based on (Engerer and Mills, 2015) methodology,
 considering only a bin with solar zenithal angle < 85˚

Figure 1. The flowchart of the approach summarising the methodology from clear sky detection to model classification based on their
performance. {Fifth generation European Centre for Medium-Range Weather Forecasts atmospheric reanalysis (ERA5); Global horizontal
irradiance (GHI); Quality control (QC); Baseline Surface Radiation Network (BSRN)}.

3. Results and Discussions errors that are not picked out automatically with the
 quality control procedures. Reno and Hansen 2016 [20]
3.1. Clear Sky Detection method successfully detected some errors missed by
The ERA5 hourly reanalysis data set can also be used to quality control procedures, the detected errors can be
detect cloud sky days—even though one of the clear sky removed by the user.
model’s applications is to determine the upper bound of 3.2. Validation Results
GHI, it is worth knowing that in some cases when there
are clouds the measured instantaneous GHI can surpass After detecting clear sky times, a random set of days
the clear sky boundary but it cannot surpass the GHITOA. for each of the 13 stations is shown in Figures 2–4.
According to Dazhi et al., 2015 [7], the reason behind this All the models generated data that captured temporal
is the reflection from the clouds, and according to Long variability but with varying accuracy. Additionally, a
and Shi (2008) [58], it is because of the enhancement of summary of performance is given in Tables 2 shows the
the DIF and then the DNI not being blocked by clouds for optimum model w.r.t metrics for each station, whilst
short periods. Table 3 shows the number of stations where a model
 shows an optimum metric. An optimum model per
An additional clear sky detection methodology, such as metric and station is found as follows: minimum rMBE,
that by Reno and Hansen 2016 [20], is needed to remove minimum rRMSE and maximum R2.
outliers other than clouds. The Reno and Hansen method
has been applied in this study to detect observation

 WeatherSMART News August 2021 21
Figure 2. Comparison between observed and modelled minute GHI values in Bethlehem (a), De Aar (b), Upington (c), and Prieska (d). Figure 3. Comparison between observed and modelled minute GHI values in Mahikeng (a), Irene (b), Polokwane (c), and Thohoyandou (d). 22 WeatherSMART News August 2021
Figure 4. Comparison between observed and modelled minute GHI values in Cape Point (a), Nelspruit (b), Durban (c), and Mthatha (d).

Table 2. Optimum model w.r.t metrics for each station (colour codes indicate different climatic zones)

 Station Minimum rMBE Minimum rRMSE Maximum R2
Cape Point Berger-Duffie McClear McClear
George McClear McClear Bird
De Aar Simple Solis Bird Bird
Bethlehem Simple Solis Simple Solis Bird
Upington McClear McClear McClear
Prieska Bird Bird Bird
Mthatha Haurwitz Bird Bird
Durban Bird Bird Bird
Mahikeng Ineichen-Perez Ineichen-Perez McClear
Irene Simple Solis Simple Solis Bird
Polokwane Simple Solis Bird Bird
Thohoyandou Ineichen-Perez Ineichen-Perez McClear
Nelspruit Simple Solis Bird Bird

From Table 2 and 3, Bird Model had a better performance was sourced as monthly climatology values from SoDa
that all the models with minimum rRMSE in 6/13 (46%) [38]. According to Bird et al (1981) [17], O3 have a minor
and maximum r2 in 9/13 (69%) stations. The better results effect on irradiance and Polo et al. [1] reported that the
might be because of using monthly satellite albedo variability of daily O3 ozone is low.
instead of a default value, calculating Pw from measured
temperature and humidity instead of climatologies, and Mclear model was only outperformed by Bird in South
using actual station pressure. O3 was the only input that African locations. This may mean that “black box”

 WeatherSMART News August 2021 23
model need further improvement to be able to estimate almost all the South African sites except in Durban.
irradiance with better accuracy than Bird model in South The poor performance shows that the transmittance of
African locations. Still, the McClear model performs good the model, which was integrated to a constant of 0.7
and it has an advantage over all other models because need to be recalibrated for each of the South African sites
the data is readily available, no need to configure and to be able to estimate GHI under clear sky accurately.
provide input parameters.
 4. Conclusions
Simple Solis was only outperformed by Bird and
McClear models in South African locations. The better In this study, the performance of six GHI clear sky
results might be because of using high spatiotemporal models, namely Bird, Simple Solis, McClear, Ineichen–
resolution model inputs, using actual station pressure, Perez, Haurwitz and Berger–Duffie, have been evaluated
daily AOD700 from SoDa [38] and Pw calculated from against reference Baseline Solar Radiation Network
measured temperature and humidity. quality guided 1-min data for 13 stations in the South
 African Weather Services radiometric network.
Table 3. Indication of number of stations with an optimum metric The stations are located in six climatological regions.
 All the models assessed were capable of reproducing
 Number of Number of Number of
 stations with stations with stations with GHI irradiance, but with different accuracy in different
 minimum minimum maximum R2 stations. All four complex models, namely Bird,
 rMBE rRMSE Simple Solis, McClear and Ineichen–Perez, performed
 Berger-Duffie 1 0 0 well with rRMSE less than 10% in all the stations.
 Bird 2 6 9 The simple models, Haurwitz and Berger–Duffie, did
 McClear 2 3 4 not perform well overall in South African locations. Bird
 Haurwitz 1 0 0 was the overall best model, followed by Simple Solis,
 Ineichen-Perez 2 2 0 McClear, Ineichen–Perez, Haurwitz and Berger–Duffie.
 Simple Solis 5 2 0 The McClear model overestimated GHI and the other
 five models underestimated GHI. Model inputs seem
Ineichen–Perez clear sky model performed less fairly, to influence the model performance. There is also an
when compared against other complex models. indication that each model behaves differently over
This might be because Ineichen–Perez is the only model particular climate regions.
that depends on TL as an input. The TL data was sourced
as monthly climatologies from SoDa [38]. According to Future studies will focus on validating more clear sky
Ineichen (2006) [16], TL has the highest influence on GHI models and other solar radiation parameters and
model accuracy. The model accuracy might improve optimising or calibrating simple models’ coefficients
with locally measured TL, though TL observations were for each site. Future work will also focus on sourcing
not available in the area of study. high temporal and spatial resolution model inputs from
 different databases and trying to re-validate models to
Haurwitz clear sky model performed had a performance, find suitable model inputs. Future studies will also focus
the poor performance of the model may be a result on using the results for renewable energy applications.
of the calibration of the Haurwitz model. The Blue
Hill observatory where the coefficients a and b were The challenge encountered in the study was the absence
calibrated have different atmospheric constituents to of high temporal and spatial resolution model inputs.
South African locations. There is a need to calibrate It is recommended that GHI monitoring stations also
coefficients a and b using data measured from South measure high temporal and high spatial resolution
African locations. water vapour, aerosols, ozone and albedo to aid model
 assessment studies.
Berger-Duffie clear sky model had a poor performance
in all the locations. It underestimated irradiance in https://www.mdpi.com/1996-1073/14/9/2583

24 WeatherSMART News August 2021
The Ångström–Prescott Regression Coefficients
 for Six Climatic Zones in South Africa
 by Brighton Mabasa, Meena D. Lysko*, Henerica Tazvinga,
 Sophie T. Mulaudzi, Nosipho Zwane and Sabata J. Moloi*

1. Introduction 0.25 and b = 0.75; these were calculated using data from
 Stockholm [13]. The regression coefficients a and b are
Solar radiation data are important because they are site-dependent; therefore, there is a need to calibrate
required in many research fields such as meteorology, them using a linear relationship in Equation (1) at regions
agriculture, hydrology, ecology, and environment [1–4]. where they will be used to estimate GHI [1,4,13,14].
Solar radiation data are also an important reference
for many applications such as solar power plants, In South Africa, studies to calibrate AP coefficients were
engineering designs, regional crop growth modelling, carried out by Eberhard [17] and Mulaudzi et al. [18].
evapotranspiration estimation, and irrigation system The challenge, according to Mulaudzi et al. [18], was the
development [1,3,5]. In relation to this, South African unavailability of a long-term observation GHI dataset
Weather Services (SAWS) re-established a global that covers all the climatic regions to calibrate and
horizontal irradiance (GHI) radiometric network with 13 validate the AP coefficients. In this study, a large enough
solar radiometric stations located in all 6 macroclimatic dataset with observations spanning 2013 to 2019 from
zones of South Africa [6]. The macroclimatic zones stations that cover all the climatological zones of South
are regions with similar climatic conditions, and they Africa was used to calibrate the AP coefficients, which
were established to classify different areas based on were then used to estimate GHI. The estimated GHI
their maximum energy demand and maximum energy was validated using the observed GHI daily averages,
consumption [6]. The data collected from the SAWS while the statistical metrics were used to quantify the
network help in the validation of satellites as well as differences between observed and estimated GHI.
the development and verification of empirical models
[7]. SAWS also manage a very dense sunshine duration From the results of this study, annual AP coefficients a
recording network over South Africa to the extent and b in all six macro-climatological regions could be
that sunshine duration data have been continuously used to estimate daily GHI, for the respective climate
measured for several years [8]. SAWS GHI stations are regions, using daily observation sunshine duration data.
sparse; according to [1–5,9], having dense radiometric The knowledge of estimated daily GHI data can thereby
networks is a worldwide challenge because of the high be used to develop energy policies and solar energy
costs involved in the installation and maintenance of the programmes. They can also be used as benchmarks in
solar radiation stations. To compensate for this, reliable climate analysis studies.
measurements taken from a sparse network are needed 2. Materials and Methods
to develop and validate empirical models that can be
used to estimate and forecast the availability of solar The observed 1-min GHI data used in this study were
energy at other locations [10]. The main objective of this collected from 8 SAWS solar radiometric stations during
study is to calibrate the Ångström–Prescott (AP) model the periods shown in Figure 1, which also shows the
regression coefficients a and b that could be used to climatic zones in which the stations are located. GHI data
estimate GHI in different climatic zones of South Africa, were collected using secondary standard, CMP11, Kipp
thus increasing the density of available solar radiation and Zonen pyranometers.
data in the country.
 The methodology is provided in the flowchart in Figures
The AP model estimates daily GHI using daily top of the 2. Daily GHI data were calculated from 1-min GHI data.
atmosphere GHI radiation (GHITOA), daily astronomical First, the 1-min GHI data were quality controlled using
day length (N), daily measured sunshine duration (n), a Baseline Solar Radiation Network (BSRN) quality
and Ångström model coefficients a and b. The model was control (QC) procedure outlined by Long and Dutton
first proposed by Ångström [11] in 1924 before Prescott in [21]. Minute values that passed the BSRN QC were
[12] modified it in 1940 by adding GHITOA to replace GHI averaged to 15 min and then, 4 slots of 15-min averages
on a clear sky day. The original AP coefficients were a = were averaged to obtain an hourly mean [6,7,22–25].

* Non-SAWS

 WeatherSMART News August 2021 25
Hourly mean values were then averaged to obtain daily average values. Daily average values were further quality
checked by subjecting them to HelioClim model QC, described by Geiger et al. in [26].

Hourly sunshine duration data were obtained by determining the burn made by the sun on a coated card in a
Campbell–Stokes sunshine recorder [8]. Hourly data were then summed to obtain total daily sunshine duration (n).
Daily top-of-atmosphere (TOA) irradiance (GHITOA) and theoretical sunshine duration (N) were calculated using
Equations from Iqbal [13], and the solar angles were calculated using the Solar Position Algorithm (SPA) on Python
PVLIB [27,28].

Figure 1. A map showing SAWS radiometric station location and climatic zones.

The coefficients and of the AP model were calculated The statistical metrics Mean Bias Error (MBE), relative
by using the linear regression analysis between the Mean Bias Error (rMBE), Mean Absolute Error (MAE),
irradiance fraction or clearness index, and daily relative Mean Absolute Error (rMAE) and Coefficient
sunshine fraction, for each day, based on a linear of Determination (R2) were used to compare estimated
relationship shown by Equation (1) proposed by daily GHI data with the observed daily GHI data.
Ångström [11] and then, modified by Prescott [12].
 The results were converted from W/m2 to MJ m−2d−1 by
 = a + b(n/N), (1) dividing by 11.57415, a methodology used by Almorox
 et al. [5] to allow for easy comparison with other
Annual AP coefficients were calculated for 8 stations. literature studies. Monthly averages of each metric were
Datasets up to the end of 2018 were used for calculated and then aggregated to annual averages, and
determination of the AP coefficients, and the daily where observation data were not available, data were
observation data for 2019 were used to validate the replaced by NaN.
corresponding estimated daily GHI data.

26 WeatherSMART News August 2021
You can also read