Intergenerational Mobility in India: New
←
→
Page content transcription
If your browser does not render page correctly, please read the page content below
Intergenerational Mobility in India: New
 Methods and Estimates Across Time, Space, and Communities∗
                                                Sam Asher†

                                              Paul Novosad‡

                                              Charlie Rafkin§

                                              February 2021

                                                 Abstract
            We study intergenerational mobility in India over time, across groups, and across
        space. We show that the modern set of rank-based mobility measures can be at
        best partially identified with education data. We develop a new measure of upward
        mobility that works well under data constraints common in developing countries.
        We find that intergenerational mobility in India has been constant and low since
        before liberalization. Among boys, rising mobility for Scheduled Castes is almost
        exactly offset by declining mobility among Muslims, a comparably sized group with
        few constitutional protections. Mobility among girls is lower, with less cross-group
        variation over time. Mobility is highest in places that are southern, urban, and have
        high average education levels. A natural experiment suggests that affirmative action
        for Scheduled Castes has substantially improved their mobility. Our measures are
        relevant for the study of mobility in poorer countries and in historical contexts.

    ∗
      We are thankful for useful discussions with Alberto Abadie, David Autor, Emily Blanchard, Raj Chetty,
 Eric Edmonds, Shahe Emran, Francisco Ferreira, Amy Finkelstein, Nate Hilger, Larry Katz, David Laibson,
 Ethan Ligon, Erzo Luttmer, Whitney Newey, Elias Papaioannou, Nina Pavcnik, Bruce Sacerdote, Frank
 Schilbach, Na’ama Shenhav, Forhad Shilpi, Andrei Shleifer, Gary Solon, Bob Staiger, Doug Staiger, Chris Sny-
 der and Elie Tamer, among others. Annaka Balch, Ali Campion, Toby Lunt, Ryu Matsuura, and Taewan Roh
 provided excellent research assistance. This project received financial support from the IZA GLM-LIC program.
This material is based upon work supported by the National Science Foundation Graduate Research Fellowship
 under Grant No. 1122374. This paper contains some material previously contained in the retired paper,
“Getting Signal from Interval Data: Theory and Applications to Mortality and Intergenerational Mobility.”
    †
      Johns Hopkins University, sasher2@jhu.edu
    ‡
      Dartmouth College, paul.novosad@dartmouth.edu, corresponding author
    §
      MIT, crafkin@mit.edu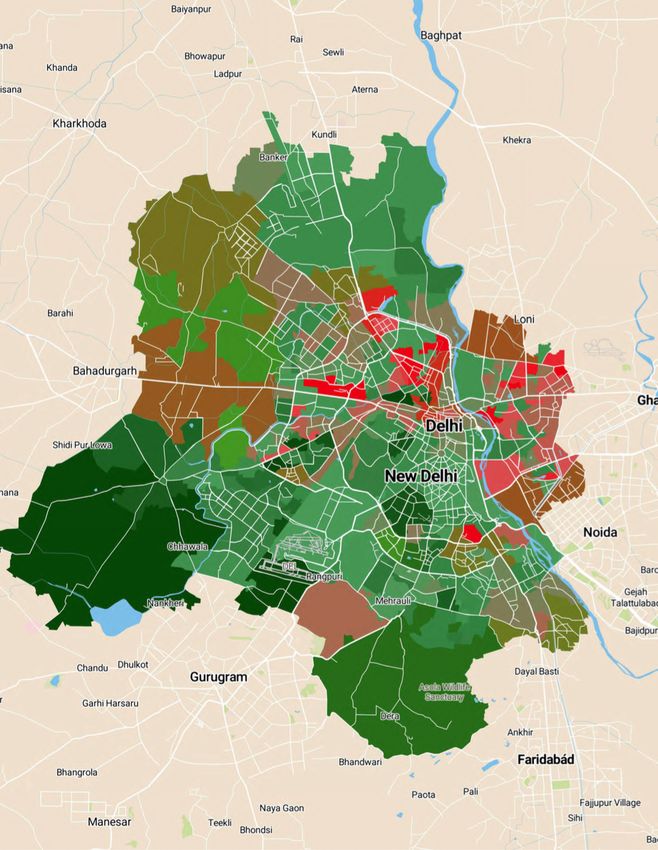
1

1    Introduction

There are two widely held narratives regarding access to opportunity in India. On the
one hand, economic liberalization, rapid economic growth, and urbanization have vastly
expanded the set of opportunities available to Indians, leading to the emergence of a large
middle class. The political sphere has also opened, with the emergence of a wide range of
parties organized around caste, region, and ideology. Decades of affirmative action programs
have targeted government benefits at historically disadvantaged groups. On the other hand,
some of India’s entrenched inequalities seem as persistent as ever. Marriage across religious,
caste, and class lines is exceedingly rare. Elites in business, government and civil society
are still largely from upper classes and castes. Inequality has risen, and religious cleavages
may be deepening (Chancel and Piketty, 2019). In this paper, we shed light on changing
access to opportunity in India by studying the intergenerational transmission of economic
status (Solon, 1999; Black and Devereux, 2011; Chetty et al., 2014a; Chetty et al., 2020),
with a particular emphasis on the 478 million people (39%) who belong to India’s major
disadvantaged groups (Muslims, Scheduled Castes, and Scheduled Tribes).
    We focus on measuring the persistence of socioeconomic rank across generations, isolating
intergenerational mobility from changes in inequality and growth, in the spirit of Solon
(1999). We develop a set of methods that makes it possible to apply modern rank-based
measurements of upward mobility in contexts where coarse educational outcomes are the
only viable measure of socioeconomic status that can be linked across generations. These
methods may be useful in studies of intergenerational mobility in other developing countries,
as well as in historical contexts in richer countries.
    Because of data quality and availability, as well as the challenge of measuring individual
income in households with joint production, studies of intergenerational mobility in devel-
oping countries (and in historical contexts) often use education as a proxy for social status.1
Moreover, canonical intergenerational mobility models like Loury (1981), Becker and Tomes
(1986), and Galor and Zeira (1993) often emphasize the role of human capital investment. A
key challenge with educational mobility is that education data are often coarsely measured;
for instance, for the 1960–69 birth cohort in India, over 50% of fathers and 80% of mothers
     1
      Linked parent-child education data are also much more widely available than linked income data.
Recent studies of intergenerational mobility focusing on education include Black et al. (2005), Güell et
al. (2013), Wantchekon et al. (2015), Card et al. (2018), Derenoncourt (2019), and Alesina et al. (2021).
More are summarized in Black and Devereux (2011).
2
report a bottom-coded level of education. This makes it difficult to use rank-based measures
of mobility, such as absolute mobility, which require observing parents at specific percentiles
in the socioeconomic status distribution.2 Studies of educational mobility have instead focused
on estimators like the correlation coefficient between parents’ and children’s educational
outcomes. These linear estimators have several limitations (discussed in Section 3.1), the
most important of which is that they are not meaningful for subgroup analysis, because they
measure individuals’ progress only against other members of their own group (Hertz, 2005).3
In this paper, we show that with education data, the new generation of rank-based
estimators of intergenerational mobility can at best be partially identified. Intuitively, when
income mobility estimators are applied directly to educational mobility, they do not account
for the loss of information associated with coarse measurement of ranks; they instead rely
on implicit and untested assumptions about the latent rank distribution.4 We treat the
estimation of child outcomes conditional on latent parent ranks as an interval data problem;
for each mobility measure, we calculate the set of values that are consistent with a latent
conditional expectation function (CEF) that generates the coarsely observed moments.5
We introduce a new measure of upward mobility, bottom half mobility, which is the expected
rank of a child born to a parent in the bottom half of the education distribution. Bottom
half mobility has a similar interpretation to other measures of upward mobility, but it can
be bounded tightly even in contexts with extreme interval censoring.6 In contrast, once prior
2
Chetty et al. (2014a) define absolute mobility at percentile i as the expected income rank of a child,
conditional on that child being born to a parent at the ith income percentile.
3
For example, the parent-child rank-rank gradient among U.S. Blacks is nearly identical to that among
U.S. Whites, even though Black children obtain considerably worse outcomes in expectation than White
children at every percentile of the parent income distribution (Chetty et al., 2020).
4
The notion of a latent distribution of education ranks arises directly out of the standard human
capital model (Card, 1999); individuals who are close to the margin of obtaining the next discrete level
of education are those with high latent ranks in each bin. Note that because we use education as a proxy
for socioeconomic status, the latent education rank is the parameter of interest rather than the precise
number of years of education obtained. We discuss this concept further in Section 3.3.
5
We use a standard approach to interval data established by Manski and Tamer (2002) and extended
to the problem of estimating outcomes conditioning on coarse education ranks in Novosad et al. (2020).
We generate this set by using best- and worst-case assumptions about the underlying data generating process
that are consistent with the data we do observe.
6
Bottom half mobility describes the expected outcome of children conditional on having a parent in
the bottom half of the distribution. Absolute upward mobility Chetty et al. (2014a) conditions on the
median parent in the bottom half of the distribution. If the conditional expectation function is linear in
parent rank, the two measures are identical. If the CEF is concave, then bottom half mobility puts more
weight on the outcomes of the least privileged children. Note that the linear parent-child income rank CEF
in the United States is an exception rather the rule; in most countries, these CEFs are non-linear (Bratsberg
et al., 2007; Boserup et al., 2014; Bratberg et al., 2015; Connolly et al., 2019).3
measures (absolute upward mobility and the rank-rank gradient) are adjusted to account
for the underlying uncertainty associated with interval data, their bounds become too wide
to be meaningful. This paper thus relaxes the hidden assumptions underlying most mobility
estimators in settings with education data and still obtains precise (if partially-identified)
mobility estimates. To our knowledge, bottom half mobility is the first measure of inter-
generational educational mobility that can be meaningfully compared across time and space,
across countries, and across population subgroups.7,8
We apply our measure to India, using data from the 2012 India Human Development
Survey (IHDS) and the 2012 Socioeconomic and Caste Census (SECC).9 We document
trends in educational mobility from the 1950–59 to the 1985–89 birth cohorts.10 We focus
on measuring mobility from fathers to sons and daughters; mobility from mothers to children
cannot be bounded tightly because the bottom-coding of mothers’ education is so severe.
We present three main findings. First, upward mobility has remained constant for the past
several decades, despite dramatic gains in average levels of education and income. An Indian
son born in the bottom half of the parent education distribution in 1985–89 (our youngest
cohort) can expect to obtain the percentile 37.7; a daughter obtains percentile 35.6.11 A similar
child in the U.S., which has low intergenerational mobility by OECD standards, on average at-
tains education percentile 41.7.12,13 This suggests that India’s decades of economic growth have
lifted the economic status of individuals in the bottom half of the socioeconomic distribution
7
Hertz (2008) provides a decomposition of intergenerational mobility that permits comparisons across
subgroups. Like work before Chetty et al. (2014), this is a linear estimator that is difficult to use with
interval-censored data.
8
Our approach can also be used to calculate other measures based on the CEF, such as the expected out-
come a child born in the bottom 40%, or the median outcome of a child born in the bottom half; our results focus
on bottom half mobility because it is a very close analog to the widely used measure of absolute upward mobility.
9
The former is a sample survey, and the latter is a socioeconomic census with high geographic resolution
covering all individuals in the country.
10
Our main estimates are not subject to concerns about coresidence bias, because they link children
to parents even when children are not in the same household. Our geographically precise estimates are
restricted to coresident father/son pairs due to data limitations; we restrict this sample to sons aged 20–23
and show that the sample selection bias for this group is likely to be very small.
11
Following convention (Chetty et al., 2014b; Chetty et al., 2020), we always rank children in the
own-gender distribution.
12
In a society where children’s outcomes are independent of parents (i.e. perfect mobility), a child born in
the bottom half of the distribution obtains the 50th percentile on average. In a society with no upward mobility,
(i.e. where all children obtain the same percentile as their parents) the same child attains the 25th percentile.
13
All of our mobility estimates are robust to different data construction methods, and we show that
survivorship bias, migration, or bias in estimates from coresident parent-child households do not substantially
affect our results. We also show that unobserved changes in the latent rank distribution of population
subgroups within education bins cannot drive the secular changes that we document.4
without substantially changing their likelihood of moving to a higher socioeconomic rank.14
Second, we show that there are significant changes in the cross-group distribution of
upward mobility over time, particularly among sons. We divide the population into Scheduled
Castes (SCs), Scheduled Tribes (STs), Muslims, and Forwards/Others.15 Consistent with
prior work (Hnatkovska et al., 2012; Emran and Shilpi, 2015), we find that sons from India’s
constitutionally protected marginalized groups, the Scheduled Castes and Tribes, have closed
respectively 50% and 30% of the mobility gap with Forwards/Others. In contrast, upward
mobility for Muslim sons has steadily declined from the 1960s to the present. The expected
educational rank of a Muslim boy born in the bottom half of the parent distribution has
fallen from between percentiles 31 and 34 to a dismal 29. Muslim sons have considerably
worse upward mobility today than both Scheduled Castes (38) and Scheduled Tribes (33), a
striking finding given that, compared to Muslims, STs tend to live in much more remote and
low-mobility areas. The comparable figure for U.S. Black men is 35.16 Higher caste groups
have experienced constant and high upward mobility over time, a result that contradicts
a popular notion that it is increasingly difficult for higher-caste Hindus to get ahead.
Our measures for father-daughter mobility are less precise, but the subgroup patterns appear
to be different. Daughters from poor Muslim, SC, and ST households all have persistently lower
mobility than Forwards/Others, and there is minimal convergence over the sample period.
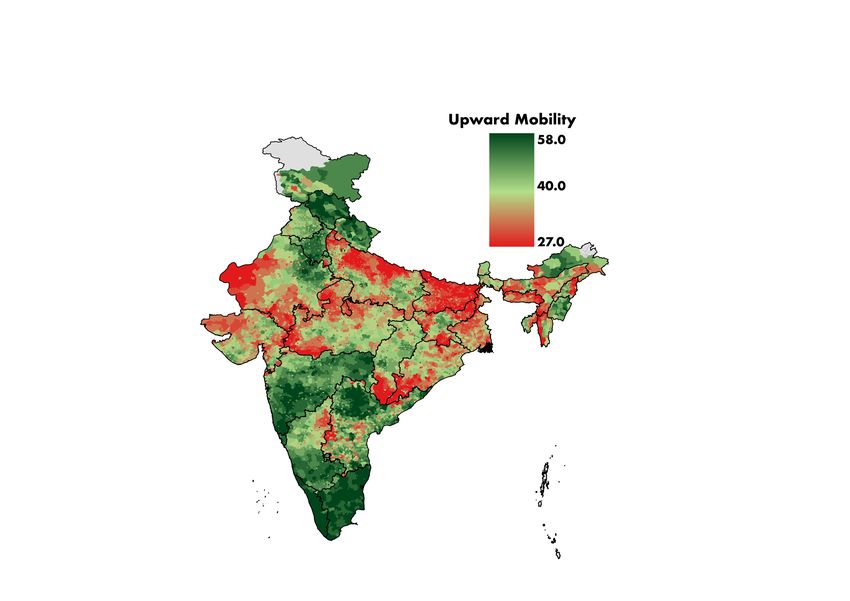
Third, we describe substantial variation in upward mobility across 5,600 rural subdistricts
and 2,000 cities and towns. Paralleling results from Chetty et al. (2014b), we find substantial
heterogeneity even within small geographic regions. Upward mobility is highest in urban
areas, and in places with high consumption, education, school supply, and manufacturing
employment, which are broad correlates of development. High mobility is negatively correlated
with caste segregation and land inequality. Geography-subgroup interactions are important;
14
A naive application of the canonical rank-rank gradient estimator would have suggested that mobility
has improved significantly. This finding is driven entirely by the top 10 parent education percentiles, and
is not robust to accounting for interval censoring in the education rank data.
15
We include non-Muslims in Other Backward Castes (OBC) in the “Others” category. Measuring
OBC mobility is challenging because OBC definitions are less stable over time, are sometimes inconsistently
classified between federal and state lists, and may be reported inconsistently by the same individual over
time. These concerns apply to SC and ST groups, but at a considerably smaller scale. OBCs also did
not gain affirmative action benefits analagous to those targeted at SCs and STs until 1992, after the births of
our final cohorts. The very small number of Muslim SC/STs are categorized as Muslims; reclassifying them
as SCs or STs, or excluding Sikhs, Jains and Christians from the “others” category do not affect our results.
16
This was calculated using the methodology in this paper and education data from Chetty et al. (2020).
Bottom half income mobility for U.S. Black men is 39 (Chetty et al., 2020).5
for instance, daughters have higher mobility than sons in urban areas, but lower mobility
in rural areas.
The final section of the paper examines several potential mechanisms for the divergence
of Scheduled Castes from Muslims over the last 30 years. We show that this divergence
cannot be explained by differential returns to education, occupational patterns, geography,
or differential fertility. However, we find suggestive evidence that the basket of affirmative
action policies targeted to India’s scheduled groups (but not to Muslims) may have had a
substantial impact on their mobility. Following Cassan (2019), we study a natural experiment
that added many castes to the Scheduled Caste lists in 1977. We show that when a caste
group gets assigned to Scheduled Caste status, it experiences on average a 7–8 rank point
increase in upward mobility over the next twenty years. This is the same size as the rank
mobility gap that has opened between Muslims and Scheduled Castes over the same period.
Our findings are thus consistent with the claim that educational quotas, government job
reservations, and other affirmative action policies may drive the upward mobility gap that
has opened between Scheduled Castes and Muslims. However, because we are limited to
birth cohort × demographic group variation, these results are suggestive and not dispositive.
Contributions and literature review. Our paper’s contributions are both method-
ological and empirical. While bounding methods along the lines of Manski and Tamer
(2002) and Novosad et al. (2020) are familiar in the econometrics literature, we are the
first to apply these methods to the setting of educational mobility. We both identify and
address methodological challenges that make it difficult to interpret research on educational
mobility. In particular, we define a new parameter, bottom half mobility, which is the first
educational mobility statistic that is valid for comparing population subgroups across different
contexts. As a result, our tools have the potential to be useful in other settings, for instance
in cross-country comparisons of educational mobility.
Prior researchers have used CEF-based mobility measures to examine subgroup outcomes,
but the coarse measurement problem has forced them to use inconsistent measures over
time and across contexts. For example, Card et al. (2018) and Derenoncourt (2019) define
upward mobility in the 1920s as the 9th grade completion rate of children whose parents
have 5–8 years of school (or approximately parent percentiles 45–70).17 Relatedly, Alesina
et al. (2021) define upward mobility in Africa as the likelihood that a child born to a parent
17
Card et al. (2018) then compare this measure with absolute upward mobility (i.e., children of parents
at the 25th percentile) in the present.6
who has not completed primary school manages to do so. While these measures capture
the ability of children to exceed the education levels of their parents, they do not distinguish
between average educational gains and changes in the ability of individuals to move up
the socioeconomic distribution in relative terms, the latter being central to the mobility
definitions of Solon (1999) and Chetty et al. (2014b). These measures thus combine upward
mobility and economic growth.18 The key advantages of our measure are that it isolates
upward mobility from both aggregate growth and changes in inequality, and it can be used
to compare groups from similar points in the parent rank distribution.
Empirically, we present several previously unknown facts about upward mobility in India.
Our findings imply that virtually all of the upward mobility gains in India over recent decades
have accrued to Scheduled Castes and Tribes, groups that have constitutional protections,
reservations in politics and education, and who have been targeted by many development
policies. There is no evidence that any of these gains have come at the expense of higher-caste
groups. On the other hand, mobility has declined for Muslims. We are not aware of studies of
intergenerational mobility for Indian Muslims, even though they number almost 200 million
people (higher than the number of people in Scheduled Castes).19
These empirical estimates contribute to a burgeoning literature on intergenerational
mobility, especially in the developing world. Black and Devereux (2011) provide a review
of cross-country estimates of intergenerational educational mobility, and recent work has
examined intergenerational mobility in the United States (Chetty et al., 2014b; Chetty et
al., 2014a; Chetty et al., 2020), western Europe (Bratberg et al., 2015), and Africa (Alesina et
al., 2021), among many other regions. The literature on India has: (i) emphasized absolute
outcomes (such as consumption), which are rising for all groups due to India’s substantial
economic growth (Maitra and Sharma, 2009; Hnatkovska et al., 2013); or (ii) compared
subgroups using the parent-child outcome correlation or regression coefficient, which describes
the outcomes of subgroup members relative to their own group, rather than to the national
population (Hnatkovska et al., 2013; Emran and Shilpi, 2015; Azam and Bhatt, 2015).20
18
They also condition on substantially different parts of the education distribution in different times and
places. Card et al. (2018) measure E(y >50|x∈[45,70]). Alesina et al. (2021) measure, for example, E(y >
52|x∈[0,76]) in Mozambique (where 76% of parents and 48% of children have not completed primary), but to
E(y >18|x∈[0,42]) in South Africa, where y is child rank and x is parent rank. See Section 3.5 for more detail.
19
Other economics papers on Indian Muslims include Khamis et al. (2012) and Bhalotra and Zamora (2010),
who note poor education outcomes among Muslims. The Sachar Committee Report (2006) and Basant et al.
(2010) summarize some recent research on Muslims on India, none of which addresses intergenerational mobility.
20
Note that there is a parallel literature examining the persistence of income within an individual lifetime7
Studies of affirmative action in India have found impacts on educational attainment of SC/STs
(Frisancho Robles and Krishna, 2016; Bagde et al., 2016; Cassan, 2019; Khanna, 2020), but have
not examined intergenerational mobility. Our findings suggest that the children of less educated
SCs benefit from affirmative action, in contrast to the critique arguing that benefits from
affirmative action in India accrue only to the already prosperous members of targeted groups.
More broadly, our paper relates to broader work on religion and economic development
(McCleary and Barro, 2006; Becker and Woessmann, 2009). Alesina et al. (2020) and Platas
(2018) find low mobility and educational outcomes for Muslims in Sub-Saharan Africa, where
Islam plays a very different cultural, political and social role from India.21
We have posted code online to calculate all of our mobility measures, along with bottom
half mobility estimates with high geographic granularity.22
Our paper proceeds as follows. Section 2 provides background on India’s social groups.
Section 3 describes our methodological innovation in relation to prior measures of intergenera-
tional educational mobility. Section 4 describes the data sources. Section 5 presents results on
national and cross-group mobility trends, and the geographic distribution of intergenerational
mobility. Section 6 presents our analysis of mechanisms. Section 7 concludes.
2 Context on Intergenerational Mobility in India
India’s rapid economic transformation and caste system make it a particularly important
setting for understanding intergenerational mobility for at least two reasons. First, Indian
society has undergone a large transformation over the last forty years. Economic liberalization,
starting in the 1980s, dismantled many parts of India’s post-Independence socialist experiment.
Decades of sustained economic growth have resulted in substantial reductions in poverty and
the rise of a large middle class. This setting thus permits us to examine intergenerational
mobility against the backdrop of rapid economic growth in a large developing nation.
Second, India’s caste system is characterized by a set of informal rules that inhibit
intergenerational mobility by preventing individuals from taking up work outside of their
caste’s traditional occupation and from marrying outside of their caste. While some have
argued that economic growth is reducing the influence of old social and economic divisions
in India; this is sometimes described as income or economic mobility. That literature is focused largely
on measurement error in income over the course of an individual’s lifetime and is thus not directly related
to our work (Azam, 2016; Li et al., 2019).
21
See also Kuran (2018) for a summary of the literature on Islam and economic performance.
22
https://github.com/devdatalab/paper-anr-mobility-india/8
on economic opportunities, caste and religion remain important predictors of economic status
(Munshi and Rosenzweig, 2006; Ito, 2009; Hnatkovska et al., 2013; Mohammed, 2019). Since
independence in 1947, the government has systematically implemented policies intended to
reduce the disadvantage of communities that are classified as Scheduled Castes or Scheduled
Tribes. These groups are targeted by a range of government programs and benefit from
reservations in educational and political institutions.
India’s Muslims constitute a similar population share as the Scheduled Castes and Sched-
uled Tribes (14% for Muslims vs. 17% for SCs and 14% for STs). While Muslim disadvantage
has been widely noted, including by the well-known federal Sachar Report (2006), there are
few policies in place to protect them and there has not been an effective political mobilization
in their interest. On the contrary, a large-scale social movement (the Rashtriya Swayamsevak
Sangh, or RSS) and several major political parties have rallied around pro-Hindu platforms
and policies which arguably discriminate against Muslim religious, economic, and cultural
practices. Violent anti-Muslim riots have been closely tied to political parties and political
movements (Wilkinson, 2006; Berenschot, 2012; Blakeslee, 2018).
Understanding how mobility has changed for these population groups is important even if
all social groups are becoming better off. As noted by Chetty et al. (2020), intergenerational
mobility governs the steady-state distribution of outcomes across social groups. Characterizing
intergenerational mobility for India’s disadvantaged minority groups therefore has important
consequences for equity.
3 Methods: Measuring Mobility in Developing Countries
3.1 Background: Measurement of Intergenerational Mobility
We define intergenerational mobility as the persistence of socioeconomic rank across gen-
erations, following Solon (1999), Chetty et al. (2014b) and Chetty et al. (2020), all of whom
emphasize isolating the rank persistence from changes in economic growth and inequality.23
Desirable properties of mobility estimators. We aim to develop a mobility estima-
tor with three desirable properties.24 First, the estimator should distinguish mobility from
economic growth and inequality. The canonical mobility estimator, the coefficient from a
regression of child income on parent income, does not do so, as it is affected by changes in
23
For review papers on intergenerational mobility, see Corak (2013), Black and Devereux (2011), and
Roemer (2016).
24
This is not meant to be an exhaustive list; rather, we highlight several properties that many mobility
measures do not have, and which our new measure does.9
both rank mobility and in inequality (Chetty et al., 2014b). Nor does the probability that a
child obtains a higher socioeconomic outcome than their parent (Chetty et al., 2017; Alesina
et al., 2021), which simultaneously measures intergenerational mobility and economic growth.
Inequality and growth in India have been widely studied; we focus on the persistence of
socioeconomic rank as distinct from these other phenomena.
Second, we seek a measure that is valid for subgroup analysis. The most widely used mobility
estimators, the parent-child outcome elasticity or the rank-rank gradient (Solon, 1999; Hertz
et al., 2008; Black and Devereux, 2011), are not well-suited for between-group comparisons.
The parent-child outcome gradient in a population subgroup compares children’s outcomes
against more advantaged members of their own group. A subgroup can therefore have a lower
gradient (suggesting higher mobility) and yet worse outcomes at every point in the parent
distribution.25 Third, we seek a measure that is comparable across different times and contexts.
In the context of intergenerational income mobility, absolute upward mobility (Chetty et
al., 2014a) meets all three of these criteria. It is defined as the expectation of a child’s income
rank, conditional on having a parent at the 25th income percentile, or p25 = E(y|x = 25),
where y is the child rank and x is the parent rank. This measure describes the expected
rank of a child born to the median parent in the bottom half of the parent rank distribution.
The disadvantage of this measure is that it is difficult to use when education is the best
available measure of socioeconomic status, such as in developing or historical contexts, as
we explain in the next subsection. Our proposed measure, bottom half mobility, is similar
in interpretation to p25, but works well in these contexts.
3.2 Educational Mobility and Income Mobility
In the study of upward mobility in developing countries, education is often the preferred
proxy of social status, for three reasons (Solon, 1999; Güell et al., 2013; Wantchekon et
al., 2015; Card et al., 2018; Derenoncourt, 2019; Alesina et al., 2021). First, matched
parent-child education data are more widely available than matched income data. Second,
due to subsistence consumption and high intertemporal variance of income, permanent income
is measured with substantial error in developing countries, biasing mobility estimates upward
(Zimmerman, 1992). Third, individual permanent income is difficult to ascribe to individuals in
multigenerational households with joint production, which are common among the rural poor.
25
For a striking example, see Chetty et al. (2020), who show that Black sons suffer the same large rank
disadvantage at every point in the parent rank distribution, giving them a nearly identical rank-rank gradient
to White sons.10
However, studies of educational mobility to date have not developed measures that isolate
mobility from growth and are valid across subgroups. We cannot directly estimate p25 with
education data, because coarse measurement of educational completion makes it impossible to
identify a parent at a precise education percentile. We highlight this challenge in Figure 1A,
which shows the average child education rank in each parent education rank bin, for two
Indian birth cohorts: 1960–69 (circles) and 1985–89 (x’s). The solid and dashed vertical
lines respectively show the boundaries for the bottom-coded education bin in the two cohorts.
In the 1960–69 birth cohort, a full 57% of fathers report a bottom-coded education level;
in the 1985–89 cohort, this figure is 36%. How does one identify the expected child rank
given a parent at the 25th percentile in these birth cohorts?26
Figure 1B shows two conditional expectation functions that are both perfectly consistent
with the 1960–69 moments. The data available cannot distinguish between these two
functions, but they have different implications for upward mobility: one function implies a
much higher expected rank for a child born to parents at the bottom of the distribution than
the other. The CEF of child rank given parent rank can thus be at best partially identified
from education data.
Coarse measures of parental status like these are widespread in the mobility literature. In
developing countries, bottom-coding rates in excess of 50% are widespread (Narayan and Van
der Weide, 2018); the same is true for older generations in richer countries. Internationally
comparable censuses often report education in as few as four categories.27 Transforming
transition matrices based on education data (with arbitrary coarse rank boundaries) into
quantile transition matrices faces the same barriers as point-estimating the CEF above.
3.3 Estimating Bounds on a CEF with Censored Education Data
We aim to construct a measure of intergenerational mobility that satisfies the desirable
properties above and can be tightly estimated with education data. To address the non-
observability of granular parent education ranks, we use a partial identification framework
26
The graph makes clear that p25 must be different from the expected child rank in the parent bin containing
the 25th percentile. When there is less censoring, the bottom bin represents a lower average set of parent ranks.
27
Income mobility is also often based on censored estimates; in the well-known British Cohort Study,
one income bin contains more than 30% of the data. Appendix Table A1 reports the number of parent
education bins used in a set of recent studies of intergenerational mobility from several rich and poor
countries, highlighting the ubiquity of course parent rank bins.11
suggested in the example above and derived in Novosad et al. (2020), which we describe here.28
Formally, we first aim to measure pi = E(y|x = i), where y is a child outcome and x is
a parent education rank. We observe only that x lies within some interval [xk ,xk+1], where
k indexes rank bins. The mean value of E(y|x) in bin k is observed.29
We require only two substantive assumptions to derive bounds on E(y|x). First, we
assume that there is a latent continuous parent education rank; this implies a meaningful but
unobserved ranking of parent educations within each observed education category. Formally:
E(y|x=i) has support for all values of i∈[0,100]. (Assumption 1)
This assumption arises directly from a standard human capital model where differences in
education levels reflect individual differences in costs and benefits of seeking education (Card,
1999). The latent education rank x reflects the education level that would be chosen from a
continuous rather than a discrete set of education choices. The latent rank reflects how much
the marginal benefit or cost of obtaining the next level of education (e.g., “Middle School”)
would need to change in order for a given individual to progress to the next level. Individuals
who would need only a small benefit shift to choose the next education level have the highest
educational ranks within their rank bin. The latent rank thus reflects the underlying factors
that shift individuals’ demand for education, which can be expected to be correlated with
socioeconomic status (Card, 1999).30,31 Assumption 1 lets us treat the estimation of E(y|x=i)
as an interval censoring problem (Manski and Tamer, 2002; Novosad et al., 2020).
We next assume that the expectation of the child rank is weakly increasing in the latent
28
Novosad et al. (2020) take the interval data framework of Manski and Tamer (2002) and extend
it to identify E(y|x = i), where y is adult mortality and x is adult education rank. The methodological
contribution of the present paper is to frame the challenges in the educational mobility setting as an interval
data problem, and to use these partial identification tools to derive a measure with desirable properties.
29
For parsimony, our framework considers a setting in which only the parent rank is interval-censored
— i.e., we take the child rank variable as not censored. We address extensions with censored child ranks
and potential bias from our approach in Section 5.4.2.
30
Like other papers on intergenerational educational mobility, we use education strictly as a proxy for
socioeconomic status. Our interpretation is meaningful even if individuals at different latent ranks within
the same bin have obtained exactly the same number of years of education. All things equal, individuals
with higher latent ranks are understood in expectation to have socioeconomic advantages in dimensions
other than years of education.
31
While the transformation of income to income rank is common, the same transformation in education has
been rare, perhaps because of the coarse data problem that we identify in this paper (Rosenbaum et al., 2000).12
parent rank: having a more advantaged parent cannot make a child worse off. Formally:
E(y|x) must be weakly increasing in x. (Assumption 2)
Empirically, average socioeconomic outcomes of children are strongly monotonic in parent
socioeconomic outcomes across many socioeconomic measures and countries (Dardanoni
et al., 2012), as well as in every birth cohort and almost every subgroup-cohort that we
study in India (see Appendix Table A2).32,33 Note that the conventional linear estimation
of educational mobility also implicitly imposes monotonicity.
Given Assumptions 1 and 2, we can obtain sharp bounds on the child CEF. The analytical
formulation of the bounds is derived in Novosad et al. (2020) (for the context of estimating
individual mortality by education rank) and presented in the Online Appendix for the context
of upward mobility. Figure 1C shows the bounds on the Indian CEF for the 1960–69 and the
1985–89 birth cohorts. While the bounds are tight in parts of the CEF where the education
bins are small, they are very wide in the bottom half of the distribution where the data
is heavily interval-censored. Absolute upward mobility (the value of the CEF at x=25) has
bounds that are far too wide to be meaningful for either the 1960–69 or the 1985–89 cohort.
Although not used in this paper, our framework permits tighter bounds to be obtained by
imposing additional structural assumptions on the CEF. In the Online Appendix, we explore a
constraint on the curvature of the CEF, the limit case of which is a linear estimation equivalent
to calculating the rank-rank gradient. Our approach thus generalizes the canonical mobility es-
timator, which in many empirical cases is a poor fit to the data due to the linearity assumption.
Bottom half mobility. We propose a measure, bottom half mobility, which describes
the expected outcome of a child born to parents in the bottom half of the parent distribution,
or µ50
0 =E(y|x∈[0,50]). Note the similarity in interpretation to absolute upward mobility,
which is the expected outcome of a child born to the median parent in the bottom half of the
32
In theory, a means-tested welfare program with a sharp discontinuation of benefits at a rank boundary
could result in a non-monotonic CEF. Such a precise welfare program is unlikely to exist in any country,
much less a developing country with imprecise measurement of income.
33
In small samples, empirical non-monotonicity may emerge from monotonic distributions due to sampling
error. This occurs at the very top of the distribution in a minority of subgroup-cohorts in our data; these
non-monotonicities do not affect our calculations of upward mobility, which only use information from
bins adjacent to the bottom half of the parent distribution (see below).13
parent distribution, p25 =E(y|x=25).34,35 p25 and µ50
0 both describe the rate of convergence
of groups in the bottom half of the socioeconomic distribution, where 50 implies convergence
to the mean rank in one generation, and a value of 25 implies no convergence at all. Both
measures are useful, just as the mean and median of a given distribution have advantages
and disadvantages as summary statistics. The most important advantage of µ50
0 is that, as
we show below, it can be tightly bounded in contexts where p25 cannot.36
3.4 Comparing Bounds on Different Functions of the CEF
Panels A through C of Figure 2 respectively show bounds on the rank-rank gradient (β),
absolute upward mobility (p25), and bottom half mobility (µ50
0 ) for the 1960–69 and the
1985–89 birth cohorts in India. As benchmarks, we show similar measures for USA and
Denmark.37 The bounds on the conventional measures β and p25 are not informative either
in levels or in changes. In contrast, our proposed measure µ50
0 is bounded tightly in the
1960s and nearly point-estimated in the 1980s.
Figure 2 shows the key advantage of bottom half mobility: it can be tightly bounded even
with severely interval-censored rank data. For intuition behind the tight bounds on µ50
0 , note
that µba is point-identified when a and b correspond to bin boundaries in the data–it is just the
mean child outcome given parents in those bins. In general, µba is tightly bounded when a and
b are close to bin boundaries in the data, by virtue of the continuity of the CEF and uniformity
of the rank distribution. In contrast, absolute mobility (E(y|x=i)) is not point-identified for
any value of i. Figure 3 shows graphically how the relatively tight bounds on µ50
0 are obtained.
The wide uncertainty in our measures of β and p25 reflect a strength of our approach
relative to prior work. When rank data are highly censored, we should indeed have less
certainty over the ability of individuals to move up from the bottom of the rank distribution.
By delivering precise point estimates regardless of the coarseness of the data, conventional
34
If the CEF is linear, p25 =µ50
0 ; if the CEF is concave at the bottom of the parent distribution, then
µ50
0 < p25 . Most CEFs in the literature are concave, so µ500 effectively puts more weight on outcomes at
the very bottom of the parent distribution than p25.
35
Our framework can bound many other measures, such as µ20 0 (the expected rank of a child born in
the bottom 20%), E(y > 80|x < 20) (the probability that a child born in the bottom 20% makes it into
the top 20%), or the conditional median function of child rank given parent rank.
36
The Online Appendix provides a formal statement of analytical bounds on µba (derived in Novosad
et al. (2020) for the case of mortality estimation), and on arbitrary functions of the CEF, including the
best linear approximator to the CEF (i.e. the rank-rank gradient).
37
The rank-rank gradient is benchmarked against educational mobility estimates from Hertz et al. (2008).
For p25 and µ500 , we use income mobility estimates from Chetty et al. (2014a).14
methods use hidden assumptions (such as CEF linearity) and convey excess precision.
The rank-rank gradient, absolute mobility, and bottom half mobility are all scalar statistics
that capture different characteristics of the intergenerational persistence of rank, and they may
all be of independent policy interest. However, only bottom half mobility can be measured
informatively given the type of education data typically available in developing countries. This
makes bottom half mobility the first measure of intergenerational educational mobility that
can be compared meaningfully across population subgroups, across countries, and across time.
3.5 Comparison with Other Measures of Educational Mobility
Card et al. (2018) and Derenoncourt (2019) use education data to compare geographic
patterns in upward mobility between the 1920s and the 1980s. Both papers define upward
mobility in the 1920s birth cohort as the 9th grade completion rate of children whose parents
have 5–8 years of school, described by Card et al. (2018) as “roughly in the middle of the
parental education distribution.” They then compare this measure with p25 for a birth cohort
in the 1980s. Translating this into our framework, where x is a parent rank and y is a child
outcome, these papers are comparing E(y ≥ 50|x ∈ [45,70]) for the 1920s birth cohort to
E(y|x=25) in the present. The 1920s measure has the advantage of being calculated directly
as a bin mean, but it jointly measures rank persistence and overall education growth, while
p25 in the 1980s isolates rank persistence. Our approach makes it possible to isolate rank
persistence in both periods by measuring µ50
0 =E(y|x∈[0,50]) in both periods, regardless of
the bin boundaries available in the data.
Alesina et al. (2021), who study intergenerational mobility across Africa, face the same
problem of variable rank bin boundaries across countries and time. They focus on education
levels, defining upward mobility as the probability that a child born to a parent who has not
completed primary school manages to do so. Like the measure in Card et al. (2018), this
measure combines aggregate education growth with socioeconomic rank persistence. It also
conditions on different groups in different times and countries; in rank terms, this measure
approximately describes E(y >52|x∈[0,76]) in Mozambique (where 76% of parents and 48%
of children have not completed primary school) and E(y > 18|x ∈ [0,42]) in South Africa.
Our approach makes it possible to estimate E(y|x∈[0,50]) in all settings, isolating the rank
persistence interpretation of intergenerational mobility, as in Solon (1999) and Chetty et al.
(2014b).
Finally, when constructing transition matrices from interval data, researchers have ran-15
domly reassigned individuals across bins to create quantile bins. While this approach may
seem innocuous, in fact it implicitly assumes that the CEF is a step function with zero
slope between bin boundaries. This can result in biased estimates that are misleadingly
precise. For example, Narayan and Van der Weide (2018) find virtually identical outcomes
for children growing up in the bottom three quartiles of the parent distribution in Ethiopia
— a mechanical artifact of over 80% of parents reporting the bottom-coded education level.
4 Data
We draw on two datasets that report matched parent-child educational attainment. Our main
results rely on the India Human Development Survey (IHDS), a nationally representative
survey of 41,554 households, with rounds in 2004–05 and 2011–12. The IHDS identifies
religion and Scheduled Tribe or Scheduled Caste status. We classify SC/ST Muslims, who
make up less than 2% of SC/STs, as Muslims.38 About half of Muslims are Other Backward
Castes (OBCs); we classify these as Muslims.39
Crucially, the IHDS records the education of parents for the majority of respondents, even
if those parents have died or are not resident in the household. Estimates using the IHDS
data are thus not subject to concerns about coresidence bias. Parent-child coresidence rates
decline rapidly with child age (Appendix Figure A1). Appendix Figure A2 shows the bias
that arises from estimating upward mobility from coresident parent-child pairs. The bias
rises substantially for sons over age 25 and daughters over the age of 18. When looking at
older cohorts, it is thus essential to include children who no longer live with their parents
as we do in the IHDS sample; earlier Indian mobility estimates based on coresident children
as old as 40 should be treated with caution.
We estimate mobility in the past by studying children from older birth cohorts, also in the
2011–2012 IHDS. We address survivorship bias by showing that results are consistent with an
analysis of the same birth cohorts using the 2004–05 IHDS, described in Section 5.1. We pool
the data into 10-year birth cohorts for 1950–69, and 5-year birth cohorts for 1970–1989 where
38
Classifying this group as SC/ST or excluding this group does not affect any of the results because
overall they represent less than 0.4% of the population.
39
We do not consider OBCs as a separate category in this paper because OBC status is inconsistently
reported across surveys, due to both misreporting and changes in the OBC schedules. Analysis of mobility of
OBCs will therefore require detailed analysis of subcaste-level descriptors and classifications which are beyond
the scope of the current work. We pool Christians, Sikhs, Jains and Buddhists, who collectively make up less
than 5% of the population, with higher-caste Hindus (i.e. forward castes and OBCs); we describe this group
as “Forward/Other.” We find broadly similar results if we exclude these other religions from the sample.16
we have more power. The data do not contain links for mothers or daughters for the 1950–59
birth cohort. The oldest cohort of children that we follow was born in the 1950s and would have
finished high school before the beginning of the liberalization era in the 1980s. The cohorts
born in the 1980s would have completed much of their schooling during the liberalization era.
The youngest cohort in this study was born in 1989; cohorts born in the 1990s may not have
completed their education at the time that they were surveyed and are therefore excluded.
The sample size of the IHDS is too small to study geographic variation in any detail. We
therefore draw on the 2011–12 Socioeconomic and Caste Census (SECC), an administrative
socioeconomic database covering all individuals in the country that was collected to determine
eligibility for various government programs. The household roster describes age, gender,
education, and Scheduled Caste or Scheduled Tribe status, but not religion. Assets and
income are reported at the household level and thus cannot be used to estimate mobility.40
We construct parent-child links in the SECC only when parents and children reside in
the same household. To minimize coresidence bias, we limit the SECC analysis to sons
aged 20–23, a set of children for whom schooling is largely complete, but parent coresidence
rates are still high. We do not study daughters using the SECC, because many daughters
have already left home at ages when other daughters are still completing their education.
The SECC sample thus consists of 31 million young men and their fathers.41 We harmonize
education definitions across SECC and IHDS, resulting in seven categories that are commonly
used in Indian education data.42
Given the strengths and limitations of each dataset, we use the SECC to study cross-
sectional geographic variation in mobility, and the IHDS to study mobility differences across
groups and across time. Details on construction of parent-child links, coding of education
categories, and additional data sources and variables used in the geographic analysis can
be found in Appendix C.
40
Additional details of the SECC and the scraping process are described in Asher and Novosad (2020)
and in Appendix C.
41
For the coresident father-son pairs that are observed in both datasets, IHDS and SECC produce similar
point estimates for upward mobility.
42
The categories are (i) illiterate with less than primary; (ii) literate with less than primary (iii) primary;
(iv) middle; (v) secondary (vi) higher secondary; and (vii) post-secondary.17
5 Results: Intergenerational Mobility in India
5.1 Changes in National Upward Mobility, 1950–59 to 1985–89
Figure 4 shows our main measure of upward mobility (bottom half mobility, or µ50
0 =E(y|x∈
[0,50]), where y is the child education rank). Panel A shows the father-son relationship.
Upward mobility has been largely static over time, moving from [36.6,39.0] for the 1960–69
birth cohort to [37.5,37.9] for the 1980–85 birth cohort.43 For comparison, this measure in
the U.S., which has low intergenerational mobility by OECD standards, is 41.7.44
The bounds on the 1950–59 birth cohort estimates are wider, leaving open the possibility
of some gains from the 1950s to the 1960s birth cohorts.45 Note that a naive application of the
rank-rank gradient to these data would instead suggest substantial and precise improvements
in mobility over the sample period; Figure 2 shows that the data do not support a precise
estimate of this statistic once the interval censoring is taken into account.
Panel B of the same figure describes mobility from fathers to daughters. We cannot reject
a broadly similar pattern to the father-son results, though the wider bounds leave open the
possibility of mobility losses over this period. In the youngest birth cohort, father-daughter
mobility is 35.6, about two rank points lower than father-son mobility. Daughters are thus
less likely to escape low relative socioeconomic status than sons.
Obtaining informative mobility estimates for the mother-child relationships is more difficult,
because mothers are much more likely to be in bottom-coded education categories.46 Under
such severe censoring, we cannot estimate µ50
0 with any precision. Even in the most recent
1985–89 birth cohort, we estimate bottom half mobility to be [37.5,41.4] for sons and
[33.8,39.1] for daughters.47 We thus focus on estimates of mobility based on fathers.
We can also calculate µ50
0 with child education levels as the y variable. For example,
43
The measures are very tightly bounded for the more recent birth cohorts, because there is a rank
boundary close to 50 in the parent distribution. When the distance between upper and lower bounds is
less than 0.3, we report the midpoint as a point estimate.
44
Source: our calculations using µ50
0 , based on data from Chetty et al. (2020). There is not yet a wide
set of internationally comparable estimates of rank-based educational mobility, in part because of the
methodological challenges described and addressed in this paper.
45
Appendix Figure A3 shows that these results are unlikely to be affected by survivorship bias. We
estimate upward mobility for the same birth cohorts using the IHDS 2004–05; if mobility estimates for
older cohorts were affected by differential mortality of high mobility groups, we would find different estimates
from the earlier data, but the bounds are highly similar and show the same lack of change over time.
46
Among mothers of the 1960s birth cohort, 82% had less than two years of education. For the 1985–89
birth cohort, this number was 65%.
47
Appendix Figure A4 shows the admittedly uninformative graph of this measure over time.18
E(child years ≥ 12|x ∈ (0,50)) describes the likelihood that a child attains high school or
greater, conditional on having a parent in the bottom half. Panels C and D of Figure 4 show
this measure for father-son and father-daughter links respectively. The graphs also show
E(child years≥12|x∈(50,100)), the likelihood of high school attainment given a parent in
the top half of the education distribution. These graphs show the secular increase in high
school attainment over time for children from privileged and underprivileged backgrounds.
Daughters from bottom half families have experienced the least gains, while daughters born
in the top half of the distribution have almost closed the gap with well-off sons. For both
sons and daughters, gains in high school attainment have accrued almost entirely to children
from the top half of the distribution, a reflection of the stagnant overall upward rank mobility
seen in panels A and B. However, these estimates confound intergenerational mobility with
aggregate increase in education, which is why we focus on µ50
0 in rank terms.
To summarize, children born to less privileged families in post-liberalization India have very
similar prospects for moving up in the rank distribution as they did in the pre-liberalization era.
To be clear, living standards have improved for individuals across the rank distribution; it is the
probability of making progress in rank terms which is unchanged. This result thus contradicts
the narrative of India becoming a land of greater churn in terms of relative social status.
5.2 Changing Mobility Across Social Groups
We next examine how these levels and trends differ across groups. Figure 5 presents bottom
and top half mobility for Muslims, Scheduled Castes, Scheduled Tribes, and all others. Panel
A shows father-son pairs, revealing substantial trend differences across groups. As noted by
other researchers, upward mobility for Scheduled Tribes, and especially for Scheduled Castes,
has improved substantially (Hnatkovska et al., 2012; Emran and Shilpi, 2015). The expected
rank for SC children born in the bottom half of the parent distribution has risen from [33,
35] in 1960–69 to 38 in 1985-89, closing half of the mobility gap with upper castes. Upward
mobility for members of Scheduled Tribes rises from [29,31] to 33 over the same period.
In contrast, Muslim upward mobility declines substantially, falling from [31,34] to 29 in the
same period. These changes not only constitute a major decline in mobility, but make Muslim
men the least upwardly mobile group in modern India. Mobility for Muslim sons is lower even
than for ST sons, who are often thought of as having benefited very little from Indian growth.
The fact that a Muslim boy born to a family in the bottom half of the distribution can expect
to obtain the 29th percentile implies that Muslims born into low status are very likely to19
remain low status. Finally, the “Forward/Others” group, predominantly higher-caste Hindus,
shows little change, with mobility shifting from [42,44] to 42. The flat trend in upward mobility
for sons can therefore be decomposed into gains for SCs and STs and losses for Muslims.
Panel B shows downward mobility (µ100
50 ) for father-son links over the same period; this
measure reflects the persistence of high status among each group. We see a small amount
of convergence between the three marginalized groups and the Forward/Others group, chiefly
from the 1970s to the 1980s birth cohort. But there is no sign of the dramatic divergence
between SCs and Muslims that was found for upward mobility.48
To interpret these results, note that one rank point is associated with about 0.15 years
of education on average in 1985. The 9 rank point mobility difference between Muslim and
SC boys thus corresponds to 1.4 years of education in 1985, when children of bottom-half
parents on average attained 6.5 years of education.
Panels C and D of Figure 5 show the same results for father-daughter pairs. Among
daughters, with the exception of recent minor gains for SCs from top half families, none
of the marginalized groups have made substantial gains relative to Forwards/Others. There
is also little sign of the divergence between SCs and Muslims that was observed among
sons. Table 1 summarizes the changes over time for the full sample and all the population
subgroups, along with bootstrap confidence sets to account for sampling variation, calculated
following Chernozhukov et al. (2007).49 Table 2 shows confidence sets for mobility differences
between groups for the youngest (1985–89) birth cohort.50
Note that estimating µ50
0 for population subgroups implicitly assumes that the subgroup
parent populations are uniformly distributed across the bottom half of the rank distribution.
This assumption is unlikely to hold, but mobility changes will be biased only if the parent
density functions change substantially in the same period. We verify robustness to alternate
48
Appendix Figure A5 shows analogous results to Figure 5, but with education levels (at least primary,
and at least high school) as outcomes, rather than education ranks. The advantage of these graphs is that
they present outcomes for children that are not subject to interval censoring; the parent variable remains
interval censored. The results are consistent with the rank-based estimates, confirming that the separation
between Scheduled Caste and Muslim sons is not driven by unobserved changes in interval-censored ranks
for children from these groups.
49
Appendix Table A4 shows similar estimates with ranks calculated from the granular years of education
in the IHDS; the mobility estimates and subgroup differences are nearly identical.
50
The confidence sets in Tables 1 and 2 are wider than mobility confidence intervals from prior studies
because they reflect both statistical variation and uncertainty due to coarse measurement of education,
the latter of which has not been addressed by prior studies. The cross-group differences in the youngest
birth cohort are all highly significant, as is the trend difference between SCs and Muslims.You can also read