Synthesis of Geochronologic Research on Late Pliocene to Holocene Emergent Shorelines in the Lower Savannah River Area of Southeastern Georgia ...

Page created by Amanda Sanchez
 
CONTINUE READING
Synthesis of Geochronologic Research on Late Pliocene to Holocene Emergent Shorelines in the Lower Savannah River Area of Southeastern Georgia ...
Synthesis of Geochronologic Research on Late Pliocene to
Holocene Emergent Shorelines in the Lower Savannah River
Area of Southeastern Georgia, USA

Open-File Report 2021–1015

U.S. Department of the Interior
U.S. Geological Survey
Synthesis of Geochronologic Research on Late Pliocene to Holocene Emergent Shorelines in the Lower Savannah River Area of Southeastern Georgia ...
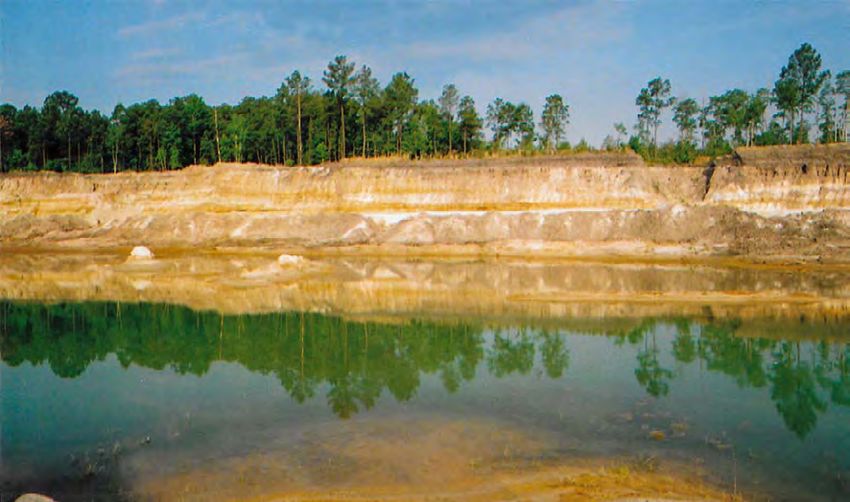
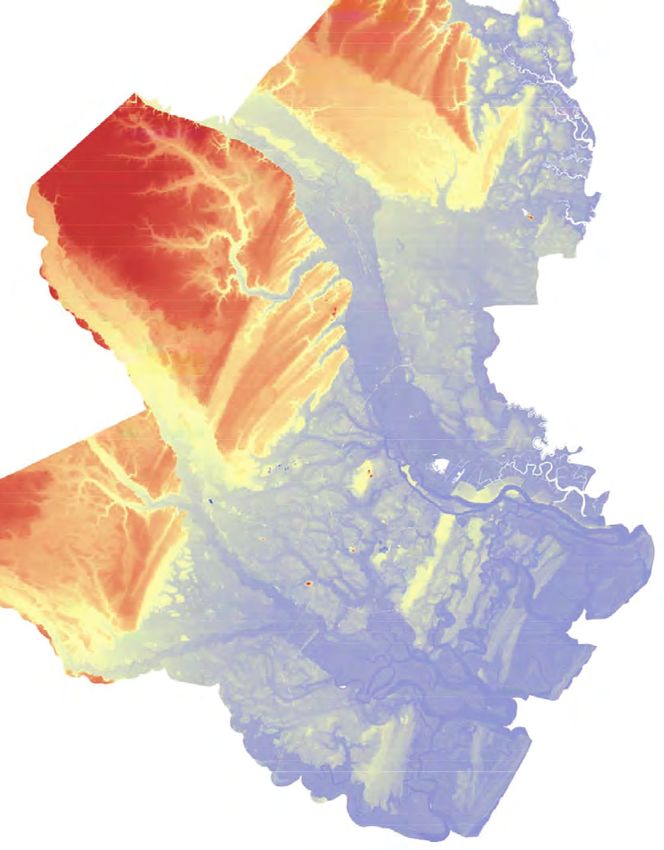
Cover. Borrow pit in the Pleistocene Pamlico Shoreline Complex in Chatham County, Georgia.
Photograph taken by Helaine W. Markewich, U.S. Geological Survey.
Synthesis of Geochronologic Research
on Late Pliocene to Holocene Emergent
Shorelines in the Lower Savannah River
Area of Southeastern Georgia, USA

By Helaine W. Markewich, Milan J. Pavich, Shannon A. Mahan, Paul R. Bierman,
Wilma B. Alemán‑González, and Arthur P. Schultz

Open-File Report 2021–1015

U.S. Department of the Interior
U.S. Geological Survey
U.S. Geological Survey, Reston, Virginia: 2021

For more information on the USGS—the Federal source for science about the Earth, its natural and living resources,
natural hazards, and the environment—visit https://www.usgs.gov or call 1–888–ASK–USGS.
For an overview of USGS information products, including maps, imagery, and publications, visit
https://store.usgs.gov/.

Any use of trade, firm, or product names is for descriptive purposes only and does not imply endorsement by the
U.S. Government.
Although this information product, for the most part, is in the public domain, it also may contain copyrighted materials
as noted in the text. Permission to reproduce copyrighted items must be secured from the copyright owner.

Suggested citation:
Markewich, H.W., Pavich, M.J., Mahan, S.A., Bierman, P.A., Alemán‑González, W.B., and Schultz, A.P., 2021,
Synthesis of geochronologic research on Late Pliocene to Holocene emergent shorelines in the lower
Savannah River area of southeastern Georgia, USA: U.S. Geological Survey Open-File Report 2021–1015, 48 p.,
https://doi.org/​10.3133/​ofr20211015.

ISSN 2331-1258 (online)
iii

Acknowledgments
Analytical data included in the tables and figures in this report are being published for the first
time. Funding for the field work and for collection and analyses of laboratory samples was
provided by the U.S. Geological Survey (USGS) National Cooperative Geologic Mapping Program
and the USGS Climate and Land-Use Change Research and Development Program. We thank
Chris W. Waters of Lanyard Development Inc., Pooler, Georgia, for access to company properties;
Keith Johnson and James Long for access to the Springfield-Stillwell pit; and David Crawley
and the Effingham County, Georgia, Board of Commissioners for access to county properties
and right-of-way. Special thanks to Gene Cobbs and Jeff Grey, former USGS drill crew, for their
help in acquiring new data; J.C. Jackson, USGS, for the clay mineral analyses; and G.R. Buell,
USGS, for GIS assistance. We thank T.M. Cronin, USGS; W.R. Doar III, South Carolina Geological
Survey; Ron Counts, Mississippi Mineral Resources Institute; and M.S. Harris, College of
Charleston, for their thoughtful comments on the post-Miocene geology of the southeastern
Atlantic Coastal Plain and the lower Savannah River area. We also thank Marci M. Robinson,
USGS, and Christopher S. Swezey, USGS, for reviewing the manuscript.
v

Contents
Acknowledgments����������������������������������������������������������������������������������������������������������������������������������������iii
Abstract�����������������������������������������������������������������������������������������������������������������������������������������������������������1
Introduction����������������������������������������������������������������������������������������������������������������������������������������������������1
     Background�������������������������������������������������������������������������������������������������������������������������������������������2
           Shoreline Evolution����������������������������������������������������������������������������������������������������������������������2
           Shoreline Age�������������������������������������������������������������������������������������������������������������������������������3
LSRA Shoreline Deposits and Shoreline Complexes—Stratigraphy and Age������������������������������������9
     Pliocene(?) or Older Deposits Atop and Landward of the Orangeburg Scarp�������������������������13
     Late Pliocene and Early Pleistocene Deposits������������������������������������������������������������������������������13
     Pleistocene Shoreline Complexes���������������������������������������������������������������������������������������������������15
           Wicomico Shoreline Complex (Qwi and Qwm)���������������������������������������������������������������������16
           Penholoway Shoreline Complex (Qpni and Qpnm)��������������������������������������������������������������16
           Talbot Shoreline Complex (Qti and Qtm)��������������������������������������������������������������������������������16
           Pamlico, Princess Anne, Silver Bluff and Holocene Shoreline Complexes���������������������16
                    Pamlico Shoreline Complex (Qpmi and Qpmm)�����������������������������������������������������������20
                    Princess Anne Shoreline Complex (Qpai and Qpam)�������������������������������������������������25
                    Silver Bluff Shoreline Complex (Qsbi and Qsbm)��������������������������������������������������������25
                    Holocene Shoreline Complex (Qhi and Qhm)���������������������������������������������������������������25
Details for Previously Unpublished Age and Stratigraphic Data���������������������������������������������������������25
     Brooklet Auger Hole, Atop the Orangeburg Scarp�����������������������������������������������������������������������28
     Chimney Road Core, Penholoway Shoreline Complex�����������������������������������������������������������������28
     1716, Shuman, and Redgate Borrow Pits, Pamlico Shoreline Complex������������������������������������31
     Localities Seaward of the Pamlico Shoreline Complex���������������������������������������������������������������31
Summary of Age Data���������������������������������������������������������������������������������������������������������������������������������37
General Observations Based on the Age Data���������������������������������������������������������������������������������������38
Concluding Comment����������������������������������������������������������������������������������������������������������������������������������38
References Cited�����������������������������������������������������������������������������������������������������������������������������������������39
Glossary���������������������������������������������������������������������������������������������������������������������������������������������������������46
Appendix 1. Methods Used for Sampling and Analyses��������������������������������������������������������������������47

Figures
         1. Map of the eastern United States of America, a map of the southeastern United
            States showing physiographic provinces, and a latitudinal section�����������������������������������4
         2. Maps showing political boundaries; geographic names; locations of described
            and sampled borrow pits, outcrops, and borings; and map units of Lawton and
            others (1976)����������������������������������������������������������������������������������������������������������������������������������5
         3. Age ranges and elevations for Pleistocene formations, shoreline sequences,
            and shoreline complexes������������������������������������������������������������������������������������������������������������9
         4. Lithostratigraphy and general pedologic description for the probable late
            Pliocene to earliest Pleistocene near-shore marine-sand at the top of the
            Orangeburg Scarp in Bulloch County, Georgia���������������������������������������������������������������������17
vi

         5. Lithostratigraphy, general pedologic description, and optically stimulated
            luminescence age data for Penholoway barrier deposits and overlying
            eolian sand in Effingham County, Georgia������������������������������������������������������������������������������19
         6. Lithostratigraphy, general pedologic description, and optically stimulated
            luminescence ages for Pamlico barrier deposits described and sampled in
            borrow pit exposures, Chatham County, Georgia�����������������������������������������������������������������22
         7. Lithostratigraphy of the Chatham 1 core in Qpam deposits on Isle of Hope,
            Chatham County, Georgia����������������������������������������������������������������������������������������������������������26
         8. Lithostratigraphy of the Chatham 18 core in Qsbi deposits, Skidaway Island,
            Chatham County, Georgia����������������������������������������������������������������������������������������������������������27

     Tables
         1.    Published and previously unpublished age data for late Pleistocene and
               Holocene near-shore marine and estuarine deposits in the lower
               Savannah River area, southeastern Georgia�������������������������������������������������������������������������10
         2.    Published and previously unpublished age data for late Pliocene to middle
               Pleistocene near-shore marine and estuarine deposits in the lower
               Savannah River area, southeastern Georgia�������������������������������������������������������������������������12
         3.    Previously unpublished quartz optically stimulated luminescence ages and
               data for samples from Chatham and Effingham counties, southeastern
               Georgia�����������������������������������������������������������������������������������������������������������������������������������������14
         4.    Beryllium‑10 concentration, horizon inventories, profile inventory, and
               minimum unit residence time, Brooklet auger hole, Bulloch County, Georgia�����������������15
         5.    Beryllium‑10 concentration, horizon inventories, profile inventory, and
               minimum unit residence time, Chimney Road core, Effingham County,
               Georgia�����������������������������������������������������������������������������������������������������������������������������������������18
         6.    Beryllium‑10 concentration, horizon inventories, profile inventory, and
               minimum unit residence time, Shuman borrow pit, Chatham County,
               Georgia�����������������������������������������������������������������������������������������������������������������������������������������20
         7.    Beryllium‑10 concentration, horizon inventories, profile inventory, and
               minimum unit residence time, Redgate borrow pit, Chatham County,
               Georgia�����������������������������������������������������������������������������������������������������������������������������������������20
         8.    Soil age indicator values for late Pliocene and Pleistocene emergent
               shoreline deposits in the lower Savannah River area, southeastern Georgia�����������������21
         9.    Particle-size distribution data in weight percent, Chimney Road core,
               Effingham County, Georgia��������������������������������������������������������������������������������������������������������29
        10.    Major element oxide chemistry in weight percent, Chimney Road core,
               Effingham County, Georgia��������������������������������������������������������������������������������������������������������30
        11.    Particle-size distribution data in weight percent, 1716 borrow pit,
               Chatham County, Georgia����������������������������������������������������������������������������������������������������������32
        12.    Major element oxide chemistry in weight percent for samples from the 1716
               borrow pit, Chatham County, Georgia�������������������������������������������������������������������������������������33
        13.    Minor element chemistry in parts per million for samples from the 1716
               borrow pit, Chatham County, Georgia�������������������������������������������������������������������������������������34
        14.    Minor element chemistry in parts per million for samples from the 1716
               borrow pit, Chatham County, Georgia�������������������������������������������������������������������������������������34
        15.    Particle-size distribution data in weight percent, Shuman borrow pit,
               Chatham County, Georgia����������������������������������������������������������������������������������������������������������35
vii

     16. Particle-size distribution data in weight percent, Shuman borrow pit,
         Chatham County, Georgia����������������������������������������������������������������������������������������������������������36
     17. Major element oxide chemistry in weight percent for samples from the Shuman
         borrow pit, Chatham County, Georgia�������������������������������������������������������������������������������������37

Conversion Factors
U.S. customary units to International System of Units

                      Multiply                                    By                                   To obtain
                                                                 Length
 inch (in.)                                                     2.54           centimeter (cm)
 inch (in.)                                                   25.4             millimeter (mm)
 foot (ft)                                                      0.3048         meter (m)

International System of Units to U.S. customary units

                       Multiply                                   By                                   To obtain
                                                                 Length
 centimeter (cm)                                               0.3937          inch (in.)
 millimeter (mm)                                               0.03937         inch (in.)
 meter (m)                                                     3.281           foot (ft)
 kilometer (km)                                                0.6214          mile (mi)
                                                                  Area
 square meter (m2)                                            10.76            square foot (ft2)

Supplemental Information
This report synthesizes published and previously unpublished age data for emergent late
Pliocene to Holocene shoreline deposits in the lower Savannah River area (LSRA) of Georgia,
a part of the southeastern Atlantic Coastal Plain (SEACP), and presents a preliminary
chronology for these deposits based on included data. The cited references are only a
fraction of the literature available on emergent shoreline deposits in the SEACP but provide a
concise summary and present status of geologic investigations in the LSRA. Most previously
unpublished data presented in this report are from investigations by the authors. Appendix 1
includes an explanation and a discussion of dating methods used to determine deposit age.
The map coordinate system is the USA Contiguous Albers Equal Area Conic USGS version; the
central meridian is 96° W. The datum is North American Datum of 1983 (NAD83).
viii

       Abbreviations
       ACP        Atlantic Coastal Plain
       AAR        amino acid racemization
       AMS        accelerator mass spectrometry
       10Be       Beryllium‑10
       10BePRT    Beryllium‑10 paleosol residence time
       cm         centimeter
       cm2        square centimeter
       cm3        cubic centimeter
       14C        carbon-14, radiocarbon
       DEM        digital elevation model
       Fm         Formation
       g          gram
       ka         age in thousands of years
       kW/m2      kilowatts per square meter
       lidar      light detection and ranging
       LSRA       lower Savannah River area
       m          meter
       Ma         age in millions of years
       OSL        optically stimulated luminescence
       Pa         protactinium
       ppm        parts per million
       SEACP      southeastern Atlantic Coastal Plain
       Sr         strontium
       Th         thorium
       U          uranium
       U-series   uranium disequilibrium series
       USA        United States of America
       USGS       U.S. Geological Survey
       yr         year
Synthesis of Geochronologic Research on Late Pliocene
to Holocene Emergent Shorelines in the Lower Savannah
River Area of Southeastern Georgia, USA

By Helaine W. Markewich,1 Milan J. Pavich,2 Shannon A. Mahan,1 Paul R. Bierman,3
Wilma B. Alemán‑González,1 and Arthur P. Schultz2

                                                                     Pliocene-Pleistocene geochronology for the Orangeburg Scarp
Abstract                                                             and shoreline deposits seaward of the Scarp in the LSRA of
                                                                     Georgia. Minimum ages and age ranges indicate the following:
      Emergent late Pliocene and Pleistocene shoreline deposits,
morphologically identifiable Pleistocene shoreline units, and             • the Orangeburg Scarp formed sometime in the late
seaward-facing scarps characterize the easternmost Atlantic                 Pliocene and early Pleistocene, between 3 Ma and 1 Ma;
Coastal Plain (ACP) of the United States of America. In                   • three, and possibly four, shoreline complexes were
some areas of the ACP, these deposits, units, and scarps have               deposited in the middle Pleistocene;
been studied in detail. Within these areas, temporal and spa-
tial data are sufficient for time-depositional frameworks for             • two shoreline complexes were deposited in the late
shoreline-evolution to have been developed and published.                   middle and the late Pleistocene;
For other areas, such as the southeastern Atlantic Coastal Plain          • deposition of the youngest shoreline complex began in
(SEACP), available data are conflicting and (or) insufficient to            the late Pleistocene and continues to the present;
develop such a framework, or to make shoreline correlations.
Differential epeirogenic uplift and shoreline deformation, result-        • each shoreline complex was modified by multiple sea
ing from mantle-flow and climate-induced isostatic adjustments,             level highstands over time periods that lasted tens of
complicate regional shoreline correlations. In the SEACP,                   thousands to hundreds of thousands of years; and
the topographically prominent Orangeburg Scarp (hereafter,                • Pleistocene shoreline chronology differs in part from
the Scarp) rises tens of meters in elevation from southeastern              modeled global sea level highstands.
Georgia to southeastern North Carolina. The degree to which
the Scarp and shoreline units seaward of the Scarp are deformed
continues to be debated, but there is general agreement that         Introduction
the lower Savannah River area (LSRA) of Georgia and
South Carolina is the least deformed area of the SEACP.                    The easternmost Atlantic Coastal Plain (ACP) of the
      This paper synthesizes published and previously unpub-         United States of America from New Jersey to northeastern
lished numerical age and stratigraphic data for emergent             Florida is characterized by emergent Pliocene and Pleistocene
Pliocene and younger shoreline deposits in the LSRA in               barrier/beach-ridge and back-barrier deposits and prominent
Georgia. Age data are applied to these shoreline deposits as         seaward-facing scarps. Many of the barrier/beach-ridge and
they are delineated (map units) on the 1976 geologic map of          back-barrier deposits form morphologically identifiable units
Georgia by Lawton and others. Age assignments are based              that have been mapped as stratigraphic formations and (or)
on stratigraphic position, fossil content, soil and weathering       informally referred to as shoreline deposits, sequences, and
diagnostic properties, and numerical ages as determined by           complexes. These morphostratigraphic units, shoreline deposits
meteoric Beryllium‑10 paleosol residence time (10BePRT),             with no apparent surface morphology, and scarps extend for
optically stimulated luminescence (OSL), uranium disequilib-         tens to hundreds of kilometers subparallel to the present coast.
rium series (U-series), amino acid racemization (AAR), and           Elevation change greater than a few meters along the length of
radiocarbon (14C) analyses. These data provide a preliminary         a mappable shoreline unit, an individual barrier/beach-ridge, or
                                                                     a scarp has been attributed to broad wavelength, mantle-flow
  1U.S.
                                                                     and climate induced, crustal deformation that occurred during
          Geological Survey.
                                                                     and (or) after shoreline formation. The degree of deformation
  2U.S.   Geological Survey, retired.                                is not regionally uniform, continues to be debated, and compli-
  3University   of Vermont.                                          cates shoreline correlation.
2     Synthesis of Geochronologic Research on Late Pliocene to Holocene Emergent Shorelines in Southeastern Georgia

      A number of references on the stratigraphy and degree of      River area (LSRA, fig. 1A, B) of Georgia and South Carolina
deformation of these shoreline units and scarps are included in     is the least deformed part of the SEACP (Winker and Howard,
the Background section of the Introduction. We refer the reader     1977; Blackwelder, 1981; Cronin and others, 1981; Dowsett
to articles in Oaks and DuBar (1974a) and the included refer-       and Cronin, 1990; Rowley and others, 2013; Rovere and others,
ences for a summary of ACP Pleistocene stratigraphic research       2014, 2015).
through the middle 1970s. Since the late 1970s, most published            The reader is referred to the introduction in Herrick (1965)
spatial data (for example, geologic maps and elevation profiles),   for a succinct summary of Pliocene and Pleistocene deposits and
time-stratigraphic data, and numerical age data are for emer-       shoreline studies in southeastern Georgia to that date. Herrick
gent shoreline units in the middle ACP north of the Cape Fear       (1965) referenced models for Pleistocene shoreline evolution as
Arch and the southeastern ACP (SEACP), north of Charleston,         presented by Veatch and Stephenson (1911) and Cooke (1925;
South Carolina (fig. 1). Doar and Kendall (2014) provide refer-     1930a,b; 1931; 1943). Those investigators identified numerous
ences and a summary of stratigraphic research and a discussion      terraces in the Georgia Coastal Plain and considered each ter-
on possible deformation of Pleistocene units and scarps in South    race to represent a shoreline and to be a unique formation. They
Carolina. Their data, however, are limited for the area south of    disagreed only in the number of shorelines/formations. Cooke
Charleston. This report focuses on presenting published and         (1943) identified eight shorelines/formations in Georgia and
previously unpublished stratigraphic and age data for emergent      considered the so-called terrace surface of each formation to be
Pliocene and Pleistocene shoreline units in the lower Savannah      a former sea floor. Herrick (1965, p. 2) disagreed and consid-
River area (LSRA) of Georgia (fig. 1). Most of the numerical        ered Pleistocene deposits in Georgia to be a “…simple, wedge-
ages are the result of investigations made in the last 30 years,    shaped, stratified mass which constitutes a single lithologic unit
and the preliminary shoreline chronology presented in this          upon which physiographic forms have been superimposed.”
report is based on these data. Since the focus of this report is    Herrick (1965, p. 7) considered the relatively flat terrace
on shoreline unit age and not on stratigraphic interpretations,     surfaces and their associated scarps to be the result of “…
the terms in this report (such as deposit and sequence) are used    cutting and redeposition during successive retreats and lower
as they were by the authors of the cited publications and are       stands of the sea.” This controversy was between two differing
defined in the Glossary.                                            concepts of emergent Pleistocene shoreline evolution: (1) that
                                                                    each terrace, underlying strata, and associated scarp comprises a
                                                                    unique morphostratigraphic formation; and (2) that the terraces
Background                                                          are physiographic forms that are superposed on only one
                                                                    lithostratigraphic formation. The controversy continued with the
Shoreline Evolution                                                 work of Hoyt and Hails (1967, 1974), Hails and Hoyt (1969),
                                                                    Winker and Howard (1977), and Huddlestun (1988). Hoyt and
      Most studies of SEACP Pliocene and Pleistocene                Hails (1967) generally agreed with the model of Cooke (1943)
shoreline evolution have used the Orangeburg Scarp (here-           and described each formation as occurring seaward of and
after, the Scarp) as a landward geographic limit of Pliocene        truncating older topographically higher shoreline formations.
sea level highstands. In the SEACP, the Scarp rises tens of         They identified six major Pleistocene shoreline formations in
meters in elevation from southeastern Georgia to southeastern       Georgia, each with a barrier island and lagoonal-marsh facies
North Carolina (figs. 1C and 2C). The Scarp is considered to        (fig. 2A–D). Neither Cooke (1943) nor Hoyt and Hails (1967)
be the wave-cut erosional landward limit of Pliocene sea level      considered the shorelines to be deformed. The shoreline model
highstands (for example, Doering, 1960; Winker and Howard,          of Hoyt and Hails (1967) was adopted by Lawton and oth-
1977; Blackwelder, 1981; Colquhoun, 1988; Huddlestun, 1988;         ers (1976) for Pleistocene map units on their geologic map of
Dowsett and Cronin, 1990; Colquhoun and others, 1991).              Georgia. For the map, they used the term “shoreline complex”
Discontinuous morphologically indistinct, near-surface late         for each shoreline formation (fig. 2A–D). Winker and Howard
Pliocene and early Pleistocene deposits occur just seaward of       (1977) disagreed with the models of Cooke (1943), Herrick
the Scarp. Morphologically distinct Pleistocene deposits occur      (1965), and Hoyt and Hails (1967). Winker and Howard (1977,
seaward of, and commonly overlie, the late Pliocene and early       p. 124 and caption for fig. 2) stated that their “New paleogeo-
Pleistocene deposits. These younger deposits are expressed as       graphic reconstructions led to new correlations of shallow
combinations of linear barrier/beach-ridges, cuspate barrier        stratigraphic units previously described from detailed local
ridges, drumstick-shaped barriers, or nearly planar back-barrier    studies.” They referred to these units as “shoreline sequences,”4
marshes and swamps. Models to explain the configuration, ele-       and traced each shoreline sequence from northeastern Florida
vation, and age of emergent shoreline deposits, sequences, and
scarps in the SEACP continue to evolve. Most models include
the development of marine terraces that are genetically linked to      4Winker and Howard (1977, p. 123 and 124) differentiated what they called

underlying deposits. References for the development of evolu-       “the shoreline record” into “regressive shoreline sequences” on the basis of
tionary models for emergent Pliocene and Pleistocene shore-         three “form(s) of evidence.” Their “primary basis for correlation” were regional
                                                                    progradational discontinuities that they considered “analogous to regional
lines in the LSRA are included in the following paragraphs.         unconformities in stratigraphy.” Their second “form of evidence” was the degree
Some of these models include the role of late Cenozoic crustal      of preservation of depositional surfaces that they interpreted as changing at each
movement in syndepositional and postdepositional shoreline          progradational discontinuity. Their third “line of evidence” was a change in
                                                                    coastal morphology that they interpreted as a “change in the style of beach-
deformation. Models that include the role of crustal movement       ridge progradation.” They named three “especially well preserved” sequences
in shoreline configuration indicate that the lower Savannah         (figs. 1B and 3 in this report).
Introduction  3

to southeastern North Carolina. Winker and Howard (1977)           geologic mapping (lithology, stratigraphic position, and fos-
considered each shoreline sequence to have been affected by        sil content), soil and weathering profile investigations, and
Pleistocene crustal deformation (fig. 1C) and agreed with Oaks     numerical ages from paleomagnetic, radiometric, chemical,
and DuBar (1974b) that emergent shoreline terrace/forma-           and optical analyses (for example, Veatch and Stephenson,
tions could not be correlated based solely on elevation. Winker    1911; Darby and Hoyt, 1964; Pooser, 1965; Colquhoun,
and Howard (1977, p. 127) stated that “…terrace names…,            1965; DuBar, 1971; DuBar and others, 1974; Campbell and
given widespread application on the sole basis of elevation, are   others, 1975; Woolsey, 1976; Blackwelder and Ward, 1979;
meaningless outside of their original localities and should be     Blackwelder, 1981; Liddicoat and Opdyke, 1981; Liddicoat
abandoned.” Huddlestun (1988) incorporated both concepts of        and others, 1981; McCartan and others, 1982; Pirkle and
shoreline formation into his evolutionary model. Huddlestun        Czel, 1983; Cronin and others, 1984; McCartan and others,
considered terraces ≥10 meters (m) elevation to have formed on,    1984; Szabo, 1985; Colquhoun, 1988; Huddlestun, 1988;
and have no genetic relation to the underlying deposits, but he    Markewich and others, 1986, 1989; McCartan and others,
also stated (p. 137),                                              1990; Owens, 1990; Markewich and others, 1992; Markewich
    “The Satilla Formation directly underlies the Pamlico          and Pavich, 1991, 1996; Weems and others, 1997; Weems
    and lower (or younger) marine terraces. Because the            and Edwards, 2001; Muhs and others, 2003; Wehmiller and
    lithofacies distribution of the Satilla Formation appears      others, 2004, 2010; Graybill and others, 2009; McGregor and
    to be related to the terrace landforms (i.e., barrier          others, 2011; Markewich and others, 2013; Doar and Kendall,
    island and back-barrier features), the deposition of the       2014). Only a few of these studies focused on areas south
    Satilla appears to be related to the construction of the       of Charleston (fig. 1B), which has resulted in a paucity of
    terraces...”                                                   ages and time-stratigraphic data for Pliocene and Pleistocene
                                                                   shoreline deposits in southeasternmost South Carolina and
     Like Cooke (1943), Herrick (1965), and Hoyt and Hails         southeastern Georgia, including the LSRA (discussions in
(1967), Huddlestun (1988) considered southeastern Georgia          Markewich and others [1992, 2013] and Doar and Kendall
to be tectonically stable and unaffected by late Cenozoic uplift   [2014]). In this area, the lack of detailed geologic maps, the
or subsidence. Relations among the mapped shoreline com-           meager number and scattered nature of available age data, and
plexes of Lawton and others (1976), the regionally correlated      lack of studies comparing dating techniques have precluded
shoreline sequences of Winker and Howard (1977), and the           definitive correlation of shoreline deposits. The following sec-
lithostratigraphic units of Huddlestun (1988) are shown for the    tion provides a synthesis of published and previously unpub-
LSRA in figure 3.                                                  lished stratigraphic and age data for Pliocene, Pleistocene,
                                                                   and Holocene shoreline deposits in the LSRA. Specific details
Shoreline Age                                                      for previously unpublished data for the LSRA are included
                                                                   in the section, Details for Previously Unpublished Age and
     Published age assignments for SEACP emergent shore-           Stratigraphic Data and in appendix 1.
line deposits in Georgia and South Carolina have been based
on more than 100 years of regional and locally detailed,
4   Synthesis of Geochronologic Research on Late Pliocene to Holocene Emergent Shorelines in Southeastern Georgia

      A                                                                                                                   B
                                                                                                                          85°                                      80°                                             75°
                                                                                                                                                     WV
                                                                                                      ME                        KY                                           VA
                                                                                              VT

                                                                                                                                                           NS
                                                                                                                                                         AI
                                                                                                 NH

                                                                                                                                                       NT
                                                                                                                                                                                          NC

                                                                                                                                                     OU

                                                                                                                                                                   AI LAN ll Zon NT
                                                                                         NY      MA                                                                            e                                    Albemarle

                                                                                                                                                    M
                                                                                                                                                     N

                                                                                                                                                                            Fa MO
                                                                                                CT                              TN                 IA                                                               Embayment
                                                                                                                                                 CH

                                                                                                                                                                               ED
                                                                                                       RI                                       A

                                                                                                                                                                             PI
                                                                                                                                               L            N
                                                                                                                                             PA

                                                                                                                                                                          TIC
                                                                          PA                                                               AP             IA ntic
                                                                                                                    35°                                ACH

                                                                                                                                                                        a
                                                                                                NJ                                                    L

                                                                                                                                                                     Atl
                                                                                                                                                    PA

                                                                                                                                                                PL AT
                                                                                                                                                                                                        Cape Fear

                                                                                                                                                                     N
                                             IN         OH                                      DE                                                AP

                                                                                                                                                              AL N
                                                                                                                                                                                SC                      arch

                                                                                                                                                            ST TER
                                                              WV                                MD
                                                                                                    Middle                                                    EA

                                                                                                                                                              S
                                                                                                                                                            TH OA
                                                                                  o ne

                                                                          VA                       Atlantic                                GA              U  C
                                                   KY                                            Coastal Plain                                           SO                           Charleston
                                                                             ll Z

                                                                            Fa

                                                                                                                                                                                                                        N
                                                                                                                                                                                                                      EA
                                                                                                                                                                           Savannah
                                                                        t ic

                                             TN                           n NC

                                                                                                                                                                                                                    OC
                                                                                                                                                LSRA
                                                                   t la

                                                                    A                                                                      study area                      Southeast Georgia

                                                                                                                                                                                                               TIC
                                                                        SC
                                                                                                                           AL                                              Embayment

                                                                                                                                                                                                             AN
                                                                                                Southeastern
            MS                               AL          GA

                                                                                                                                                                                                            L
                                                                                                Atlantic

                                                                                                                                                                                                         AT
                                                                                                Coastal Plain
                                                                                                                                                                                Central Florida
                                                                                                     N

                                                                                                                    30°
                                                                                                    EA

                                                                                                                                                                                arches and ridges
                                                                                                 OC

                                                                        FL
                                         GULF
                                                                                              TIC

                                          OF
                                                                                           AN

                                        MEXICO
                                                                                            L

                                                                                                                                      GULF
                                                                                         AT

                                                                                                                                       OF                                   FL
      Base modified from 1:7,500,000-scale                                                                                           MEXICO
      U.S. Geological Survey digital files

                                                                                                                                                                                            0                100          200 MILES

                                                                                                                                                                                            0          100      200 KILOMETERS
                                                                                                                    25°
                                                                                                                          Base modified from 1:7,500,000-scale
                                                                                                                          U.S. Geological Survey digital files

                                                                                                                     Southeast Georgia                                         Cape Fear
                                             C                                                                          Embayment                                                arch

                                                                          FLORIDA                                  GEORGIA                    SOUTH                                    NORTH
                                                                                                                                             CAROLINA                                 CAROLINA
                                                                                                                                                                                                                         100
                                       300                                                                                                                                                                               90
                                                                                                                                                                                                                               Meters, above mean sea level
                                       275                                                                                                                rp
          Feet, above mean sea level

                                                                                                                                                        ca                                                               80
                                       250
                                                                                                                                                     rgS                                                                 70
                                       225                                                                                                         bu
                                                                                                                                                 ge
                                       200                                   Central Florida
                                                                                                                                              ran                                                                        60
                                                                              arches and                                                     O
                                       175                                                                                                                                                                               50
                                                                                ridges                                                           LSRA study
                                       150
                                                                                (karst)                                                                                                                                  40
                                       125                                                                                                       area                                                 Effingham
                                       100                                                                                                           Santee     Great                                 Sequence           30
                                        75                                                                                             Savannah       River Pee Dee River
                                                                                                   St. Marys     Altamaha                River                                                                           20
                                        50                                                                         River
                                                                                                                                                                                                      Chatham
                                                                                                       River                                Port
                                        25                                                                                                 Royal
                                                                                                                                                                         Cape Fear River              Sequence           10
                                         0                                                                                                                                                                               0
                                             27˚             28˚                     29˚              30˚          31˚               32˚            33˚                  34˚               35˚                36˚
                                                                                                                 Latitude                                                             0          50          100 MILES

                                                                                                                                                                                      0   50       100 KILOMETERS

Figure 1. Map of the eastern United States of America (A) showing the Atlantic Fall Zone, the middle Atlantic Coastal Plain, and the
southeastern Atlantic Coastal Plain. (B) Map of the southeastern United States showing physiographic provinces, major arches and
basins, and the lower Savannah River area (LSRA). (C) Latitudinal section showing State boundaries, locations of major rivers where
they enter the Atlantic Ocean, location of the LSRA (gray vertical bar), spatial relations among emergent shoreline sequences and
the arches and basins, and maximum sea level highstand elevations for each shoreline sequence (modified from fig. 3 in Winker and
Howard, 1977).
Introduction  5

                    A
                          81˚30'                          81˚20'                               81˚10'                           81˚00'

                                                      Area shown in fig. 2C
                                                              HAMPTON
                          Nu
                                    PPs
                                   SCREVEN

                                                                                                                                    JASPER
                                                                                                          Qal and
                                              PPs
                                                                                                          eolian
           32˚30'                                                                                         dunes
                                                                                                                                     SOUTH

                                                                                                     Sa
                                                                                         Qwi

                                                                                                         va
                                                                   Qwm                                                              CAROLINA

                                                                                                          nn
                                                                                                           ah
                     Nu                                   EFFINGHAM                                Qal

                                                                                             RR
                                     O

                                                                                                   EF‑3
                                      ge

                                                                                                                Qal
                                         e

                      PPs
                                         ch

                                                                                         E                                                             Northern part of area
                                             ee

                                                                       Qwi
                                                                                                                                                        shown in fig. 2B
           32˚20'
                                                                                       EF‑13
                                                    Riv

                                                                                   Qpnm                                                              BEAUFORT
                                                     er

                                                             Qal             GEORGIA
                                   Qwm

                                                                                                                      Ri
                                                             and

                                                                                                                        ve
                          BULLOCH                           eolian

                                                                                                                            r
                                                            dunes                                                     Qhm
                                                                                   Qpni            Qti

                                                                     Qpnm                                                                                        Qhm
                                                    Qwi
           32˚10'                   BRYAN                                          Qti            CHATHAM                                              Qhm
                                   Qwm                                       Qtm                                                   SAV                                                Qhi
                                                           Qpni                                    Qpmm                CH‑14                                     Qpai    Wilmington
                                                                                                                                  Qpmi                                     Island

                                                                                                                                                 Qpam                   Qsbi
                                                                                                                            HAF                                                         i
                                                                                                                                         Qpam                     Qhm                 Qh
                                                              Qtm                                                                                       CH‑18
                                     Qal                                                                                                                                            Tybee
                                     and
                                                                 e      River                                                                        CH‑1                           Island
                                    eolian                  oche                                                                                 Qsbi                 Area shown in
           32˚00'                   dunes           Cano                                                  Qhm                                                     Qhm    fig. 2D
                                                                                                                                                                          i
                                                                                                                                                                        Qh Wassaw
                                                                                                                                  Qhm                                       Island

                                                                                                                                                                 Skidaway
                                                                                                  Qpmm                                    Qsbi                   Island
                                                                                                                                                                                 N
                                                                                                                                                                                EA
                                                                                                                                                                               OC

                                                                                                                Qpmi               Qhm
                                                                                                                                                                          TIC

                                                                                                                                                 Qhi
                                                                                                                                                                       L AN

           31˚50'                                                                                                                                    Ossabaw
                                                                                                                                                                    AT

                                                                                                                       Qhm
                                                                                                                                                     Island

                    Base modified from 1:7,500,000-scale                                                                                         0                  5               10 MILES
                                                                                                  EXPLANATION
                    U.S. Geological Survey digital files
                                                                     Elevation, in meters                       Contact between units            0           5           10 KILOMETERS
                                                                                   43                              is inferred
                                                                                                                Contact between units
                                                                                   −11            CH‑14         Boring site and number

Figure 2. Maps showing political boundaries; geographic names; locations of described and sampled borrow pits, outcrops, and borings;
and map units of Lawton and others (1976). A, Map units overlain onto a 1.22‑meter-(m) raster digital-elevation model (DEM) of the lower
Savannah River valley and adjacent terrain in Georgia and South Carolina. The DEM was generated from 1.0‑point/m2 light detecting and
ranging (lidar) bare-earth elevation datasets (South Carolina LiDAR Consortium, 2007; Chatham County Georgia, 2011; and Coastal Georgia
Elevation Project, 2011). B and C, Enlargements of map areas outlined by rectangles in figure 2A. D, Skidaway Island and Isle of Hope
borings and sample locations and map units. Published and previously unpublished age data for each map unit of Lawton and others (1976)
are in tables 1 and 2. OSL, optically stimulated luminescence.
6   Synthesis of Geochronologic Research on Late Pliocene to Holocene Emergent Shorelines in Southeastern Georgia

                B
                   81˚20'                                                       81˚10'                                                     81˚00'
                Qpnm
                                     Qti                                                                           Oatland
                         Qtm                                                                                        Island
                                                                                     Qpmi                      Sav
                                                                                                                     ann
                                                                                                                        ah                            Ri
                                                  Qpmm                                                                                                    ve
                                                                                                                                                            r

                                                                                                                                                                                           Cockspur
                                                                                                                                      40
                                                                                                                                                                                            Island
                                                                                      1716, Shuman, and
                                                                                      Redgate, borrow pits                                  Qpai                                                Tybee
                                                                                                                                    Qpam                                                        Island

                                                                                                                                                         Wilmington
                        Qal                                                                                                                                Island
                                                                                             Qpmi
                                                                                                              Qpam                                  Qsbi
       32˚00'
                                                                                                            Isle                                                                    Qhm
                                                                                                             of
                                                                                                           Hope
                                                                                                                                           Wi
                                                                                                                                              lm
                                                                                                      FCGC                                      ing
                                           Og

                                                                                                                                                                 So ssaw
                                                                                                                                                     ton
                                             ee

                                                        Qhm                                                                  Qsbi

                                                                                                                                                                      d
                                                                                                                                                           Ri
                                               ch

                                                                                                                                                                   un
                                                                                                                                                                ve                Little

                                                                                                                                                                  Wa
                                                ee

                                                                                                                       Skidaway                                   r              Tybee
                                                  Ri

                                                                                                                        Island
                                                    ve

                                                                                                                                                                                 Island
                                                      r

                                                                                                                                                                      Qhi

                                                                                                                                                                                               N
                                                                                                                                      Qhm

                                                                                                                                                                                               EA
                                                                                41

                                                                                                                                                                                           OC
                                                                                                                                                                       Wassaw
                                                                                                                                                                       Island

                                                                                                                                                                                           C
                                                                                                                                                                                       TI
                                   Qpmm                       Fort

                                                                                                                                                                                     AN
                                                                                                                           So abaw

                                                                                                                                                                                    L
                                                            McAllister

                                                                                                                                                                                 AT
                                                                                                                                 d
                                                                                                                             un
                                                                                                                               s
                                                                                                                            Os

       31˚50'                                               Qpmi

                                                                                                                                                                      EXPLANATION
                                                                                                                                                                Holocene

                                        Qhm                                                         Qsbi                                                 Qhi     Island facies

                     Qpmm                                                                                                                             Qhm Marsh facies
                                                                                                                           Ossabaw
                                                                          Qhm                          Qhi                                                      Pleistocene
                                                                                                                           Island
                                                            Me                                                                                        Qsbi       Silver Bluff, island facies
                                                               dw
                                                                   ay                                                                                 Qpai       Princess Anne, island facies
                                                                        Riv
                                                                           er
                                                                                        s

                                                                                                                                                      Qpam       Princess Anne, marsh facies
                                                                                  un ne
                                                                                So heri

                                                                                                                                                      Qpmi       Pamlico, island facies
                                                                                      d
                                                   mi

                                                                                    t
                                                                                 Ca

                                                                                                                                                      Qpmm       Pamlico, marsh facies
                                                 Qp

                                                                                St

                                                                                                                                                       Qti       Talbot, island facies
                                                                                                                                                      Qtm        Talbot, marsh facies
                                                                                                                                                         Qal
                                                                                                                                                           Stream alluvium and
                                                                                                                                                               undifferentiated
       31˚40'
                                                                                                                                                               terrace deposits
                                                                    Qhm                  Qsbi                                                         Qpnm Penholoway, marsh facies
                               Qhm Qpmi
                                                                                                                                                    41          OSL sample site and number
                                                                                                     St. Catherines
                                                                                                     Island                                  FCGC               Site from which samples were
                    Qpmm              Qpai                                                                                                                          dated by methods other
                                                                                                                                                                    than OSL and identifier
                                                                                                    South
                                 i
                             Qpa

                                                                                                    Newport
                          m

                                                                                                    River
                       Qpa i
                         m

                                                                                                                               0                                       5                         10 MILES
                       Qp

                                        Qpai
                                                                                     Qhi                                       0                     5                      10 KILOMETERS

                Base modified from 1:7,500,000-scale, U.S. Geological Survey digital files

      Figure 2.—Continued
Introduction  7

     C                               81˚30'                                             81˚20'                                                         81˚10'

                                                                                                                                                                          EXPLANATION
                                                                                                                                                 Pleistocene

                                     arp
                                                                                                                                          Qpmi Pamlico, island facies              Qwi     Wicomico, island facies
                Nu
                                 g Sc
                                                                                                                                      Qpmm Pamlico, marsh facies                  Qwm Wicomico, marsh facies
                             ebur

                                                                       Nu
                                                                                                                                           Qti    Talbot, island facies                  Pliocene/Pleistocene
                                                                                     Sa
                        Orang

                                                                                        v   an                                            Qtm     Talbot, marsh facies             PPs     Pliocene-Pleistocene
                                                                                                 n a h Ri
                                                                                                            ver                           Qpni Penholoway, island                              sands
                                                                      Porter’s                                                                    facies                           Nu      Neogene undifferentiated
                                                    EN M              Landing                                                 Nu
                                                R EV HA                                                                                    Qal    Stream alluvium and     32             OSL sample site and number
                                              SC ING                                                                                                  undifferentiated
                                                  F                                                                                                   terrace deposits BUL-75
                                               EF                                                                                                                                        Site from which samples were
                                                                                                                                          Qpnm Penholoway, marsh                             dated by methods other
                                                              PPs                                                                                 facies                                     than OSL and number
                                                                                                                  32
32˚30'

          Nu                               Brooklet
                                           auger hole
                       Qal
                                                                                 GEORGIA
                                                                                                                                                   SOUTH CAROLINA

                                                                                  Qwm                                     Qwi

               BUL-75                                                                       Springfield-
                                                                                            Stillwell pit
             Stilson                           Og
                                                ee c

                PPs                                  he
                                                       e
32˚20'
                                                           Rive

                                                                                                                                             17, 34,
                                                                r

                                                                                            Qwi                                Chimney            38
                                                                                                                                                                Qal
                                                                                                                                  Road
                                                                                                                                  core
                         BULLOCH

                                     Qwm                                                                Qpnm
                                                                                                                                                       33

                                                                                                                       Qpni

                                                                                                                                    Qtm

32˚10'                                                      Qwi                   SECMS                                       Qti
                                                                    Qpnm
                                                                                                                   Qti
                  BRYAN                                                                    AM
                                                                                         H
                                                                                      N G AM
                                                                                          H
                                                                                    FI AT
                                                                                  EF CH
                                                                           Qal                                                     Qpmm
                                                    Qwi       Qpni
                                                                                                                                                                       Qpmi
                                                                       Qtm
         Base modified from 1:7,500,000-scale                                                                             0                            5                        10 MILES
         U.S. Geological Survey digital files
                                                                                                                          0                 5                   10 KILOMETERS

Figure 2.—Continued
8   Synthesis of Geochronologic Research on Late Pliocene to Holocene Emergent Shorelines in Southeastern Georgia

                                               D
                                                      81˚04'              81˚03'            81˚02'            81˚01'

                                                 Qpam                                                 CH-18

                                                                                            iver
                                                                          CH-1

                                                                                        ay R
                                                               Qpam

                                                                                                                          Wilmin g t on Riv
                                                                                      aw
                                                                                                              marsh
                                                                                    S kid
                                      31˚59'
                                                           Isle of
                                                            Hope
                                                         GAW22
                                                                                                              GAW19

                                                                                                                                  er
                                      31˚58'                        GAW21

                                                          GAW20
                                                                           GAW23
                                      31˚57'             marsh
                                                                                     Skidaway Island

                                                 Mo                   J                            Qsbi
                                                    on
                                      31˚56'             Riv
                                                               er
                                                                                                                       Qhm

                                                                                             SK05B                      marsh
                                                                    SK06B
                                      31˚55'

                                               Base modified from 1:7,500,000-scale                       0                  1 MILE
                                               U.S. Geological Survey digital files
                                                                                                          0            1 KILOMETER
                                                                                   EXPLANATION
                                                          GAW19
                                                                                   OSL sample site and number
                                                                CH-1
                                                                                   Boring site and number
                                                                     J             Site from which samples were
                                                                                       dated by methods other
                                                                                       than OSL and identifier
                                                                                   Holocene
                                                                          Qhm Marsh facies
                                                                                   Pleistocene
                                                                          Qsbi Silver Bluff, island facies
                                                                          Qpam Princess Anne, marsh facies

                                     Figure 2.—Continued
LSRA Shoreline Deposits and Shoreline Complexes—Stratigraphy and Age                                                    9

                                         Middle Pleistocene                                                   Late middle and late Pleistocene
                                        Effingham Sequence                                                          Chatham Sequence
                                      Winker and Howard (1977)                                                   Winker and Howard (1977)
                                420–360 ka
                       34                                                                                                                                                                                34
                                                                                                                                 Wicomico (Qwi, Qwm)
                       32               Wicomico                                                                             Penholoway (Qpni, Qpnm)             Shoreline complexes                     32
                       30                 barrier           330–250 ka                                                                  Talbot (Qti, Qtm)        of Lawton and others (1976)             30
                                        (22–28 m)                                                                                Pamlico (Qpmi, Qpmm)            each complex has two facies
                       28                                   Penholoway                                                      Princess Anne(Qpai, Qpam)            barrier island (i) and marsh            28
                                                           (16.5–24.5 m)                                                       Silver Bluff (Qsbi, Qsbm)         and lagoonal (m)
                       26                                                                                                          Holocene (Qhi, Qhm)
                                                                                                                                                                                                         26
                       24                                                                                                                                                                                24
                                Cypresshead
                       22        Formation                                                                                                                                                               22
Elevation, in meters

                       20                                                                                                                                                                                20
                                                                                                              ~300–218 ka
                       18                                                                                                                                                                                18
                       16                                                                                                                                 >220–33 ka                                     16
                                                         Cypresshead
                       14                                 Formation                                                                                                    130–70 ka                         14
                                                                                     Pamlico or Talbot                                 Pamlico barrier
10      Synthesis of Geochronologic Research on Late Pliocene to Holocene Emergent Shorelines in Southeastern Georgia

Table 1. Published and previously unpublished age data for late Pleistocene and Holocene near-shore marine and estuarine deposits
in the lower Savannah River area, southeastern Georgia.

                         Dating
                                      Sample ID and age,                                                           Ground surface elevation
  Geologic unit and    method and                                                          Figure with sample
                                        in thousands of           Data sourcec                                     and (sample elevation) at
  sample materiala     (number of                                                                locality
                                             years                                                                sample locality, in metersd
                        samples)b
                                                               Cockspur Island
 Qhi                   AMS     14C    4.3                    Figure 3 in Swezey and    Specific locality not      1.0
   oyster shell in      (1)                                    others (2018)             shown.
   marine/estuarine
   quartz sand
                                      Small islands in marsh between Skidaway and Wassaw Islands
 Qhm                   OSL            OSL07,                 Table 7.2 in Turck and    Islands shown on           OSL07
   quartz sand           (3)           1.556±0.22              Alexander (2013)           figure 1B; specific      1.7 (0.55)
                                      OSL08,                                              localities not shown.   OSL08
                                        0.925±0.10                                                                 0.2 (−0.93)
                                      OSL09,                                                                      OSL09
                                        0.528±0.50                                                                 0.97 (0.12)
                                                      Oatland Island and Fort McAllister
 Qhm                   OSL            Oatland,               Analytical data for       Localities shown on        GAW40
   quartz sand           (2)            GAW40                  sample ages in            figure 2B                 2 (1.15)
                                        35.1±2.1               table 3
                                      Fort McAllister,                                                            GAW41
                                        GAW41                                                                      2.7 (1.8)
                                        28.8±1.7
                                                              Wilmington Island
 Qsbi                  14C            WL-158                 Hoyt and others (1968)    Specific locality not      (−0.6)
   shell in marine       (1)           42.6±3.7                                          shown.
   quartz sand                         (infinite)
                                                              Skidaway Island
 Qsbi                  AMS 14C        Beta112547             Booth and others          J on figure 2D             4.2
   quartz sand          (1)             36.8±0.3               (2003)                                               (~3.5)
   channel with
   peat clasts; date
   on plant stem in
   clast
 Qsbi                  230Th/238U     87–82                  Jones Pit, table 2 in  J, on figure 2D               4.2
   Coral Septastrea      (5) and                               Wehmiller and others                                 (−1.0 to 3.0)
                         231Pa/238U                            (1997, 2004)
                         for 3 of
                         the 5
                         230Th/238U

                         samples
 Qsbi                  AAR            130–70                 Hulbert and Pratt       J, on figure 2D              4.2
   many                 (many                                  (1998) and figures 18                                (−1.0 to 3.0)
   Mercenaria           samples)                               and 19 in Muhs and
                                                               others (2003)
 Qsbi                  OSL            SK06B,                 Table 7.2 in Turck and    Figure 2D                  SK06B
   quartz sand           (2)            45.80±10.20            Alexander (2013)                                     3.8 (2.6)
                                      SK05B,                                                                      SK05B
                                        46.50±9.80                                                                  3.5 (2.3)
LSRA Shoreline Deposits and Shoreline Complexes—Stratigraphy and Age   11

Table 1. Published and previously unpublished age data for late Pleistocene and Holocene near-shore marine and estuarine deposits
in the lower Savannah River area, southeastern Georgia.—Continued

                             Dating
                                             Sample ID and age,                                                                 Ground surface elevation
  Geologic unit and        method and                                                                 Figure with sample
                                               in thousands of              Data sourcec                                        and (sample elevation) at
  sample materiala         (number of                                                                       locality
                                                    years                                                                      sample locality, in metersd
                            samples)b
                                                                Skidaway Island—Continued
 Qsbi                     OSL               GAW19,                   GAW19 and GAW23,      Figure 2D                          GAW19,
   quartz sand              (2)              117±11                   table 2 in Markewich                                     2.9 (1.8)
                                            GAW23,                    and others (2013)                                       GAW23,
                                             106±5                                                                             2.0 (1.2)
                                                                     St Catherines Island
 Qsbi                     AMS 14C           WW1262                   Figure 6 in Booth and         St. Catherines on          2.13
   quartz sand with        (2)               4.1±0.05,                 others (1999)                  figure 2B, specific        (2.7)
   shells and char-                          shells                                                   locations not shown.
   coal fragments                           WW1198
                                             6.0±0.05,
                                             charcoal
 Qsbi               AMS 14C                 WW1197                   Figure 6 in Booth and         St. Catherines on          2.13
   compact blackish  (1)                     47.6±2.5                  others (1999)                  figure 2B,                 (2.6)
   brown peat                                (infinite)                                               specific location not
                                             peat                                                     shown.
                                                                          Isle of Hope
 Qpam                     OSL               GAW20,                   Analytical data for           Figure 2D                  GAW20,
   quartz sand              (3)              >220                      sample ages in                                          3.1 (1.4)
                                            GAW21,                     table 3                                                GAW21,
                                             9.3±0.4                                                                           3.5 (3.4)
                                            GAW22,                                                                            GAW22,
                                             35.7±2.7                                                                          4.3 (3.5)
                         Easternmost mainland, ~4 kilometers west-northwest of Skidaway Island across the Skidaway River
 Qpam                     OSL               SK03,                    Turck and Alexander           Location not shown.        SK03,
   quartz sand              (1)               62.6±13.0                (2013, table 7.2)                                        6.3 (1.3)
 Qpam                     AMS 14C           UGAMS                    Bethesda Shoreline A,   Location not shown.              Shoreline A,
   shell                   (2)               R50537,                   and Bethesda                                             6.3 (4.8)
                           median            43.2                      Shoreline B, in Turck
                           ages             UGAMS                      and Alexander (2013,                                   Shoreline B
                                             R50537B,                  table 7.1)                                               6.3 (4.8)
                                             44.9
  aGeology   is from Lawton and others (1976). Unit abbreviations explained on figure 2B, C in this report.
  bDating methods include: U-series, 230Th/238U and 231Pa/238U; AAR, amino acid racemization; OSL, optically stimulated luminescence; AMS 14C, accelerator

mass spectrometry radiocarbon and 14C, radiocarbon analysis that predates use of AMS.
   cAnalytical data for previously unpublished OSL ages, for samples GAW20, 21, 22, 40, and 41, are in table 3. Samples were collected by authors of

this report.
  dSurface elevation determined from 1‑point/m2 light detecting and ranging (lidar) made available by Chatham County Georgia (2011) and the Coastal Georgia

Elevation Project (2011). Sample elevation determined by subtracting the sample depth from the surface elevation of the sample location. Surface locations
and elevations, for samples reported by Turck and Alexander (2013), were estimated by comparing the locations shown on figure 7.5 in their article to the
1‑point/m2 lidar.
12        Synthesis of Geochronologic Research on Late Pliocene to Holocene Emergent Shorelines in Southeastern Georgia

Table 2. Published and previously unpublished age data for late Pliocene to middle Pleistocene near-shore marine and estuarine
deposits in the lower Savannah River area, southeastern Georgia.

                                                                                                                       Ground surface and
                              Dating method       Sample ID and
       Geologic unit and                                                                               Figure with     (sample elevation)
                              and (number of     age, in thousands           Data sourcec
       sample materiala                                                                              sample locality   at sample locality,
                                samples)b             of years
                                                                                                                           in metersd
                      Easternmost mainland, ~4 kilometers west-northwest of Skidaway Island across the Skidaway River
 Qpam                       AAR                  450–250              Figures 16, 18, 19 in Muhs    FCGC on            6.0
   Mollusks Mercenaria       (many samples)                             and others (2003)             figure 2B           (−1.0 to 2.0)
                                                  1716, Shuman, and Redgate borrow pits
 Qpmi                       OSL                  1716A,               Analytical data for OSL   Localities for the     1716A,
   quartz sand                (2)                  267±28               sample ages in table 3    three borrow           11 (9.3)
                                                 1716B,                                           pits shown by        1716B,
                                                   >290                                           white circle           4 (1.7)
                                                                                                  on figure 2B;
 Qpmi                       10BePRT              Shuman,              Analytical data for                              Shuman,
                                                                                                  stratigraphy
   weathered and              Shuman               163                  10BePRT Shuman sample                            9.5–10.5
                                                                                                  for 1716, on
   pedogenically altered      (7)                                       ages in table 6 and for                          (6.0–10.0)
                                                                                                  figure 6A, for
   quartz barrier sand,       Redgate            Redgate,
                                                                        10BePRT Redgate sample
                                                                                                                       Redgate,
                                                                                                  Shuman, on
   locally overlain by        (5)                  231                  ages in table 7                                  9.5–10.5
                                                                                                  figure 6B, and
   eolian sand                                                                                                           (5.5–10)
                                                                                                  for Redgate,
                                                                                                  on figure 6C
                                          Northern Chatham and southernmost Effingham counties
 Qpmm or Qtm               OSL                   GAW33,               Table 2 in Markewich and      Star33 on          GAW33,
   Savannah river terrace    (1)                  >220                  others (2013)                 figure 2C         5.2 (4.4)
   fluvial/estuarine silty
   sand
 Qpni                       OSL                  GAW17,               Table 2 in Markewich and      Figure 2C          GAW17,
   eolian sand (GAW17)        (2)                 129±7                 others (2013)                                   15.1 (14.4)
   overlying near-shore                          GAW34,                                                                GAW34,
   marine/estuarine silty                         >225                                                                  15.1 (14.3)
   sand (GAW34)
 Qpni                       OSL                  GAW38,               Analytical data for OSL       Star38 and         GAW 38,
   eolian sand (GAW38)        (1)                 88.9±3.8              sample age in table 3         Chimney           15.9 (15.0)
   overlying weathered      10BePRT              ~175                 Analytical data for             Road core on     Core interval,
   and pedogenically          (12)                                      10BePRT samples in            figure 2C          15.9 to 1
   altered, barrier sand                                                table 5                                          (4.9 to 0.3)
   (samples from core)
 Qwi                        OSL                  GAW04,               Tables 2 and 3 and figure 4   Springfield-       GAW04,
  eolian sand overly-         (2)                 42.6±2.2              in Markewich and others       Stillwell pit     25 (23.5)
  ing weathered and                              GAW03,                 (2013)                        on figure 2C     GAW03,
  pedogenically altered                           116±6.4                                                               25 (22.7)
  underlying barrier
                            10BePRT              ~360
  sand
                              (27)
                                                        East-central Effingham County
 Qwm                        OSL                  GAW32,               Table 2 in                    Star32 on          18.8 (17.9)
  near-shore marine/          (1)                 >335                  Markewich and                 figure 2C
  estuarine silty sand                                                  others (2013)
                                                      Effingham and Bulloch Counties
 PPs                         Fossil content     Late Pliocene          Counts and Donsky            Porters Landing,   Within a few meters
   Pleistocene-Pliocene                                                  (1963), Furlow (1969),       BUL-75            of the surface
   sands and gravels                                                     Huddlestun (1988),           and Stilson
                                                                         Markewich and others         localities on
                                                                         (1992)                       figure 2C
LSRA Shoreline Deposits and Shoreline Complexes—Stratigraphy and Age                          13

Table 2. Published and previously unpublished age data for late Pliocene to middle Pleistocene near‑shore marine and estuarine
deposits in the lower Savannah River area, southeastern Georgia.—Continued

                                                                                                                                  Ground surface and
                                  Dating method           Sample ID and
    Geologic unit and                                                                                           Figure with       (sample elevation)
                                  and (number of         age, in thousands              Data sourcec
    sample materiala                                                                                          sample locality     at sample locality,
                                    samples)b                 of years
                                                                                                                                      in metersd
                                                                        Bulloch County
 Nu                             10Be  soil-residence     >1000                  Markewich and Pavich          Brooklet auger      Core interval,
   marine and estuarine            time                                          (1996); table 4 in this        hole on             ~62 to ~40 meters
   sand and clay atop              (9)                                           report                         figure 2C
   Orangeburg Scarp
  aGeology   is from Lawton and others (1976). Unit abbreviations explained on figure 2B, C in this report.
  bDating   methods include OSL, optically stimulated luminescence; AAR, amino acid racemization; and 10BePRT, Beryllium‑10 paleosol residence time.
  cOSL and 10BePRT samples were collected by authors of this report. Analytical data for the OSL ages, samples GAW38, 1716A, and 1716B are in table 3.

Analytical data for 10BePRT ages are in tables 4–7.
  dSurface elevation determined from 1‑point/m2 light-detecting and ranging data made available by Chatham County Georgia (2011) and the Coastal Georgia

Elevation Project (2011). Sample depth determined by subtracting the sample depth from the surface elevation of the sample location.

Pliocene(?) or Older Deposits Atop and                                             variably shelly deposits that are compositionally similar and
                                                                                   difficult to differentiate occur seaward of the Scarp and have
Landward of the Orangeburg Scarp
                                                                                   been referred to and (or) mapped as the Duplin Formation,
      Lawton and others (1976) did not identify the Orangeburg                     the Raysor Formation, the Waccamaw(?) Formation, or
Scarp on their geologic map of Georgia. In the LSRA, the Scarp                     Pleistocene-Pliocene sands and gravels (Counts and Donsky,
is located in the approximate position of their contact between                    1963; Herrick, 1965; Furlow, 1969; Lawton and others, 1976;
the Neogene undifferentiated (Nu) and the Pleistocene-Pliocene                     Huddlestun, 1988). Huddlestun (1988) referred to variably
sands and gravels (PPs) map units (fig. 2C). Huddlestun (1988)                     shelly, somewhat clayey, phosphatic, sandy, calcarenitic
referred to deposits landward of the Scarp as the Miocene                          limestone and shelly quartz sand deposits in southeastern
Altamaha Formation. In the LSRA, there are no absolute age                         Georgia as the late Pliocene Raysor Formation. In this report,
data for these deposits. Markewich and Pavich (1996) calcu-                        the term Duplin/Raysor is used for deposits in the LSRA that
lated a 650‑ka minimum 10BePRT age for a paleosol developed                        fit Huddlestun’s description of the Raysor Formation, occur
in nearshore marine sand atop the Scarp (Brooklet auger hole on                    seaward of the Scarp, and are labelled as PPs in Lawton and
fig. 2C). They revised this age to a minimum of 700 ka to 1 Ma                     others (1976; fig. 2A, C). In the LSRA, these deposits occur at
for this report (10BePRT data in table 4). The presence of late                    or near the surface of a gently seaward-sloping plane (loca-
Pliocene deposits at the base of the Scarp indicates an age no                     tions of Porters Landing, Stilson, and BUL-75 on fig. 2C), in
younger than early late Pliocene for deposits landward and atop                    numerous cores (Counts and Donsky, 1963; Herrick, 1965;
the Scarp. Brooklet deposit stratigraphy and soil description are                  Furlow, 1969; Huddlestun, 1988 and included references;
included in figure 4.                                                              Markewich and others, 1992; Weems and Edwards, 2001),
                                                                                   and at the base of commercial borrow pits (fig. 6A, B in this
                                                                                   report). Fossil lists for Porters Landing and BUL-75 depos-
Late Pliocene and Early Pleistocene Deposits                                       its are included in Markewich and others (1992). Based on
                                                                                   lithology, stratigraphic position, and foraminifera assemblage,
      Identification and age assignments for late Pliocene and                     Huddlestun (1988; oral and written commun., 2010) identi-
early Pleistocene deposits (PPs) seaward of the Orangeburg                         fied Duplin/Raysor Formation deposits in the Chatham 1 core
Scarp in southeastern Georgia are based on lithostratigra-                         (CH‑1 on fig. 2A, D). Weems and Edwards (2001) used lithol-
phy, stratigraphic position, and fossil content. No numerical                      ogy, stratigraphic position, and dinoflagellate and nanofossil
age is available. Radiometric (87Sr/86Sr) ages are available                       assemblages to identify possible late Pliocene Duplin/Raysor
for deposits identified as the Duplin and the Waccamaw                             strata in the Effingham County core (E on fig. 2A). Duplin/
Formations at several localities seaward of the Scarp in                           Raysor deposits, identified by lithology and fossil content,
southeastern North Carolina. These 87Sr/86Sr ages indicate                         occur at the base of the 1716 and Shuman borrow pits in
that the Duplin Formation was deposited in the late Pliocene                       Chatham County, Georgia (locations on fig. 2B, stratigraphy in
and early Pleistocene (3.57 to 2.88 Ma and 2.8 to 2.0 Ma) and                      fig. 6A, B).
the Waccamaw Formation in the early Pleistocene (2.12 to                                 Huddlestun (1988) introduced and defined the
1.5 Ma) (Graybill and others, 2009; McGregor and others,                           Cypresshead Formation as a largely nonfossiliferous, variably
2011). In the LSRA, discontinuous calcareous, sandy, and                           thin to thick bedded, massive to cross bedded, bioturbated
Table 3. Previously unpublished quartz optically stimulated luminescence (OSL) ages and data for samples from Chatham and Effingham counties, southeastern Georgia.
Analyses by the U.S. Geological Survey Luminescence Laboratory, Denver, Colorado.
[%, weight percent; ppm, part per million; Gy/ka, gray per thousand years; Gy, gray; m, meter]

                                                                                                                                                                                          Surface
                                                                                                Total                                                                                                 Sample
                       Water                                                 Cosmic dose                   Equivalent                 OSL agee                                           elevation
                                      Kb            Ub            Thb                           dose                                                    North           West                         depth from
 Sample ID            contenta                                                additionsc                     dose           Nd       (thousands                                          at sample
                                     (%)          (ppm)          (ppm)                           rate                                                  latitudef      longitudef                      surface
                        (%)                                                    (Gy/ka)                        (Gy)                     of years)                                            siteg
                                                                                               (Gy/ka)                                                                                                  (m)
                                                                                                                                                                                             (m)
                                                                                                Fort McAllister, Qhm
 GAW41            4               0.24±        0.94±          2.74±         0.19±              0.73±       21.4±          22        28.8±            31.8894         81.2015                 5          0.89
                       (28)          0.03         0.04           0.09          0.02               0.03       0.96            (24)     1.7
                                                                                                Oatland Island, Qhm
 GAW40            20              0.22±        1.02±          2.88±         0.19±              0.77±       27.1±          27        35.1±            32.0491         81.0207                 2          0.85
                       (21)          0.02         0.05           0.15          0.02               0.03       1.31            (30)     2.2
                                                                                                 Isle of Hope, Qpam
 GAW20            25              0.66±        0.24 ±         0.75±         0.17±              0.73±       >160           30        >220             31.9594         81.0709                 5          1.7
                       (41)          0.02         0.03           0.07          0.01               0.02                       (30)
 GAW21            9               0.27±        0.84±0.07      2.64±         0.19±              0.71±       6.60±          24        9.3±             31.9596         81.0706                 5          1.1
                       (33)          0.02                        0.10          0.02               0.02        0.23           (25)      0.4
 GAW22            11              0.20±        0.80±0.05      2.60±         0.19±              0.64±       22.9±          30        35.7±            31.9677         81.0707                 4          0.84
                       (35)          0.01                        0.18          0.02               0.03       1.28            (30)     2.7
                                                                                               1716 borrow pit, Qpmi
 1716A            4               0.25±        0.77±0.04      3.66±0.20 0.15±                  0.77±       206 ±          17        267±             32.0475         81.1818                11          1.68
                       (23)          0.03                                  0.01                   0.03       20.0            (20)     28.0
 1716B            3               0.29±        0.72 ±         3.74          0.19±              0.75±       >220           15        >290             32.0542         81.1828                 4          2.29
                       (29)          0.04         0.07           ±0.14         0.02               0.03                       (15)
                                                                                      Southernmost Effingham County, Qpni
 GAW38    0.00                    0.11±        1.21±          3.52          0.19±              0.73±       64.9±          29        88.9±            32.2752         81.1892                16          0.91
  (near      (27)                    0.01         0.08           ±0.18         0.02               0.03       0.93            (30)     3.8
  Chimney
  Road
  core)
  aField   moisture in percent, with figures in parentheses indicating the complete sample saturation in percent. Ages calculated using approximately 50 percent of saturation values.
  bAnalyses    obtained using laboratory gamma spectrometry (low resolution sodium iodide detector).
  cCosmic    doses and attenuation with depth were calculated using the methods of Prescott and Hutton (1994).
  dNumber     of replicated equivalent dose (De) estimates used to calculate the mean. Figures in parentheses indicate total number of measurements made including failed runs with unusable data.
                                                                                                                                                                                                                  14   Synthesis of Geochronologic Research on Late Pliocene to Holocene Emergent Shorelines in Southeastern Georgia

  eDose    rate and age for fine-grained 0.105–0.09 millimeter quartz sand. Linear and exponential fit used on equivalent dose data, errors to one sigma.
  fDecimal    degrees, World Geodetic System 1984.
  gDetermined    from 1‑point/m2 lidar-based digital elevation model.
LSRA Shoreline Deposits and Shoreline Complexes—Stratigraphy and Age   15

Table 4. Beryllium‑10 concentration, horizon inventories, profile inventory, and minimum unit residence time, Brooklet auger hole,
Bulloch County, Georgia (lat 32.4664° N., long 81.6647° W.; 63.4 meters surface elevation; location, fig. 2C; stratigraphy, fig. 4).
[The Brooklet profile inventory = ∑ horizon inventories (104.2 10Be atoms/cm2 x 1010). The minimum unit residence time t = −(1/λ) x ln(1 − λN/q), where
N = horizon inventory (atoms/cm2), and q = deposition rate (1.3 x 10⁶ atoms/cm2/yr), and t is in thousands of years. The minimum residence time for the
Brooklet auger hole deposit = 1,024,000 years. cm, centimeter; cm2, square centimeter; cm3, cubic centimeter; g, gram]

                                                                                                                                                Horizon
     Stratigraphy and                                                    Sample        Sample-interval       Bulk             10Be
                                 Brooklet        Depth-interval                                                                               inventoryb
       depositional                                                      deptha          thickness          density     concentration
                                sample ID            (cm)                                                                                    (10Be atoms/
       environment                                                        (cm)              (cm)            (g/cm3)     (atoms/g x 108)
                                                                                                                                              cm2 x 1010)
 Nearshore-estuarine/                1               60–120                 90.0               60.0           1.7             19.2               19.6
   marine, clayey, very              2              120–334                227.0             214.0            1.7              4.2               15.3
   fine and fine quartz
                                     3              334–456                395.0             122.0            1.7              1.8                3.7
   sand with few quartz
   pebbles                           4              456–547                501.5               91.0           1.7              1.6                2.5
                                     5              547–760                653.5             213.0            1.7              3.2               11.6
 Nearshore-estuarine/                6              760–1,064              912.0             304.0            1.7              4.9               25.3
   marine, very well                 7            1,064–1,459            1,261.5             395.0            1.7              2.2               14.8
   sorted, very fine and
                                     8            1,459–1,733            1,596.0             274.0            1.7              1.5                7.0
   fine quartz sand
                                     9            1,733–1,885            1,809.0             152.0            1.7              1.7                4.4
  aSample   depth is measured from the ground surface.
  bHorizon   inventory = concentration (108 x atoms/g) x horizon thickness (cm) x bulk density (g/cm3).

to burrowed, fine to coarse grained to pebbly quartz sand                               • Wicomico Shoreline Complex (Qwi and Qwm;
that occurs stratigraphically above his Raysor Formation.                                 fig. 2A, C). Qwi deposits are expressed as a distinct
Huddlestun recognized the Cypresshead Formation as occur-                                 southwest to northeast trending barrier/beach-ridge at
ring throughout southeastern Georgia, including the LSRA.                                 24 to 28 m, which is somewhat lower than the 30 m
In the LSRA, Cypresshead Formation deposits are exposed in                                elevation, broad topographically flat Qwm deposits
railroad cuts (RR on fig. 2A), stream banks, and roadcuts, and                            that are present landward of the barrier/beach-ridge.
occur in numerous cores (Effingham 3, EF-3; Effingham 13,                                 The seaward toe of the Wicomico barrier/beach-ridge
EF-13; Chatham 14, CH‑14 on fig. 2A). Based on stratigraphic                              is at 20 m. The barrier/beach-ridge is separated from
position and foraminiferal content, Huddlestun (1988) consid-                             the younger Penholoway Shoreline Complex by a 2‑
ered the Cypresshead Formation to be late Pliocene to early                               to 4‑km-wide valley, except near the Savannah River
Pleistocene in age. In the LSRA, deposits of Huddlestun’s                                 where the complexes are adjacent.
Cypresshead Formation include the Pleistocene-Pliocene
sands and gravels (PPs) and the Wicomico (Qwi), Penholoway                              • Penholoway Shoreline Complex (Qpni and Qpnm;
(Qpn), and Talbot (Qt) Shoreline Complexes as delineated in                               fig. 2A, C). Qpni and Qpnm deposits form a series of
Lawton and others (1976). The stratigraphic relations between                             arcuate cuspate barrier/inter-barrier deposits with both
the Cypresshead Formation and the shoreline complexes in the                              facies occurring between 19 and 24 m. The seaward
LSRA are shown on figure 3.                                                               toe of the complex is between 10 and 12 m.

                                                                                        • Talbot Shoreline Complex (Qti and Qtm; fig. 2A–C).
Pleistocene Shoreline Complexes                                                           Qti and Qtm deposits are not well expressed in the
                                                                                          LSRA. As mapped, Qti deposits occur at two small
     The seven mapped Pleistocene shoreline complexes                                     localities with upper surfaces between 12 and 14 m.
delineated in Lawton and others (1976) stratigraphically                                  Qti deposits have a seaward toe between 6 and 8 m.
overlie and occur seaward of the deposits mapped as PPs.                                  Mapped Qtm deposits occur between 6 and 8 m in
Each shoreline complex has a barrier islands (i) and a marsh                              a southwest to northeast trending band landward of
and lagoonal (m) facies (fig. 2A–D). The following general-                               Qti deposits. Qtm deposits are either overlain or not
ized physiographic descriptions and elevations for Pleistocene                            distinguishable from the younger marsh and lagoonal
shoreline complexes in the LSRA vary somewhat from the                                    deposits of the Pamlico Shoreline Complex.
descriptions and elevations of these complexes/formations
                                                                                        • Pamlico Shoreline Complex (Qpmi and Qpmm;
by Hoyt and Hails (1967). Their descriptions were for
                                                                                          fig. 2A–C). Qpmi deposits are expressed as a series
these complexes/formations as they are manifest in all of
                                                                                          of relatively broad barrier flats between 6 to 9 m
southeastern Georgia.
You can also read