BESS-STAIR: a framework to estimate daily, 30 m, and all-weather crop evapotranspiration using multi-source satellite data for the US Corn Belt ...
←
→
Page content transcription
If your browser does not render page correctly, please read the page content below
Hydrol. Earth Syst. Sci., 24, 1251–1273, 2020
https://doi.org/10.5194/hess-24-1251-2020
© Author(s) 2020. This work is distributed under
the Creative Commons Attribution 4.0 License.

BESS-STAIR: a framework to estimate daily, 30 m, and all-weather
crop evapotranspiration using multi-source satellite data
for the US Corn Belt
Chongya Jiang1,2 , Kaiyu Guan1,2,3 , Ming Pan4 , Youngryel Ryu5 , Bin Peng1,3 , and Sibo Wang3
1 College of Agricultural, Consumer and Environmental Sciences, University of Illinois at Urbana
Champaign, Urbana, Illinois, USA
2 Center for Advanced Bioenergy and Bioproducts Innovation, University of Illinois at Urbana

Champaign, Urbana, Illinois, USA
3 National Center of Supercomputing Applications, University of Illinois at Urbana Champaign, Urbana, Illinois, USA
4 Department of Civil and Environmental Engineering, Princeton University, New Jersey, USA
5 Department of Landscape Architecture and Rural Systems Engineering, Seoul National University, Seoul, Republic of Korea

Correspondence: Chongya Jiang (chongya.jiang@email.com) and Kaiyu Guan (kaiyuguan@gmail.com)

Received: 19 July 2019 – Discussion started: 8 August 2019
Revised: 6 December 2019 – Accepted: 14 February 2020 – Published: 20 March 2020

Abstract. With increasing crop water demands and drought          square error RMSE = 0.93 mm d−1 and relative error RE =
threats, mapping and monitoring of cropland evapotranspira-       27.9 % when benchmarked with the flux measurements. In
tion (ET) at high spatial and temporal resolutions become in-     addition, BESS-STAIR ET estimations captured the spatial
creasingly critical for water management and sustainability.      patterns, seasonal cycles, and interannual dynamics well in
However, estimating ET from satellites for precise water re-      different sub-regions. The high performance of the BESS-
source management is still challenging due to the limitations     STAIR framework primarily resulted from (1) the implemen-
in both existing ET models and satellite input data. Specifi-     tation of coupled constraints on water, carbon, and energy in
cally, the process of ET is complex and difficult to model, and   BESS, (2) high-quality daily 30 m data from the STAIR fu-
existing satellite remote-sensing data could not fulfill high     sion algorithm, and (3) BESS’s applicability under all-sky
resolutions in both space and time. To address the above two      conditions. BESS-STAIR is calibration-free and has great
issues, this study presents a new high spatiotemporal reso-       potentials to be a reliable tool for water resource manage-
lution ET mapping framework, i.e., BESS-STAIR, which in-          ment and precision agriculture applications for the US Corn
tegrates a satellite-driven water–carbon–energy coupled bio-      Belt and even worldwide given the global coverage of its in-
physical model, BESS (Breathing Earth System Simulator),          put data.
with a generic and fully automated fusion algorithm, STAIR
(SaTallite dAta IntegRation). In this framework, STAIR pro-
vides daily 30 m multispectral surface reflectance by fusing
Landsat and MODIS satellite data to derive a fine-resolution      1   Introduction
leaf area index and visible/near-infrared albedo, all of which,
along with coarse-resolution meteorological and CO2 data,         Accurate field-level management of water resources urgently
are used to drive BESS to estimate gap-free 30 m resolution       demands reliable estimations of evapotranspiration (ET) at
daily ET. We applied BESS-STAIR from 2000 through 2017            high spatial and temporal resolutions. ET is the sum of water
in six areas across the US Corn Belt and validated BESS-          loss from the soil surface through evaporation and that from
STAIR ET estimations using flux-tower measurements over           plant components through leaf transpiration and evaporation,
12 sites (85 site years). Results showed that BESS-STAIR          and ET at cropland is usually considered for crop water use
daily ET achieved an overall R 2 = 0.75, with root mean           (Allen et al., 1998). ET consumes up to 90 % of total wa-

Published by Copernicus Publications on behalf of the European Geosciences Union.
1252                                                  C. Jiang et al.: BESS-STAIR: a daily, 30 m ET estimation framework

ter inputs (precipitation plus irrigation) in agro-ecosystems     As the energy cycle, carbon cycle, and water cycle are jointly
in the western and Midwestern United States (Irmak et al.,        modeled and mutually constrained in BESS, it has produced
2012). In the US Corn Belt, where more than 85 % of corn          a series of high-quality global long-term (2000–2017) prod-
and soybean is produced in the US (Grassini et al., 2015),        ucts, including the 5 km resolution global radiation (Rg ),
increasing vapor pressure deficit (VPD) and drought sensi-        photosynthetically active radiation (PAR) and diffuse PAR
tivity have been recognized as severe threats to future crop      products (Ryu et al., 2018), and 1 km resolution gross pri-
security (Lobell et al., 2014; Ort and Long, 2014). The vul-      mary productivity (GPP) and ET products (Jiang and Ryu,
nerability to drought in this region is further exacerbated by    2016), which enables tracking of crop growth and yields too
elevated rates of grass-to-crop conversion and expansion of       (Huang et al., 2018). In particular, the 1 km resolution BESS
irrigated areas (Brown and Pervez, 2014; Wright and Wim-          ET product is able to capture the total amount and spatial
berly, 2013). Furthermore, precision water resource manage-       and temporal variations in arid/semi-arid areas like Australia
ment requires the capacity to account for spatial heterogene-     (Whitley et al., 2016, 2017), California (Baldocchi et al.,
ity and to guide real-time decision-making (GAO, 2019). Ac-       2019), and northwestern China (Wei et al., 2019). The fi-
cordingly, reliable tools are urgently needed to estimate, map,   delity of the coarse-resolution BESS ET product suggests its
and monitor the total amount and spatial and temporal varia-      potential at fine resolutions.
tions of cropland ET.                                                The other critical requirement for accurate estimations of
   One critical requirement for the accurate estimations of ET    ET at high spatiotemporal resolutions is satellite input data
at high spatiotemporal resolutions is reliable and advanced       at high resolutions in both space and time. This is challeng-
satellite-based models. This is challenging because the pro-      ing because existing satellite missions cannot satisfy the two
cess of ET is complex and difficult to model. ET results from     conditions simultaneously. Data fusion techniques, which
balance between atmospheric water demand and soil water           take multi-sensor data to generate fusion data with high res-
supply, and it is also regulated by plants through canopy de-     olutions in both space and time, provide a possible and scal-
velopment and stomatal behaviors in order to optimize their       able solution. Several such algorithms have been developed
water, carbon, and energy use strategies (Katul et al., 2012;     over the past decade (Gao et al., 2006; Houborg and Mccabe,
Wang and Dickinson, 2012). A large number of satellite-           2018; Zhu et al., 2010), and they have been successful for
based ET estimation methods have been developed based             localized applications (Gao et al., 2017; Gómez et al., 2016;
on different theories and techniques. In general, they can be     Wu et al., 2015). Notably, energy balance and thermal-based
grouped into many categories: statistical or machine-learning     ET models such as ALEXI/DisALEXI and SEBS have been
methods (Jung et al., 2010; Lu and Zhuang, 2010), water bal-      combined with the fusion algorithms such as STARFM and
ance methods (Pan et al., 2012; Wan et al., 2015), energy         ESTARFM to generate daily 30 m ET estimations with fa-
balance methods (Anderson et al., 1997; Su, 2002), triangu-       vorable performance at several sites (Anderson et al., 2018;
lar or trapezoid space methods (Jiang and Islam, 1999; Li         Cammalleri et al., 2013; Li et al., 2017; Ma et al., 2018).
et al., 2009), Priestley–Taylor methods (Fisher et al., 2008;        Here we propose and present a new ET estimation frame-
Miralles et al., 2011), and Penman–Monteith methods (Mu           work that combines BESS with a novel fusion algorithm, Sa-
et al., 2011; Yebra et al., 2013). Kalma et al. (2008), Li et     Tallite dAta IntegRation (STAIR) (Luo et al., 2018), for accu-
al. (2009), and K. Zhang et al. (2016) have provided detailed     rate ET estimation at high resolution in both time and space.
reviews of the pros and cons of different remote-sensing ap-      BESS has demonstrated its high performance in estimating
proaches.                                                         ET at medium to coarse resolutions, but the major obstacle
   Given the complexity of the ET process, we argue that a        of moving BESS’s ET estimation to finer resolutions is the
reliable ET model should include both necessary biophysi-         lack of key vegetation status variables at higher spatial reso-
cal processes and high-quality multi-source observations to       lutions, including leaf area index (LAI) and visible and near-
constrain ET estimations (Loew et al., 2016). While remote-       infrared albedo (αVIS and αNIR ). In BESS, this surface infor-
sensing-based approaches tend to focus on constraints from        mation is critical for resolving spatial heterogeneity, while
various satellite data, land-surface models (LSMs) are profi-     environmental information such as radiation, temperature,
cient at including processes that account for interactions be-    humidity, and CO2 concentration is relatively homogeneous.
tween environment and plant structure and functions. Given        To cope with the absence of high spatiotemporal resolution
the gaps between remote sensing and LSMs, a distinct ET           vegetation data, we propose coupling STAIR with BESS.
model, the Breathing Earth System Simulator (BESS), was           STAIR is a generic and fully automated fusion algorithm to
developed (Jiang and Ryu, 2016; Ryu et al., 2011). Different      generate a cloud-/gap-free surface reflectance product at high
from the above-mentioned remote-sensing models, BESS is           spatiotemporal resolution (Luo et al., 2018). Instead of man-
a biophysical model, which adopts modules commonly im-            ually selecting image pairs adopted by most other data fusion
plemented in LSMs but uses various satellite remote-sensing       algorithms, STAIR automatically takes full advantage of time
data as direct inputs. Specifically, BESS is a two-leaf water–    series of daily coarse-resolution images and fine-resolution
carbon–energy coupled model driven by environmental and           but less frequent images. Moreover, STAIR’s high efficiency
vegetation variables derived from multi-source satellite data.    in computation allows scalability for large-scale productions,

Hydrol. Earth Syst. Sci., 24, 1251–1273, 2020                                  www.hydrol-earth-syst-sci.net/24/1251/2020/
C. Jiang et al.: BESS-STAIR: a daily, 30 m ET estimation framework                                                         1253

which enable this new framework to deliver daily 30 m ET at      1991, 1992), the Ball–Berry model (Ball et al., 1987), and
regional and decadal scales.                                     the quadratic form of the Penman–Monteith equation (Paw
   The objective of this study is to address a fundamental       U and Gao, 1988) are used for the simulation of carbon
issue in agro-ecological science and applications: lack of       assimilation, stomatal conductance, and energy balance, re-
high spatiotemporal gap-free ET data for decision-making.        spectively. This carbon–water integrated module employs
We implemented a new ET estimation framework, BESS-              an iterative procedure to solve intercellular CO2 concentra-
STAIR, and tested it in six study areas across the US Corn       tion, stomatal conductance, and leaf temperature for a sun-
Belt from 2000 to 2017. This is the first attempt to cou-        lit/shaded canopy. Instantaneous sunlit/shade GPP and sun-
ple a satellite-driven biophysical model with a data fusion      lit/shade/soil ET and net radiation at Terra and Aqua overpass
technique to provide daily 30 m resolution ET estimations at     times are simultaneously estimated, followed by a temporal
regional and decadal scales. While existing frameworks re-       upscaling procedure to derive daily GPP and ET using semi-
trieve clear-sky ET from satellite-observed land-surface tem-    empirical cosine functions (Ryu et al., 2012). The Priestley–
perature (LST) and fill ET gaps for cloudy-sky days, BESS-       Taylor equation is used to compute daily potential ET (PET)
STAIR simulates all-sky ET and LST as a result of crop           based on estimated daily net radiation and meteorological in-
biophysical properties. This way has more referential sig-       puts.
nificance for crop modeling studies and has the potential to         A unique feature of BESS is that it takes full advan-
forge a new path in agro-ecological science and applications.    tage of atmospheric and land products derived from multi-
We conducted a comprehensive evaluation of the BESS-             source satellite data. By using MOD/MYD 04 aerosol prod-
STAIR ET estimations with regards to the overall perfor-         ucts (Sayer et al., 2014), MOD/MYD 06 cloud products
mance, spatial patterns, seasonal cycles, and interannual dy-    (Baum et al., 2012), MOD/MYD 07 atmospheric profile
namics, benchmarked on the ET observations from 12 eddy-         products (Seemann et al., 2003), along with gap-free at-
covariance flux towers across the US Corn Belt. The paper        mospheric data provided by MERRA-2 reanalysis prod-
also discusses the performance, advantages, limitations, and     ucts (Gelaro et al., 2017), BESS calculates direct/diffuse
potential improvements of the BESS-STAIR ET framework.           visible/near-infrared radiation components at 0.05◦ resolu-
                                                                 tion. By coupling CO2 concentration derived from SCIA-
                                                                 MACHY and GOSAT satellite data (Dils et al., 2014) with
2     Materials and methods                                      those from OCO-2 satellite data (Hammerling et al., 2012)
                                                                 as well as NOAA long-term field observations (https://www.
BESS-STAIR estimates cropland ET at 30 m resolution at a         esrl.noaa.gov/gmd/ccgg/trends/, last access: 11 March 2020),
daily interval (Fig. 1). BESS is driven by environmental vari-   BESS derives long-term continuous monthly CO2 concen-
ables (radiation, temperature, humidity, and CO2 concentra-      tration maps. Finally, in this study BESS uses air tempera-
tion), plant structural variables (LAI, αVIS , and αNIR ), and   ture and dew point temperature provided by ERA5 reanal-
plant functional variables (peak maximum carboxylation rate      ysis products at 0.1◦ resolution (Hersbach, 2016). In addi-
at 25 ◦ C (peak Vcmax25 ) and Ball–Barry coefficients, for C3    tion to these environmental variables, BESS also highly re-
and C4 plants, respectively). Among these key inputs, LAI,       lies on vegetation structural and functional variables. By us-
αVIS , and αNIR characterize crop canopy structure, which are    ing a satellite-derived LAI, αVIS , and αNIR , BESS quantifies
usually very heterogeneous. In the global BESS ET prod-          the absorption of ultraviolet/visible/near-infrared radiation
uct (Jiang and Ryu, 2016), these vegetation variables are de-    by sunlit/shaded canopy through a canopy radiative transfer
rived from MODIS satellite data at 1 km resolution, while in     model. This model also upscales leaf level (Vcmax25 ) to sun-
BESS-STAIR they are derived from 30 m resolution surface         lit/shaded canopy, which is used in the Farquhar photosyn-
reflectance fused from high spatial resolution Landsat data      thesis model. Vcmax25 is a parameter depending on the plant
and high temporal resolution MODIS data by STAIR.                functional type (Bonan et al., 2011; Kattge et al., 2009), and
                                                                 its seasonal variation is empirically parameterized by the LAI
2.1    The ET estimation model: BESS                             (Ryu et al., 2011).

BESS is a sophisticated satellite-driven water–carbon–           2.2   The data fusion algorithm: STAIR
energy coupled biophysical model designed to continu-
ously monitor and map water and carbon fluxes (Jiang             STAIR is a generic and fully automated method for fusing
and Ryu, 2016; Ryu et al., 2011). It is a simplified land-       multi-spectral satellite data to generate high spatiotemporal
surface model, including an atmosphere radiative transfer        resolution and cloud-/gap-free data (Luo et al., 2018). It fully
module (Kobayashi and Iwabuchi, 2008; Ryu et al., 2018),         leverages the complementary strengths in the high tempo-
a two-leaf canopy radiative transfer module (De Pury and         ral resolution MCD43A4 nadir reflectance (daily but 500 m
Farquhar, 1997), and an integrated carbon assimilation–          resolution) (Schaaf et al., 2002) and the high spatial resolu-
stomatal-conductance–energy balance module. Specifically,        tion Landsat L2 nadir reflectance (30 m resolution but 16 d
the Farquhar model for C3 and C4 plants (Collatz et al.,         revisiting frequency) (Masek et al., 2006) time-series data.

www.hydrol-earth-syst-sci.net/24/1251/2020/                                   Hydrol. Earth Syst. Sci., 24, 1251–1273, 2020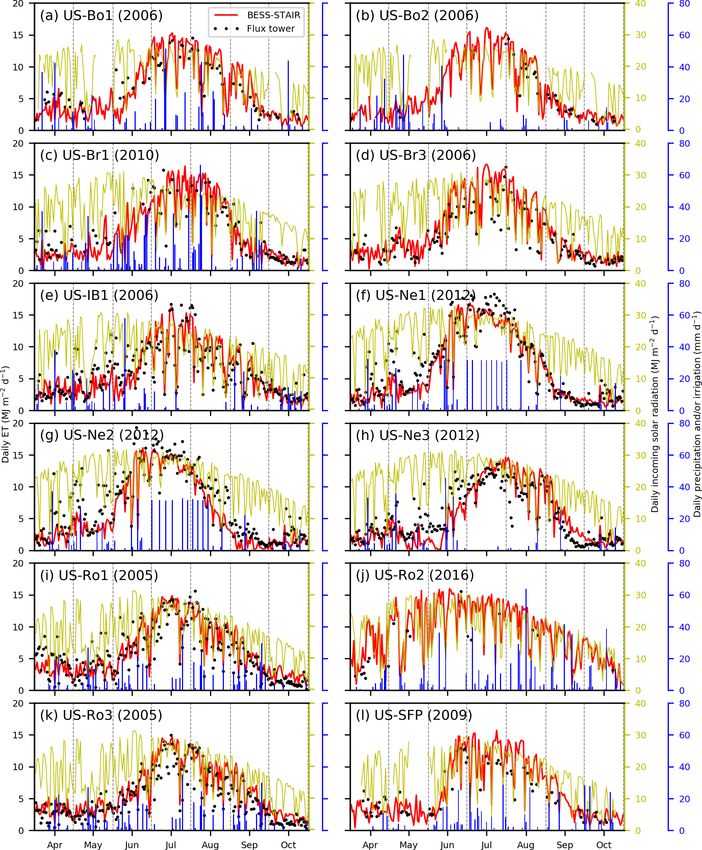
1254                                                    C. Jiang et al.: BESS-STAIR: a daily, 30 m ET estimation framework

Figure 1. The BESS-STAIR framework. The BESS ET estimation model and the STAIR data fusion algorithm are highlighted in green
boxes. Blue boxes are satellite data, yellow boxes are ancillary data, and red boxes are key inputs to BESS. The output of BESS-STAIR is
the 30 m resolution daily ET highlighted in a white box.

STAIR first imputes the missing pixels using an adaptive-             derived from temporal interpolation so that the spatial rela-
average correction procedure and then employs a local inter-          tionship between the gap-filled pixel and its neighborhood
polation model to capture finer spatial information provided          pixels within the same segment is consistent with those in
by Landsat data, followed by a time-series refinement step            clear-sky observations.
that incorporates the temporal patterns provided by MODIS                The STAIR fusion algorithm fully exploits the spatial and
data. This strategy allows higher efficiency in missing-data          temporal information in the time series of gap-filled MODIS
interpolation as well as greater robustness against concur-           and Landsat images throughout the growing season (April–
rently missed MODIS and Landsat observation, which is a               October). A nearest-neighbor sampling is conducted for all
common situation during continuous cloudy/snowy days.                 the MODIS images to achieve the same image size, pixel
   The algorithm starts from the imputation of the missing            resolution, and projected coordinate system with Landsat im-
pixels (due to cloud cover or Landsat 7 Scan Line Corrector           ages. A difference image is calculated for each pair of Land-
failure) in satellite images. For MODIS images, a Savitzky–           sat and resampled MODIS images, and a linear interpolation
Golay filter is first applied to reconstruct continuous time se-      is applied to reconstruct the difference image for any given
ries. For Landsat images, a two-step approach is employed             date when no Landsat image is available. Such a difference
using both temporal and spatial information from clear-sky            image is used to correct the resampled MODIS image on that
observations. First, a temporal interpolation through a linear        date and to generate a fused Landsat image. In this man-
regression is applied as the initial gap-filling, based on the        ner, the fused image captures the most informative spatial
whole time series of images throughout a year. Second, an             information provided by the high spatial resolution Landsat
adaptive-average correction procedure is applied to remove            data and incorporates the temporal patterns provided by the
inharmonic spatial patterns between gap-filled and original           high temporal resolution MODIS data without any user in-
data. The target image is partitioned into multiple segments,         terference. The fusion algorithm is applied to the six Land-
each of which contains one type of homogeneous pixel. The             sat bands: blue, green, red, near-infrared (nir), shortwave in-
relative difference between a gap pixel and neighborhood              frared 1 (swir1), and shortwave infrared-2 (swir2).
pixels of it within the same segment is calculated using clear-
sky observations acquired at several dates close to the target        2.3   Derivation of BESS inputs from STAIR data
image acquisition date. Based on the assumption that the rel-
ative difference remains roughly the same across different            At a global scale, LAI, αVIS , and αNIR can be obtained from
dates in a short time period (e.g., < 2–3 weeks), such a dif-         MODIS and other satellite data, but for field-scale agricul-
ference is used to correct the filled values of the gap pixel         tural applications high spatial resolution data are needed to
                                                                      account for the spatial heterogeneity between fields or within

Hydrol. Earth Syst. Sci., 24, 1251–1273, 2020                                        www.hydrol-earth-syst-sci.net/24/1251/2020/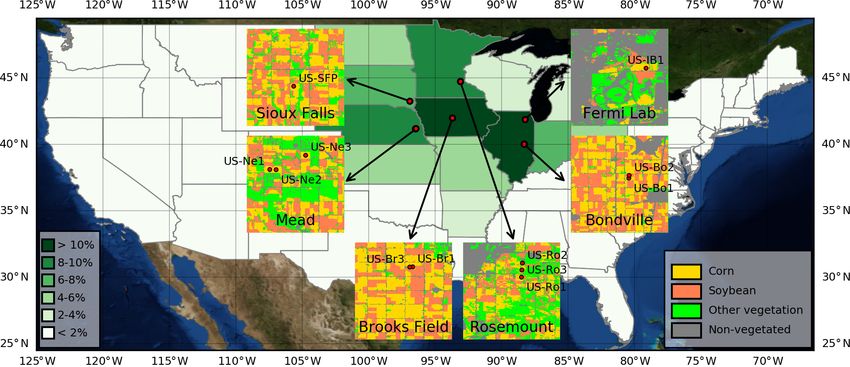
C. Jiang et al.: BESS-STAIR: a daily, 30 m ET estimation framework                                                          1255

a field. At this point, we employed two approaches to esti-      on the generation of a simulated canopy reflectance database
mate 30 m resolution daily LAI from STAIR fused surface          for a number of plausible combinations of model parame-
reflectance data: an empirical approach based on a linear re-    ter value ranges and the identification of parameter values
lationship with vegetation indices (VIs) and a mechanistic       in the database leading to the best agreement between sim-
approach based on inversion of a canopy radiative transfer       ulated and observed canopy reflectance. LUT is particularly
model (RTM).                                                     suitable for big data processing (Myneni et al., 2002) and is
   First, we estimated LAI using the empirical approach, be-     therefore used in this study.
cause of availability of field LAI measurements in the study        We established a database by running PROSAIL with sam-
area. We calculated four VIs calculated from STAIR-derived       pled parameter values listed in Table 2. For computation ef-
spectral reflectance: Wide Dynamic Range Vegetation Index        ficiency, we only sampled varied values for four parameters,
(WDRVI), Green Wide Dynamic Range Vegetation Index               while others were fixed. These four free parameters, includ-
(GWDRVI), Enhanced Vegetation Index (EVI), and Land              ing LAI (10 values), fraction of vegetation cover (6 values),
Surface Water Index (LSWI) for corn and soybean, respec-         soil brightness (5 values), and chlorophyll content (4 values),
tively (Eqs. 1–3). These four VIs were chosen because they       were chosen because they have been identified as the most
utilized information from different band combinations.           sensitive parameters in canopy radiative transfer models (Ba-
                                                                 cour et al., 2002; Mousivand et al., 2014). Leaf inclination
           0.1ρN − ρR                                            distribution function is also sensitive, but we set fixed types
WDRVI =               ,                                    (1)
           0.1ρN + ρR                                            “spherical”, “planophile”, and “plagiophile” for corn, soy-
             0.1ρN − ρG                                          bean, and other biomes, respectively (Nguy-Robertson et al.,
GWDRVI =                ,                                  (2)
             0.1ρN + ρG                                          2012; Pisek et al., 2013). The fixed values of other parame-
                 ρN − ρR                                         ters were set according to the literature (Baret et al., 2007;
EVI = 2.5                      ,                           (3)
          ρN + 6ρR − 7.5ρB + 1                                   Feret et al., 2008; Jacquemoud et al., 2009). Solar zenith an-
        ρN − ρSW1                                                gle at satellite overpass time can be calculated, so we did not
LSWI =             ,                                       (4)   set it as a free parameter. Instead, we built a set of databases
        ρN + ρSW2
                                                                 with solar zenith angle values (◦ ) of 20, 25, 30, 35, 40, 45,
where ρB , ρG , ρR , ρN , and ρSW1 refer to the surface re-      and 50, respectively, representing the range during the grow-
flectance at blue, green, red, near-infrared, and the first      ing season in the study area. In PROSAIL, specific absorp-
shortwave-infrared band, respectively. Subsequently, we          tion coefficients and the refractive index of leaf material are
used field-measured LAI data collected using the destructive     pre-measured hyperspectral data from 400 to 2500 nm with
method at Mead, Nebraska, from 2001 through 2007 to build        a 1 nm interval (Feret et al., 2008); we averaged them over
VI–LAI relationships (Gitelson et al., 2007). For each of the    wavelengths to match Landsat 7 bands and assumed differ-
four VIs we build a linear regression between time series of     ences of spectral ranges between Landsat 5, Landsat 7, and
VI and LAI for corn, soybean, and the combination of corn        Landsat 8 have a marginal influence on LAI retrieval. We did
and soybean, respectively (Table 1). At this point, the equa-    not use the default soil spectrum in PROSAIL, but spatiotem-
tion derived from the combination of corn and soybean was        porally averaged all cropland pixels’ spectral reflectance in
used for vegetation cover other than corn and soybean. Al-       April when no crop is planted across the study area to derive
though this might cause bias for forest LAI estimation, it is    representative soil spectral reflectance.
not a concern in this study as we focused on crop ET only. We       To retrieve LAI, we compared STAIR-derived surface re-
applied linear regressions to four VIs separately and averaged   flectance (RSTAIR ) with records in the canopy reflectance
the four derived LAIs as the final LAI estimation, with the      database simulated by PROSAIL (RPROSAIL ) pixel by pixel.
expectation that such an average would reduce uncertainty        We used root mean square error (RMSE) as the cost function
caused by an individual VI–LAI relationship.                     which was defined as
   Second, we inversed the PROSAIL RTM using a look-up                       r
                                                                                1 Xl
table (LUT) method. PROSAIL is an efficient and widely           RMSE =                 [R
                                                                                     λ=1 STAIR
                                                                                                 (λ) − RPROSAIL (λ)]2 ,       (5)
used model to simulate canopy reflectance given a set of sun-                   l
object-view geometry, canopy structure, leaf biochemical,        where λ = 1, 2, . . . l indicates band number and l = 6 for
and soil optical parameters (Jacquemoud et al., 2009). It is     STAIR. Ideally, the simulated reflectance in the database
a combination of the PROSPECT leaf hyperspectral proper-         yielding the smallest RMSE can be considered the best sim-
ties model (Jacquemoud et al., 1996; Jacquemoud and Baret,       ulation, and the corresponding LAI value can be considered
1990) and the SAIL canopy bidirectional reflectance model        the solution for the satellite pixel. However, in reality the so-
(Verhoef, 1984, 1985). PROSAIL is particularly suitable for      lution might not be unique, because different parameter com-
grasslands and croplands (Darvishzadeh et al., 2008; Xu et       binations could derive similar reflectance simulations, and
al., 2019) and is therefore used in this study. LUT is a ro-     errors in both satellite and model could further amplify this
bust and easy method to retrieve model parameters from ob-       problem (Verrelst et al., 2018). For this reason, we chose the
served canopy reflectance (Verrelst et al., 2018). It is based   top 10 % small RMSE simulations in the database and con-

www.hydrol-earth-syst-sci.net/24/1251/2020/                                   Hydrol. Earth Syst. Sci., 24, 1251–1273, 2020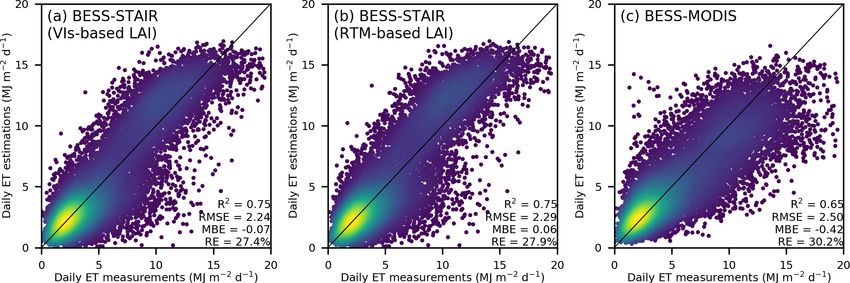
1256                                                            C. Jiang et al.: BESS-STAIR: a daily, 30 m ET estimation framework

Table 1. Linear equations for LAI (y) as a function of VI (x) for corn, soybean, and the combination of corn and soybean.

                              VI            Corn                             Soybean                Combination
                              WDRVI         y = 6.288x + 4.631               y = 4.584x + 3.432     y = 5.745x + 4.288
                              GWDRVI        y = 8.964x + 5.875               y = 6.384x + 4.275     y = 8.110x + 5.395
                              EVI           y = 10.569x − 2.165              y = 8.116x − 1.936     y = 9.665x − 1.993
                              LSWI          y = 9.156x + 1.070               y = 7.553x + 0.888     y = 8.944x + 0.982

Table 2. Parameter values needed to establish the canopy re-                     2.4   Evaluation of BESS-STAIR ET
flectance database by PROSAIL.

 Parameters                               Values                                 The BESS-STAIR ET estimations were evaluated against
                                                                                 flux-tower ET measurements in the US Corn Belt. The US
 LAI (m2 m−2 )                            0, 0.5, 1, 2, 3, 4, 5, 6, 7, 8
                                                                                 Corn Belt (Fig. 2) generally refers to a region in the Mid-
 Fraction of vegetation cover (m2 m−2 )   0, 0.2, 0.4, 0.6, 0.8, 1
 Soil brightness (arbitrary unit)         0.01, 0.4, 0.8, 1.2, 1.6               western United States that has dominated corn and soybean
 Chlorophyll content (µg cm−2 )           0, 20, 40, 60                          production in the United States (Green et al., 2018), which
 Leaf inclination distribution function   spherical for corn,                    currently produces about 45 % and 30 % of global corn and
                                          planophile for soybean,                soybean, respectively (USDA, 2014). The region is charac-
                                          plagiophile for others                 terized by relatively flat land, deep fertile soils, and high soil
 Structure coefficient (arbitrary unit)   1.75
                                                                                 organic matter (Green et al., 2018). Most parts of the US
 Carotenoid content (µg cm−2 )            0
 Equivalent water thickness (cm)          0.015                                  Corn Belt have favorable growing conditions of temperature
 Leaf mass per area (g cm−2 )             0.0075                                 and rainfall. The majority of the croplands in the US Corn
 Brown pigment content (arbitrary unit)   0                                      Belt are rainfed, with a small portion in the western part re-
 Hotspot parameter (arbitrary unit)       0.1                                    lying on irrigation.
 View zenith angle (◦ )                   0                                         A total of 12 cropland sites scattered in six areas across the
 Azimuth angle (◦ )                       0
                                                                                 US Corn Belt are registered in the AmeriFlux or FLUXNET
                                                                                 networks with publicly available ET data (Fig. 2 and Ta-
                                                                                 ble 3). These sites include both corn only and corn–soybean
sidered the average of the corresponding LAI values to be the                    rotation sites and both rainfed and irrigated sites, cover-
final solution. The threshold of 10 % was decided by evalu-                      ing typical cropping patterns in the US Corn Belt. All of
ating LUT-retrieved LAI against field-measured LAI at three                      them were used in this study to ensure the representative-
Mead sites, and it was within a reasonable range from the top                    ness of the validation for the precision agriculture appli-
50 records to the top 20 % of records suggested by previous                      cations in this region. For six sites, US-Bo1 (Meyers and
studies (Duan et al., 2014; Weiss et al., 2000).                                 Hollinger, 2004), US-Bo2 (Bernacchi et al., 2005), US-Br1
   We further employed semi-empirical equations to calcu-                        (Prueger et al., 2003), US-Br3 (Prueger et al., 2003), US-
late αVIS and αNIR (Liang, 2001) from STAIR-derived spec-                        Ro2 (Turner et al., 2016), and US-SFP (Wilson and Mey-
tral reflectance in six Landsat bands:                                           ers, 2007), level 2 half-hourly data were downloaded from
                                                                                 the AmeriFlux website (http://ameriflux.lbl.gov/, last access:
αVIS = 0.443ρB + 0.317ρG + 0.240ρR ,                                   (6)       11 March 2020). For three sites, US-IB1 (Matamala et al.,
αNIR = 0.693ρN + 0.212ρSW1 + 0.116ρSW2 − 0.003,                        (7)       2008), US-Ro1 (Griffis et al., 2010), and US-Ro3 (Griffis
                                                                                 et al., 2010), standardized gap-filled level 4 daily mean
where ρSW2 is the surface reflectance at the second                              data were downloaded from the Carbon Dioxide Information
shortwave-infrared band. For C3 crops/grasses, forests, and                      Analysis Center data archive website (https://mirrors.asun.
C4 crops/grasses, peak Vcmax25 values were set at 180, 60,                       co/climate-mirror/cdiac.ornl.gov/pub/ameriflux/, last access:
and 45, respectively (Kattge et al., 2009; Zhang et al., 2014).                  11 March 2020). For the other three sites (Suyker et al.,
Ball–Berry slope and intercept are another two important pa-                     2004), US-Ne1, US-Ne2, and US-Ne3, standardized high-
rameters used in the stomatal conductance model, and their                       quality gap-filled daily mean data were downloaded from
values were set to 13.3 and 0.02 for C3 crops/grasses, 9.5 and                   the FLUXNET2015 website (http://fluxnet.fluxdata.org/data/
0.005 for forests, and 5.8 and 0.04 for C4 crops, respectively                   fluxnet2015-dataset/, last access: 11 March 2020).
(Miner et al., 2017). Distributions of C3 and C4 crops were                         By comparing with eddy-covariance ET, we evaluated
obtained from Crop Data Layer (CDL) data (Boryan et al.,                         three ET estimations: BESS-STAIR with VI-based LAI,
2011).                                                                           BESS-STAIR with RTM-based LAI, and BESS-STAIR
                                                                                 with MODIS LAI. MODIS LAI refers to the MCD15A3H
                                                                                 500 m resolution 4 d composite LAI product downloaded

Hydrol. Earth Syst. Sci., 24, 1251–1273, 2020                                                     www.hydrol-earth-syst-sci.net/24/1251/2020/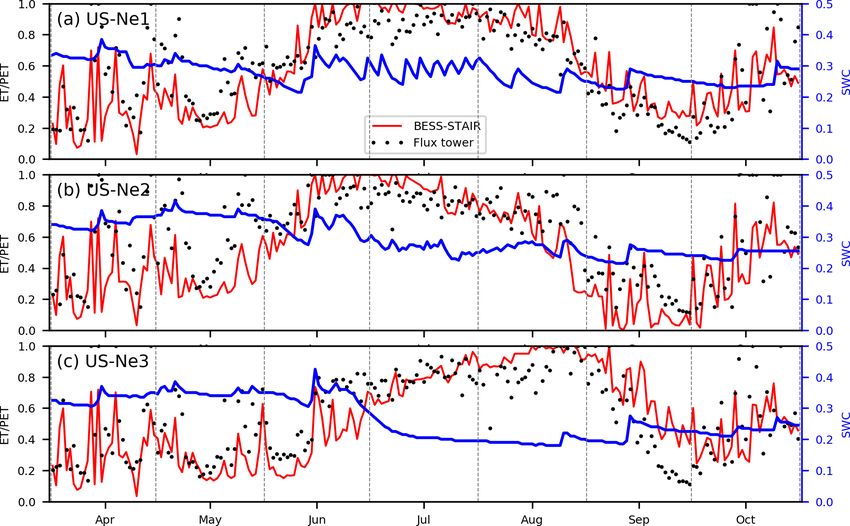
C. Jiang et al.: BESS-STAIR: a daily, 30 m ET estimation framework                                                                 1257

Figure 2. Study areas. Red dots indicate 12 flux-tower sites scattered in six areas across the US Corn Belt. The background map indicates
the percent each state contributes to the total national corn and soybean plantation area (USDA, 2018). The background image is a © NASA
Blue Marble image.

Table 3. Information of 12 flux-tower sites used for validation.

    ID     Site       Location             Latitude    Longitude   Plant                  Irrigation   Years        Source
    1      US-Bo1     Bondville, IL        40.0062     −88.2904    corn/soybean           N            2000–2008    AmeriFlux L2
    2      US-Bo2     Bondville, IL        40.0090     −88.2900    corn/soybean           N            2004–2006    AmeriFlux L2
    3      US-Br1     Brooks Field, IA     41.9749     −93.6906    corn/soybean           N            2005–2011    AmeriFlux L2
    4      US-Br3     Brooks Field, IA     41.9747     −93.6936    corn/soybean           N            2005–2011    AmeriFlux L2
    5      US-IB1     Fermilab, IL         41.8593     −88.2227    corn/soybean           N            2005–2007    AmeriFlux L4
    6      US-Ne1     Mead, NE             41.1651     −96.4766    corn                   Y            2001–2012    FLUXNET2015
    7      US-Ne2     Mead, NE             41.1649     −96.4701    corn/soybean           Y            2001–2012    FLUXNET2015
    8      US-Ne3     Mead, NE             41.1797     −96.4397    corn/soybean           N            2001–2012    FLUXNET2015
    9      US-Ro1     Rosemount, MN        44.7143     −93.0898    corn/soybean           N            2004–2006    AmeriFlux L4
    10     US-Ro2     Rosemount, MN        44.7288     −93.0888    corn/soybean/clover    N            2008–2016    AmeriFlux L2
    11     US-Ro3     Rosemount, MN        44.7217     −93.0893    corn/soybean           N            2004–2006    AmeriFlux L4
    12     US-SFP     Sioux Falls, SD      43.2408     −96.9020    corn                   N            2007–2009    AmeriFlux L2

from https://lpdaac.usgs.gov/tools/data-pool/ (last access:            3     Results
11 March 2020). Flux-tower measurements usually have an
irregular and dynamic footprint at scales from 100 m to 1 km           3.1    Performance of STAIR LAI
(Fu et al., 2014), but for simplicity, only 30 m resolution
BESS-STAIR pixels containing the flux tower were used for              LAI is the key input of BESS. The accuracy of high-
the direct comparison. With regard to flux towers, measure-            resolution LAI estimations determines the validity of high-
ment data were directly used without energy closure adjust-            resolution ET estimations. We evaluated VI-based LAI and
ment. For AmeriFlux level 2 data, half-hourly data were aver-          RTM-based LAI estimations derived from 30 m resolution
aged to daily ET only if no gaps exist during the day to avoid         STAIR fused surface reflectance data against field mea-
sampling bias caused by missing data. For AmeriFlux level 4            surements. We also compared them with the 500 m resolu-
data and FLUXNET2015 data, gap-filled daily ET was used                tion MODIS LAI. Overall, the STAIR-derived LAI agrees
directly.                                                              well with the measured LAI, with R 2 > 0.85, RMSE < 0.8,
                                                                       and mean bias error (MBE) ≈ 0 (Fig. 3). The RTM-based
                                                                       method, which is calibration-free, yields the same perfor-
                                                                       mance as the VI-based method, which requires substantial
                                                                       field measurements to build empirical relationships. Misclas-
                                                                       sification of CDL data between corn and soybean is an im-
                                                                       portant uncertainty source since both methods rely on crop

www.hydrol-earth-syst-sci.net/24/1251/2020/                                            Hydrol. Earth Syst. Sci., 24, 1251–1273, 2020
1258                                                   C. Jiang et al.: BESS-STAIR: a daily, 30 m ET estimation framework

types. During 2001–2007, 4 out of 21 site years (19 %) over        seasonal cycle. Although 2012 is a severe drought year, soil
the three Mead sites were misclassified. By using the cor-         water content (SWC) at the US-Ne3 rainfed site still shows
rect classification (not shown), the accuracy of LAI estima-       a relatively high level (> 0.2). As a result, ET/PET from both
tions reaches R 2 = 0.90 and RMSE = 0.62 for the VI-based          BESS-STAIR and the flux tower is at the same level as the
method and R 2 = 0.89 and RMSE = 0.68 for the RTM-based            adjacent two irrigated sites (US-Ne2 and US-Ne3).
method. By comparison, the coarse-resolution MODIS LAI
has relatively large errors, especially a negative bias (R 2 =     3.3   Spatiotemporal variations of BESS-STAIR ET
0.55, RMSE = 1.68, and MBE = −0.97).
                                                                   BESS-STAIR daily ET demonstrates prominent spatial vari-
3.2    Performance of BESS-STAIR ET                                ations within the 0.1◦ × 0.1◦ area near the Mead site in Ne-
                                                                   braska (Fig. 8). Because of the impact of drought, central
BESS-STAIR daily ET estimations are in highly aligned              pivot irrigated fields characterized by round-shaped plots
agreement with ground truth from the 12 flux-tower measure-        generally display higher values than surrounding croplands,
ments (Fig. 4). Across all of the 12 sites, BESS-STAIR ET          and croplands have much higher values than grasslands. Vari-
with RTM-based LAI achieves an overall coefficient of deter-       abilities of ET between different crop fields and within in-
mination (R 2 ) of 0.75, a RMSE of 2.29 MJ m−2 d−1 , a rel-        dividual crop fields are also observable. Such variabilities
ative error (E(|Xestimation − Xmeasurement |)/E(Xmeasurement ),    might be attributed to different irrigation strategies, varieties,
RE) of 27.9 %, and no overall bias. Figure 5 further exhibits      and/or other management. By comparison, though 500 m res-
its performance over all of the 12 flux-tower sites. R 2 values    olution BESS-MODIS ET is able to capture the general spa-
range from 0.68 to 0.94 for corn and from 0.65 to 0.81 for         tial pattern, it has many mixed pixels and is unable to demon-
soybean, highlighting the robustness of BESS-STAIR ET in           strate gradients across field boundaries.
the US Corn Belt. BESS-STAIR ET with VI-based LAI has                 Reasonable seasonal cycles for different land-cover types
similar performance (R 2 = 0.75, RMSE = 2.24 MJ m−2 d−1 ,          are revealed by BESS-STAIR monthly ET averaged from
and RE = 27.4 %). Considering the relatively small dif-            gap-free daily estimations. An example time series of
ference between BESS-STAIR using RTM-based LAI and                 monthly ET maps at Brooks Field during the growing season
that using VI-based LAI, only the former one, which is             of 2000 is shown in Fig. 9. BESS-STAIR ET clearly cap-
calibration-free, is demonstrated in the following parts of        tures the temporal dynamics throughout the growing season.
this paper. By comparison, BESS ET with MODIS LAI                  All vegetation shows low values (e.g., < 2 mm d−1 ) in April,
shows larger errors (R 2 = 0.65, RMSE = 2.50 MJ m−2 d−1 ,          May, September, and October but high values in June, July,
and RE = 30.2 %) compared to BESS-STAIR.                           and August (JJA), with their peaks in July. Different seasonal
   Figure 6 shows the comparison between BESS-STAIR                cycles for corn, soybean, and grass are also captured. Grass
daily ET estimations and flux-tower measurements over site         has the highest ET among the three vegetation types from
years with the fewest data gaps in measurements. Across all        April through June. Corn has a higher ET than soybean in
of the 12 sites, BESS-STAIR captures the seasonal charac-          June and July and decreases quickly from August. Soybean
teristics of ET observation from flux towers well, as they ex-     has the lowest ET from April through June, but has the high-
hibit generally consistent variations over the growing season.     est ET in August.
During the peak growing season (June, July, and August), the          BESS-STAIR is also able to produce long-term ET/PET
radiation displays a dominant impact on measured daily ET,         estimation as an indicator of drought. Figure 10 shows an
and it is reasonably estimated by BESS-STAIR ET as well.           example time series of peak growing season ET/PET at
In most cases, measured daily ET does not show a strong            Bondville from 2001 through 2017. Overall substantial inter-
and fast response to precipitation and/or irrigation, possibly     annual variability is shown, with regional average ET/PET
due to the plentiful water storage in soil. Two exceptions are     values ranging from 0.76 in an extremely dry year (2012)
US-IB1 (2006) and US-Ne3 (2012). In the case of US-IB1,            to 0.91 in an extremely wet year (2015). A positive linear
no precipitation is available in August and little in July. As a   relationship (r = 0.42, p < 0.1) is observed between BESS-
result, daily ET measurements drop slightly more quickly in        STAIR ET/PET and precipitation, and a negative linear rela-
August than in the other cases. Such an anomaly is also de-        tionship (r = −0.58, p < 0.05) is observed between BESS-
picted by BESS-STAIR ET. In the case of US-Ne3, the severe         STAIR ET/PET and VPD. The relatively stronger relation-
drought in the 2012 summer causes slightly lower ET values         ship between ET/PET and VPD than that between ET/PET
than the two adjacent irrigation sites (US-Ne1 and US-Ne2).        and precipitation indicates atmospheric water demand is
BESS-STAIR ET also captures this considerable reduction,           likely to contribute more to drought than soil water supply
although a slight bias is observed in July.                        in this area.
   Figure 7 shows the comparison between BESS-STAIR
ET/PET and flux-tower ET/PET at three sites (US-Ne1,
US-Ne2, and NS-Ne3) at Mead, Nebraska. Overall, BESS-
STAIR agrees well with the flux tower in both magnitude and

Hydrol. Earth Syst. Sci., 24, 1251–1273, 2020                                    www.hydrol-earth-syst-sci.net/24/1251/2020/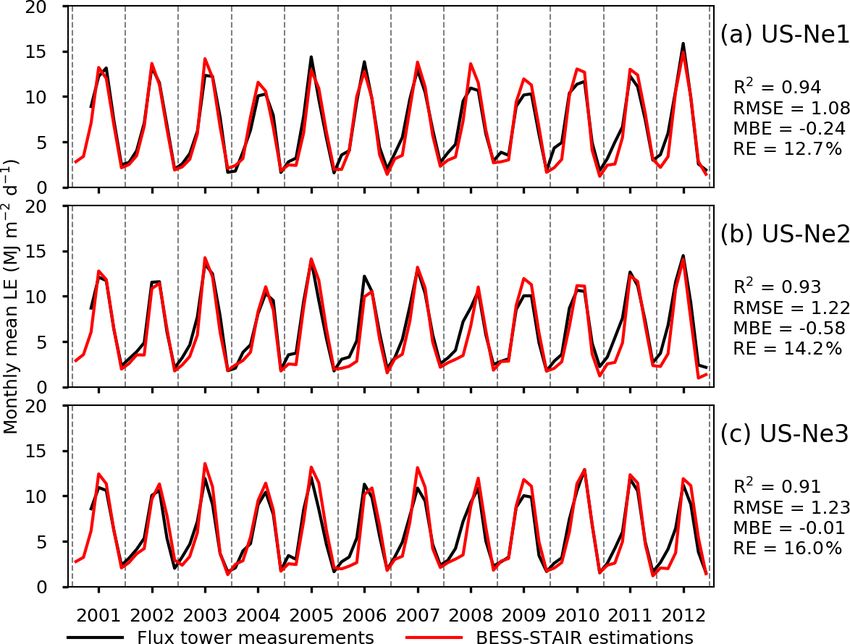
C. Jiang et al.: BESS-STAIR: a daily, 30 m ET estimation framework                                                              1259

Figure 3. Scatter plots between LAI measurements and LAI estimations. LAI measurements are destructively collected at the three Mead
sites. (a–b) STAIR-derived daily 30 m resolution LAI using the VI-based method and the RTM-based method, respectively. (c) 500 m
resolution MODIS LAI.

Figure 4. Density scatter plots between ET measurements and ET estimations. ET measurements are from eddy-covariance data collected at
12 flux towers. (a, b) BESS-STAIR ET with VI-based LAI and RTM-based LAI, respectively. (c) 500 m BESS ET with MODIS LAI.

4     Discussions                                                        The error statistics of BESS-STAIR are commensurate
                                                                     with previous high-resolution cropland ET mapping stud-
4.1    Performance of BESS-STAIR ET                                  ies. Typical RMSE values include 25 W m−2 by TSEB-
                                                                     DTD (Guzinski et al., 2014), 35 W m−2 by METRIC (Ir-
In this study, we have presented BESS-STAIR, a new frame-            mak et al., 2011), 62 W m−2 by SEBS (McCabe and Wood,
work for estimating cropland ET at field and daily scale,            2006), 0.60 mm d−1 by SSEBop (Senay et al., 2016), and
and we have demonstrated its high performance in the US              1.04 mm d−1 by SEBAL (Singh et al., 2008). Nevertheless,
Corn Belt. The BESS process-based biophysical model,                 it is worth mentioning that those studies used original Land-
driven by 30 m resolution vegetation-related variables de-           sat data and therefore suffered from considerably large data
rived from STAIR fused surface spectral reflectance data             gaps. In contrast, BESS-STAIR uses daily Landsat-MODIS
(Fig. 3) and medium-resolution environmental inputs derived          fusion data free from any gaps, which leads to temporally
from MODIS and other satellite data (Fig. 1), is able to pro-        continuous ET estimation at the field level and thus can meet
duce gap-free ET and PET estimations at field scale and at           the requirements of precision agriculture. In addition, it is
daily intervals across space and time (Figs. 4–7). Over the 12       worth mentioning that BESS-STAIR is calibration-free and
sites across the US Corn Belt (Fig. 2), BESS-STAIR explains          therefore is scalable. It also indicates that the accuracy of
75 % of variations in flux-tower measured daily ET (Fig. 4),         BESS-STAIR ET is likely to further improve by using lo-
with an overall RMSE of 2.29 MJ m−2 d−1 (equivalent to               cally optimized driving force or parameter values.
0.93 mm d−1 or 26 W m−2 ), a 27.9 % relative error, and sta-             BESS-STAIR is also comparable to other cropland ET
ble performance across sites (Fig. 5), as well as consistent         mapping studies utilizing data fusion techniques. For ex-
seasonal dynamics with respect to flux-tower measurements            ample, DisALEXI-STARFM daily ET estimates were val-
(Figs. 6–7).                                                         idated against the flux-tower measurements over the three

www.hydrol-earth-syst-sci.net/24/1251/2020/                                        Hydrol. Earth Syst. Sci., 24, 1251–1273, 2020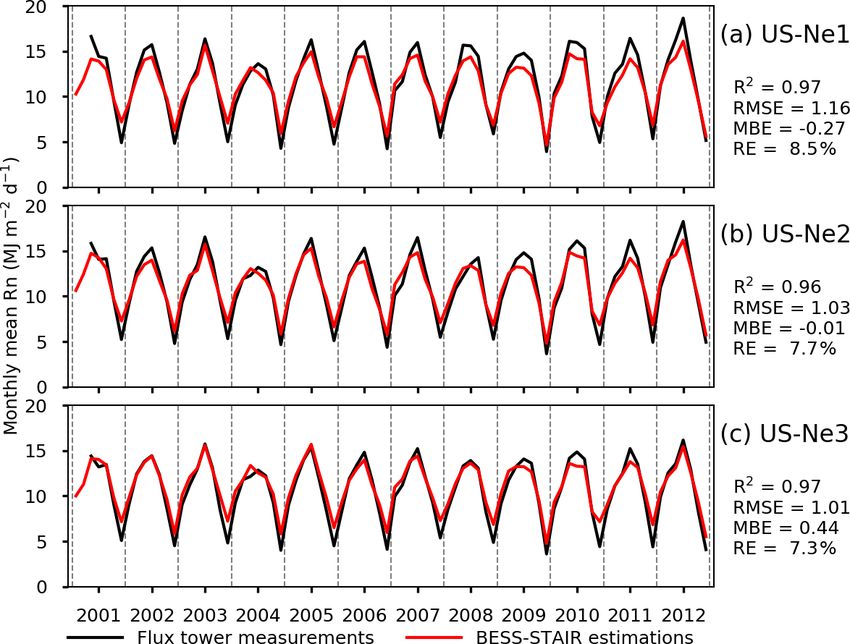
1260                                                   C. Jiang et al.: BESS-STAIR: a daily, 30 m ET estimation framework

Figure 5. Site-by-site R 2 between flux tower measured and BESS-STAIR estimated daily ET for corn and soybean, respectively. Crop type
is from CDL data.

Mead sites (Yang et al., 2018). They reported error statis-          Penman–Monteith methods couple the water cycle and en-
tics of around 1.2 mm d−1 RMSE and 29 % relative error.              ergy cycle and consider ET in the context of energy partition-
BESS-STAIR’s performance at these three same sites shows             ing. BESS, unlike these remote-sensing models, constrains
an average of 0.89 mm d−1 RMSE and 25.3 % relative error             ET with regards to both energy requirement and carbon re-
(Fig. 11). At a monthly scale, the average RMSE and relative         quirement, thanks to explicit modeling of radiative trans-
errors are only 0.48 mm d−1 and 14.3 % (Appendix Fig. A1).           fer and stomatal behavior processes. For the above reasons,
In addition, BESS-STAIR has the potential to apply to any            BESS-STAIR ET not only achieves high accuracy (Figs. A1–
croplands around the world back to 1984, when both high              A3), but also accurately captures responses to GPP, radiation,
spatial resolution data (e.g., Landsat/TM) and high temporal         temperature, and humidity at daily scale (Table 4). Thus,
resolution data (e.g., NOAA/AVHRR) were available.                   BESS-STAIR has the potential to advance the understand-
                                                                     ing of crop responses to climate change by bridging remote-
4.2    Scientific advantages of BESS-STAIR ET                        sensing data and land-surface models, which was first sug-
                                                                     gested by Sellers et al. (1997) more than 20 years ago.
The efficacy of BESS-STAIR lies in several aspects. First,              The second strength is that BESS-STAIR is designed to be
BESS is a water–carbon–energy coupled biophysical model.             most sensitive to the variables which can be well-quantified
BESS employs atmospheric and canopy radiative transfer               from remote-sensing data. BESS ET is most sensitive to solar
modules, a carbon assimilation module, a stomatal conduc-            radiation, followed by LAI (Ryu et al., 2011), as BESS ET is
tance module, and an energy balance module (Jiang and                mainly constrained by net radiation and GPP. In most cases,
Ryu, 2016; Ryu et al., 2011). BESS integrates the simula-            solar radiation is the predominant component of net radia-
tion of the carbon cycle, water cycle, and energy cycle in           tion, while LAI determines the capacity of radiation absorp-
the same framework. Such a carbon–water–energy coupling              tion and subsequently determines GPP. BESS explicitly com-
strategy realistically and coherently simulates plant physi-         putes radiation components at high accuracy by driving an
ology and its response to the environment; specifically, the         atmosphere radiative transfer model, FLiES, using MODIS
carbon uptake and water loss by plants have been simulated           cloud, aerosol, and atmospheric profile products. Globally,
synchronously through environmental constraints on stom-             BESS-estimated solar radiation has its R 2 at about 0.85 and
atal conductance, with further constraints by available energy       0.95 for MODIS snapshots and 4 d averages, respectively
(Baldocchi and Meyers, 1998; Leuning et al., 1995). Many             (Ryu et al., 2018). On the other hand, BESS-STAIR calcu-
land-surface models have already adopted such a strategy             lates high spatiotemporal resolution LAI and albedo from
and have successfully simulated the evolution of terrestrial         fused surface reflectance data. Since Landsat and MODIS
ecosystems (Ju et al., 2006; Sellers, 1997; Tian et al., 2010).      surface reflectance products are publicly available and highly
However, this is not the case in commonly used remote-               reliable (Claverie et al., 2015; Masek et al., 2006), spatial
sensing models. Empirical methods, water balance methods,            heterogeneity and temporal dynamics of crop growing con-
and Priestley–Taylor methods only focus on the water cy-             ditions are captured well (Fig. 8). This study only uses re-
cle. Energy balance methods, triangular space methods, and

Hydrol. Earth Syst. Sci., 24, 1251–1273, 2020                                      www.hydrol-earth-syst-sci.net/24/1251/2020/
C. Jiang et al.: BESS-STAIR: a daily, 30 m ET estimation framework 1261 Figure 6. Seasonal time series of flux tower measured and BESS-STAIR estimated daily ET for 12 selected site years. Daily radiation and precipitation/irrigation are overlaid except for US-Br3. flectance data fused from Landsat and MODIS, but STAIR time series are well-reconstructed, and subsequently BESS- can be easily extended to further incorporate other types of STAIR could directly work under all-weather conditions. In data, such as Sentinel-2 (10 m resolution) and Planet Lab this manner, BESS-STAIR has no need to fill cloudy-sky ET CubeSats (3 m resolution) (McCabe et al., 2017). By incor- using clear-sky ET estimations, which is error prone because porating more high-resolution observations, the relevance of the empirically filled ET estimations usually lack sophisti- reconstructed high-resolution image series can be further im- cated process-level model constraints and thus can have large proved. uncertainties. Figure 12 shows that the estimation errors of The third strength is that BESS-STAIR is able to per- BESS-STAIR ET do not change significantly under differ- form under all-weather conditions. BESS-STAIR fills data ent sky conditions, with a low to high “sky clearness index” gaps in surface reflectance, which has a smooth day-to-day ranging from more cloudy to more clear-sky conditions. variation even with changes in sky conditions (Liu et al., 2017). Based on filtered surface reflectance, LAI and albedo www.hydrol-earth-syst-sci.net/24/1251/2020/ Hydrol. Earth Syst. Sci., 24, 1251–1273, 2020
1262                                                     C. Jiang et al.: BESS-STAIR: a daily, 30 m ET estimation framework

Figure 7. Seasonal time series of daily ET/PET derived from BESS-STAIR and the flux tower for US-Ne1, US-Ne2, and NS-Ne3 in 2012,
along with measured daily mean soil water content (SWC).

Figure 8. Daily ET (MJ m−2 d−1 ) derived from (a) BESS-STAIR and (b) BESS-MODIS at Mead (41.1–41.2◦ N, 96.4–96.5◦ W) on 1 Au-
gust 2012. Circles indicate flux towers in this region.

4.3    Limitations and future improvements of                        be mitigated by incorporating innovative leaf trait estima-
       BESS-STAIR ET                                                 tion techniques that have emerged in recent years, such as
                                                                     imaging spectroscopy (Serbin et al., 2015), sun-induced flu-
In this study, several inputs used by BESS have some limita-         orescence (Zhang et al., 2018), and plant optimization the-
tions in terms of generality and accessibility. First, three plant   ory (Walker et al., 2017; Wang et al., 2017). Second, BESS-
functional parameters, peak Vcmax25 and Ball–Barry slope             STAIR in this study uses CDL data which are only available
and intercept, are obtained from the literature, assuming a          in the United States. Fortunately, BESS does not require spe-
constant given C3 or C4 plant type. Other land-surface mod-          cific crop types, but only C3 /C4 distributions, and the separa-
els tend to use a similar strategy by assigning fixed values         tion of the major C4 crop maize from other crops is practical
to a given plant functional type (PFT) (Bonan et al., 2011;          using time-series satellite data (Cai et al., 2018; Zhong et al.,
Kattge et al., 2009; Miner et al., 2017). The drawback of this       2016). It is noted that misclassification of C3 and C4 crops is
strategy is that it overlooks within-PFT variations and the          likely to cause a large bias in GPP but a relatively small bias
feedback mechanisms between vegetation and its environ-              in ET (Figs. A1–A3).
ment (Van Bodegom et al., 2014). These limitations might

Hydrol. Earth Syst. Sci., 24, 1251–1273, 2020                                      www.hydrol-earth-syst-sci.net/24/1251/2020/
C. Jiang et al.: BESS-STAIR: a daily, 30 m ET estimation framework 1263
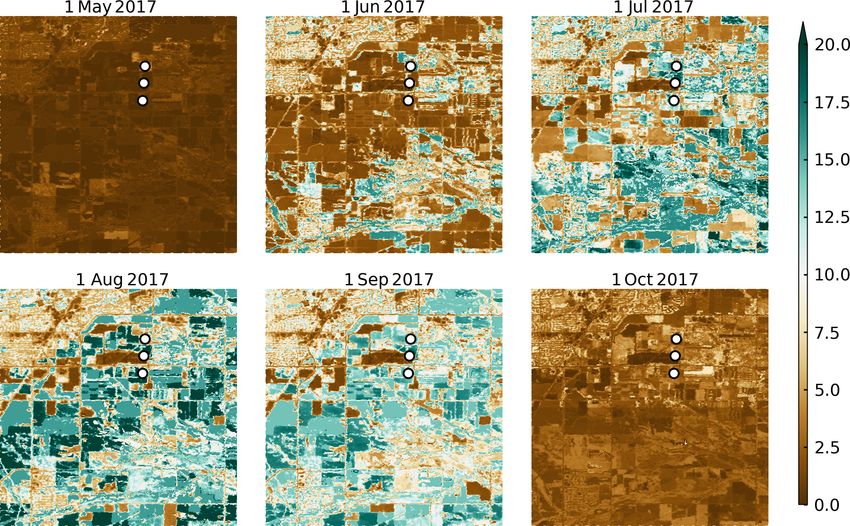
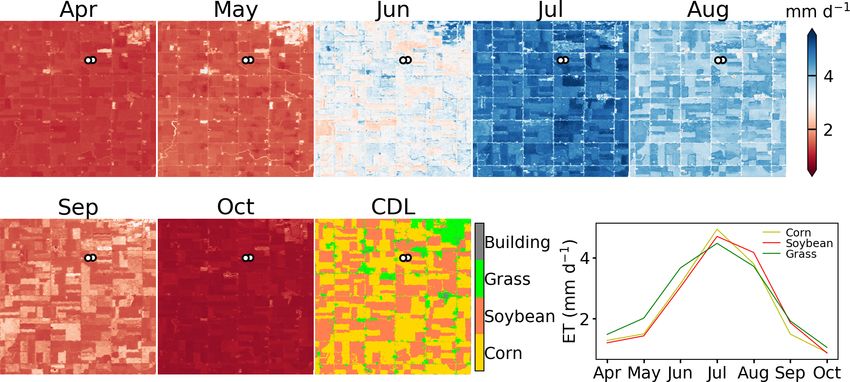
Figure 9. Monthly mean BESS-STAIR ET at Brooks Field (41.9–42.0◦ N, 96.65–96.75◦ W) during the growing season of 2000, along with
a CDL land-cover map. The last subplot shows the average time series of corn, soybean, and grass. Circles indicate flux towers in this region.
Table 4. BESS-STAIR captures the correct response of daily ET to GPP, radiation (Rg ), temperature (Ta ), and humidity (VPD) as compared to
flux-tower measurements over the three Mead sites from 2001 through 2012. The linear equation slopes and correlation coefficients between
ET and other factors are similar in flux-tower measurements and BESS-STAIR estimations, for both the whole growing season (April–
October) or only the peak growing season (June, July, and August). For “flux-tower” columns, Rg , Ta, and VPD are from site measurements,
while for “BESS-STAIR” columns, they are from satellite-derived coarse-resolution inputs.
Time period Relationship Flux tower BESS-STAIR
Equation Correlation Equation Correlation
Growing season ET (MJ m−2 d−1 ) ∼ GPP (gC m−2 d−1 ) y = 0.44x + 3.19 r = 0.86(p < 0.01) y = 0.65x + 2.60 r = 0.90(p < 0.01)
(April–October) ET (MJ m−2 d−1 ) ∼ Rg (MJ m−2 d−1 ) y = 0.33x − 0.07 r = 0.56(p < 0.01) y = 0.29x + 0.28 r = 0.51(p < 0.01)
ET (MJ m−2 d−1 ) ∼ Ta (◦ C) y = 0.44x − 1.60 r = 0.67(p < 0.01) y = 0.43x − 1.64 r = 0.54(p < 0.01)
ET (MJ m−2 d−1 ) ∼ VPD (hPa) y = 0.32x + 4.10 r = 0.31(p < 0.01) y = 0.44x − 2.50 r = 0.68(p < 0.01)
JJA (June, July, ET (MJ m−2 d−1 ) ∼ GPP (gC m−2 d−1 ) y = 0.35x + 4.85 r = 0.76(p < 0.01) y = 0.39x + 6.36 r = 0.63(p < 0.01)
August) ET (MJ m−2 d−1 ) ∼ Rg (MJ m−2 d−1 ) y = 0.36x + 1.79 r = 0.58(p < 0.01) y = 0.36x + 3.40 r = 0.77(p < 0.01)
ET (MJ m−2 d−1 ) ∼ Ta (◦ C) y = 0.52x − 2.20 r = 0.46(p < 0.01) y = 0.15x + 9.40 r = 0.28(p < 0.01)
ET (MJ m−2 d−1 ) ∼ VPD (hPa) y = 0.28x + 7.61 r = 0.32(p < 0.001) y = 0.28x + 4.37 r = 0.30(p < 0.001)
Though BESS-STAIR is able to capture water stress im- ity of optimizing BESS-STAIR using satellite-derived LST.
pact on ET in the US Corn Belt where atmospheric demands Recent advances in innovative thermal observation platforms
play a major role, its applicability to regions where soil sup- such as ECOSTRESS (Hulley et al., 2017), GOES-R (Schmit
ply dominates needs further investigation. Some studies sug- et al., 2017), and Sentinel-3 (Zheng et al., 2019) have pro-
gest that an optical signal as an indicator of drought per- vided a great opportunity to integrate satellite-derived LST
forms at a longer timescale than a thermal signal does (Otkin with BESS-STAIR.
et al., 2017). Drought first decreases soil moisture content The BESS model itself in essence estimates instantaneous
due to enhanced ET induced by high atmospheric demand, ET. The ratio of snapshot potential solar radiation to daily
then decreases ET due to low soil moisture content, and potential solar radiation is adopted as a scaling factor for the
finally causes damage to plants which changes surface re- temporal upscaling of ET (Ryu et al., 2012). In this study,
flectance. Accordingly, LAI may not serve as a relevant early BESS runs two times per day, utilizing radiation components
warning of droughts. Furthermore, severe soil moisture stress derived from Terra/MODIS (around 11:00 solar time) and
may cause physiological deterioration in addition to struc- Aqua/MODIS (around 13:00 solar time) data, respectively.
tural damage that has been reflected in LAI. To address this The two instantaneous ET estimates are separately upscaled
issue for dry regions, we acknowledge that LST observations to daily estimates and averaged. In spite of the robustness
may provide essential adding values. At this point, the ca- of the upscaling algorithm (Ryu et al., 2012), bias cannot
pacity of BESS-STAIR to estimate LST leads to the possibil- be avoided if the sky conditions at two overpass times are
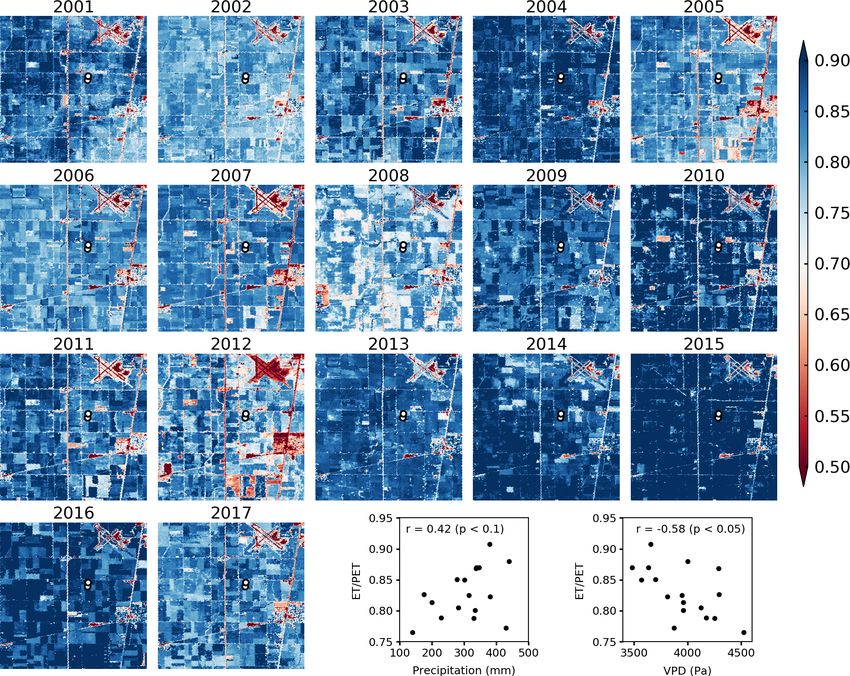
www.hydrol-earth-syst-sci.net/24/1251/2020/ Hydrol. Earth Syst. Sci., 24, 1251–1273, 20201264 C. Jiang et al.: BESS-STAIR: a daily, 30 m ET estimation framework Figure 10. Peak growing season (June, July, and August) BESS-STAIR ET/PET at Bondville (39.95–40.05◦ N, 88.25–88.35◦ W) from 2001 through 2017 along with two scatter plots between peak growing season precipitation and ET/PET and peak growing season VPD and ET/PET over the 17 years. Precipitation and VPD data are from Daily Surface Weather Data (Daymet) at Bondville, Illinois (https: //modis.ornl.gov/cgi-bin/sites/site/?id=us_illinois_bondville&product=Daymet, last access: 11 March 2020), where VPD is derived using maximum air temperature and water vapor pressure. Circles indicate flux towers in this region. Figure 11. Scatter plots between ET measurements and ET estimations at three sites: US-Ne1, US-Ne2, and US-Ne3. Hydrol. Earth Syst. Sci., 24, 1251–1273, 2020 www.hydrol-earth-syst-sci.net/24/1251/2020/
C. Jiang et al.: BESS-STAIR: a daily, 30 m ET estimation framework                                                               1265

                                                                         5   Conclusions

                                                                         In this study we presented BESS-STAIR, a new framework to
                                                                         estimate high spatiotemporal resolution ET that can be used
                                                                         for field-level precision water resource management. BESS-
                                                                         STAIR couples a satellite-driven water–energy–carbon cou-
                                                                         pled biophysical model, BESS, with a generic and fully au-
                                                                         tomated fusion algorithm, STAIR, to generate gap-free 30 m
                                                                         resolution daily ET estimations. Comprehensive evaluation
                                                                         of BESS-STAIR ET estimations revealed (1) reliable perfor-
                                                                         mance over 12 flux-tower sites across the US Corn Belt and
                                                                         (2) reasonable spatial patterns, seasonal cycles, and interan-
                                                                         nual dynamics. The proposed BESS-STAIR framework has
                                                                         demonstrated its ability to provide significant advancements
Figure 12. BESS-STAIR estimated daily ET has a similar perfor-
                                                                         with regard to daily field-level estimations of ET at regional
mance with a varying sky clearness index (the ratio of incoming ra-
diation on the surface to that on the top-of-atmosphere). The lower
                                                                         and decadal scales. We expect BESS-STAIR to become a
and upper boundaries of boxes refer to the first and third quartiles     solid tool for precision water resource management and other
of error statistics. The bars inside the boxes refer to median values.   precision agriculture applications for the US Corn Belt as
The whiskers indicate 1.5 times the distance between the first and       well as other agricultural areas around the world, thanks to
third quartiles.                                                         the global coverage of input data.

not representative for that day, which is natural and com-
mon in the presence of moving cloud. Since BESS is a time-
independent model and can perform at any time during day-
time, adding more snapshots to account for the diurnal varia-
tions of radiation can solve this problem. Unfortunately, fine-
resolution polar-orbiting satellites usually have similar over-
pass times (10:00–11:00 and 13:00–14:00), so adding even
more satellites is likely to bring redundant information only.
Reanalysis radiation data covering the diurnal cycle have
limited accuracy and coarse resolution (Babst et al., 2008;
X. Zhang et al., 2016), so they may be unable to provide
much added value as well. Next-generation geostationary
satellites acquiring data with both high spatial and temporal
resolutions, such as GOES-R and GaoFen-4 (Goodman et al.,
2012; Xu et al., 2017), are expected to enable BESS-STAIR
ET in an hourly or sub-hourly interval and subsequently gen-
erate more realistic daily ET estimates.

www.hydrol-earth-syst-sci.net/24/1251/2020/                                           Hydrol. Earth Syst. Sci., 24, 1251–1273, 2020
You can also read