Ice nucleation activity of silicates and aluminosilicates in pure water and aqueous solutions - Part 2: Quartz and amorphous silica - Atmos. Chem ...
←
→
Page content transcription
If your browser does not render page correctly, please read the page content below
Atmos. Chem. Phys., 19, 6035–6058, 2019
https://doi.org/10.5194/acp-19-6035-2019
© Author(s) 2019. This work is distributed under
the Creative Commons Attribution 4.0 License.

Ice nucleation activity of silicates and aluminosilicates in pure water
and aqueous solutions – Part 2: Quartz and amorphous silica
Anand Kumar, Claudia Marcolli, and Thomas Peter
Institute for Atmospheric and Climate Sciences, ETH Zurich, Zurich, 8092, Switzerland

Correspondence: Anand Kumar (anand.kumar@env.ethz.ch)

Received: 26 September 2018 – Discussion started: 13 November 2018
Revised: 25 March 2019 – Accepted: 11 April 2019 – Published: 8 May 2019

Abstract. Divergent ice nucleation (IN) efficiencies of           of a natural quartz surface is negligible, when it grew un-
quartz, an important component of atmospheric mineral dust,       der near-equilibrium conditions. For suspensions contain-
have been reported in previous studies. We show here that         ing milled quartz and the solutes (NH4 )2 SO4 , NH4 HSO4 or
quartz particles obtain their IN activity from milling and that                                             1a het
                                                                  Na2 SO4 , Thet approximately follows Thet w (aw ), the hetero-
quartz aged in water loses most of its IN efficiency rela-        geneous freezing onset temperatures that obey 1aw    het crite-
tive to freshly milled quartz. Since most studies so far re-                   1a het                      het ) with 1a het being a
ported IN activities of commercial quartz dusts that were         rion, i.e., Thet w (aw ) = Tmelt (aw +1aw             w
milled already by the manufacturer, IN active samples pre-        constant offset with respect to the ice melting point curve,
vailed. Also, the quartz surface – much in contrast to that       similar to homogeneous IN. This water-activity-based de-
of feldspars – is not prone to ammonia-induced IN enhance-        scription is expected to hold when the mineral surface is not
ment. In detail we investigate the influence of solutes on the    altered by the presence of the solutes. On the other hand,
IN efficiency of various silica (SiO2 ) particles (crystalline    we observe a slight enhancement in Fhet in the presence of
                                                                  these solutes, implying that the compliance with the 1aw       het
and amorphous) with special focus on quartz. We performed
immersion freezing experiments and relate the observed vari-      criterion does not necessarily imply constant Fhet . In con-
ability in IN activity to the influence of milling, the aging     trast to the sulfates, dilute solutions of NH3 or NaOH (mo-
time and to the exposure conditions since milling. Immer-         lality ≥ 5 × 10⁻⁴ mol kg−1 ) reveal Thet by 3–8 K lower than
                                                                      1a het
sion freezing with silica particles suspended in pure water or    Thet w (aw ), indicating a significant impact on the mineral
aqueous solutions of NH3 , (NH4 )2 SO4 , NH4 HSO4 , Na2 SO4       surface. The lowering of Thet of quartz suspended in dilute
and NaOH, with solute concentrations corresponding to wa-         NH3 solutions is opposite to the distinct increase in Thet that
ter activities aw = 0.9–1.0, were investigated in emulsified      we found in emulsion freezing experiments with aluminosil-
droplets by means of differential scanning calorimetry (DSC)      icates, namely feldspars, kaolinite, gibbsite and micas. We
and analyzed in terms of the onset temperature of the hetero-     ascribe this decrease in IN activity to the increased disso-
geneous freezing signal Thet and the heterogeneously frozen       lution of quartz under alkaline conditions. The defects that
water volume fraction Fhet . Quartz particles, which origi-       constitute the active sites appear to be more susceptible to
nate from milling coarse samples, show a strong heteroge-         dissolution and therefore disappear first on a dissolving sur-
neous freezing peak in pure water with Thet equal to 247–         face.
251 K. This IN activity disappears almost completely after
aging for 7 months in pure water in a glass vial. During this
time quartz slowly grew by incorporating silicic acid leached
from the glass vial. Conversely, the synthesized amorphous        1     Introduction
silica samples show no discernable heterogeneous freezing
signal unless they were milled. This implies that defects pro-    The influence of cirrus and mixed-phase clouds on Earth’s
vide IN activity to silica surfaces, whereas the IN activity      radiative budget is well recognized, yet not fully understood
                                                                  (Baker, 1997; DeMott et al., 2010; Storelvmo et al., 2011).

Published by Copernicus Publications on behalf of the European Geosciences Union.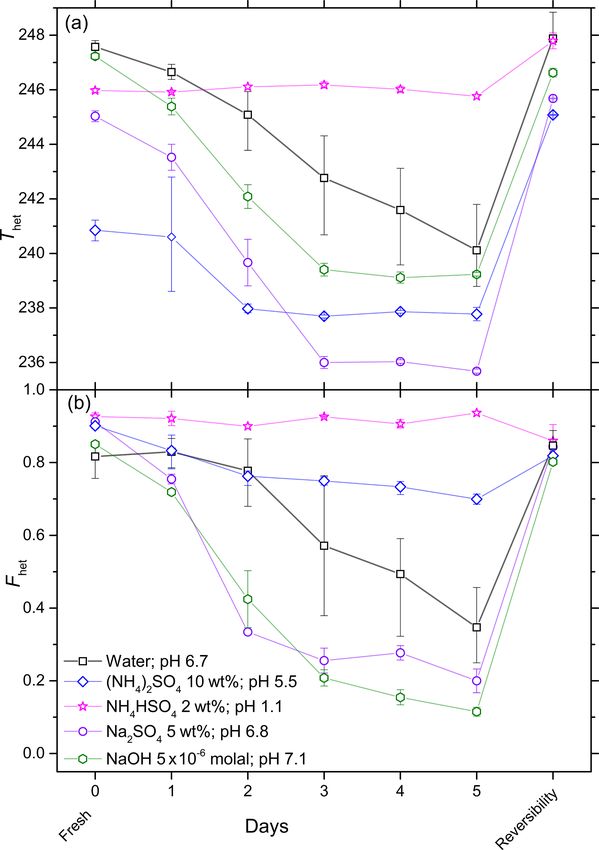
6036                                       A. Kumar et al.: Ice nucleation activity of silicates and aluminosilicates – Part 2

Ice formation in clouds may be initiated via homogeneous           permicrcon quartz particles immersed in pure water, Zim-
ice nucleation (IN) below 237 K, whereas it requires an ice        mermann et al. (2008) reported an activated fraction of 1 %
nucleating particle (INP) to occur heterogeneously at higher       at 261 K (RHw > 100 %). In droplet freezing experiments,
temperatures between 237 and 273 K (Pruppacher and Klett,          Atkinson et al. (2013) and Zolles et al. (2015) found 50 % of
1994; Vali et al., 2015). Mineral dusts are a well-established     droplets frozen as high as 249 K and as low as 235 K, depend-
class of aerosol particles, consisting of various minerals, such   ing on sample origin and pretreatment (e.g., milling). These
as feldspars, clay minerals, micas, calcite and quartz, which      examples show that although quartz has a simple chemical
exhibit widely varying IN abilities (Murray et al., 2011;          composition, the quartz surface seems to show large varia-
Atkinson et al., 2013; Kaufmann et al., 2016). The atmo-           tions with respect to its surface properties resulting in highly
spheric relevance of these different minerals as INPs depends      variable IN activities.
on both their abundance in airborne dusts and their IN activ-         Mineral surfaces may undergo changes due to interaction
ity, which in turn may depend on their production process          with atmospheric chemical species while being transported
and atmospheric aging.                                             over long distances (Prospero, 1999; Schepanski et al., 2009;
   For a long time, clay minerals have been considered the         Uno et al., 2009). These changes can potentially alter their
dominating IN active species amongst mineral dust particles.       IN ability (Salam et al., 2007, 2008; Kulkarni et al., 2012;
This is because of their well-documented IN ability together       Augustin-Bauditz et al., 2014). Several studies reported an
with their high abundance in the fine particle fraction, which     indifferent behavior of mineral surfaces to dissolved species
facilitates long-range and high-altitude transport (Usher et       so that immersion freezing in solutions can be simply de-
al., 2003; Matsuki et al., 2005; Murray et al., 2012; Pinti        scribed as a freezing point depression due to the solute (Zu-
et al., 2012). However, they are IN active only at tempera-        beri et al., 2002; Zobrist et al., 2008; Rigg et al., 2013), with
tures too low to explain many observed instances of cloud          a constant offset in water activity (1aw = const.), similar to
glaciation (Atkinson et al., 2013). More recently, feldspars,      the water-activity-based description of homogeneous IN by
and more specifically potassium-containing feldspars (K-           Koop et al. (2000). This description was further elaborated
feldspars) have been suggested as the determinant species          as the activity-based immersion freezing model (ABIFM)
for the IN activity of airborne desert dusts (Atkinson et al.,     by Knopf and Alpert (2013). In contrast, other studies have
2013). Yet, follow-up studies have shown that not all K-           shown that IN efficiencies in immersion mode deteriorated
feldspars exhibit the same high IN activity (Harrison et al.,      due to irreversible surface destruction (e.g., in the presence
2016; Kaufmann et al., 2016; Peckhaus et al., 2016), and that      of acids) (Niedermeier et al., 2011; Augustin-Bauditz et al.,
microcline, the K-feldspar with the highest freezing temper-       2014; Wex et al., 2014; Burkert-Kohn et al., 2017) as well as
atures, constitutes only a minor fraction of collected desert      in deposition mode (Sullivan et al., 2010b; Reitz et al., 2011).
dusts (Boose et al., 2016b; Kaufmann et al., 2016).                However, Sullivan et al. (2010a) showed that size-selected
   Quartz, the dominant dust component collected near              Arizona Test Dust (ATD) exposed to nitric acid resulted in
source regions, is a crystalline mineral composed of silicon       hampering of IN efficiency deposition mode but had no im-
and oxygen atoms in a continuous framework of SiO4 tetra-          pact on freezing above water saturation. On the other hand,
hedra, with each oxygen atom being shared by two tetrahe-          Kanji et al. (2019) reported no effect of secondary organic
dra. Therefore, quartz has an overall chemical formula of sil-     aerosol (SOA) coating on the IN efficiency of Saharan and
icon dioxide (SiO2 ), also called silica (Götze and Möckel,        Asian dust samples in immersion freezing mode.
2014). Quartz is a potentially relevant mineral dust for het-         This is the second part of three companion papers on IN
erogeneous IN in the atmosphere (Field et al., 2006; Mur-          activity of silicates and aluminosilicates. In Part 1 (Kumar
ray et al., 2012; Boose et al., 2016b). Moreover, it is found      et al., 2018a) we have shown that immersion freezing on-
in high proportions in atmospherically transported Saharan         set temperatures of microcline in aqueous solutions strongly
dust samples (Avila et al., 1997; Caquineau et al., 1998;          deviate from a constant 1aw . The observed deviations were
2002; Alastuey et al., 2005; Kandler et al., 2009). Boose et       both to higher and lower IN temperatures, depending on so-
al. (2016b) found a correlation of IN activity with the quartz     lute type and concentration. This finding is in accordance
concentration in dust samples, which they collected either af-     with Whale et al. (2018), who found an increase in IN ac-
ter being airborne and transported or directly at the surface      tivity for the K-feldspars microcline and sanidine in dilute
from deserts worldwide, suggesting that quartz particles have      (NH4 )2 SO4 solutions, but a decrease in the presence of di-
the potential to be relevant INPs for cloud glaciation in the      lute NaCl.
atmosphere. Indeed, quartz particles showed IN activity in            In this paper and Part 3 (Kumar et al., 2019) of the com-
laboratory studies, albeit with very different IN efficiencies     panion papers, we relate IN activities of mineral surfaces
(Pruppacher and Sänger, 1955; Isono and Ikebe, 1960; Zim-          more closely with the mineral surface properties by inves-
mermann et al., 2008; Atkinson et al., 2013; Zolles et al.,        tigating the differences in IN activity of structurally simi-
2015; Kaufmann et al., 2016). Some early studies including         lar minerals in pure water and aqueous solutions. In Part 3
Pruppacher and Sänger (1955) and Isono and Ikebe (1960)            we investigate the differences in IN activities of aluminosili-
found quartz to be IN active in their experiments. For su-         cates and whether the enhancement observed for microcline

Atmos. Chem. Phys., 19, 6035–6058, 2019                                             www.atmos-chem-phys.net/19/6035/2019/
A. Kumar et al.: Ice nucleation activity of silicates and aluminosilicates – Part 2 6037
in dilute NH3 /NH+ 4 -containing solutions (shown in Part 1) turer, SA quartz is a naturally occurring microcrystalline sil-
is a more general property of aluminosilicates. In the current ica that has been finely ground resulting in a particle size
study, we present immersion freezing experiments of silicas range of 0.5–10 µm (approx. 80 % between 1–5 µm). In addi-
(crystalline quartz and amorphous silicas) in pure water and tion, we determined the number size distribution with a TSI
in solution droplets in order to investigate their IN activity 3080 scanning mobility particle sizer (SMPS) and a TSI 3321
and how it is influenced by the presence of NH3 and several aerodynamic particle sizer (APS). Two lognormal distribu-
inorganic salts, namely (NH4 )2 SO4 , NH4 HSO4 , Na2 SO4 and tions were fitted to the bimodal size distribution yielding
NaOH. To elucidate which surface structures provide IN ac- mode diameters of 482 nm and 1.52 µm (see the Supple-
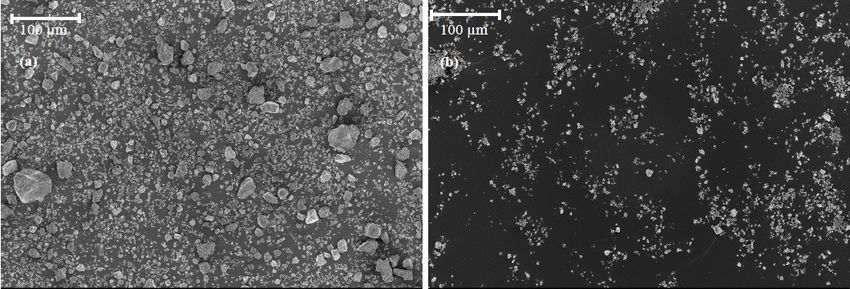
tivity, we compare the IN activity of quartz with other silica ment). Scanning electron microscopy (SEM) measurements
particles, assuming that IN does not occur on the whole par- were also performed on the quartz sample at the ScopeM fa-
ticle surface with a uniform probability but that the surface cility at ETH Zurich. The quartz samples were prepared by
exhibits active sites, i.e., preferred locations for IN with areas placing them on a graphite plate and coated with Pt/Pd al-
of 10–50 nm2 based on estimates using classical nucleation loy by sputtering before taking the images (see the Supple-
theory (Vali, 2014; Vali et al., 2015; Kaufmann et al., 2017). ment). SEM measurements mostly concur to the size range
Quartz is one of the most abundant minerals in the Earth’s provided by the manufacturer with the exception of the pres-
crust. Since quartz is of relevance to different scientific fields ence of very few larger particles (> 10 µm in diameter), which
such as material sciences, geochemistry and chemical engi- are not measured by APS since they are not well aerosolized
neering, quartz surface properties and processes have been owing to their higher mass. We also determined the miner-
the subject of many scientific studies. The dissolution and alogical composition of the SA quartz sample by means of
crystallization of quartz has gained great attention because XRD in order to assess the mineralogical purity of the min-
it influences geochemical processes, such as the formation eral. Rietveld refinement using Profex software (Döbelin and
of mineralized deposits or the silica concentration in natural Kleeberg, 2015) was performed for a quantitative analysis.
and industrial waters (Crundwell, 2017). Dry applications of Based on the X-ray diffractogram, the sample of SA quartz
quartz powders is of concern because of the pathogenicity of consists of 98.9 % (±0.29 %) quartz, mixed with kaolinite
the ground particles (Fubini et al., 1989). We make use of the (0.32 % ± 0.2 %) and topaz (0.76 % ± 0.2%). The amorphous
detailed characterization resulting from such studies to relate content is estimated as 4.5 ± 0.5 %. The Brunauer–Emmett–
the IN activity of quartz to its surface structure. Teller (BET) nitrogen adsorption method was used to de-
termine the specific surface area of this quartz sample as
4.91 m2 g−1 . In addition, thermogravimetric analysis (TGA)
2 Methodology was performed on the quartz sample to assess the presence
of volatile species. The 0.30 % loss in weight was observed
2.1 Mineralogy, size distribution, milling and BET in TGA up to 350 ◦ C (see the Supplement).
surface area measurements Additional milling. To assess the effect of further milling
on the IN efficiency of the SA quartz sample, we milled a
Mineralogy. Silica (three-dimensional polymeric network of portion of the sample with a tungsten carbide disc mill for
SiO2 ) can exist in many different forms that can be crys- 40 s (with 1 min gap after the first 20 s of milling) before run-
talline or amorphous. Amorphous silica shows only short- ning emulsion freezing experiments.
range order and lacks a crystalline structure as shown via X- Other samples. For comparison, we also used four other
ray diffraction (XRD) measurements (Poulsen et al., 1995). silica dusts besides SA quartz:
Quartz, the most common form of crystalline silica, has a
continuous regular framework of tetrahedral SiO4 units with a. The quartz sample (BET value 3.67 m2 g−1 ) that
Si in the center and oxygen atoms at the tetrahedral cor- showed little IN activity in Kaufmann et al. (2016)
ners. Each oxygen atom is shared between two tetrahedra. (termed Kaufmann quartz) (see Appendix A for details
It is a hard mineral (Mohs hardness 7) with no preferred and explanation for its previously reported low IN activ-
cleavage plane (owing to the roughly equal bond strengths ity). The 0.17 % loss in weight was observed in TGA up
throughout the crystal structure) and typically breaks with to 350 ◦ C (see the Supplement). The amorphous content
conchoidal fracture. Quartz is the last mineral to crystallize is estimated as 6.4 ± 0.5 %.
from a magma, i.e., it crystallizes at lower temperatures com- b. A crystalline quartz sample procured from the Technical
pared to other minerals, and therefore it grows to fill the University of Vienna (termed TU Vienna quartz), which
spaces remaining between the other crystals in the form of is “quartz I” of Zolles et al. (2015). The 0.20 % loss
a common impurity (Bowen, 1922, 1928). in weight was observed in TGA up to 350 ◦ C (see the
Size distribution. Quartz from Sigma-Aldrich (∼ 99 %) Supplement).
was the primary sample used in this study (see Sect. 4.4.5
for a discussion of the 1 % of impurities). We will refer to c. Amorphous silica particles procured from Alfa Aesar
this sample in the following as SA quartz. As per manufac- (particle size: 0.4–0.6 µm (characterization by manufac-
www.atmos-chem-phys.net/19/6035/2019/ Atmos. Chem. Phys., 19, 6035–6058, 2019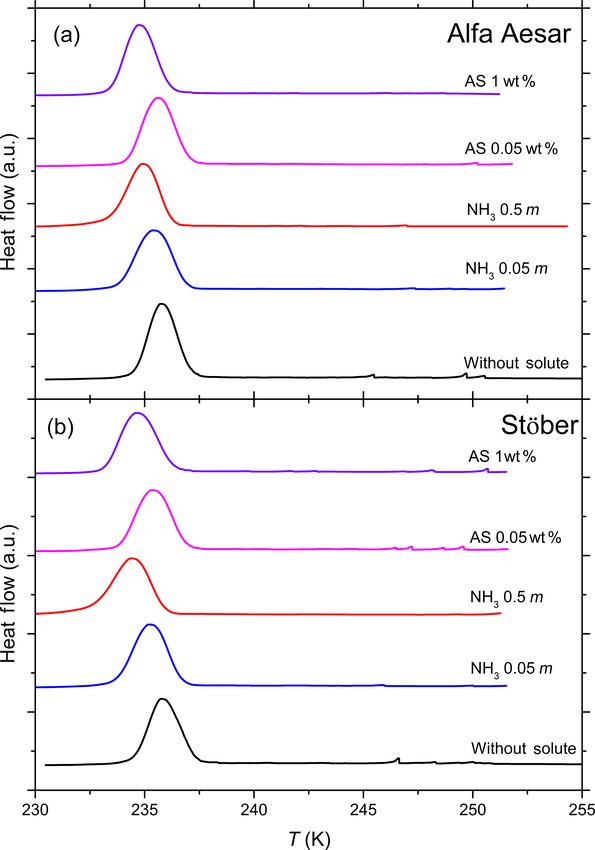
6038                                        A. Kumar et al.: Ice nucleation activity of silicates and aluminosilicates – Part 2

      turer), BET: 5.72 m2 g−1 ). In order to assess the effect
      of milling on the IN efficiency of amorphous silica, we
      milled a portion of this sample with a tungsten carbide
      disc mill for 40 s (with 1 min gap after the first 20 s of
      milling).

 d. Nonporous, amorphous silica particles procured from
    Zurich University of Applied Sciences (named Stöber
    particles in this article, mean particle diameter: 0.34 ±
    0.02 µm, BET: 11 m2 g−1 , see the Supplement for syn-
    thesis procedure).

   Please note that both Alfa Aesar and Stöber silica parti-
cles are synthetically grown (using tetraethyl orthosilicate,
TEOS, in alkaline conditions) samples used in this study and
have not been milled. Only when indicated we milled the
Alfa Aesar silica particles on purpose.

2.2    Emulsion freezing of quartz freshly suspended in            Figure 1. DSC thermograms of various quartz and amorphous sil-
       pure water or solutions                                     ica particles suspended in pure water. St: Stöber silica (10 wt %);
                                                                   AA: Alfa Aesar silica (10 wt %); AA milled: milled Alfa Aesar
Immersion freezing experiments were carried out with the           silica (10 wt %); KQ: quartz sample from Kaufmann et al. (2016)
differential scanning calorimeter (DSC) setup (Q10 from            (8 wt %–9 wt %); TUQ: TU Vienna quartz (5 wt %); SAQ: Sigma-
TA Instruments). The 5 wt % SA quartz suspensions in wa-           Aldrich quartz (5 wt %, milled by Sigma-Aldrich); SAQ milled: ad-
ter (molecular biology reagent water from Sigma-Aldrich)           ditionally milled Sigma-Aldrich quartz (5 wt %). All curves are nor-
                                                                   malized such that the total areas under the heterogeneous plus ho-
were prepared in borosilicate glass vials with varying solute
                                                                   mogeneous freezing curves sum up to the same value.
concentrations (0 wt %–20 wt %) viz. (NH4 )2 SO4 (Sigma-
Aldrich, ≥ 99 %), NH4 HSO4 (Sigma-Aldrich, ≥ 99.5 %),
Na2 SO4 (Sigma-Aldrich, ≥ 99 %), NaOH (Fluka Chemi-
cal, ≥ 99 %), NH3 solution (Merck, 25 %). For comparison,          second freezing cycle was run at 1 K min−1 cooling rate and
5 wt % TU Vienna quartz and a concentrated (8 wt %–9 wt %)         used for evaluation (Zobrist et al., 2008; Pinti et al., 2012;
Kaufmann quartz sample in water, as well as 10 wt % Stöber         Kaufmann et al., 2016; Kumar et al., 2018a).
silica and Alfa Aesar silica suspensions in water containing          The DSC registers the heat release when emulsion droplets
NH3 and (NH4 )2 SO4 , were also prepared for freezing exper-       freeze. When emulsions are prepared from an aqueous sus-
iments (See Appendix A for freezing experiment details for         pension of INPs, the larger droplets are expected to freeze
the Kaufmann quartz sample).                                       heterogeneously because they contain many particles while
   To avoid particle aggregation, the suspensions prepared         the smaller ones rather freeze homogeneously because they
in pure water or solutions were sonicated for 5 min before         contain only few or no particles. Typical DSC thermograms
preparing the emulsions. The aqueous suspension and an             therefore contain a freezing peak below about 237 K due to
oil/surfactant mixture (95 wt % mineral oil, Sigma-Aldrich,        homogeneous IN, while freezing above this temperature is
and 5 wt % lanolin, Fluka Chemical) were mixed in a ratio of       due to heterogeneous IN. The onset temperatures of the het-
1 : 4 and emulsified with a rotor–stator homogenizer (Poly-        erogeneous freezing peak (Thet ) and the homogeneous freez-
tron PT 1300D with a PT-DA 1307/2EC dispersing aggre-              ing peak (Thom ) were determined as the intersection of the
gate) for 40 s at 7000 rpm. This procedure leads to droplet        tangent drawn at the point of greatest slope at the leading
size distributions peaking at about 2–3 µm in number and a         edge of the peak with the extrapolated baseline, whereas the
broad distribution in volume with highest values between 4         melting temperature (Tmelt ) was determined as the maximum
and 12 µm similar to the size distributions shown in Fig. 1 of     of the ice melting peak (see Fig. 1 of Kumar et al., 2018a).
Marcolli et al. (2007), Pinti et al. (2012) and Kaufmann et        The heat release is approximately proportional to the vol-
al. (2016). Regular inspection under the microscope did not        ume of water that froze heterogeneously or homogeneously
reveal any effect of dust particles or solutes on the droplet      and is represented by the integral of the peak over time.
size distribution. We placed 4–8 mg of this emulsion in an         Note that this proportionality is only approximate because
aluminum pan, which was hermetically closed and subjected          the enthalpy of freezing exhibits a temperature dependence
to three freezing cycles in the DSC following the method de-       (Speedy, 1987; Johari et al., 1994). We quantified the het-
veloped and described by Marcolli et al. (2007). The first         erogeneously frozen fraction, Fhet , as the ratio of the het-
and the third freezing cycles were executed at a cooling rate      erogeneous freezing signal to the total freezing signal of the
of 10 K min−1 to control the stability of the emulsion. The        thermogram in the time domain (see Kumar et al., 2018a for

Atmos. Chem. Phys., 19, 6035–6058, 2019                                              www.atmos-chem-phys.net/19/6035/2019/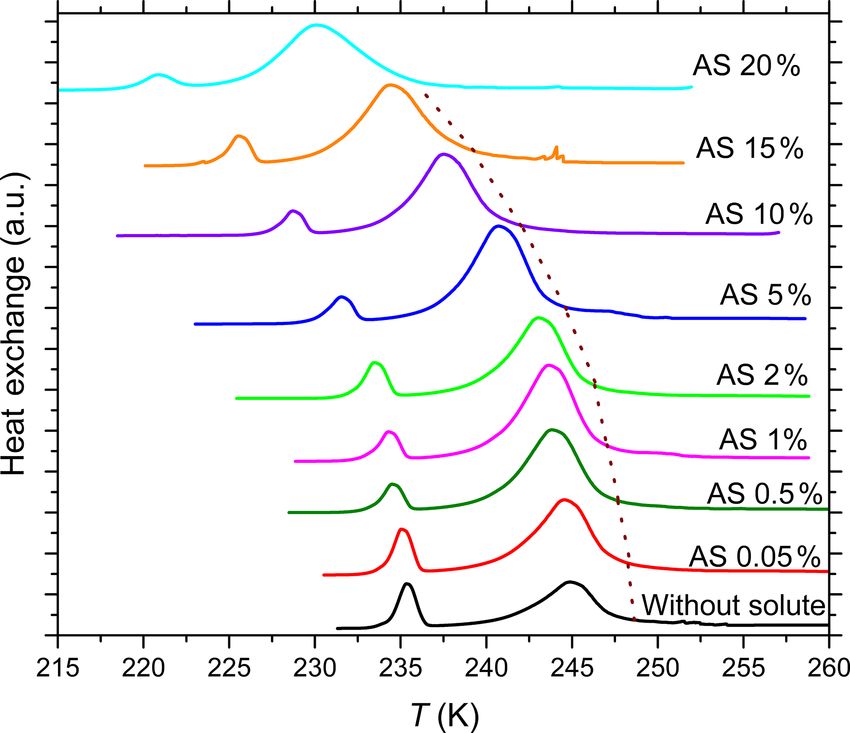
A. Kumar et al.: Ice nucleation activity of silicates and aluminosilicates – Part 2                                         6039

details). The evaluation of Fhet does not include the spikes      tively coupled plasma mass spectroscopy (ICP-MS). The re-
that occur before the appearance of the heterogeneous freez-      sults of ICP-MS measurements are summarized in the Sup-
ing signal. These spikes originate from single droplets in the    plement (Sect. S10).
tail of the droplet size distribution (mostly between 100–
300 µm with some up to 500 µm in diameter) being orders
of magnitude larger in volume than the average droplets and       3     Results
not representative for the sample. Freezing experiments were
performed on emulsions prepared from at least two sepa-           3.1     Ice nucleation activity of quartz and amorphous
rate quartz suspensions for each solute concentration and                 silica in pure water
means are reported. Average precisions in Thet are ±0.2 K
                                                                  Figure 1 shows the DSC thermograms of suspensions of
with maximum deviations not exceeding 0.9 K (i.e., uncer-
                                                                  quartz and amorphous silica particles in pure water prepared
tainties slightly higher than in Kumar et al., 2018a). Thom
                                                                  as emulsion droplets. Fhet and Thet are listed in Table 1. As
and Tmelt are precise within ±0.1 K. Absolute uncertainties
                                                                  can be easily seen, there are large differences in IN activities
in Fhet are on average ±0.02 and do not exceed ±0.12. How-
                                                                  between the samples, from barely to highly IN active.
ever, Fhet carries larger uncertainties (up to ±0.19) when het-
erogeneous freezing signals are weak or overlap (forming          3.1.1    Quartz
a shoulder) with the homogeneous freezing signal (as was
the case for amorphous silica in various solutions and quartz     In the emulsion freezing experiments, all investigated quartz
aged in NaOH solution).                                           samples clearly show IN activity. TU Vienna quartz is
                                                                  slightly more IN active (with respect to both Thet and Fhet )
2.3   Aging and reversibility of quartz suspended in              than SA and Kaufmann quartz at similar suspension con-
      water or solutions                                          centrations. Thet of TU Vienna quartz (250.9 K) is slightly
                                                                  lower than the freezing onset reported by Zolles et al. (2015)
SA quartz (5 wt %) suspended in pure water, NH3 solu-             (∼ 252 K). We ascribe this difference to the higher quartz
tion (0.005 molal; pH 7.9; aw ≈ 0.999), (NH4 )2 SO4 solution      surface area present in the Zolles et al. (2015) droplet freez-
(10 wt %; pH 5.5; aw ≈ 0.963), NH4 HSO4 solution (2 wt %;         ing setup compared to our emulsion freezing experiments. In
pH 1.1; aw ≈ 0.988), Na2 SO4 solution (5 wt %; pH 6.8; aw ≈       accordance with Zolles et al. (2015), we observe an enhance-
0.986) or NaOH solution (5 × 10⁻³ molal; pH 9.5; aw ≈ 1           ment in IN efficiency of quartz due to milling (Table 1).
and 5 × 10⁻⁶ molal; pH 7.1; aw ≈ 1) were aged in borosili-           The quartz sample from Kaufmann et al. (2016) is clearly
cate glass vials and tested over a period of 5 days. Immersion    IN active, exhibiting a distinct heterogeneous freezing signal
freezing experiments were carried out with the DSC setup          with Thet ≈ 242 K and a shoulder extending to higher tem-
with emulsions prepared from at least two separate aging ex-      perature with Thet ≈ 250 K. Kaufmann et al. (2016) reported
periments for each solute concentration. Measurements were        a heterogeneous freezing onset temperature of ∼ 247 K for
done on the day of preparation (fresh) and on the subsequent      the same sample, yet with a very weak heterogeneous freez-
5 days in order to assess the evolution and long-term effect      ing signal corresponding to an IN active particle fraction of
of these solutes on the IN efficiency of quartz. Aging exper-     only 0.01. We explain in Appendix A that this was due to an
iments conducted in pure water, NH3 solution (0.005 mo-           underestimation of the coarse particle fraction because of the
lal) and NaOH solution (5 × 10⁻³ molal) were repeated in          presence of very large particles (> 20 µm), which were not
polypropylene Falcon tubes to assess the influence of leached     accounted for in the particle size distribution determined by
contaminants from the borosilicate glass vials on the IN ac-      SMPS/APS leading to a bias resulting in a too low estimate
tivity of quartz.                                                 of the IN active fraction of quartz particles.
   After aging for 5 days the suspensions were centrifuged
for 2 min at 600 rpm, the supernatant solution was removed        3.1.2    Amorphous silica particles
and the settled particles were washed with pure water. This
process was repeated five times and the washed particles          DSC thermograms of both amorphous silica samples (Fig. 1)
were resuspended in pure water and the IN efficiency of           show only a single freezing peak with onsets of 237.2 and
emulsions prepared from these suspensions were tested with        237.1 K for Stöber and Alfa Aesar silica, respectively, listed
the DSC setup.                                                    under Thet in Table 1. This freezing temperature is slightly
   In order to assess the leaching of contaminants from quartz    higher but still within the uncertainty range of Thom of pure
and the vial walls, suspensions of quartz were prepared in        water emulsions (i.e., 237.0 K). Note that due to the volume
pure water in both borosilicate glass vials and polypropy-        dependence of homogeneous IN rates, Thom of the quartz
lene Falcon tubes and aged for 72 h. The freshly prepared         samples is slightly lower than Thom of the pure water emul-
and aged suspensions were centrifuged to remove the parti-        sions. Only the smallest droplets of the emulsified quartz sus-
cles. The supernatant liquid in each case was collected and       pensions are empty and therefore freeze homogeneously at a
tested for the concentration of leached elements via induc-       lower temperature than the larger droplets that give rise to the

www.atmos-chem-phys.net/19/6035/2019/                                               Atmos. Chem. Phys., 19, 6035–6058, 2019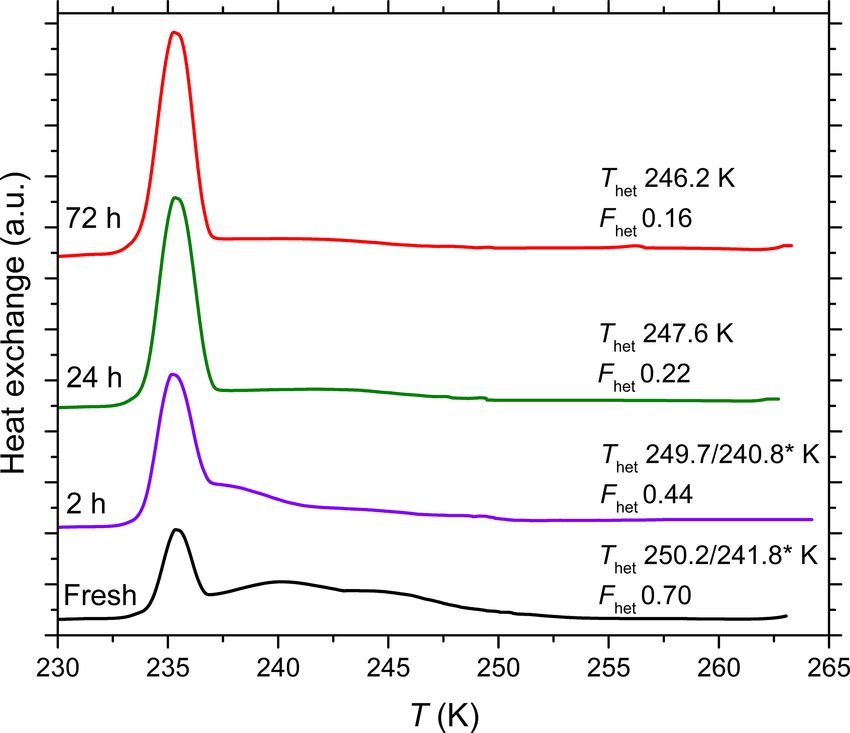
6040                                               A. Kumar et al.: Ice nucleation activity of silicates and aluminosilicates – Part 2

Table 1. Comparison of IN efficiency (in pure water) of various quartz and amorphous silica particles based on emulsion freezing experi-
ments.

                           Sample name                                    Suspension          Thom (K)               Thet (K)       Fhet
                                                                        concentration
                                                                              (wt %)
                           Stöber                                                     10         237.0a             237.2b          0.05
                           Alfa Aesar                                                 10         237.0a             237.1b          0.03
                           Alfa Aesar (milled)                                        10          236.8       246.8/239.7c          0.42
                           Quartz (Kaufmann et al., 2016)                            8–9          236.5       250.2/241.8c          0.70
                           TU Vienna                                                   5          236.6              250.9          0.87
                           Sigma-Aldrichd                                              5          236.5              247.6          0.82
                           Sigma-Aldrichd                                              1          236.7              246.9          0.68
                           Sigma-Aldrich (milled)e                                     5          236.4              249.0          0.92
                           Sigma-Aldrich (milled)e                                     1          236.5              247.4          0.79
                         a Mean T
                                   hom of pure water emulsions is reported here since the onset of the homogeneous freezing signal cannot
                         be separated from the presumed heterogeneous freezing signal. b Onsets of heterogeneous and homogeneous
                         freezing signals are nearly indistinguishable. The observed onset lies within the precision range of Thom (237.0 K,
                         taken as the point dividing heterogeneous and homogeneous freezing signal to evaluate Fhet ). c Onsets of the two
                         shoulders exhibited by these samples (see Fig. 1). Fhet is based on the whole heterogeneous freezing signal.
                         d Milled quartz as obtained from Sigma-Aldrich.e Additionally milled Sigma-Aldrich quartz.

onset of the homogeneous freezing peak in pure water emul-                            had to be calculated based on the solute concentration us-
sions. The calculation of the heterogeneously frozen fraction                         ing the AIOMFAC thermodynamic model at 298 K (Zuend
for both amorphous silica samples assumes that the heat sig-                          et al., 2008, 2011). The measured Thom follows a similar aw
nal at T > 237.0 K is due to heterogeneous freezing, leading                          dependency as Tmelt and has been parameterized by Koop
to Fhet below the uncertainty limits (see Table 1). Since both                        et al. (2000). We construct this line by a constant shift of
samples consist of submicron particles that should be well                            the melting curve by 1aw    hom (T ) = 0.30 (dotted black line)

distributed between emulsion droplets (droplet size needed                            derived using the averaged Thom of all experiments of this
to incorporate on average one silica particle is ∼ 1.1 µm in                          study (which is in good agreement with 1aw     hom (T ) = 0.305

diameter), a prevalence of empty droplets cannot be the rea-                          reported by Koop et al., 2000). Similarly, we apply a constant
son of the absence of detectable IN activity. Therefore, based                        offset 1aw het = 0.221 to shift the ice melting curve to the het-

on our emulsion freezing experiments we consider the amor-                            erogeneous freezing temperature of pure water, yielding the
phous silica particles as inactive or barely IN inactive in wa-                       solid black line, which for simplicity will be referred to as
ter.                                                                                    1a het
                                                                                      Thet w (aw ) from here onwards (see Kumar et al., 2018a for
   When the Alfa Aesar sample is milled, a clearly visible                            more details).
heterogeneous freezing signal develops consisting of two                                Analogous to the parameterization for 1aw hom (T ) based
shoulders on the warmer end of the homogeneous freezing                               on the thermodynamic homogeneous IN description of Koop
peak with onsets of 246.8 and 239.7 K, again demonstrating                                                  1a het
the fundamental importance of the milling process.                                    et al. (2000), Thet w (aw ) assumes that the water activity de-
                                                                                      pendence of Thet is determined by solute-driven changes in
3.2    Dependence of the heterogeneous freezing                                       the structure of the water alone, while interactions of the
       temperatures on the presence of solutes                                        solute with the INP surface are excluded. From Kumar et
                                                                                      al. (2018a, 2019) we know that the assumption of 1aw   het fails

For freezing experiments in the presence of solutes we con-                           when there are specific interactions between the solute and
centrate on the SA quartz. The mean heterogeneous freez-                              the mineral surface. As can be seen from Fig. 2a the mea-
ing onset (Thet ), homogeneous freezing onset (Thom ) and ice                         sured heterogeneous freezing onset temperatures, Thet , fol-
                                                                                              1a het
melting temperatures (Tmelt ) for 5 wt % SA quartz suspen-                            low Thet w (aw ) within measurement uncertainties for quartz
sions in water and aqueous solution droplets are shown in                             suspensions in (NH4 )2 SO4 , NH4 HSO4 and Na2 SO4 , but fall
Fig. 2a as a function of the solution water activity (aw ). The                       below this line in the presence of the bases NH3 and NaOH.
aw is obtained from the evaluation of the melting point de-                           In these alkaline solutions, Thet for quartz emulsions strongly
pression measured during the heating cycle using the Koop                                                1a het
                                                                                      falls below Thet w (aw ) at dilute solute concentrations (aw ≥
et al. (2000) parameterization. Hence all melting tempera-                                                                              1a het
tures lie exactly on the melting curve, except in the case of                         0.99) and stay almost parallel to Thet w (aw ) to higher solute
Na2 SO4 where above the eutectic concentration of 4.6 wt %                            concentrations. This decrease in Thet is less pronounced in
a hydrate of Na2 SO4 crystallizes together with ice and aw                            the presence of NH3 than for suspensions in NaOH.

Atmos. Chem. Phys., 19, 6035–6058, 2019                                                                       www.atmos-chem-phys.net/19/6035/2019/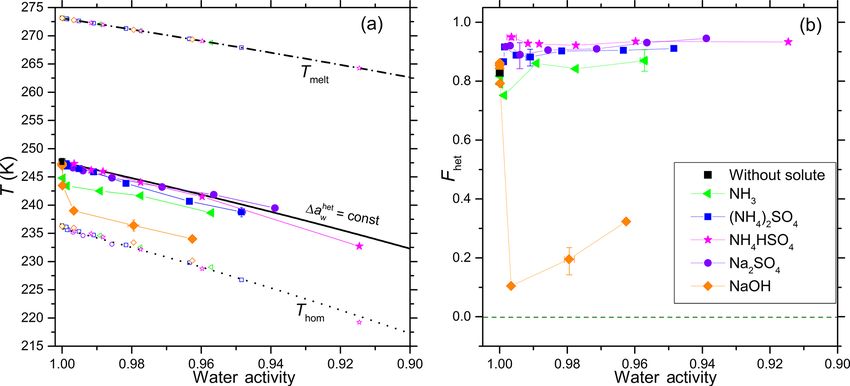
A. Kumar et al.: Ice nucleation activity of silicates and aluminosilicates – Part 2                                                       6041

Figure 2. (a) Onset freezing temperatures of emulsion freezing experiments performed with 5 wt % SA quartz suspended in aqueous solutions
of inorganic solutes (for symbols and colors see insert). Heterogeneous freezing onset temperatures, Thet (filled solid symbols connected
by thin lines); homogeneous freezing onset temperatures, Thom (open symbols at T 262 K) are given as functions of the solution’s water activity, aw . Dash-dotted black line: ice melting curve. Dotted black line:
homogeneous ice freezing curve for supercooled aqueous solutions obtained by horizontally shifting the ice melting curve by a constant offset
1aw hom (T ) = 0.30. Solid black line: horizontally shifted from the ice melting curve by 1a het (T ) = 0.221 derived from the heterogeneous
                                                                                              w
freezing temperature of the suspension of quartz in pure water (filled black square at aw = 1). Symbols are the mean of at least two emulsion
freezing experiments (using at least two separate suspensions). Two symbols carry error bars to show representative experimental variations
(min to max) in Thet and aw . (b) Heterogeneously frozen fraction Fhet as a function of the solution’s water activity (aw ). Five symbols carry
error bars showing representative experimental variations (min to max) in Fhet and aw . Absolute uncertainties in Fhet do not exceed ±0.12.

3.3   Dependence of the heterogeneously frozen fraction                   tions of NaOH (aw ≤ 0.99) strongly decrease Fhet . The het-
      on the presence of solutes                                          erogeneously frozen fraction slightly recovers at higher con-
                                                                          centrations of NaOH (aw = 0.99–0.96) yet remains signifi-
While the addition of neutral or acidic solutes does not in-              cantly below the pure water case.
fluence the freezing temperature beyond the expected freez-                  Furthermore, in Part 3 (Kumar et al., 2019) we show that
                                         1a het                           micas (muscovite and biotite) and gibbsite, which reveal no
ing point depression described by Thet w (aw ), it does affect            IN activity in pure water emulsion freezing experiments, de-
the heterogeneously frozen fraction. Figure 3 shows the DSC               velop a heterogeneous freezing signal in the presence of NH3
thermograms for emulsion freezing of 5 wt % SA quartz sus-                and (NH4 )2 SO4 . We therefore tested the amorphous silica
pended in increasingly concentrated (NH4 )2 SO4 solutions.                samples for a similar effect. DSC thermograms of both amor-
The dotted brown line connecting the onsets of the heteroge-              phous silica samples suspended in NH3 (0.05 and 0.5 mo-
neous freezing signals depicts the continuous decrease in Thet            lal) and (NH4 )2 SO4 (0.05 wt % and 1 wt %) solutions, cor-
as the (NH4 )2 SO4 concentration increases. An increase in                responding to an aw range of 1–0.987 (Fig. 4), show only
heterogeneous-to-homogeneous freezing ratio with increas-                 one clear freezing signal. We report the onset of this freez-
ing solute concentration is apparent. Fhet increases up to                ing peak as Thet in Table 2, while under Thom we list the
aw = 0.998 (0.5 wt %) and stays around this increased value               onset freezing temperature of the reference solutions (pre-
when the solute concentration is further increased. Figure 2b             pared with the solute only). Neither the Alfa Aesar nor the
shows the evaluation of the freezing signals in terms of the              Stöber silica particles (10 wt % suspensions) show a signifi-
heterogeneously frozen fraction, Fhet , as a function of aw               cant increase in the freezing onset compared with the refer-
for all investigated solutes. For solutions containing the salts          ence measurements. We evaluate the heterogeneously frozen
(NH4 )2 SO4 , NH4 HSO4 and Na2 SO4 , Fhet shows a constant                fraction by attributing the freezing signal at temperatures
increase compared with the pure water case, albeit hardly ex-             above the reported Thom of the reference measurement to
ceeding the maximum uncertainty limit. Despite the decrease               heterogeneous freezing, yielding Fhet within the uncertainty
in Thet , there seems to be a slight increase in Fhet for quartz          range (see Table 2). We therefore conclude that NH3 and
suspended in aqueous solutions with higher NH3 (aw ≥ 0.98)
concentrations. On the other hand, even very low concentra-

www.atmos-chem-phys.net/19/6035/2019/                                                        Atmos. Chem. Phys., 19, 6035–6058, 2019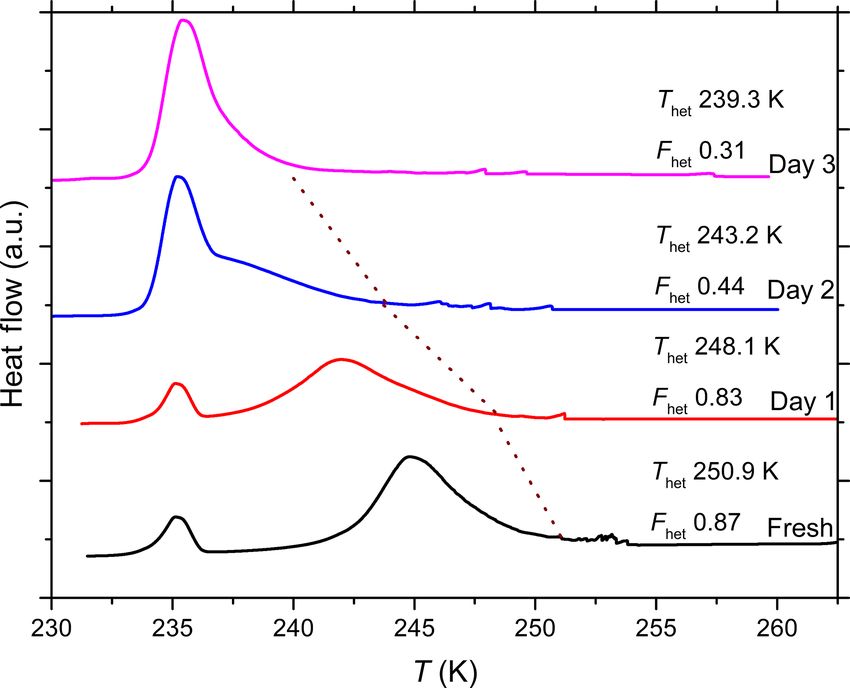
6042                                          A. Kumar et al.: Ice nucleation activity of silicates and aluminosilicates – Part 2

Figure 3. DSC thermograms of 5 wt % SA quartz particles sus-
pended in ammonium sulfate (AS) solution droplets of increas-
ing concentrations (0 wt %–20 wt % AS). All curves are normal-
ized such that the areas under the heterogeneous and homogeneous
freezing curves sum up to the same value. The dotted brown line
connects the heterogeneous freezing onset temperatures (Thet ) of
the emulsions. With increasing AS concentration Thet decreases
monotonically while the intensity of the heterogeneous freezing sig-
nal increases initially in dilute AS solution and remains high up to
high solute concentrations.

(NH4 )2 SO4 do not lead to a discernable enhancement of the            Figure 4. DSC thermograms of 10 wt % Alfa Aesar (a) and 10 wt %
IN activity of amorphous silica.                                       Stöber (b) silica particles suspended in pure water, ammonia (NH3 ;
                                                                       0.05 and 0.5 molal) and ammonium sulfate (AS; 0.05 wt % and
                                                                       1 wt %) solution droplets of varying concentrations (corresponding
3.4    Aging and recovery experiments of quartz in water
                                                                       to aw range of 1–0.987). All curves are normalized such that the ar-
       and aqueous solutions                                           eas under the heterogeneous and homogeneous freezing curves sum
                                                                       up to the same value. DSC thermograms of both amorphous silica
In order to assess the long-term effect of solutes on the IN           samples show only one clear freezing signal that is indistinguishable
efficiency of quartz, aging experiments were performed over            from the homogeneous freezing signal. Thom of the corresponding
a period of 5 days with 5 wt % SA quartz suspensions in pure           emulsion freezing experiments with the pure solutions (in the ab-
water (prepared in borosilicate glass vials and polypropy-             sence of the silica particles) has been taken as the dividing temper-
lene Falcon tubes) and various inorganic solutes. Every day,           ature of heterogeneous and homogeneous freezing to evaluate Fhet
aliquots were taken from the suspension and tested in emul-            (Table 2; see Sect. 3.3).
sion freezing experiments. For these experiments, Thet and
Fhet are given in the upper and lower panels of Figs. 5 and 6,
respectively. Figure 5 shows the results of experiments per-              Aging of quartz suspensions in pure water in glass vials
formed in glass vials while Fig. 6 compares Thet and Fhet              decreases the IN activity in terms of both Thet and Fhet .
of experiments performed in glass vials and polyprolylene              Strong decreases in IN efficiency occur during aging in the
tubes. After aging, the quartz suspensions were decanted,              presence of Na2 SO4 , NaOH and NH3 . On the other hand,
washed and resuspended in pure water in order to assess                Thet and Fhet remain constant when quartz is suspended in
the reversibility of any surface modification occurring dur-           2 wt % NH4 HSO4 solution. Repetition of the aging experi-
ing the aging period. Figures 5 and 6 also show the change in          ments reveals considerable variability in the decrease in IN
Thet and Fhet when aged quartz is resuspended in pure water.           efficiency over time, as indicated by the large min-to-max
(Note that Thet and Fhet in the experiments with fresh dusts           bars after 2–5 days. The reversibility tests show complete or
can be lower than in the reversibility tests, because the former       almost complete recovery of IN efficiency after washing in
were performed in solutions and the latter in pure water.)             the case of aging in pure water and in solutions containing

Atmos. Chem. Phys., 19, 6035–6058, 2019                                                   www.atmos-chem-phys.net/19/6035/2019/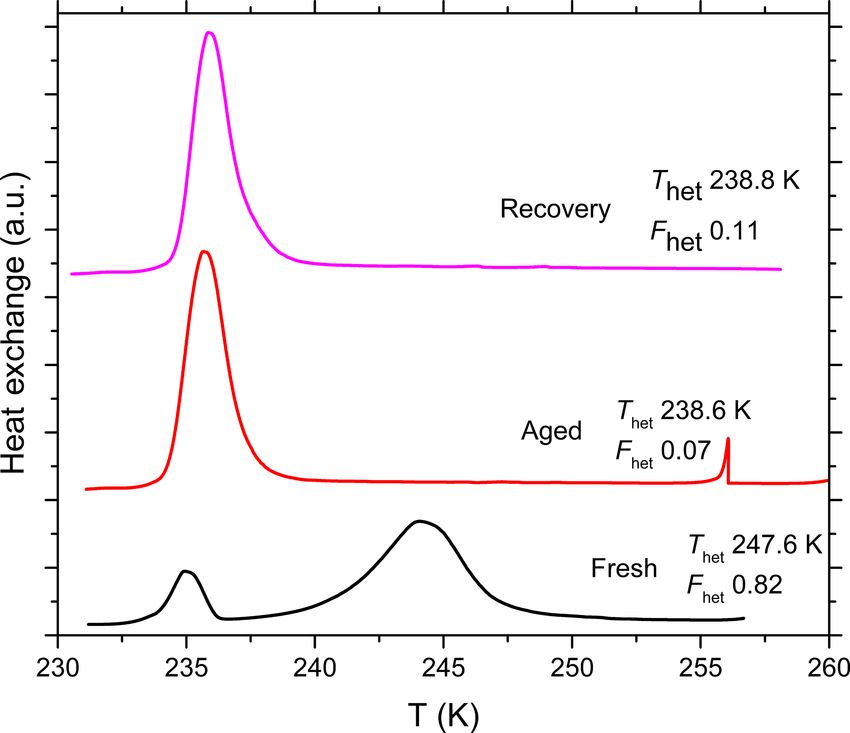
A. Kumar et al.: Ice nucleation activity of silicates and aluminosilicates – Part 2                                                              6043

Table 2. Summary of the freezing experiments with emulsified aqueous solution droplets containing Alfa Aesar and Stöber amorphous silica
particles (10 wt %). Note that the absolute uncertainty in Fhet may be up to ±0.12.

                      Sample/suspension           Solute              Solute                  aw      Thom (K)b         Thet (K)      Fhet
                      concentration                                   concentration
                      (wt %)                                          (ma or wt %)
                      Alfa Aesar                  NH3                 0.5 m                0.987            236.3          236.5      0.01
                      (10 wt %)                   NH3                 0.05 m               0.996            236.6          237.1      0.04
                                                  (NH4 )2 SO4         1 wt %               0.988            236.2          236.5      0.03
                                                  (NH4 )2 SO4         0.05 wt %            0.996            236.9          237.3      0.02
                                                  Pure water          –                        1            237.0          237.1      0.03
                      Stöber                      NH3                 0.5 m                0.997            236.3          236.2      0.01
                      (10 wt %)                   NH3                 0.05 m               0.999            236.6          236.7      0.02
                                                  (NH4 )2 SO4         1 wt %               0.988            236.2          236.3      0.02
                                                  (NH4 )2 SO4         0.05 wt %            0.994            236.9          236.9      0.02
                                                  Pure water          –                        1            237.0          237.2      0.05
                    a m = molality; b mean T
                                              hom of pure water/solution emulsions (taken as the point dividing heterogeneous and homogeneous
                    freezing signal to evaluate Fhet ) is reported here since the onset of the homogeneous freezing signal cannot be separated
                    from the presumed heterogeneous freezing signal.

Na2 SO4 , NaOH (except at high pH 9.5) and (NH4 )2 SO4 . In-                        4     Discussion
terestingly, instead of recovering, the IN efficiency after ag-
ing in a dilute NH3 solution decreases even further when the                        4.1     IN efficiency of quartz and amorphous silica
particles were washed and resuspended in pure water.                                        particles in pure water
   To elucidate whether leached material from the surface of
the glass vial had any impact on the decrease in IN activity                        As shown in Fig. 1 and Table 1, the IN activity of quartz
during aging of quartz in glass vials, experiments exhibiting a                     is superior to the one of amorphous silica particles. The
strong decrease in IN efficiency were repeated in polypropy-                        freezing onset temperatures in pure water for the investi-
lene Falcon tubes. Indeed, in contrast to aging in glass vials,                     gated quartz samples range from 247 to 251 K (see Ta-
quartz aged in pure water in polypropylene tubes exhibited a                        ble 1), covering a similar temperature range as the quartz
stable Thet and a slight enhancement in Fhet (yet within the                        samples investigated by Atkinson et al. (2013) and Zolles
uncertainty range) (Fig. 6). When quartz is suspended in a                          et al. (2015). On the other hand, the IN activity of the sil-
dilute NH3 (pH 7.9) solution in polypropylene tubes, similar                        ica particles (Stöber and Alfa Aesar) is negligible. Hardly
trends were observed as in glass vials, with constant Thet af-                      any IN activity of amorphous silica particles is in agree-
ter an initial decrease, followed by a further decrease after                       ment with Zobrist et al. (2008) who observed freezing at
washing with pure water. Interestingly, quartz freshly sus-                         around 255 K in bulk freezing experiments with 3 µL droplets
pended in NaOH (pH 9.5) in polypropylene tubes shows a                              containing 109 × 1010 particles (total mean particle surface
stronger initial decrease in IN efficiency (Thet and Fhet ) but                     area 0.25–2.5 cm2 ). This freezing temperature is close to
stays higher from the second day onwards than in the corre-                         the one of pure water droplets of this size (252–253 K).
sponding experiments performed in a glass vial until the end                        Whale et al. (2018) found IN active site densities of silica
of the experiment.                                                                  particles from Sigma-Aldrich (silica gel) of ns ≈ 10 cm−2
   Another set of SA quartz suspensions (5 wt %) was pre-                           at 251 K and ns ≈ 0.1 cm−2 at 261 K, corresponding to a
pared in pure water in glass vials and aged for 7 months to                         slightly higher IN activity of these silica particles compared
investigate the aging effect over very long timescales. Fig-                        with those synthesized by Zobrist et al. (2008).
ure 7 shows that the aged particles almost completely lost                             Zolles et al. (2015) investigated the density of IN active
their IN efficiency and barely any of it was recovered after                        sites of three quartz samples and found a very high variability
the aged particles were washed and resuspended in pure wa-                          from hardly IN active to an activity similar to that of micro-
ter. In Sect. 4.4, we relate the results of the aging and re-                       cline. Their quartz sample from Sigma-Aldrich correspond-
versibility experiments to surface processes occurring in the                       ing to the TU Vienna quartz sample in this study was the most
different solutions.                                                                IN active and a natural quartz sample the least IN active.
                                                                                    Moreover, the IN activity of the natural quartz sample in-
                                                                                    creased considerably upon milling. Our comparison of emul-
                                                                                    sion freezing experiments with SA quartz additionally milled
                                                                                    and original SA quartz (used as obtained from the manufac-

www.atmos-chem-phys.net/19/6035/2019/                                                                      Atmos. Chem. Phys., 19, 6035–6058, 2019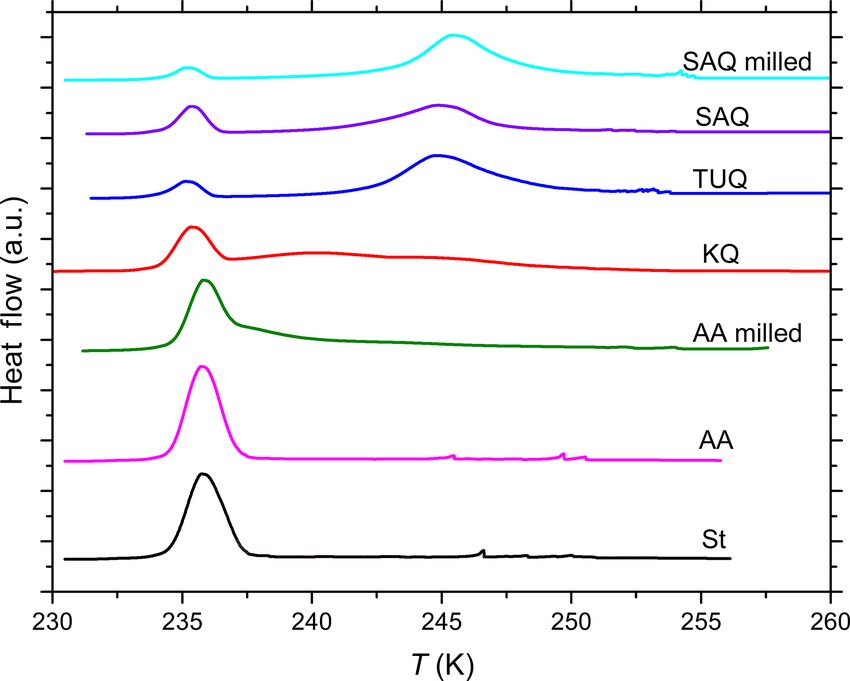
6044 A. Kumar et al.: Ice nucleation activity of silicates and aluminosilicates – Part 2
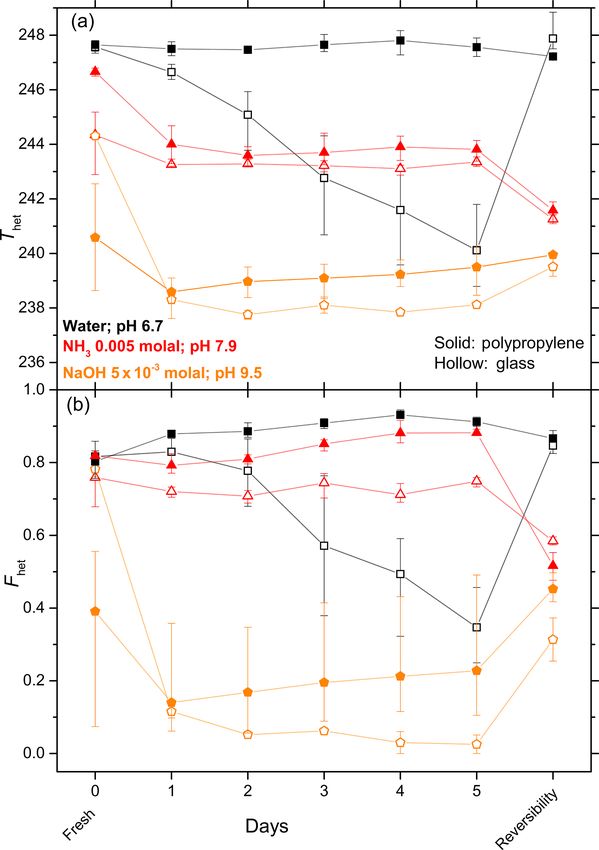
Figure 5. Development of Thet (a) and Fhet (b) for 5 wt % SA quartz Figure 6. Same as Fig. 5, except that it shows a comparison of IN
suspended in water, (NH4 )2 SO4 solution (10 wt %), NH4 HSO4 efficiency of SA quartz (5 wt %) suspended in water/aqueous so-
solution (2 wt %), Na2 SO4 solution (5 wt %) and NaOH solution lutions (NH3 0.005 molal with pH 7.9 and NaOH 5 × 10⁻³ molal
(5 × 10⁻⁶ molal) over a period of 5 days. All suspensions were pre- with pH 9.5) prepared in borosilicate glass vials (open symbols) and
pared and aged in borosilicate glass vials. After 5 days of aging polypropylene Falcon tubes (solid symbols). After 5 days aging the
the reversibility was tested: the suspensions were centrifuged, the reversibility was tested as explained in Fig. 5.
supernatant decanted, the aged particles washed several times with
pure water, resuspended in pure water, and subjected to an emul-
sion freezing experiment. All data points are means of at least two
separately aged suspensions. The error bars show representative ex- the solute is a freezing point depression. Such a description
perimental variations (min to max). has been suggested by several studies in the recent past (Zu-
beri et al., 2002; Archuleta et al., 2005; Cantrell and Robin-
son, 2006; Zobrist et al., 2006, 2008; Alpert et al., 2011a, b;
turer) corroborate an increased IN efficiency in terms of Thet Knopf and Forrester, 2011; Rigg et al., 2013).
and Fhet for the additionally milled sample as shown in Fig. 1 In Part 1 of this series, we showed that heterogeneous
and Table 1. Moreover, milling of the amorphous silica sam- freezing onsets of microcline exhibit strong deviations from
ple from Alfa Aesar also had a very positive effect on its IN the water-activity-based description. Higher Thet compared to
activity. predicted values were observed for microcline suspended in
very dilute NH3 /NH+ 4 -containing solutions, while a substan-
4.2 Heterogeneous IN of quartz in aqueous solutions tial decrease in IN efficiency was observed in more concen-
trated solutions of inorganic salts including NH+ 4 -containing
The water-activity-based description predicts heterogeneous salts and NH3 (Kumar et al., 2018a). In Part 3 (Kumar et
1a het
IN temperatures (Thet w (aw )) as a function of aw by shifting al., 2019) we extended this investigation to other aluminosil-
the ice melting curve by a constant offset in aw . It is expected icates and found that an increase in Thet in the presence of
to be valid in the absence of specific interactions between the NH+ 4 -containing solutes is a general feature of feldspars,
solute and the ice-nucleating surface so that the only effect of clay minerals and micas, while the decrease in IN efficiency
Atmos. Chem. Phys., 19, 6035–6058, 2019 www.atmos-chem-phys.net/19/6035/2019/A. Kumar et al.: Ice nucleation activity of silicates and aluminosilicates – Part 2 6045 at higher solute concentration is a more specific charac- tal effect of alkaline conditions (pH between 7.1 and 13.6) teristic of K-feldspars and most pronounced for microcline. on the stability of the quartz surface (House and Orr, 1992; Conversely, SA quartz follows quite well the water-activity- Crundwell, 2017) and is discussed in the next section. based prediction (black line in Fig. 2a) of Thet in the case of pH neutral suspensions. Fhet shows an initial increase in 4.3 Aging effect and reversibility of surface very dilute solutions of (NH4 )2 SO4 , NH4 HSO4 and Na2 SO4 , modifications which is preserved to higher concentrations (Fig. 2b). Whale et al. (2018) compared the IN activity of quartz in dilute NaCl The aging experiments performed with quartz suspended in and (NH4 )2 SO4 with the one in pure water and observed no different solutions point to surface processes that influence change of the freezing onset temperatures in the presence of the IN activity of quartz over time. The IN activity was the solutes, but an increase in the density of IN active sites maintained over the whole aging period (5 days) in the case towards lower temperatures in a dilute (NH4 )2 SO4 solution of NH4 HSO4 (2 wt %, pH 1.1). In contrast, in pure water, and a decrease in a dilute NaCl solution. (NH4 )2 SO4 (10 wt %, pH 5.5), Na2 SO4 (5 wt %, pH 6.8) and Opposite to the effect of NH3 on aluminosilicates, there is very dilute NaOH (5 × 10⁻⁶ molal; pH 7.1), the IN activ- a decrease in Thet for SA quartz in NH3 solutions. In the past, ity decreased over time but was completely or almost com- several infrared spectroscopy studies have investigated the pletely restored after washing in water (Fig. 5). In more adsorption of NH3 molecules on various types of mineral ox- alkaline solutions, namely NH3 (0.005 molal, pH 7.9) and ides (Mapes and Eischens, 1954; Eischens and Pliskin, 1958; more concentrated NaOH (5 × 10⁻³ molal, pH 9.5), IN ac- Peri and Hannan, 1960). The quartz surface provides several tivity was permanently lost (Fig. 6). Also, when quartz was centers for interaction with NH3 molecules viz. (i) hydrogen aged for 7 months in pure water in glass vials, the IN ac- bonding via one of its hydrogen atoms with a surface oxy- tivity was almost completely destroyed (Fig. 7). In contrast, gen atom of a silanol group; (ii) hydrogen bonding via its the IN efficiency in pure water was barely affected during nitrogen atom with the hydrogen of a surface hydroxyl group aging in polypropylene tubes over 5 days. Even after ag- and (iii) coordination to an electron-deficient Si (Lewis acid ing for 7 months the quartz sample proved to remain IN ac- site) (Folman, 1961; Cant and Little, 1965; Blomfield and tive. Yet, it showed a permanent decrease in IN efficiency Little, 1973; Tsyganenko et al., 1975; Morrow and Cody, (Thet = 243.4 ± 1.6 K, Fhet = 0.59 ± 0.1) that did not recover 1976; Morrow et al., 1976; Fubini et al., 1992; Li and Nel- after washing in water, rather there was a slight further de- son, 1996; Wright and Walsh, 2012). In addition to reversible crease to Thet = 242.4 ± 2.5 K and Fhet = 0.40 ± 0.1. coordination to silanols via hydrogen bonding, NH3 may in- A decrease in IN activity due to aging for 72 h in glass teract irreversibly with strained siloxane bridges by disrupt- vials in pure water was also observed for Kaufmann quartz ing them into Si−NH2 and Si−OH groups (Folman, 1961; (Fig. A2) and TU Vienna quartz (Fig. A3). In the follow- Peri, 1966), although, water displays more affinity than NH3 ing, we relate the results of the aging and reversibility exper- for this reaction (Blomfield and Little, 1973; Morrow and iments to surface processes occurring in the different solu- Cody, 1976; Fubini et al., 1992). Figure 2 shows that the sum tions. of these interactions seems to affect the IN activity of the quartz surface by decreasing Thet but slightly increasing Fhet 4.3.1 Dissolution and growth of quartz in pure water at higher NH3 concentrations. Using sum frequency genera- tion spectroscopy, Wei et al. (2002) have found an enhance- Several studies have discussed the effect of solution pH on ment of the hydrogen bonded OH peak in the presence of am- dissolution rates of quartz (Henderson et al., 1970; Kline monia. They proposed that NH3 molecules may form strong and Fogler, 1981; Schwartzentruber et al., 1987; Bennett et hydrogen bonds with the silanol groups on the silica surface al., 1988; Knauss and Wolery, 1988). The dissolution rate of with the nitrogen atoms facing silica, resulting in an exces- quartz at 25 ◦ C is 10−13 to 10−12 moles Si m−2 s−1 at low sive number of protons (NH bonds) pointing into ice. How- to neutral pH (0.5–7) and increases roughly linearly with in- ever, these interactions of NH3 with the quartz surface do not creasing pH, reaching a value of 10−10 moles Si m−2 s−1 at seem to lead to an enhanced IN activity compared with the pH 12 (House and Orr, 1992; Crundwell, 2017). The dissolu- pure water case. tion of quartz is considered to occur on deprotonated silanols, Wright and Walsh (2012) found no strong and stable hy- i.e., Si−O− (Brady and Walther, 1989, 1990). Deprotonation drogen bonding of NH+ 4 to hydroxylated quartz in their first of the silanol weakens the remaining siloxane bridges, facil- principles molecular dynamics simulations. The slight de- itating the attack by water molecules and ultimately releas- crease in Thet in the presence of (NH4 )2 SO4 together with ing the Si in the form of silicic acid (H4 SiO4 ). Moreover, the slight increase in Fhet indicate that the presence of am- dissolution of quartz increases with increasing ionic strength monium in the solution influences the IN activity, although of the solution, i.e., increasing salt concentration (Brady and only slightly. Walther, 1990). At low pH, different dissolution mechanisms The decrease in IN activity in NaOH-containing suspen- may be involved, such as H2 O hydrolysis of Si centers or sions as shown in Fig. 2 can be ascribed to the detrimen- adsorption of H+ onto siloxane bridging oxygen (Xiao and www.atmos-chem-phys.net/19/6035/2019/ Atmos. Chem. Phys., 19, 6035–6058, 2019
6046                                           A. Kumar et al.: Ice nucleation activity of silicates and aluminosilicates – Part 2

                                                                         which is well above the solubility of quartz in pure water
                                                                         and well below that of amorphous silica. The Si concentra-
                                                                         tion after aging a 0.7 wt % SA quartz suspension for 72 h in
                                                                         polypropylene Falcon tubes reaches only 4.9 ppm, indicating
                                                                         that a considerable fraction of the dissolved Si stems from
                                                                         the glass vial in the aged sample. Indeed, the glass vial con-
                                                                         tinuously leaches Si to the water (Bunker, 1994). The ICP-
                                                                         MS measurement of pure water, which was in contact with
                                                                         the glass vial for less than an hour, shows a concentration
                                                                         of only 0.2 ppm Si but reached 4.5 ppm Si after 72 h. This
                                                                         slower increase in Si concentration compared to the imme-
                                                                         diate increase in the case of the quartz samples (1.3–6 ppm
                                                                         after less than an hour in water) is simply due to the smaller
                                                                         surface area of the glass vial (∼ 2 orders of magnitude) ex-
                                                                         posed to water compared with the one of the SA quartz sam-
                                                                         ple. In addition, also the release of Si from the quartz sample
                                                                         is expected to stem mostly from its amorphous share. Sub-
                                                                         sequently, silicic acid in water may form dimers, trimers and
Figure 7. DSC thermograms of SA quartz (5 wt %) suspended in             cyclic species due to autopolycondensation that sets in when
pure water in borosilicate glass vials and measured right after prepa-   the silicic acid concentration approaches the solubility limit
ration (marked as “Fresh”). The same suspension was aged for             (Perry, 1989, 2003; Belton et al., 2012). These oligomeriza-
7 months and remeasured (marked as “Aged”). The aged suspen-             tion reactions are reversible (Tamahrajah and Brehm, 2016).
sion was centrifuged, the supernatant decanted, the aged particles       We assume that at high Si concentration, silicic acid and its
washed several times with pure water, resuspended in pure water          oligomers adsorb on the quartz surface, covering large parts
and measured again to examine the recovery of IN efficiency after        of the crystalline surface or at least a relevant fraction of the
aging (marked as “Recovery”). This procedure was done with three         IN active sites, thus hampering the IN activity of the quartz
different suspensions and their mean Thet and Fhet are reported next     samples aged in glass vials. Indeed, monolayer adsorption of
to each curve. All curves are normalized such that the areas under
                                                                         silicic acid on quartz has been observed under conditions su-
the heterogeneous and homogeneous freezing curves sum up to the
                                                                         persaturated with respect to crystalline quartz (Berger et al.,
same value.
                                                                         1994). Since leaching of Si from the glass vials is slow owing
                                                                         to the comparatively small exposed surface area, the freshly
                                                                         prepared suspensions of SA quartz in glass vials are not af-
Lasaga, 1994; Criscenti et al., 2006; Bickmore et al., 2008),            fected by an adsorbed layer, which is in accordance with our
but with a low efficiency.                                               experiments (see Figs. 5 and 6). The Si concentration in the
   The SA quartz as provided by the manufacturer contains                polypropylene tubes remains too low to give rise to an ad-
a minor share of amorphous material (4.5 ± 0.5 %), pro-                  sorbed layer on the quartz surface even during aging and the
duced most likely by grinding (Fubini et al., 1989). Be-                 IN activity is not hampered (see Fig. 6).
cause of the higher dissolution rate of amorphous silica com-               With time, the Si supersaturation with respect to quartz
pared to quartz, silicic acid should be released at a higher             should lead to crystalline quartz growth. We assume that co-
rate from the amorphous material (Crundwell, 2017). Since                valent bonds form between the adsorbed siliceous layer and
also the solubility of amorphous silica is higher (∼ 50 ppm              the quartz surface leading to a grown, intact quartz surface
Si at 25 ◦ C) than the one of quartz (1–3 ppm Si at 25 ◦ C)              with few defects. Since the emulsion freezing experiments
(Walther and Helgeson, 1977), quartz should grow at the ex-              of the SA quartz sample aged for 7 months in a glass vial
pense of amorphous silica over time when kept together in a              show hardly any IN activity even after washing with pure
closed vessel. After aging for 72 h in water (in a glass ves-            water (see Fig. 7), we conclude that slowly grown quartz sur-
sel), the amorphous fraction of the SA quartz sample indeed              faces are indeed not amorphous, but have a regular crystalline
showed a slight decrease, but still within experimental error            structure. These are barely IN active and only milling pro-
(4.0 ± 0.5 % for the aged sample compared with 4.2 ± 0.5 %               vides the quartz surface with IN active sites.
for the sample exposed to water for ∼ 15 min). This is in
agreement with the fact that the conversion of amorphous                 4.3.2   Dissolution and growth of quartz in solutions
silica to quartz is a slow process.
   ICP-MS measurements (see Tables S1 and S2 in the Sup-                 Under alkaline conditions both quartz dissolution and growth
plement) performed with the supernatant of a 0.5 wt % SA                 rates are increased. Indeed, centimeter-sized synthetic quartz
quartz suspension that was aged in pure water for 72 h in a              crystals are grown from amorphous silica on seed crystals
borosilicate glass vial shows a concentration of 11.9 ppm Si,            at high temperatures and pressures in highly alkaline con-

Atmos. Chem. Phys., 19, 6035–6058, 2019                                                   www.atmos-chem-phys.net/19/6035/2019/
You can also read