Development of the drop Freezing Ice Nuclei Counter (FINC), intercomparison of droplet freezing techniques, and use of soluble lignin as an ...
←
→
Page content transcription
If your browser does not render page correctly, please read the page content below
Atmos. Meas. Tech., 14, 3131–3151, 2021
https://doi.org/10.5194/amt-14-3131-2021
© Author(s) 2021. This work is distributed under
the Creative Commons Attribution 4.0 License.

Development of the drop Freezing Ice Nuclei Counter (FINC),
intercomparison of droplet freezing techniques, and use of
soluble lignin as an atmospheric ice nucleation standard
Anna J. Miller1, , Killian P. Brennan2, , Claudia Mignani3 , Jörg Wieder2 , Robert O. David4 , and
Nadine Borduas-Dedekind1,2,a
1 Institutefor Biogeochemistry and Pollutant Dynamics, ETH Zurich, Zurich, 8092 Switzerland
2 Institutefor Atmospheric and Climate Science, ETH Zurich, Zurich, 8092 Switzerland
3 Department of Environmental Sciences, University of Basel, Basel, 4056 Switzerland
4 Department of Geosciences, University of Oslo, Oslo, 0315 Norway
a now at: Department of Chemistry, University of British Columbia, Vancouver, V6T 1Z1, Canada
 These authors contributed equally to this work.

Correspondence: Nadine Borduas-Dedekind (borduas@chem.ubc.ca)

Received: 16 October 2020 – Discussion started: 11 November 2020
Revised: 12 February 2021 – Accepted: 15 February 202 – Published: 28 April 2021

Abstract. Aerosol–cloud interactions, including the ice nu-      exhaustive list of peer-reviewed DFTs, to which we added
cleation of supercooled liquid water droplets caused by ice-     our characterized and validated FINC.
nucleating particles (INPs) and macromolecules (INMs), are          In addition, we propose herein the use of a water-soluble
a source of uncertainty in predicting future climate. Because    biopolymer, lignin, as a suitable ice-nucleating standard. An
INPs and INMs have spatial and temporal heterogeneity in         ideal INM standard should be inexpensive, accessible, re-
source, number, and composition, predicting their concen-        producible, unaffected by sample preparation, and consistent
tration and distribution is a challenge requiring apt analyti-   across techniques. First, we compared lignin’s freezing tem-
cal instrumentation. Here, we present the development of our     perature across different drop freezing instruments, includ-
drop Freezing Ice Nuclei Counter (FINC) for the estimation       ing on DRINCZ and LINDA, and then determined an empir-
of INP and INM concentrations in the immersion freezing          ical fit parameter for future drop freezing validations. Sub-
mode. FINC’s design builds upon previous droplet freezing        sequently, we showed that commercial lignin has consistent
techniques (DFTs) and uses an ethanol bath to cool sample        ice-nucleating activity across product batches and demon-
aliquots while detecting freezing using a camera. Specifi-       strated that the ice-nucleating ability of aqueous lignin so-
cally, FINC uses 288 sample wells of 5–60 µL volume, has         lutions is stable over time. With these findings, we present
a limit of detection of −25.4 ± 0.2 ◦ C with 5 µL, and has an    lignin as a good immersion freezing standard for future DFT
instrument temperature uncertainty of ± 0.5 ◦ C. We further      intercomparisons in the research field of atmospheric ice nu-
conducted freezing control experiments to quantify the non-      cleation.
homogeneous behavior of our developed DFT, including the
consideration of eight different sources of contamination.
   As part of the validation of FINC, an intercomparison
campaign was conducted using an NX-illite suspension and         1   Introduction
an ambient aerosol sample from two other drop freez-
ing instruments: ETH’s DRoplet Ice Nuclei Counter Zurich         Aerosol–cloud interactions are a source of uncertainty in
(DRINCZ) and the University of Basel’s LED-based Ice Nu-         predicting future radiative forcing (IPCC, 2013). One im-
cleation Detection Apparatus (LINDA). We also tabulated an       portant aerosol–cloud interaction is the ice nucleation of
                                                                 supercooled liquid water droplets caused by ice-nucleating

Published by Copernicus Publications on behalf of the European Geosciences Union.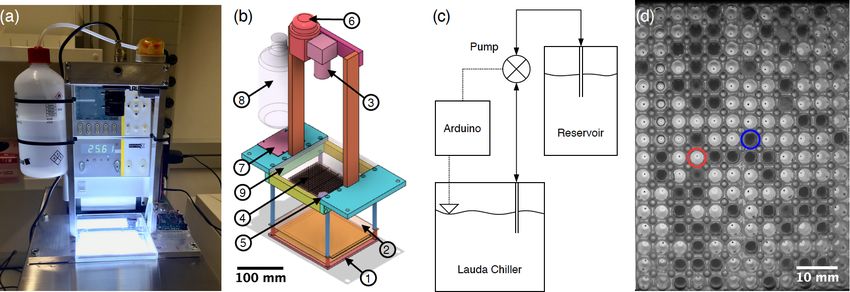
3132                                                 A. J. Miller et al.: Development of the drop Freezing Ice Nuclei Counter

particles (INPs). Heterogeneous freezing can occur at tem-          with liquid refrigerant (e.g., Hill et al., 2014; Kunert et al.,
peratures as warm as −1 ◦ C for certain bacterial (e.g., P.         2018; Steinke et al., 2020), or a liquid cooling bath (e.g.,
syringae; Morris et al., 2004) and fungal (e.g., Fusarium           Stopelli et al., 2014; Beall et al., 2017; Chen et al., 2018b;
species; Richard et al., 1996) INPs as well as for other cur-       David et al., 2019; Gute and Abbatt, 2020). Droplet gener-
rently unidentified warm INPs (Lloyd et al., 2020). INPs typ-       ation includes micropipetting (e.g., Hill et al., 2014; Chen
ically include solid surfaces such as dust and cellular mate-       et al., 2018a; David et al., 2019), shaking a vial to make
rial, which template ice, but recently reported ice-nucleating      an emulsion (e.g., Pummer et al., 2012; Wright and Pet-
macromolecules (INMs) are also capable of freezing su-              ters, 2013), piezo-driven droplet generation (e.g., Peckhaus
percooled water droplets (e.g., Pummer et al., 2012, 2015;          et al., 2016), microfluidic flow-focusing droplet generation
Felgitsch et al., 2018; Kunert et al., 2019). INMs are de-          (e.g., Stan et al., 2009; Reicher et al., 2018; Brubaker et al.,
fined here as operationally dissolved organic matter passing        2020; Tarn et al., 2020), and filled cavities on a chip (Häusler
through a 0.2 µL filter (Borduas-Dedekind et al., 2019). In the     et al., 2018). Droplet sizes and numbers vary by generation
absence of INPs and INMs, cloud droplets with an average            method; pipetting typically produces fewer microliter-sized
radius of 10 µm remain liquid until instantaneous (< 1 s) ho-       drops and microfluidic devices produce a larger number of
mogeneous nucleation at approximately −38 ◦ C (Koop and             nanoliter-sized droplets. Droplets can be placed either on
Murray, 2016; Kanji et al., 2017). The immersion freez-             plates coated in a hydrophobic substance such as petroleum
ing mode dominates heterogeneous freezing in mixed-phase            jelly or in plastic wells such as within a multiwell polymerase
clouds (Hoose et al., 2010; de Boer et al., 2011; Murray            chain reaction (PCR) tray. Freezing can be optically detected
et al., 2012; Westbrook and Illingworth, 2013; Tobo, 2016;          by manual visual inspection (e.g., Creamean et al., 2018; Hill
Kanji et al., 2017) and occurs when an INP or an INM nucle-         et al., 2014), with software to detect freezing optically (e.g.,
ates ice from within a supercooled water droplet (Storelvmo,        Stopelli et al., 2014; David et al., 2019; Perkins et al., 2020;
2017; Vali et al., 2015). For instance, Hoose et al. (2010) re-     Gute and Abbatt, 2020), with pyroelectrics (e.g., Cook et al.,
ported that more than 85 % of heterogeneous freezing events         2020), or by infrared thermal detection (e.g., Zaragotas et al.,
in their simulation occurred via the immersion mode. Fol-           2016; Harrison et al., 2018; Kunert et al., 2018).
lowing ice nucleation, the ice crystal concentration in mixed-         Each bench-top immersion freezing method has its advan-
phase clouds can rapidly increase through secondary ice pro-        tages and disadvantages, which vary depending on the sam-
cesses, affecting the ratio of liquid water to ice crystals. This   ples of interest. Herein, we compiled a summary of multi-
ratio impacts cloud microphysics and thus the lifetime, op-         drop bench-top immersion freezing instruments used for at-
tical density, and radiative properties of clouds, thereby im-      mospheric ice nucleation measurements published between
pacting the hydrological cycle and climate (Lohmann et al.,         2000 and 2020 (Table 1). Included in this summary is a brief
2016; Storelvmo, 2017; Zhao et al., 2019). Indeed, Heyms-           description of the operation of each instrument, the water
field et al. (2020) recently reported that up to 77 % of global     background with the reported protocol, the average drop size,
surface precipitation originates from the ice phase. Thus,          and the average number of droplets per experiment. Gener-
the ability to predict INP and INM concentrations can im-           ally, advantageous qualities include large operating temper-
prove estimates of primary and secondary ice concentrations         ature ranges, low background freezing temperatures, and a
in mixed-phase clouds and thus help reduce uncertainties in         high number of drops per experiment. As these types of in-
weather and climate projections (Murray et al., 2021).              struments are not yet commercial, we also built our own drop
   This prediction is challenging due to spatial and tempo-         Freezing Ice Nuclei Counter (FINC) using a cooling bath and
ral heterogeneity in the source, number, and composition of         an optical detection method. In comparison to the existing
INPs and INMs. In order to reduce uncertainties, advanced           methods, FINC fits well within the range of operating param-
methods are needed to quantify and characterize INPs and            eters with drop sizes of 5–60 µL, 288 drops per experiment,
INMs from ambient and laboratory samples. A variety of lab-         and background freezing at −25 ◦ C (Table 1). Noteworthy
oratory instruments has been developed to measure INPs in           features of FINC compared to existing methods are its au-
the immersion freezing mode. Methods include continuous-            tomation of the ethanol level, its use of 288 wells to increase
flow diffusion chambers (e.g., Rogers, 1988), single-particle       statistics, and its improved code for well detection and for
levitation apparatuses (e.g., Diehl et al., 2014), and bench-top    harmonizing the output data.
droplet freezing techniques (DFTs) (e.g., Hill et al., 2014).          With an increasing number of research groups developing
Bench-top methods vary in terms of many variables, includ-          DFTs, there is an ongoing search for suitable standards for
ing cooling method, droplet generation, droplet size, droplet       freezing temperature intercomparisons. A typical standard
number, freezing detection method, detectable freezing tem-         used to compare immersion freezing instruments is the min-
perature ranges, and measurement uncertainties. Cooling             eral dust NX-illite, a known ice-active mineral and a cheap
methods typically use either a cold stage (e.g., Wright and         and readily available material (Hiranuma et al., 2015a). How-
Petters, 2013; O’Sullivan et al., 2014; Budke and Koop,             ever, NX-illite measurements can differ by orders of magni-
2015; Tobo, 2016; Chen et al., 2018b, a; Häusler et al.,            tude across different instruments (Hiranuma et al., 2015a).
2018; Mignani et al., 2019; Tarn et al., 2020), a block cooled      This discrepancy may be due to NX-illite’s insolubility in

Atmos. Meas. Tech., 14, 3131–3151, 2021                                              https://doi.org/10.5194/amt-14-3131-2021
A. J. Miller et al.: Development of the drop Freezing Ice Nuclei Counter                                                                  3133

Figure 1. (a) Photograph of FINC. (b) Computer-aided design (CAD) software model of the aluminum and stainless-steel movable structure
placed inside the LAUDA bath. The circled numbers correspond to the following parts: (1) a chip-on-board LED array, (2) a thin polytetraflu-
oroethylene sheet, (3) a camera, (4) three clear polypropylene Piko™ PCR trays, (5) a level sensor, (6) a peristaltic pump, (7) an Arduino
board and a stepper motor driver, (8) an ethanol reservoir, and (9) a Plexiglas plate. (c) Flowchart of the bath leveler setup. (d) Image of two
of the three trays taken by the FINC camera showing the difference in light intensity between the liquid (circled in red) and frozen (circled
in blue) wells used for freezing temperature detection.

water, creating a suspension rather than a homogeneous solu-              litter and agricultural dust (Steinke et al., 2020; Bogler and
tion. In practice, NX-illite suspensions settle quickly, poten-           Borduas-Dedekind, 2020). Several other studies have shown
tially leading to a range of freezing temperatures. Cellulose             that plant materials, which may have included lignin, can be
has also been used as an intercomparison standard (Hiranuma               ice-active in immersion freezing (e.g., Conen et al., 2016;
et al., 2019), as it is the most abundant biopolymer in the               Felgitsch et al., 2018; Suski et al., 2018; Gute and Abbatt,
environment and can contribute to ice nucleation in clouds                2020).
below about −21 ◦ C (Hiranuma et al., 2015b). However, cel-                   Herein, we present (1) the development, characterization,
lulose is also a suspension in water. Snomax® has addition-               and validation of our home-built FINC for the quantification
ally been used as a bacterial ice-nucleating standard and con-            of INP and INM concentrations in the immersion freezing
sists of freeze-dried, irradiated cells from P. syringae (Wex             mode, (2) an intercomparison of DFTs to validate FINC, and
et al., 2015). Unfortunately, Polen et al. (2016) found that              (3) the use of soluble lignin as an intercomparison standard.
solutions of Snomax can have irreproducible ice-nucleating                As part of our intercomparison study with lignin, we show re-
activity over time, making it a rather poor standard.                     sults with two other drop freezing instruments: ETH Zurich’s
   An alternative to mineral dust, cellulose, and Snomax is               DRoplet Ice Nuclei Counter Zurich (DRINCZ; David et al.,
the use of a water-soluble organic material as a standard in              2019) and the University of Basel’s LED-based Ice Nucle-
immersion freezing experiments. Here, we show that com-                   ation Detection Apparatus (LINDA; Stopelli et al., 2014). We
mercial lignin, a complex organic polymer from the cell wall              conclude by recommending commercial lignin as a standard
structure of vascular plants (Ciesielski et al., 2020), can serve         to validate DFTs based on a detailed analysis of lignin’s re-
as a reproducible standard for ice nucleation across differ-              producibility and stable IN activity.
ent immersion freezing techniques. Indeed, lignin is a water-
soluble macromolecule with ice-nucleating activity, thereby
qualifying it as an INM (Pummer et al., 2015; Bogler and                  2     Instrument development
Borduas-Dedekind, 2020; Steinke et al., 2020). Furthermore,
lignin and its oxidation products are present in the atmo-                2.1     Building components
sphere and are emitted, for example, during agricultural har-
                                                                          2.1.1    Hardware
vesting and biomass burning in Houston, Texas, with typi-
cal plume concentrations of 149 ng m−3 (Myers-Pigg et al.,                The hardware design of FINC is based on DRINCZ (David
2016; Shakya et al., 2011). Lignin is also produced as a                  et al., 2019), its predecessors (Stopelli et al., 2014; Hill
by-product of an industrial process in which wood is con-                 et al., 2014), and earlier descriptions of water droplets placed
verted to wood pulp and subsequently used for paper prod-                 on oil-covered aluminum sheets over a cold plate, as de-
ucts (Harkin, 1969). Recent research has shown lignin to be               scribed, for example, in Vali and Stansbury (1966) and Vali
ice-active, albeit with colder freezing temperatures than leaf            (1995). FINC has a temperature-controlled ethanol cooling

https://doi.org/10.5194/amt-14-3131-2021                                                      Atmos. Meas. Tech., 14, 3131–3151, 2021
3134                                                               A. J. Miller et al.: Development of the drop Freezing Ice Nuclei Counter

Table 1. List of droplet freezing techniques (DFTs) ordered by year of first publication. Information includes the instrument name, a brief
description of the instrument, the freezing temperature of a water background freezing experiment according to the reported protocol (median
where available), the droplet size used, the number of droplets per experiment (drops/expt.), and the main references associated with the
instrument, including the reference in which the instrument was first published and, if applicable, a following reference with updates; “n.f.”
indicates information not found.

 Instrument name                 Brief description                           Water background   Drop size        Drops/expt.   References
                                                                             using reported
                                                                             protocol (◦ C)
 Flow cell microscopy tech-      Vapors condensed onto the bottom of a       −37                7–33 µm diam.    ∼ 65          Salcedo et al. (2000),
 nique for aerosol phase tran-   sample cell on aluminum cooling block;                                                        Koop et al. (2000a)
 sitions                         freezing monitored via microscope
 Droplet freezing technique      Particles deposited on a glass slide in     −37                120 µm diam.     < 100         Dymarska et al. (2006),
 (DFT)                           a sample cell on a cold stage, with                                                           Mason et al. (2015)
                                 droplets grown by water vapor; freezing
                                 monitored via microscope
 Microfluidic apparatus          Flow-focusing nozzle continuously           −37                80 µm diam.      >10 000       Stan et al. (2009)
                                 produces droplets in a stream of fluo-
                                 rocarbon across a seven-temperature-
                                 zone cold plate; freezing monitored via
                                 microscope
 FRankfurt Ice Deposition        Pipetted drops onto Vaseline-coated         −35                2 µL             ∼ 120         Bundke et al. (2008),
 freezinG Experiment – Tel       Peltier cold stage in low-pressure dif-                                                       Ardon-Dryer et al. (2011)
 Aviv University (FRIDGE-        fusion chamber; freezing monitored via
 TAU)                            CCD camera
 Picoliter and Nanoliter Nu-     Nebulized droplets encased in silicon       −37                0.25–1.7 pL;     ∼ 135 (pL);   Murray et al. (2010),
 cleation by Immersed Particle   oil on hydrophobic glass slides on alu-                        0.1–6 nL         ∼ 51 (nL)     O’Sullivan et al. (2014),
 Instrument (pico-NIPI, nano-    minum cold stage; freezing monitored
 NIPI)                           via microscope
 Vienna Optical Droplet Crys-    Water–oil emulsion pipetted onto a          −36                10–200 µm        n.f.          Pummer et al. (2012)
 tallization Analyzer            glass slide on a Peltier cold stage, all                       diam.
 (VODCA)                         contained in an airtight cell; freezing
                                 monitored via microscope
 Drop freezing apparatus for     Filter cutouts placed inside small tubes    −12                0.1 mL           108           Conen et al. (2012)
 filters                         with water, cooled in a water bath;
                                 freezing monitored by manual inspec-
                                 tion
 Microliter Nucleation by Im-    Drops pipetted onto a hydrophobic           −26                1 µL             40            Atkinson et al. (2013),
 mersed Particle Instrument      glass slide in humidity-controlled en-                                                        Whale et al. (2015)
 (microL-NIPI)                   closure on a cold stage; freezing mon-
                                 itored via camera
 North Carolina State Univer-    Emulsion of water in squalene placed        −34 to −36         400 pL–150 nL    300–1500      Wright et al. (2013),
 sity cold stage (NC State-CS)   on a glass slide resting in an aluminum                                                       Hiranuma et al. (2015a)
                                 dish on a thermoelectric element; freez-
                                 ing monitored via camera
 Microfluidic device for homo-   Microfluidically produced water-in-oil      −36 to −37         53–96 µm         > 1000        Riechers et al. (2013)
 geneous ice nucleation          emulsion on cryo-microscopy cold                               diam.
                                 stage; freezing monitored via micro-
                                 scope (alternatively frozen with differ-
                                 ential scanning calorimetry)
 LED-based Ice Nucleation        Sample in tubes held in polycarbonate       −15                40–400 µL        52            Stopelli et al. (2014)
 Detection Apparatus             tray atop an LED array submersed in
 (LINDA)                         a water–glycerin cooling bath; freezing
                                 monitored via camera
 Colorado State University Ice   Sample aliquots pipetted into two 96-       −25                50 µL            192           Hill et al. (2014),
 Spectrometer (CSU-IS)           well PCR trays cooled on custom cold                                                          Hiranuma et al. (2015a),
                                 blocks with N2 flow; freezing moni-                                                           Barry et al. (2021)
                                 tored via camera
 Bielefeld Ice Nucleation AR-    Droplets pipetted onto a glass slide with   n.f.               0.5–5 µL         36            Budke and Koop (2015)
 raY (BINARY)                    separated compartments atop a Peltier
                                 cold stage, all enclosed in a, N2 -purged
                                 chamber; freezing monitored via cam-
                                 era

Atmos. Meas. Tech., 14, 3131–3151, 2021                                                                     https://doi.org/10.5194/amt-14-3131-2021
A. J. Miller et al.: Development of the drop Freezing Ice Nuclei Counter 3135
Table 1. Continued.
Instrument name Brief description Water background Drop size Drops/expt. References
using reported
protocol (◦ C)
Water-Activity-Controlled Droplets pipetted onto a glass plate in −37 60–129 µm 30–50 Wilson et al. (2015)
Immersion Freezing Experi- a humidity-controlled aerosol condition- diam.
ment (WACIFE) ing cell, then sealed from ambient air and
cooled on a cold stage; freezing monitored
via microscope
National Institute of Polar Re- Drops pipetted onto a Vaseline-coated alu- −33 5 µL 49 Tobo (2016)
search Cryogenic Refrigera- minum plate cooled on a cryogenic refrig-
tor Applied to Freezing Test erator stage; freezing monitored via cam-
(NIPR-CRAFT) era
Karlsruhe Institute of Tech- Droplets printed on a silicon substrate by −36 215 ± 70 pL ≥ 1500 Peckhaus et al. (2016)
nology Cold Stage (KIT-CS) piezo-driven drop-on-demand generator,
and drops then covered in silicone oil and
placed on cold stage; freezing monitored
via CCD camera
Microplate partially sub- Droplets contained in 96-well microplates −17.3 150 µL 96–768 Zaragotas et al. (2016)
mersed in cooling liquid partially submersed in a cooling water–
alcohol bath; freezing monitored via in-
frared camera
Carnegie Mellon University Droplets of water in oil on a substrate in −27 to −28 1 or 0.1 µL 30–40 Polen et al. (2016),
Cold Stage (CMU-CS) aluminum chamber cooled with a thermo- Polen et al. (2018)
electric element; freezing monitored via
microscope
Microfluidic device and cold Microfluidically generated drops in oil on −37 35 µm diam. 200 Weng et al. (2016)
stage a glass slide on a cryostage; freezing mon-
itored via microscope camera
Automated Ice Spectrometer Drops in two 96-well PCR trays fitted into −25 to −27 50 µL 192 Beall et al. (2017)
(AIS) aluminum blocks fixed in a liquid cooling
bath, all enclosed in an acrylic box; freez-
ing monitored via camera
National Oceanic and Atmo- Drops pipetted onto Vaseline-coated cop- −30 2.5 µL 100 Creamean et al. (2018)
spheric Administration Drop per disk placed on a thermoelectric cold
Freezing Cold Plate (NOAA- plate and covered in a plastic dome; freez-
DFCP) ing monitored optically
Peking University Ice Nucle- Drops pipetted into compartments on a −26 1 µL 90 Chen et al. (2018a)
ation Array (PKU-INA) glass slide atop a cold stage in a N2 -
purged box; freezing monitored via CCD
camera
WeIzmann Supercooled Microfluidically produced droplet array −36 40 or 100 µm 550 (40 µm) or Reicher et al. (2018)
Droplets Observation on on a PDMS surface placed on a cryostage diam. 120 (100 µm)
Microarray (WISDOM) purged with N2 ; freezing monitored via
microscope camera
Twin-plate Ice Nucleation As- Droplets contained in four multiwell −25 3 µL 960 Kunert et al. (2018)
say (TINA) plates (2 × 96 and 2 × 384) placed on two (96-well),
custom aluminum cooling blocks; freez- −28
ing monitored via infrared camera (384-well)
Freezing on a chip Drops loaded on a silicon plate with −37.5 4–300 pL 25 Häusler et al. (2018)
etched cavities and set on thermoelec-
tric cooler in an N2 -flushed cell; freezing
monitored via camera
InfraRed Nucleation by Im- Drops pipetted into 96-well plate on a −22 50 µL 96 Harrison et al. (2018)
mersed Particles Instrument cold stage enclosed in a chamber; freez-
(IR-NIPI) ing monitored via infrared camera
https://doi.org/10.5194/amt-14-3131-2021 Atmos. Meas. Tech., 14, 3131–3151, 20213136 A. J. Miller et al.: Development of the drop Freezing Ice Nuclei Counter
Table 1. Continued.
Instrument name Brief description Water background Drop size Drops/expt. References
using reported
protocol (◦ C)
Ice Nucleation Droplet Array Samples placed in wells of a 96-well PCR −25 50 µL 96 Chen et al. (2018b)
(INDA) tray cooled in a cooling bath; freezing
monitored via CCD camera
Leipzig Ice Nucleation Array Droplets pipetted into compartments on a −30 1 µL 90 Chen et al. (2018b)
(LINA) glass slide and cooled on a Peltier ele-
ment; freezing monitored via CCD cam-
era
Microfluidic droplet freezing Microfluidically produced droplets in oil −35 83–99 µm 250–500 Tarn et al. (2018)
assay collected in microwells on glass slides diam.
placed on a Peltier cold stage in an air-
tight chamber; freezing monitored via mi-
croscope camera
Drop freeze assay experiment Droplets pipetted onto filters placed on a −30 1 µL ≤ 130 Price et al. (2018)
directly on exposed filters glass slide and cold stage in an N2 -purged
chamber; freezing monitored via camera
West Texas Cryogenic Re- Drops pipetted onto Vaseline-coated alu- −26 3 µL 49 Hiranuma et al. (2019)
frigerator Applied to Freezing minum plate and cooled on a cryogenic
Test (WT-CRAFT) refrigerator stage; freezing monitored via
camera
DRoplet Ice Nuclei Counter Droplets pipetted into 96-well PCR tray −22.5 50 µL 96 David et al. (2019)
Zurich (DRINCZ) submersed in ethanol cooling bath; freez-
ing monitored via camera
Cold stage to detect the most Ice crystals placed with ultrapure water on −25 3 µL 4 Mignani et al. (2019)
active INP in single crystals a copper cold plate, melted, and refrozen;
freezing monitored via manual inspection
“Store and create” microflu- Microfluidically generated droplets in oil −34 6 nL ≤ 720 Brubaker et al. (2020)
idic device in microwells of a PDMS chip placed on a
cold plate sealed with an acrylic lid; freez-
ing monitored via microscope camera
Pyroelectric thermal sensor Drops pipetted onto Vaseline-coated py- −27 1 µL 30 Cook et al. (2020)
for ice nucleation roelectric polymer atop a cooling block;
freezing monitored via pyroelectric ther-
mal sensor
University of Toronto Drop Drops pipetted into multiwell PCR trays −23 50 µL 48 Gute and Abbatt (2020)
Freezing Technique (UT- cooled in an ethylene glycol water bath;
DFT) freezing monitored via camera
Ice Nucleation SpEctrometer Drops pipetted into two 96-well PCR trays −20 50 µL 192 Steinke et al. (2020)
of the Karlsruhe Institute of cooled in custom cooling blocks; freezing Schiebel (2017)
Technology (INSEKT) monitored via camera
Lab-On-a-Chip Nucleation by Water-in-oil droplets mirofluidically gen- −36 80–100 µm > 1000 Tarn et al. (2020)
Immersed Particle Instrument erated in continuous flow and passed over diam.
(LOC-NIPI) a series of Peltier cold plates in an N2 -
purged container; freezing monitored via
microscope camera
Freezing Ice Nuclei Counter Drops pipetted into three 96-well Piko −25 5–60 µL 288 this work
(FINC) PCR trays submersed in ethanol cooling
bath; freezing monitored via camera
Atmos. Meas. Tech., 14, 3131–3151, 2021 https://doi.org/10.5194/amt-14-3131-2021A. J. Miller et al.: Development of the drop Freezing Ice Nuclei Counter 3137
bath (LAUDA Proline RP 845, Lauda-Königshofen) (Fig. 1a) a decrease in volume in the cooling bath and corresponds
in which a commercially available chip-on-board LED array to a 4.9 mm decrease in height, equivalent to approximately
(50W COB Panel Light, Cooleeon Lighting Tech) is sub- 300 mL of ethanol, between 0 and −25 ◦ C. To achieve re-
merged 20 cm deep (Fig. 1b-1). A thin polytetrafluoroethy- producible measurements, the ethanol level must submerge
lene sheet (Fig. 1b-2) acts as a diffuser mounted at a dis- the well throughout the experiment to avoid the formation of
tance of 2 cm above the light source. A camera (IMX179 vertical temperature gradients within the well (David et al.,
CMOS 8MP, ELP Free Driver) (Fig. 1b-3) mounted above 2019). In FINC, a constant ethanol level is maintained by
the bath images clear Piko™ PCR trays made of polypropy- adding and removing ethanol to the cooling bath via a peri-
lene (SPL0960, Thermo Fisher Scientific) (Fig. 1b-4) rest- staltic pump (Fig. 1c), thereby automating this process. The
ing on the frame at the bath’s surface. A level sensor binary level sensor outputs either a submerged or emerged
(LLE102000, Honeywell) (Fig. 1b-5) measures the height of status signal to the micro-controller, which then turns the
the ethanol in the bath, and a peristaltic pump (KAS-S10- pump in the corresponding direction: either moving ethanol
SE, Kamoer) (Fig. 1b-6) controlled by a micro-controller from the reservoir to the cooling bath during the experiment
(Leonardo, Arduino® ) (Fig. 1b-7) and powered by a stepper or removing ethanol from the bath back to the reservoir dur-
motor driver (TB6612, Adafruit) (Fig. 1b-7) moves ethanol ing warm-up at the end of the experiment (Fig. 1c). The lev-
between the LAUDA chiller bath and the ethanol reservoir eler does not need to be adjusted depending on the well vol-
(Fig. 1b-8) (Fig. 1c). A transparent 6 mm thick polymethyl ume used, as capillary action between the wells of the Piko
methacrylate (Plexiglas) plate (Fig. 1b-9) covers the Piko PCR tray ensures that all wells are submerged in ethanol as
PCR trays to avoid contamination of the wells, minimize long as the ethanol reaches the bottom of the wells. In all,
evaporative loss of ethanol, and limit condensation of water freezing measurements in FINC occur without manual in-
vapor into the ethanol (see Sect. 4.4.2). The components are tervention between measurements except for removing and
mounted to a removable aluminum frame with stainless-steel placing new Piko PCR trays.
rods, which is recommended to avoid corrosion over time
(Fig. 1a, b). Consumer-grade hardware was used as build- 2.2 Cooling rate
ing components when possible to reduce the overall instru-
ment cost while ensuring measurement accuracy and repro- The cooling bath temperature is controlled by a
ducibility. The bulk of the building costs are constrained to MATLAB® script ramping down at −1 ◦ C min−1 while
the ethanol cooling bath. The per-measurement cost is dom- the script records an image every 0.2 ◦ C. We prefer to record
inated by laboratory consumables, such as the Piko PCR images as a function of temperature rather than as a function
trays. of time to ensure that all measurements have identical
increments and can be easily averaged without interpolation.
2.1.2 PCR trays The cooling rate has been previously reported to have
a negligible effect on immersion freezing temperatures
The use of Piko PCR trays in FINC is an updated fea- (Wright et al., 2013), although much faster cooling can
ture of existing DFTs (Table 1). Specifically, standard PCR lead to temperature assignment uncertainties (Mason et al.,
trays contain 96 wells of 200 µL volume with dimensions of 2015). Thus, we chose a cooling rate matching atmospheric
127.76 mm by 85.34 mm, whereas the Piko PCR trays used updraft velocities and within the capacity of the LAUDA
in FINC contain 96 wells of 65 µL volume with dimensions bath’s cooling mechanism.
of 80.55 mm by 26.75 mm. The smaller dimensions allow for
the use of up to four 96-well Piko PCR trays instead of one 2.3 Freezing detection
standard PCR tray, resulting in improved freezing temper-
ature statistics per experiment. The trays are heated in an The freezing of the solutions inside the wells of the Piko
oven at 120 ◦ C for at least 1 h before use; this procedure PCR trays is detected by a change in light intensity pass-
improves reproducibility of background water experiments ing through the wells. Light passes through liquid water but
(Fig. S3). In FINC, we use three Piko PCR trays to optimize is scattered by ice, resulting in dark pixels in the image
the ethanol circulation and temperature spread across the 288 (Fig. 1d). Once the images are recorded over the course of
sample wells (see Sect. 3.2). one experiment, a circular Hough transform algorithm, de-
scribed in David et al. (2019), is implemented to locate the
2.1.3 Bath leveler wells on the images (Fig. S1). In the case of failure of the au-
tomatic well detection, we also developed a filtered algorithm
An automated bath leveler system was built to account for the output to identify the well positions, as well as a manual well
temperature dependence of the density of ethanol in FINC’s alignment grid, by selecting two wells in opposing corners.
cooling bath. For example, ethanol’s density at 0 and at After determining the well positions, the average pixel in-
−25 ◦ C is 806.7 and 826.3 g L−1 , respectively. This increase tensity is calculated for each well per image. This data anal-
in density at lower temperatures consequently translates to ysis generates an intensity profile as a function of temper-
https://doi.org/10.5194/amt-14-3131-2021 Atmos. Meas. Tech., 14, 3131–3151, 20213138 A. J. Miller et al.: Development of the drop Freezing Ice Nuclei Counter
2.4 Sample preparation and data analysis
Sample solutions were prepared within a laminar flow hood
(Labculture Class II BioSafety Cabinet, ESCO) to prevent
contamination from lab air. All glassware was pre-rinsed
three times with deionized water and acetone, and it was sub-
sequently dried in an oven at 120 ◦ C for at least 1 h. Sam-
ple solutions were then prepared using molecular-biology-
free reagent water (W4502, Sigma Aldrich, hereafter referred
to as background water). The solutions were then pipetted
from sterile plastic reservoirs (10141-922, VWR) with an
electronic multi-pipettor (4671040BT, Thermo Fisher Scien-
tific, USA) into pre-cleaned Piko PCR trays (see Sect. 2.1.2).
We recommend pipetting the solution volume in one dis-
pensing volume to minimize the formation of bubbles (see
Sect. 4.4.4). In addition, Barry et al. (2021) recently sug-
gested working with clean-room vinyl or polyethylene gloves
and aluminum-foil-coated surfaces.
When transporting the Piko PCR trays from the laminar
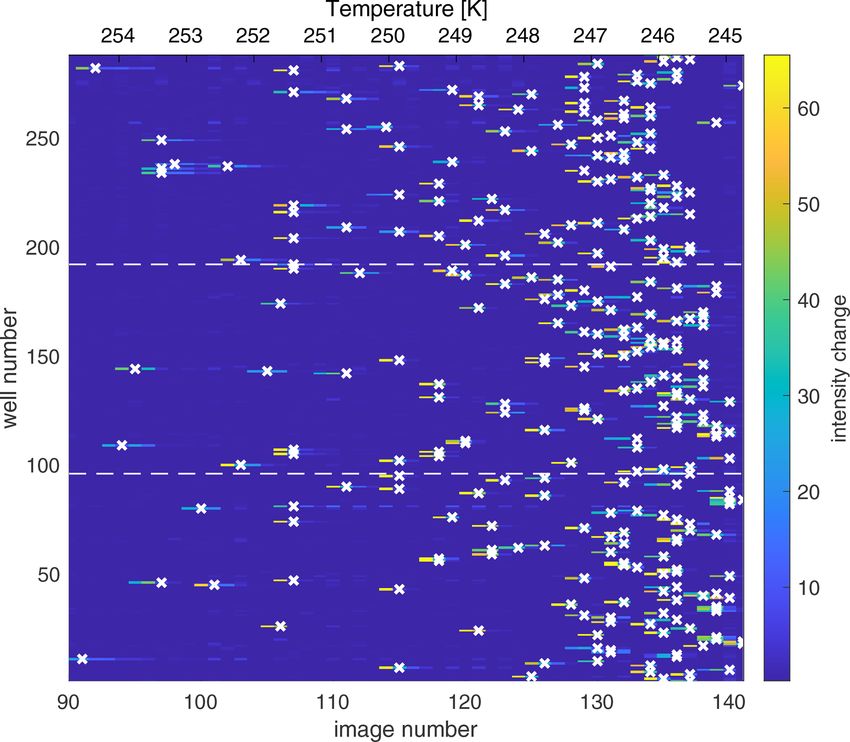
Figure 2. Map of the change in light intensity for each of the 288 flow hood to FINC, we placed cover films (Z369667, Sigma
wells (y axis) as a function of the image number (x axis), recorded
Aldrich) over the trays to avoid contamination from ambient
every 0.2 ◦ C and corresponding to temperature decreasing and ex-
perimental time progressing. (The first 90 images corresponding to
air. We removed the cover film before placing the trays in-
an interval of 18 ◦ C are excluded here for simplicity). The color side the ethanol bath in order to avoid problems with ethanol
scale represents the first derivative of the light intensity, with bright penetrating between the cover film and the Piko PCR tray by
colors indicating a sudden drop in light intensity associated with capillary effects. Furthermore, the Plexiglass hinged cover
freezing of the well. The algorithm assigns the freezing temperature over the trays prevents contamination from the air depositing
of the well to the greatest change in light intensity and is marked by into the wells.
a white “x”. The dashed horizontal lines indicate the tray bound- Note that our sample preparation procedure does not in-
aries between the three Piko PCR trays. The freezing experiment clude dilution series; we made the solutions with the required
depicts the results of a background water measurement. concentration from weighed solid. We have previously pro-
posed that lignin may be aggregating in solution, leading
to concentration-dependant ice nucleation behavior of INMs
ature. Then, the greatest change in intensity is attributed to (Bogler and Borduas-Dedekind, 2020). Based on this hy-
the freezing temperature and can be visualized as a temporal pothesis, we also do not conduct any data merging procedure
map (Fig. 2). For example, multiple changes in light intensity for different concentrations of INMs or drop volumes (for ex-
for one well over the course of an experiment or neighboring ample in Figs. S6 and S7). Furthermore, we do not subtract
wells freezing at the same temperature can flag an error (for background water values and prefer to show raw data in box
example, an object in front of the camera), requiring manual plot formats (as in Fig. 7; see also Brennan et al., 2020).
deletion of some images or a rerun of the measurement. A
color map of the freezing temperature is also generated to vi-
sually inspect any well location bias (Fig. S2) (David et al., 3 FINC’s uncertainties
2019). These data verification steps increase confidence in
the measurement. 3.1 Temperature uncertainty
The data output of FINC is a vector containing the freez-
ing temperature of each well. The vector is sorted by well A temperature calibration is necessary to correct for the dif-
column from top to bottom and left to right (see Fig. S1). ference between the recorded temperature of the LAUDA
In addition, a frozen fraction graph can be plotted by sort- bath and the temperature within each well. This calibra-
ing the freezing temperature vector and plotting it versus a tion was done using a multichannel thermocouple data log-
linearly spaced vector with values ascending from 0 to 1 in ger (HH-4208SD, Thermosense, UK), whereby each K-type
288 steps (example in Fig. S3). Based on the recommenda- thermocouple was placed inside a well filled with ethanol,
tion by Polen et al. (2018), the data are not trimmed, and with nine thermocouples evenly spaced across the three trays.
all 288 freezing temperature data points are plotted. These With the probes inside the wells, the bath temperature was
data manipulations retain all information available from the ramped down to −30 ◦ C at a rate of −1 ◦ C min−1 . The
experiment: freezing temperature and well location in one temperature of each thermocouple was recorded every 10 s
vector. (Twell ) and was plotted against the bath temperature recorded
Atmos. Meas. Tech., 14, 3131–3151, 2021 https://doi.org/10.5194/amt-14-3131-2021A. J. Miller et al.: Development of the drop Freezing Ice Nuclei Counter 3139
by the LAUDA system (Tbath ), as shown for one calibration 4 Freezing control experiments
experiment in Fig. S4. We then obtained the following cali-
bration equation (Eq. 1), wherein the slope and intercept are To test the capabilities of FINC and to characterize its
averaged values across three independent calibration experi- sources of uncertainties, we conducted several freezing con-
ments. trol experiments. We considered (1) the nonhomogeneous
freezing of the background water (Sects. 4.1 and 4.2), (2) the
Twell,avg = 0.95 × Tbath + 0.75 (1) roles of tray material and of droplet shape (Sect. 4.3),
(3) eight different sources of contamination (Sect. 4.4),
Multiple temperature calibrations conducted several (4) the choice of well volume (Sect. 4.5), and (5) the
months apart and by multiple users led to identical slopes, freezing-point depression of a dissolved organic matter so-
confirming reproducible temperature gradients and constant lution with different salt concentrations (Sect. 4.6).
ethanol circulation inside the bath. The mean of the standard
deviations of the nine evenly spaced thermocouples across 4.1 Nonhomogeneous freezing in FINC
three Piko PCR trays was 0.5 ◦ C for temperatures down to
−25 ◦ C (Table S1). We therefore report the temperature un- The use of Piko PCR trays allows for a range of sample
certainty for each well to be ± 0.5 ◦ C. volumes of 5–60 µL to be measured in FINC. Theoretically,
freezing rates of water droplets are dependent on the volume
3.2 Temperature spread across wells
of the droplet; smaller droplets freeze at lower temperatures
Furthermore, we tested different numbers of Piko PCR trays (O and Wood, 2016; Koop and Murray, 2016). Classical nu-
and different bath pump speeds to reduce the temperature cleation theory approximates interfacial tension between ice
bias across the three trays within an experiment (Sect. S3, and water, the activation energy of the phase transfer, and
Table S1). Tests with four trays led to the identification of the size of clusters and embryos (Ickes et al., 2015). In the
a vortex in the upper left corner of the ethanol bath, yield- atmosphere, 50 % of a droplet population of 5 µL volume
ing higher temperature biases across the trays (Table S1). is predicted to freeze spontaneously (< 1 s) and thus homo-
Overall, we determined that using three trays placed to the geneously at −31.81 ◦ C, whereas 60 µL volume is predicted
right to avoid the vortex, as well as pump speed setting 8, to freeze at −31.41 ◦ C (equations from Wang, 2013). How-
resulted in the smallest temperature biases of ± 0.46 ◦ C be- ever, these temperatures were never reached during FINC ex-
tween −10 and −15 ◦ C and of ± 0.55 ◦ C between −20 and periments with background water. Over the range of possi-
−25 ◦ C (Table S1, last row). Since the average of these val- ble sample volumes in FINC (5–60 µL), the mean T50 value
ues is precisely 0.5 ◦ C, we consider this value to be equal to of background water was −24.5 ± 0.8 ◦ C. DFTs tabulated
the temperature uncertainty described in Sect. 3.1. in Table 1, which use drops in the microliter range, also
show this nonhomogeneous freezing behavior. As argued in
3.3 FINC’s limit of detection the following sections, the difference in temperatures be-
tween atmospheric homogeneous freezing and background
It is necessary to accurately characterize the background of water freezing in FINC is likely due to a combination of tray
the instrument to determine the lowest trustworthy freezing material (Sect. 4.3.1), nonspherical drop shapes within the
temperature of a sample. FINC’s limit of detection (LOD) for wells (Sect. 4.3.2), and different sources of contamination
the freezing control experiments (Sect. 4) was calculated as (Sect. 4.4).
the mean of 10 replicates of background water experiments
using 5 µL droplets (Fig. S5). We calculated the mean tem- 4.2 Volume dependence on nonhomogeneous freezing
perature and 1 standard deviation (a spread of 1σ ) for each of
the 288 values, resulting in an LOD T50 of −25.4 ± 0.2 ◦ C. We further attempted to quantify these uncertainties by com-
We note that a value of ± 3σ can also be used and would lead paring the T50 values of background water over a range of
to a similar background T50 of −25.4 ± 0.4 ◦ C (Fig. S5). Fur- background water volumes. The mean T50 background wa-
thermore, we show the LOD as a box plot of the mean frozen ter values in FINC were −25.4 ± 0.1 ◦ C, −24.7 ± 0.1 ◦ C,
fraction (Fig. S5). The LOD depends on the experiment type, −23.4 ± 0.6 ◦ C, −24.5 ◦ C, −24.4 ± 0.2 ◦ C, −25.2 ◦ C, and
but as long as the appropriate background characterizations −25.3 ± 0.1 ◦ C for 5, 10, 20, 30 40, 50, and 60 µL, re-
are measured, e.g., artificial salt water, background water, spectively, across one to five replicates (Table S2; Fig. S6).
and water through a laboratory setup, the instrument can be Furthermore, if we collect all the freezing temperatures from
used to measure freezing temperatures of 288 wells at a time different volumes described in Sect. 4.1 and convert the data
(see Sect. 4.5 for a further discussion). Finally, we add that into INPs per volume, we observe a large spread in the freez-
no background corrections are made in our data analysis. ing behavior of the water (Fig. S7). Through both these data
analyses, we observe that experiments with 20 µL of back-
ground water freezes warmer and with a larger spread than all
other volumes. In Sects. 4.3 and 4.4, we investigate and dis-
https://doi.org/10.5194/amt-14-3131-2021 Atmos. Meas. Tech., 14, 3131–3151, 20213140 A. J. Miller et al.: Development of the drop Freezing Ice Nuclei Counter
cuss the potential sources of contamination involved in creat- through a 0.02 µm filter led to no difference in freezing be-
ing a volume-dependent nonhomogeneous freezing tempera- havior for the background water, except for our lab’s Milli-Q
ture, and we attempt to reason the unpredictable behavior of water, which is known to contain higher levels of organic car-
the 20 µL freezing experiments. bon (Fig. S8). We therefore chose to work with commercial
molecular-biology-free reagent water from Sigma Aldrich
4.3 Potential uncontrollable factors affecting without further purification.
nonhomogeneous freezing
4.4.2 Effect of condensing water vapor
4.3.1 Effect of tray material
We considered the possibility of water vapor condensing into
As described in detail in Li et al. (2012) and Polen et al. the wells from the air between the Plexiglass and the trays
(2018), the material interacting with the supercooled water during a measurement (Fig. S9). We calculated a maximum
droplets impacts their freezing. Indeed, the Piko PCR trays amount of condensable water vapor or, in other words, a
used in FINC are made of polypropylene and are therefore worst-case scenario in which if the volume of water vapor
a hydrophobic surface. Interestingly, hydrophobic surfaces corresponding to 90 % RH at 0 ◦ C between the Plexiglass and
have previously been observed to freeze at a warmer tem- the trays were to condense into liquid water inside a well,
perature than hydrophilic surfaces (Li et al., 2012). It is likely we would arrive at a value of 2 nL (Sect. S7). This volume
that the material of the tray is contributing to warmer temper- is small and unlikely to be able to condense into one well,
atures than expected for homogeneous freezing, but it is dif- freeze on a colder wall, and trigger nucleation within the
ficult to quantify the extent or percentage of this contribution well. We therefore conclude that this condensation process
to the overall nonhomogeneous freezing behavior. Imperfec- has a negligible effect on the well volume and thus on freez-
tions on the surface of each well could also induce nonhomo- ing temperatures.
geneous freezing behavior (Diao et al., 2011), and the use of
a larger number of wells could help provide reliable statistics. 4.4.3 Effect of the surface area of the tray
4.3.2 Effect of drop shape We considered whether a difference in the surface area to
volume ratio could explain the different T50 values observed
Due to the narrow width of the Piko PCR tray wells, the wa- for different volumes depicted in Fig. S6 (see Sect. S8 for the
ter in FINC’s wells is subjected to capillary forces. Indeed, calculations of surface areas of the wells). In particular, we
a concave meniscus is evident when examining the solution hypothesized that the warmer freezing of the 20 µL could be
in the Piko PCR trays, thereby exerting negative pressure due to the cone-like shape of the well (see the shape diagram
on the solution. It has been previously shown that the ho- in Fig. S10). However, the surface area to volume ratios of
mogeneous nucleation rate of water can be significantly in- the different volumes shown in Fig. S11 could not explain
creased when water is subjected to negative pressure (Mar- the variability or higher freezing temperatures observed, par-
colli, 2017, 2020). However, the negative pressure associ- ticularly with 20 µL. Note that the water vapor condensation
ated with the radius of the meniscus in the Piko wells is is inconsequential to changing the surface area to volume
on the order of 1–3 mm (see Table S3 and Fig. S10) and ratio (Sect. 4.4.2). Our running hypothesis for the peculiar
is likely negligible in terms of participating in nonhomo- higher freezing of the 20 µL experiments is the presence of
geneous freezing in FINC (Marcolli, 2017, 2020). Never- microscopic bubbles generated at the intersection of the two
theless, classical nucleation theory assumes spherical super- truncated cones when using this volume (Sect. 4.4.4).
cooled water droplets, whereas DFTs using a cold stage or
PCR trays rather investigate the freezing behavior of half- 4.4.4 Effect of air bubbles in the wells
spheres or cone-shaped supercooled droplets.
Air bubbles in the solutions within a well can be generated
4.4 Potential controllable sources of contamination during the pipetting process, particularly if the solution mix-
ture has surfactant-like properties (see the example image in
4.4.1 Effect of background water contamination Fig. S12). Bubbles are defined here as visible pockets of air
in the well. This problem is likely the result of a combination
Background water is a contentious issue in the field of atmo- of trapped air in the narrow wells during dispensing. Wells
spheric ice nucleation. An excellent overview of the chal- containing bubbles in FINC (Fig. S12) froze at warmer tem-
lenges of “cleaning up our water” is described in Polen peratures (Fig. S13). When the bubbles collapsed within the
et al. (2018). Upon their recommendation, we experimented well, they may have created a spike in negative pressure, in-
with different types of purified water and found that the ducing freezing at warmer temperatures than in the absence
molecular-biology-free reagent water (i.e., background wa- of bubbles (Marcolli, 2017). Therefore, bubbles should be
ter) gave the most reproducible measurements, consistent avoided by careful introduction of the solution into the well.
with David et al. (2019). Filtration of the background water Since bubbles associated with pipetting can be seen in the
Atmos. Meas. Tech., 14, 3131–3151, 2021 https://doi.org/10.5194/amt-14-3131-2021A. J. Miller et al.: Development of the drop Freezing Ice Nuclei Counter 3141
images, we can confirm the absence of bubbles in all images
used for the data plotted in Fig. S6. As no visible bubbles
were present, then this potential effect is unlikely to explain
the observed nonhomogeneous freezing behavior for differ-
ent well volumes. Nevertheless, microscopic bubbles invisi-
ble to the human eye and to the camera could be affecting the
nonhomogeneous freezing, including for the 20 µL volumes,
but to an unknown degree.
4.4.5 Effect of contamination from the tray
A series of experiments was conducted to test the leaching of
potential ice-active material from the Piko PCR trays into the
background water. To test this hypothesis, we placed 60 µL of
background water into one tray and then pipetted 50 µL of the
water out of each well and into another tray. If leaching was
indeed a problem, we would have observed higher freezing
temperatures in the tray containing the transferred solution.
However, we found no effect of freezing from leaching over
duplicate sets of experiments (Fig. S14). We conclude that Figure 3. The freezing-point depression effect of solutions of
material leaching from the Piko PCR trays is not a problem. 20 mg C L−1 of Jericho Ditch dissolved organic matter with in-
creasing concentrations of sodium chloride (NaCl). The x axis rep-
4.4.6 Effect of lab air contamination resents the concentration (mol L−1 ) of NaCl, and the y axis repre-
sents the T50 values, where 50 % of the wells were frozen. Tripli-
As discussed by Whale et al. (2015) and Stopelli et al. (2014), cate experiments were done for concentrations of 0, 1, 2, and 3 M of
NaCl, marked with red crosses. Note that the T50 values for the ex-
the concept of an open droplet system can be prone to fur-
periments at 0 mol L−1 are identical and thus overlap. Experimental
ther contamination from the surrounding air. We have built data were compared to Blagden’s law (grey dashed line), which de-
upon the authors’ recommendations by using a laminar flow scribes the freezing-point depression phenomenon. All temperature
hood, placing a cover film on the top of the Piko PCR tray be- measurements have an uncertainty of ± 0.5 ◦ C.
tween the flow hood and FINC, and having a Plexiglass cover
on FINC to minimize deposition of airborne contaminants.
Furthermore, we calculated the surface area of the solution 4.6 Freezing-point depression
exposed to air but observed no trend related to the nonho-
mogeneous freezing behavior for different well volumes (see Inorganic salts have a freezing-point depression effect on wa-
Table S3). ter’s freezing temperature (e.g., Koop et al., 2000b). The ef-
fect is described in general by the relationship in Eq. (2),
4.5 Volume of solution per well discussion and commonly known as Blagden’s law:
recommendation
1Tf = Kf × bb , (2)
Based on Sects. 4.1, 4.2, 4.3, and 4.4, it remains difficult to
quantify the contribution of each possible source of contam- where 1Tf is the freezing-point depression,
ination to nonhomogeneous freezing. This difficulty appears Kf is the cryoscopic constant of the solvent
to be a combination of uncontrollable (Sect. 4.3) and con- (Kf,water = 1.86 K kg mol−1 ), and bb is the molality of
trollable factors (Sect. 4.4), and this difficulty has been pre- the solute (Atkins and de Paula, 2011). To further character-
viously addressed in Polen et al. (2018). Nevertheless, the ize FINC, we tested the ice nucleation activity of solutions
pre-treatment of the trays (see Fig. S3), the use of a lami- of dissolved organic matter (DOM) and sodium chloride
nar flow hood, and the use of molecular-biology-free reagent (NaCl; 31 434, Sigma Aldrich). The DOM solutions were
water allowed for reproducible background water measure- at concentrations of 20 mg C L−1 (milligrams of carbon
ments. In all, the recommended well volume while working per liter) and were samples obtained from Jericho Ditch,
with FINC depends on the research question. One should use part of the Great Dismal Swamp in Suffolk, Virginia, USA
a larger volume to study active, but less abundant, INPs and (sample collection reported in Borduas-Dedekind et al.,
INMs, whereas one should use a smaller volume to study less 2019). Jericho Ditch DOM is ice-active, with a T50 value
active, but more abundant, INPs and INMs. If the samples of −10.6 ± 0.0 ◦ C (Fig. 3), and is therefore a suitable
have high concentrations of salts leading to freezing-point sample for freezing-point depression tests. We determined
depression, for instance, then a larger volume might be nec- a linear freezing-point depression effect with increasing
essary to remain in the operating range of the LAUDA bath. concentrations of salt, as expected by the theoretical values
https://doi.org/10.5194/amt-14-3131-2021 Atmos. Meas. Tech., 14, 3131–3151, 20213142 A. J. Miller et al.: Development of the drop Freezing Ice Nuclei Counter
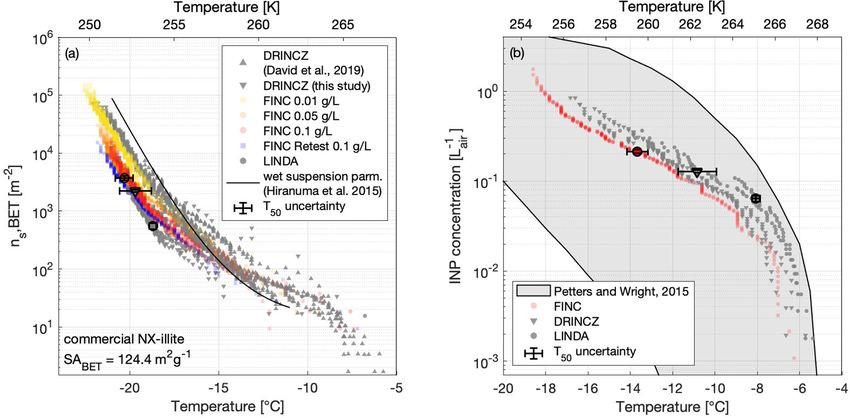
Figure 4. (a) The active surface-site density ns,BET of NX-illite suspensions measured on FINC (yellow, orange, red dots), DRINCZ (grey
downward triangles), and LINDA (grey dots) during the intercomparison. The wet suspension parameterization by Hiranuma et al. (2015a)
is plotted for reference. Concentrations used were 0.1, 0.05, and 0.01 g L−1 of NX-illite. The DRINCZ illite measurements as reported in
David et al. (2019) are also shown for comparison (grey upwards triangles). ns,BET was calculated using a BET surface area of 124.4 m2 g−1
(Hiranuma et al., 2015a). Error bars in the x and y direction are shown on the T50 value for one sample each from DRINCZ, LINDA, and
FINC (see Supplement Sect. S11 for details). Note that the y-direction uncertainties do not extend beyond the marker. (b) INP concentrations
(L−1
air ) of an ambient aerosol sample solution from Zurich, Switzerland, measured on FINC (red dots), DRINCZ (grey triangles), and LINDA
(grey dots). Ambient aerosols were collected with a Coriolis µ impinger for 20 min at 300 L min−1 . The sample was split for measurements
on each of the immersion freezing instruments. One measurement run was done with FINC; two runs each were done with DRINCZ and
LINDA. The grey shaded area denotes the range of INP concentrations from precipitation and cloud water samples compiled by Petters and
Wright (2015). Error bars in the x and y direction are shown on the T50 value for one sample each from DRINCZ, LINDA, and FINC (see
Supplement Sect. S11 for details). Note that the y-direction uncertainties do not extend beyond the marker.
calculated according to Blagden’s law (Fig. 3; Eq. 2). Our 5.1 Experimental details of DRINCZ and of LINDA
saline DOM solutions measured with FINC match Blagden’s
law well. However, a small deviation was observed with
a 3 M NaCl solution, likely due to activity coefficients DRINCZ was operated using a freshly shaken sample poured
deviating from unity. This experiment further validates the into a sterile reservoir. Then, 96 droplets of 50 µL were trans-
instrument’s capabilities to be used in a droplet freezing ferred into a 96-well PCR polypropylene tray (732-2386,
technique (Fig. 3). VWR, USA) using an eight-channel multi-pipette. The tray
was sealed with a transparent foil and immediately analyzed
with DRINCZ as described in David et al. (2019). LINDA
5 Drop freezing instrument intercomparison and was operated using a total of 5.2 mL per experiment, and
validation of FINC each sample was shaken by hand and immediately pipetted
under a laminar flow hood (AURA Mini, EuroClone) into
To validate FINC against other similar and peer-reviewed 52 microtubes (0.5 mL Eppendorf Safe-Lock Tubes) using
DFTs, we conducted an intercomparison study with ETH’s a repeater pipette (Stepper TM 411, Socorex) and bioproof
DRINCZ (David et al., 2019) and the University of Basel’s syringes (Ecostep TM, sterilized, single wrapped, bioproof;
LINDA (Stopelli et al., 2014) (Sect. 5.1). Here, we report the range 50–500 µL). Each droplet contained 100 µL of the sam-
comparison measurements using NX-illite (Sect. 5.2) and an ple solution and was measured with LINDA according to
ambient aerosol sample (Sect. 5.3). Stopelli et al. (2014).
All samples for the intercomparison were prepared at ETH
Zurich on 10 July 2019. On the following day, measurements
with all three instruments were conducted. As LINDA was
located in Basel, one batch of aliquots was transported in
Atmos. Meas. Tech., 14, 3131–3151, 2021 https://doi.org/10.5194/amt-14-3131-2021A. J. Miller et al.: Development of the drop Freezing Ice Nuclei Counter 3143
a cooler by train in the morning from the preparation loca- mon outcome of NX-illite suspensions (e.g., David et al.,
tion (in Zurich) to the measurement location (in Basel). For 2019; Harrison et al., 2018; Beall et al., 2017). We hypoth-
background measurements, purchased, bottled molecular- esize that this spread is due to the heterogeneity of the sus-
biology-free reagent water (Sigma-Aldrich, W4502-1L) was pensions; the NX-illite particles can settle and sediment to
used (background measurements reported in Fig. S15), and the bottom of the wells, reducing the available surface area to
no background corrections were made. nucleate ice. Furthermore, sedimentation increases with con-
centration, consistent with the observation of lower ns,BET
5.2 NX-illite intercomparison values at higher concentrations (Fig. 4a). To further test
this hypothesis, we retested the 0.1 g L−1 solution on FINC
NX-illite has been repeatedly used as a standard to com- 8 months later and found that the ns,BET values had decreased
pare ice nucleation instruments (e.g., Hiranuma et al., by approximately a factor of 5 at −20 ◦ C (Fig. 4a, sample
2015a). Commercial NX-illite solutions of 0.01, 0.005, and FINC retest in blue). This change in ns,BET values suggests
0.001 % wt (or 0.1, 0.05, and 0.01 g of NX-illite per 1 L that NX-illite suspensions are not stable over time, consistent
of water, respectively) were measured by FINC, DRINCZ, with mineral dust experiments demonstrating ion exchange
and LINDA during an intercomparison experiment day on abilities in solution over time (Kumar et al., 2019). Nev-
11 July 2019 (Fig. 4a). The three instruments measured the ertheless, the results of this intercomparison with NX-illite
same suspension; one suspension of each concentration was support the validation of FINC as a suitable instrument for
split into several sterile Falcon tubes (14-432-22, Thermo quantifying ice-nucleating activity in the immersion freez-
Fisher Scientific, USA). The Falcon tubes were shaken im- ing mode, as well as strengthening our proposal for a more
mediately prior to pipetting, and the filled PCR trays were not solution-stable standard.
left to sit more than a few minutes prior to the freezing exper-
iment. We calculated, according to Eq. (3) (Vali, 1971, 2019), 5.3 Ambient aerosol intercomparison
the ice-active surface-site density (ns,BET ), where BET stands
for the Brunauer–Emmett–Teller technique, a commonly Next, we measured the INP concentration of an ambi-
used technique to measure particle surface areas (Brunauer ent aerosol sample during the intercomparison study with
et al., 1938): DRINCZ and LINDA. Ambient aerosols were collected with
a Coriolis µ air sampler (Bertin Technologies, France), an
ln[1 − FF(T )]
ns,BET (T )[m−2 ] = − , (3) instrument designed for outdoor monitoring of bio-aerosols
SABET × Cillite × Vwell such as pollen and spores (Gómez-Domenech et al., 2010;
where FF(T ) is the frozen fraction at each freezing tem- Carvalho et al., 2008). The sample was collected for taq =
perature, SABET is the BET-determined surface area of the 20 min at a flow rate of Q = 300 L min−1 on 10 July 2019 on
NX-illite particles (124.4 m2 g−1 ; Hiranuma et al., 2015a), the terrace of the Institute for Atmospheric and Climate Sci-
Cillite is the mass concentration of NX-illite, and Vwell is ence at ETH Zurich in Switzerland. The initial sample vol-
the volume in each well (Vwell = 30 µL for FINC, 50 µL ume v = 15 mL was further diluted with a dilution factor of
for DRINCZ, and 100 µL for LINDA). The uncertainties in DF = 3.7 to obtain enough volume to split into sterile Falcon
ns,BET include a 1 % error in SABET (Broadley et al., 2012), tubes and brought to FINC, DRINCZ, and LINDA for mea-
1 % error in Cillite , 1 % error in Vwell,DRINCZ , 0.5 % error in surement the following day. The INP concentration per liter
Vwell,LINDA , 8 % error in Vwell,FINC (well volume errors are of air was calculated by Eq. (4).
based on error in pipettes), and an error of ±1 in the num- ln[1 − FF(T )] DF × v
ber of frozen wells. Uncertainty calculations are detailed in INP(T )[L−1
air ] = − × (4)
Vwell taq × Q
Sect. S11 and plotted in Fig. 4a as vertical error bars on the
T50 values for one sample from each instrument. The uncertainties associated with the INP concentrations are
We additionally compare these measurements with NX- plotted in Fig. 4b as vertical error bars on the T50 values for
illite solutions measured on DRINCZ in 2018 (David et al., one sample from each instrument, and the calculations are
2019) and with the parameterization from Hiranuma et al. described in Section S11. The uncertainties include 1 % error
(2015a) (Fig. 4a). in Vwell,DRINCZ , 0.5 % error in Vwell,LINDA , and 8 % error in
The FINC measurement spread at −15 ◦ C is from 68– Vwell,FINC (well volume errors are based on error in pipettes),
209 m−2 and grows to 2600–9200 m−2 at −20 ◦ C. The Hi- as well as an error of ±1 in the number of frozen wells, an er-
ranuma et al. (2015a) parameterization fits well within the ror in the flow rate of the Coriolis impinger of ±10 L min−1 ,
FINC measurements above −17 ◦ C and deviates up to a fac- and an error of ±0.5 mL in the final Coriolis sample volume.
tor of 4.8 at −21 ◦ C. Between FINC, DRINCZ, and LINDA, The INP concentration in the aerosol sample as a function
the spread was a factor of 6 at −15 ◦ C and a factor of 7.5 of temperature agreed well between the instruments, with the
at −20 ◦ C. The DRINCZ measurements from David et al. advantage of FINC being able to achieve lower temperature
(2019) are up to 1 order of magnitude higher than those re- measurements than DRINCZ and LINDA due to the smaller
ported here (Fig. 4a). Indeed, the spread of ns,BET is a com- well volume (Fig. 4b, and see Sect. 4.5). The measurements
https://doi.org/10.5194/amt-14-3131-2021 Atmos. Meas. Tech., 14, 3131–3151, 2021You can also read


