Identification of human glucocorticoid response markers using integrated multiomic analysis from a randomized crossover trial - eLife
←
→
Page content transcription
If your browser does not render page correctly, please read the page content below
RESEARCH ARTICLE

                                        Identification of human glucocorticoid
                                        response markers using integrated multi-
                                        omic analysis from a randomized
                                        crossover trial
                                        Dimitrios Chantzichristos1,2*, Per-Arne Svensson3,4, Terence Garner5,
                                        Camilla AM Glad1,2, Brian R Walker6,7, Ragnhildur Bergthorsdottir1,2,
                                        Oskar Ragnarsson1,2, Penelope Trimpou1,2, Roland H Stimson7,
                                        Stina W Borresen8,9, Ulla Feldt-Rasmussen8,9, Per-Anders Jansson10,
                                        Stanko Skrtic1,11, Adam Stevens5†, Gudmundur Johannsson1,2†
                                        1
                                          Department of Internal Medicine and Clinical Nutrition, Institute of Medicine at
                                        Sahlgrenska Academy, University of Gothenburg, Gothenburg, Sweden;
                                        2
                                          Endocrinology, Diabetology and Metabolism, Sahlgrenska University Hospital,
                                        Gothenburg, Sweden; 3Department of Molecular and Clinical Medicine, Institute of
                                        Medicine at Sahlgrenska Academy, University of Gothenburg, Gothenburg, Sweden;
                                        4
                                          Institute of Health and Care Sciences, Sahlgrenska Academy, University of
                                        Gothenburg, Gothenburg, Sweden; 5Division of Developmental Biology & Medicine,
                                        Faculty of Biology, Medicine and Health, University of Manchester, Manchester,
                                        United Kingdom; 6Clinical and Translational Research Institute, Newcastle
                                        University, Newcastle upon Tyne, United Kingdom; 7BHF/University Centre for
                                        Cardiovascular Science, University of Edinburgh, Edinburgh, United Kingdom;
                                        8
                                          Department of Medical Endocrinology and Metabolism, Copenhagen University
                                        Hospital, Copenhagen, Denmark; 9Department of Clinical Medicine, Faculty of
                                        Health and Medical Sciences, University of Copenhagen, Copenhagen, Denmark;
*For correspondence:                    10
dimitrios.chantzichristos@gu.se
                                           Wallenberg Laboratory, Department of Molecular and Clinical Medicine, Institute
†
                                        of Medicine at Sahlgrenska Academy, University of Gothenburg, Gothenburg,
 These authors contributed
                                        Sweden; 11Innovation Strategies and External Liaison, Pharmaceutical Technologies
equally to this work
                                        and Development, Gothenburg, Sweden
Competing interest: See
page 23
Funding: See page 23
                                        Abstract
Received: 18 August 2020
Accepted: 25 February 2021              Background: Glucocorticoids are among the most commonly prescribed drugs, but there is no
Published: 06 April 2021                biomarker that can quantify their action. The aim of the study was to identify and validate
                                        circulating biomarkers of glucocorticoid action.
Reviewing editor: Arduino A
                                        Methods: In a randomized, crossover, single-blind, discovery study, 10 subjects with primary
Mangoni, Flinders Medical
Centre, Australia                       adrenal insufficiency (and no other endocrinopathies) were admitted at the in-patient clinic and
                                        studied during physiological glucocorticoid exposure and withdrawal. A randomization plan before
    Copyright Chantzichristos et
                                        the first intervention was used. Besides mild physical and/or mental fatigue and salt craving, no
al. This article is distributed under
                                        serious adverse events were observed. The transcriptome in peripheral blood mononuclear cells
the terms of the Creative
                                        and adipose tissue, plasma miRNAomic, and serum metabolomics were compared between the
Commons Attribution License,
which permits unrestricted use          interventions using integrated multi-omic analysis.
and redistribution provided that        Results: We identified a transcriptomic profile derived from two tissues and a multi-omic cluster,
the original author and source are      both predictive of glucocorticoid exposure. A microRNA (miR-122-5p) that was correlated with
credited.

Chantzichristos et al. eLife 2021;10:e62236. DOI: https://doi.org/10.7554/eLife.62236                                               1 of 39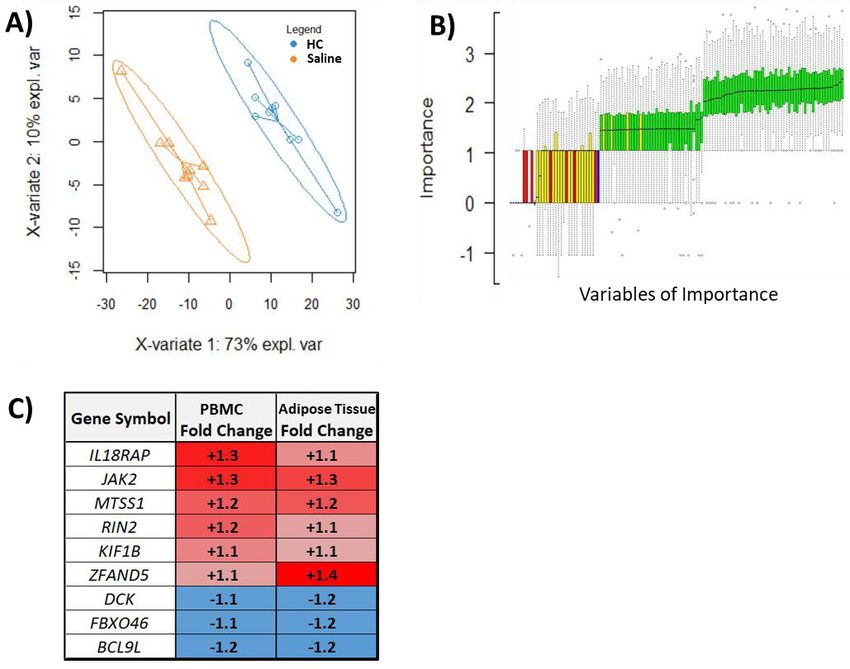
Research article                                                                       Computational and Systems Biology Medicine

                                    genes and metabolites regulated by glucocorticoid exposure was identified (p=0.009) and
                                    replicated in independent studies with varying glucocorticoid exposure (0.01  p0.05).
                                    Conclusions: We have generated results that construct the basis for successful discovery of
                                    biomarker(s) to measure effects of glucocorticoids, allowing strategies to individualize and optimize
                                    glucocorticoid therapy, and shedding light on disease etiology related to unphysiological
                                    glucocorticoid exposure, such as in cardiovascular disease and obesity.
                                    Funding: The Swedish Research Council (Grant 2015-02561 and 2019-01112); The Swedish federal
                                    government under the LUA/ALF agreement (Grant ALFGBG-719531); The Swedish Endocrinology
                                    Association; The Gothenburg Medical Society; Wellcome Trust; The Medical Research Council, UK;
                                    The Chief Scientist Office, UK; The Eva Madura’s Foundation; The Research Foundation of
                                    Copenhagen University Hospital; and The Danish Rheumatism Association.
                                    Clinical trial number: NCT02152553.

                                    Introduction
                                    Glucocorticoids (GCs) have a key role in the metabolic, vascular, and immunological response to
                                    stress (Cain and Cidlowski, 2017; Oster et al., 2017). GC secretion from the adrenal gland is under
                                    tight dynamic control by the hypothalamic–pituitary–adrenal axis and is regulated in a classic circa-
                                    dian pattern (Cain and Cidlowski, 2017; Oster et al., 2017). Most actions of GCs are mediated by
                                    the ubiquitously expressed GC receptor (Cain and Cidlowski, 2017; Oster et al., 2017). The tissue-
                                    specific effects of GCs are regulated by many local factors, including pre-receptor metabolism of
                                    GCs and the interaction of the GC receptor with tissue-specific transcription factors, or through non-
                                    genomic mechanisms (Cain and Cidlowski, 2017; Oster et al., 2017). As a result of this complexity,
                                    circulating levels of cortisol relate poorly to tissue action of cortisol, and serum cortisol therefore has
                                    limited value as a biomarker for GC action (Karssen et al., 2001).
                                        GCs are among the most commonly prescribed drugs, and GC treatment remains a cornerstone
                                    in the management of many rheumatic and inflammatory diseases despite the introduction of mod-
                                    ern disease-modifying antirheumatic drugs and biological immunomodulatory treatment
                                    (Smolen et al., 2017). GC replacement is essential for survival in patients with various forms of adre-
                                    nal insufficiency (Johannsson et al., 2015). However, metabolic and other side effects of GC treat-
                                    ment or replacement are common (Björnsdottir et al., 2011; Fardet et al., 2012), indicating that
                                    current methods to monitor their action and tailor their treatment are inadequate. Unphysiological
                                    GC exposure has been implicated in the etiology of several common diseases such as type 2 diabe-
                                    tes mellitus, hypertension, abdominal obesity, and cardiovascular disease (Ragnarsson et al., 2019).
                                        Against this background, it is highly desirable to be able to measure and quantify GC action as
                                    this might be useful to refine current GC therapy. Biomarkers of GC action will also provide potential
                                    mechanistic understanding for the role of GCs in the etiology of many common diseases. Previous
                                    attempts to identify biomarkers using metabolomics have identified circulating metabolites associ-
                                    ated with GC exposure (Alwashih et al., 2017a; Alwashih et al., 2017b). Integrated multi-omic
                                    analysis provides increased robustness over analysis of individual ‘omic data sets (Ideker et al.,
                                    2011). In particular, the identification of groups within one ‘omic ‘layer’ with shared co-regulation
                                    within another ‘omic layer implies a functional relationship that can be used both to assess the mech-
                                    anistical relevance and to support the identification of biomarkers (Karczewski and Snyder, 2018;
                                    Misra et al., 2018).
                                        The aim of this exploratory study was to define multi-omic patterns derived from independent tis-
                                    sues related to GC action and to use these patterns to search for clinically applicable circulating bio-
                                    markers of GC action. Subjects with primary adrenal insufficiency, Addison’s disease, lack GC
                                    production from the adrenal cortex and can therefore be considered a human GC ‘knock-down’
                                    model (Figure 1A). An experimental study design including subjects with Addison’s disease, stan-
                                    dardizing for diurnal variation and food intake, allowed a within-individual comparison between
                                    physiological GC exposure and GC withdrawal (Figure 1B). A multi-omic analysis strategy combining
                                    data from gene expression in circulation (peripheral blood mononuclear cells [PBMCs]) and an
                                    important metabolic tissue, adipose tissue, integrated with circulating microRNAs (miRNAs) and
                                    metabolites was used to identify putative biomarkers. The strongest putative biomarkers were then
                                    replicated in independent study groups with different GC exposure.

Chantzichristos et al. eLife 2021;10:e62236. DOI: https://doi.org/10.7554/eLife.62236                                                   2 of 39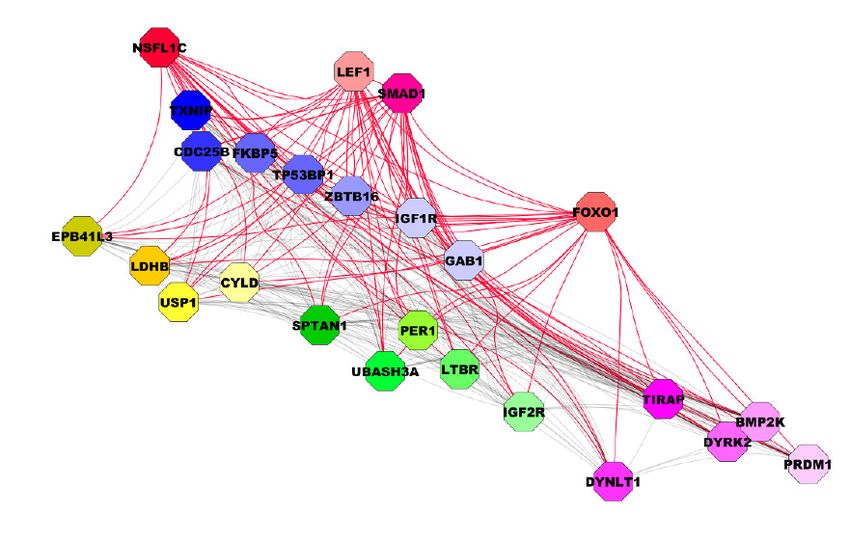
Research article                                                                     Computational and Systems Biology Medicine

                                    eLife digest Several diseases, including asthma, arthritis, some skin conditions, and cancer, are
                                    treated with medications called glucocorticoids, which are synthetic versions of human hormones.
                                    These drugs are also used to treat people with a condition call adrenal insufficiency who do not
                                    produce enough of an important hormone called cortisol. Use of glucocorticoids is very common,
                                    the proportion of people in a given country taking them can range from 0.5% to 21% of the
                                    population depending on the duration of the treatment. But, like any medication, glucocorticoids
                                    have both benefits and risks: people who take glucocorticoids for a long time have an increased risk
                                    of diabetes, obesity, cardiovascular disease, and death.
                                        Because of the risks associated with taking glucocorticoids, it is very important for physicians to
                                    tailor the dose to each patient’s needs. Doing this can be tricky, because the levels of
                                    glucocorticoids in a patient’s blood are not a good indicator of the medication’s activity in the body.
                                    A test that can accurately measure the glucocorticoid activity could help physicians personalize
                                    treatment and reduce harmful side effects.
                                        As a first step towards developing such a test, Chantzichristos et al. identified a potential way to
                                    measure glucocorticoid activity in patient’s blood. In the experiments, blood samples were collected
                                    from ten patients with adrenal insufficiency both when they were on no medication, and when they
                                    were taking a glucocorticoid to replace their missing hormones. Next, the blood samples were
                                    analyzed to determine which genes were turned on and off in each patient with and without the
                                    medication. They also compared small molecules in the blood called metabolites and tiny pieces of
                                    genetic material called microRNAs that turn genes on and off.
                                        The experiments revealed networks of genes, metabolites, and microRNAs that are associated
                                    with glucocorticoid activity, and one microRNA called miR-122-5p stood out as a potential way to
                                    measure glucocorticoid activity. To verify this microRNA’s usefulness, Chantzichristos et al. looked at
                                    levels of miR-122-5p in people participating in three other studies and confirmed that it was a good
                                    indicator of the glucocorticoid activity.
                                        More research is needed to confirm Chantzichristos et al.’s findings and to develop a test that
                                    can be used by physicians to measure glucocorticoid activity. The microRNA identified, miR-122-5p,
                                    has been previously linked to diabetes, so studying it further may also help scientists understand
                                    how taking glucocorticoids may increase the risk of developing diabetes and related diseases.

                                    Results
                                    Clinical experimental study
                                    Patient characteristics
                                    Eleven subjects with well-defined Addison’s disease and no other endocrinopathies were recruited
                                    and included in the study between September 2013 and September 2015. One subject discontinued
                                    the study after randomization and before the first intervention because of persistent orthostatic
                                    hypotension. Ten subjects (four women with three of them post-menopausal) with a median age of
                                    50 years (range, 25–57) and a median disease duration of 23.5 years (range, 1–33) completed all
                                    aspects of the study between May 2014 and October 2015. The median daily replacement dose of
                                    hydrocortisone (HC) prior to the study was 30 mg (range, 20–30), and 9 out of 10 subjects had treat-
                                    ment with fludrocortisone (mineralocorticoid) at a median daily dose of 0.1 mg (range, 0.1–0.2).

                                    Clinical and biochemical outcomes
                                    The main time points for sample collection in each intervention were at 9 AM on the first interven-
                                    tion day (‘before start’) and at 7 AM on the second intervention day (‘morning’) (Figure 1B). The
                                    subjects’ last ordinary oral HC dose was administered the day before admission to the study unit.
                                       Infusion of HC mixed with isotonic saline (‘GC exposure’) had no effect on systolic and diastolic
                                    blood pressure, body weight, serum sodium and potassium, or plasma glucose concentrations com-
                                    pared to the same amount of isotonic saline infusion alone (‘GC withdrawal’) (Table 1). HC and saline
                                    infusion achieved the intended differences in GC exposure. Both median morning serum cortisol and
                                    cortisone during the HC infusion were within the physiological range (298 and 81.2 nmol/L,

Chantzichristos et al. eLife 2021;10:e62236. DOI: https://doi.org/10.7554/eLife.62236                                                3 of 39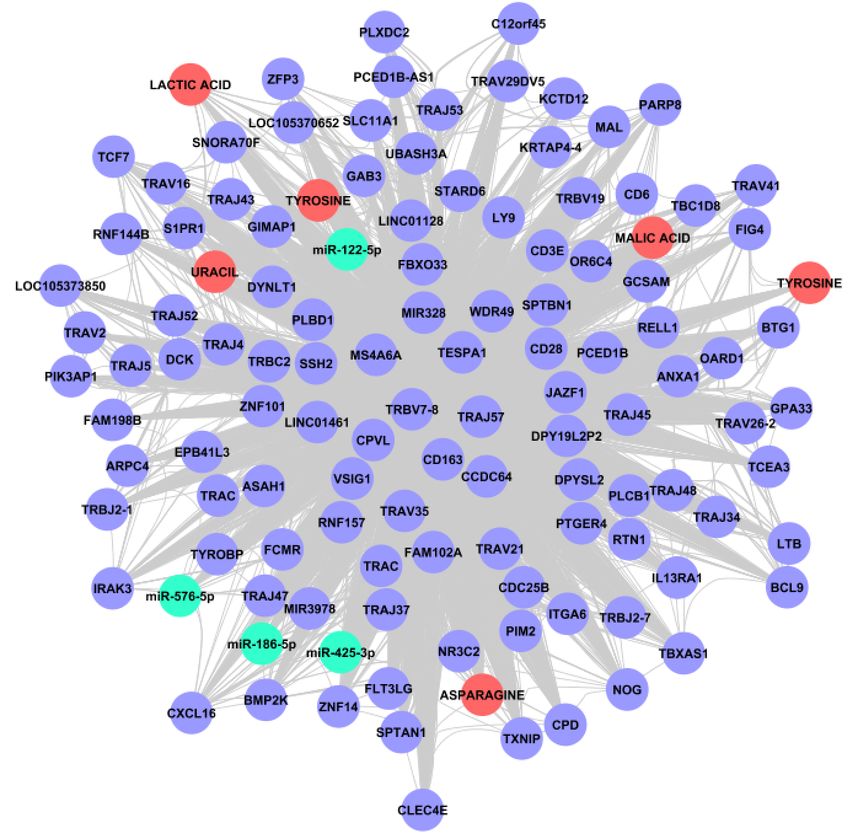
Research article                                                                                                                         Computational and Systems Biology Medicine

                           !"#$%&'%!#(#)"*+,%+-%./01#)".
          !"               !"#$%&'()&*+(,'-$.(+/01
                                                                                    !/01#)".%2*"3%455*.+,6.%5*.#7.#%

                           !"#$%E'%!"/5F%5#.*C,%                                      87,5+9*:#5%;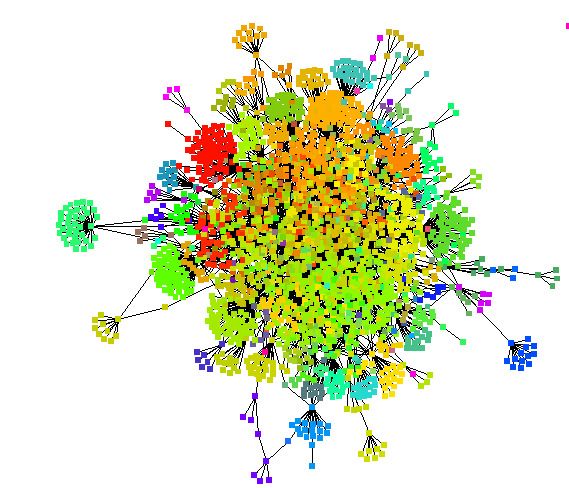
Research article                                                                               Computational and Systems Biology Medicine

Figure 1 continued
network including gene expression (derived from two independent tissues), microRNAs (miRNAs), and metabolites that were statistically differentiated
between the two interventions (step 4). The miRNA findings, because of their centrality in the network, were replicated in subjects with different GC
exposures (within the physiological range) from three independent studies (step 5). (B) Subjects with Addison’s disease (primary adrenal insufficiency)
received in a random order intravenous (i.v.) hydrocortisone (HC) infusion mixed in 0.9% saline in a circadian pattern (physiological GC exposure) or the
same volume of 0.9% saline alone (GC withdrawal) during 22 hr starting at 9 AM more than 2 weeks apart. During the GC exposure, HC(Solu-Cortef)
was administered at a dose of 0.024 mg/kg/hr between 9 AM and 12 PM (first day), 0.012 mg/kg/hr between 12 PM and 8 PM (first day), 0.008 mg/kg/hr
between 8 PM and 12 AM (first day), and 0.030 mg/kg/hr between 12 AM and 7 AM (second day). Samples for the ‘omics analyses were collected at 7
AM on day 2 of the intervention (morning samples). p.o.: oral.

                                           respectively) and markedly lower during the saline infusion (44.4 and 42 nmol/L, respectively, both
                                           p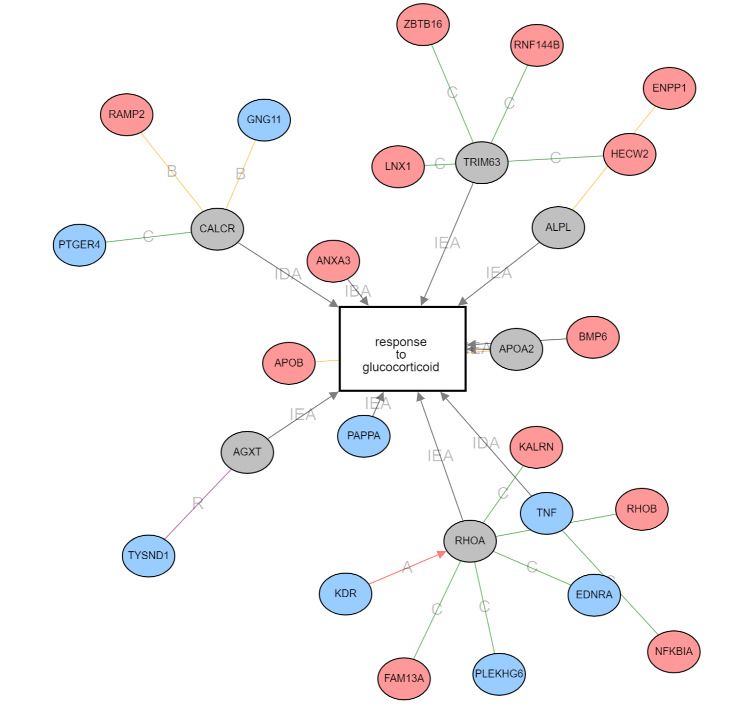
Research article                                                                           Computational and Systems Biology Medicine

                                        #"                                                     %"
                                                                 !!"#""$                                        !!"#""$

                                        !"                                                     $"
                                                                 !!"#""$                                              !!"#""$

                                    Figure 2. Violin plots of serum and urinary glucocorticoids (GCs) during GC exposure and withdrawal. Individual
                                    data and changes for morning (7 AM) serum cortisol and cortisone (A, B), and overnight (12 AM to 7 AM) urinary-
                                    free (U-free) cortisol and cortisone (C, D) from both interventions. Boxes represent interquartile range (IQR);
                                    whiskers mark spread of points within 1.5 times IQR; violins demonstrate distribution of results with the maximum
                                    width representing the highest density within each violin. Difference of median values between interventions is
                                    presented with p-values. HC: hydrocortisone.

                                    Differentially regulated ‘omic elements associated with response to
                                    GCs
                                    Similarity network fusion (SNF) was used to demonstrate overall similarity between subjects across
                                    and between ‘omic layers, prior to analysis (Appendix 1 and Appendix 1—figure 1). Differential
                                    gene expression was associated with GC response in both PBMC and adipose tissue (Appendix 1).
                                    Differential expression of metabolites and miRNA was identified in blood in relation to GC response
                                    (Appendix 1). Differentially expressed ‘omic elements (DEOEs) are presented in Table 2 and
                                    Supplementary file 1a–d. All DEOEs were used for integrated analysis, and false discovery rate
                                    (FDR)-corrected DEOEs were used for all other analyses (Table 2). DEOEs from the PBMC and adi-
                                    pose tissue transcriptomes were shown to have limited overlap in response to GC but were enriched
                                    for shared pathways, revealing an overlap that indicated shared mechanism in relation to GC expo-
                                    sure (Appendix 2 and Appendix 2—figure 3).

Chantzichristos et al. eLife 2021;10:e62236. DOI: https://doi.org/10.7554/eLife.62236                                                          6 of 39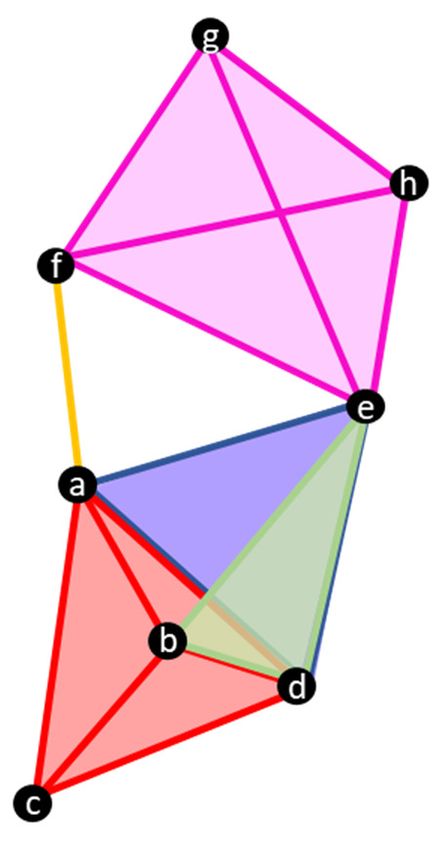
Research article                                                                       Computational and Systems Biology Medicine

Table 2. Summary of differentially expressed ‘omic elements in association with response to glucocorticoids.
                              Total number of ‘omic           Number of significant elements        Number of significant elements
‘Omic data set                elements                        (pj1:5j standard deviations (sd). Edges were defined as PBMC transcripts with shared correla-
                                       tions, for example, two PBMC transcripts that are both correlated with the same three metabolites
                                       are connected by three edges. We summarized the shared correlations as a measure of similarity
                                       between each pair of GC-responsive PBMC transcripts, counting correlations across the other ‘omic
                                       data sets (Figure 3—figure supplement 1). The greatest number of correlations shared was
                                       between PBMC and adipose tissue transcriptome (525 genes, Figure 3C), reinforcing the observa-
                                       tion that, while the gene-level overlap of differential expression was limited, common pathways are
                                       active in both tissues related to GC action, which involve similar networks of co-expressed genes.
                                       The rank order of the number of correlations shared with the GC-responsive PBMC transcriptome
                                       was adipose tissue transcriptome > plasma miRNAome > serum metabolome, and this was con-
                                       firmed both by comparison of the heat maps (Figure 3—figure supplement 1) and by a Venn dia-
                                       gram (Figure 3D). The Venn diagram also reveals a strong correspondence between the serum
                                       metabolome and both PBMC and adipose tissue transcriptomes.

                                       Identification and validation of a shared transcriptomic profile in both
                                       PBMCs and adipose tissue predicting GC response
                                       Robustness testing was performed in which hypernetworks were generated to model dissimilarity
                                       based on the absence of correlations with PBMC transcripts. Any genes that were highlighted by
                                       these hypernetworks were removed from the downstream predictive analysis. Using this approach,
                                       we defined 271 of 965 PBMC transcripts with maximum predictive potential. This set of genes

Chantzichristos et al. eLife 2021;10:e62236. DOI: https://doi.org/10.7554/eLife.62236                                                  7 of 39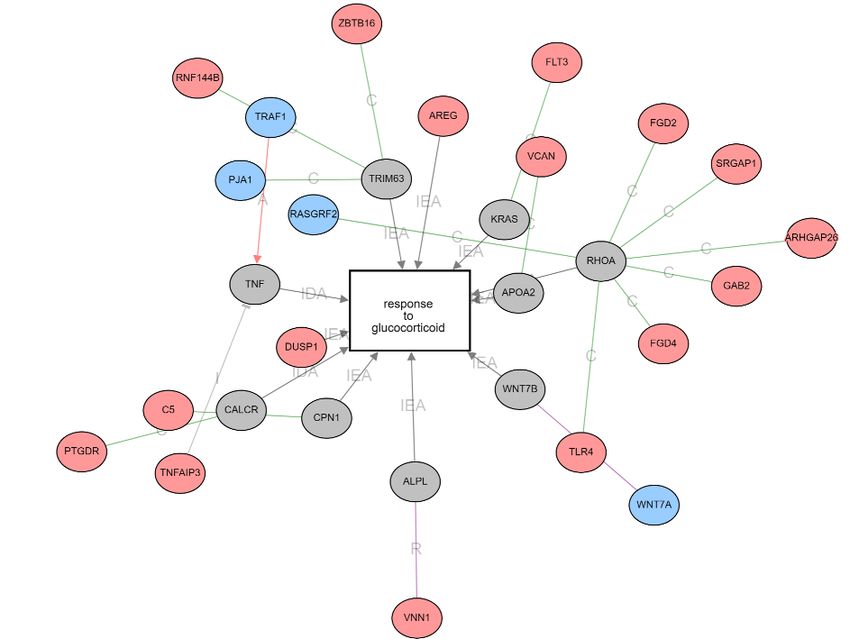
Research article Computational and Systems Biology Medicine
#" !" !!"
%"
!!!"
$" 1234()+,-&.+#$/%0' !"
#$%&'()*+&&',%-.+/0
!
!"#$%&'()#&&*'()+,-&.+#$/%0'
"!!
!"##$%&'()'*
Figure 3. Hypernetwork analyses of integrated ‘omic data. (A) Hypernetworks differ from traditional networks in that edges can connect more than two
nodes. Nodes are represented by black circles, edges by colored lines and surfaces. This demonstration shows how one edge can connect (i) two
nodes as a one-dimensional line, (ii) three nodes as a two-dimensional surface, and (iii) four nodes as a three-dimensional structure. Hypernetworks of
‘omic data can have edges shared between hundreds of nodes. (B) Hypernetwork diagram illustrating how a pair of nodes (a–h) can be connected by
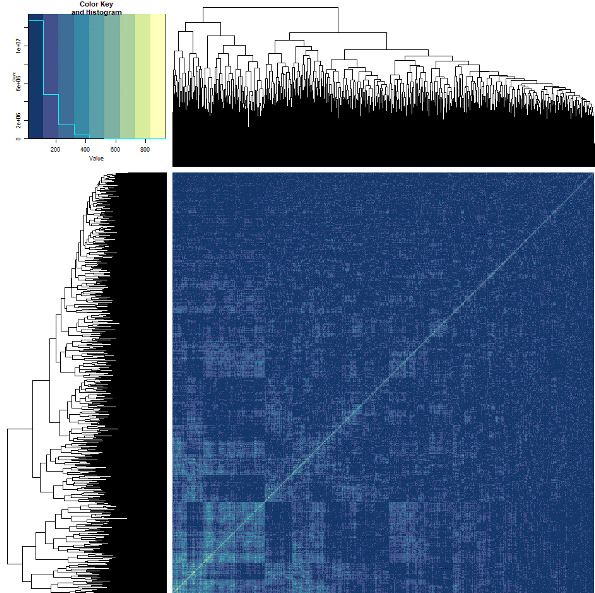
more than one edge. In this example, nodes e and d share two edges, as do b and d. (C) A hypernetwork plotted as a heat map can be used to
investigate clustering of blood peripheral blood mononuclear cell (PBMC) transcripts, based on correlation to, for example, adipose tissue
transcriptome. A central cluster, defined using hierarchical clustering, groups PBMC transcripts based on high numbers of shared edges (red square,
n = 965). This approach was applied to define groups of PBMC transcripts with similar profiles when correlated against each other ‘omic layer. (D) Gene
probe level overlaps between PBMC transcriptome clusters identified by hypernetwork shared with the other ‘omic data sets. PBMC transcriptomic
changes are correlated with changes in miRNAome, adipose tissue transcriptome, and metabolome (gas chromatography-mass spectrometry and
liquid chromatography-mass spectrometry overlaps combined); overlaps are common PBMC transcripts with correlation to the ‘omic data sets. Values
in brackets represent the size of PBMC transcriptomic clusters drawn from all differentially expressed PBMC transcripts (n = 4426, p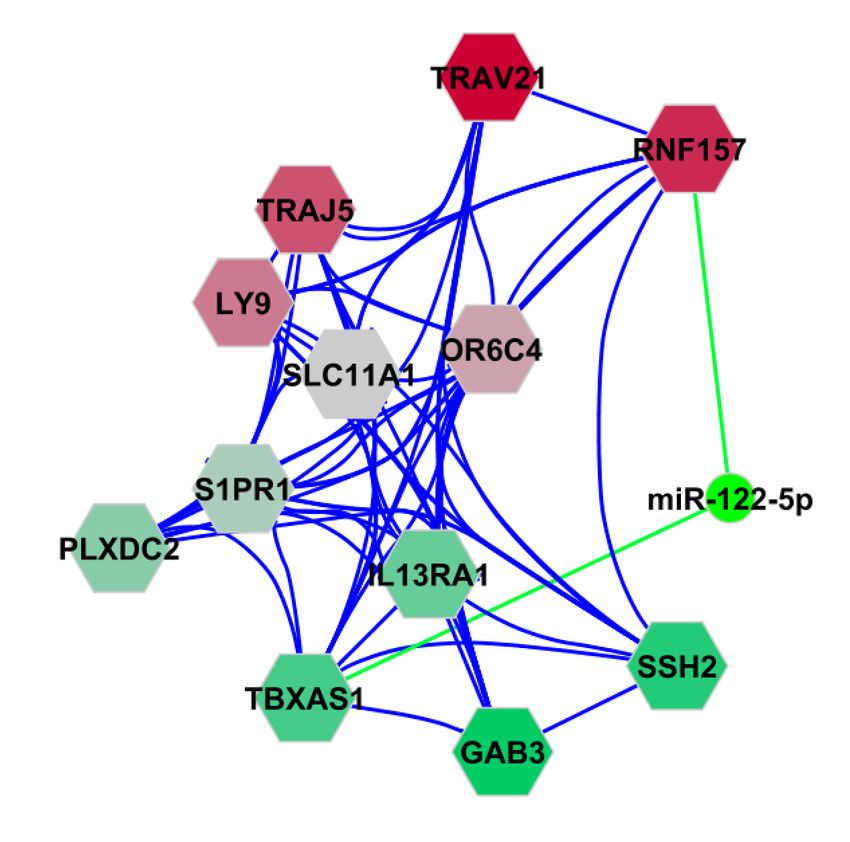
Research article                                                                     Computational and Systems Biology Medicine

                                    perfectly classified the HC- and saline-treated groups using partial least squares discriminant analysis
                                    (PLS-DA) (Figure 4A). We identified variables of importance using Random Forest and modeled the
                                    background experimental noise using permutation analysis (BORUTA) (Figure 4B). This identified a
                                    set of 59 genes as variables of importance with fold changes in the same directions in both transcrip-
                                    tomic data sets that perfectly classified HC from saline treatment (Supplementary file 1e). Nine of
                                    these genes were significantly differentially expressed in both PBMC and adipose tissue transcrip-
                                    tomes (Figure 4C), and, of these nine genes, six were associated with GC response via gene ontol-
                                    ogy (IL18RAP, JAK2, MTSS1, RIN2, KIF1B, and BCL9L) (Figure 4D). The gene set (n = 59) that we
                                    identified, which classified both PBMC and adipose tissue transcriptomes in relation to GC exposure,
                                    was validated (area under the curve [AUC] 0.70–0.96) by further testing in five other previous studies
                                    of GC action by other research groups in cellular models (Table 3). Further robustness of the random
                                    forest observations was provided by demonstrating that the minimal depth at which the variables of
                                    importance became active in prediction was small (Figure 4—figure supplement 1).

                                    Integration of circulating ‘omic data sets leads to miRNA and
                                    metabolite markers of GC action
                                    We further examined interactions between the circulating ‘omics data associated with GC exposure
                                    (Figure 3D). All of the circulating ‘omics data was combined to form a correlation matrix and hierar-
                                    chical clustering used to identify ‘omic data points with similar correlation (Figure 5—figure supple-
                                    ment 1). Eleven clusters including transcriptomic, miRNAomic, and metabolomic data were
                                    identified, and these clusters were shown to have enrichment within the interactome network model
                                    (Supplementary file 1f and Appendix 2).
                                        We then quantified the number of correlations between all the circulating ‘omic data associated
                                    with GC exposure (n = 336) using a hypernetwork. This approach was used to define a group of
                                    highly connected multi-omic elements with a relationship to GC exposure (Figure 5A).
                                        A hypernetwork model of the core group of 139 highly connected elements was generated
                                    (Figure 5B). DCK was the only gene shared with the GC-dependent adipose tissue transcriptome
                                    that also had predictive value (highlighted with a red square in Figure 5B). Deletion of the DCK
                                    gene region has been shown to be associated with increased sensitivity to GCs (Malani et al.,
                                    2017), an observation in alignment with the reduction in expression we found in both PBMC and
                                    adipose tissue transcriptomes in association with GC exposure (Figure 4C).
                                        The hypernetwork model (Figure 5B) also highlighted a range of related miRNAs and metabo-
                                    lites. A hierarchical model of modules within the network was assessed using the measure of network
                                    centrality (Figure 5C). These modules revealed multi-omic relationships and demonstrated that miR-
                                    122-5p was the only miRNA present in higher order modules as measured by network centrality.
                                    miR-122-5p was correlated with cortisol exposure and the expression of FKBP5, a regulator of GC
                                    sensitivity (cluster 11 in Figure 5—figure supplement 1 and Supplementary file 1f).
                                        Targeted replication of the plasma miR-122-5p fold change from the experimental study in sub-
                                    jects with Addison’s disease using an independent RNA separation procedure showed a marked
                                    down-regulation of miR-122-5p by increased GC exposure (p=0.009) (Figure 6). Two subjects did
                                    not show this miR-122-5p response, one man (disease duration 2 years, body mass index [BMI] 23.8
                                    kg/m2; hydrocortisone 20 mg daily, fludrocortisone 0.1 mg daily) and one woman (disease duration
                                    23 years; BMI 28.1 kg/m2; hydrocortisone 30 mg daily, fludrocortisone 0.2 mg daily) who both expe-
                                    rienced mild mental fatigue during GC withdrawal.

                                    Replication of miRNA findings in independent study groups
                                    Based on (i) the functional association of a circulating miRNA with gene expression and metabolo-
                                    mics, and (ii) the correlation between the PBMC transcriptome and plasma miRNAome (Figure 3D),
                                    a targeted replication of the plasma miRNA findings was conducted using an independent RNA sep-
                                    aration procedure. Twelve miRNAs were re-analyzed in the current study and in three other indepen-
                                    dent studies including subjects with different GC exposures: (i) in 60 subjects with rheumatoid
                                    arthritis with and without tertiary adrenal insufficiency after a short-term stop in their GC treatment
                                    (low vs. physiological GC exposure, respectively) (Borresen et al., 2017); (ii) in 20 subjects with
                                    Addison’s disease receiving HC replacement therapy and in 20 matched healthy control subjects

Chantzichristos et al. eLife 2021;10:e62236. DOI: https://doi.org/10.7554/eLife.62236                                                9 of 39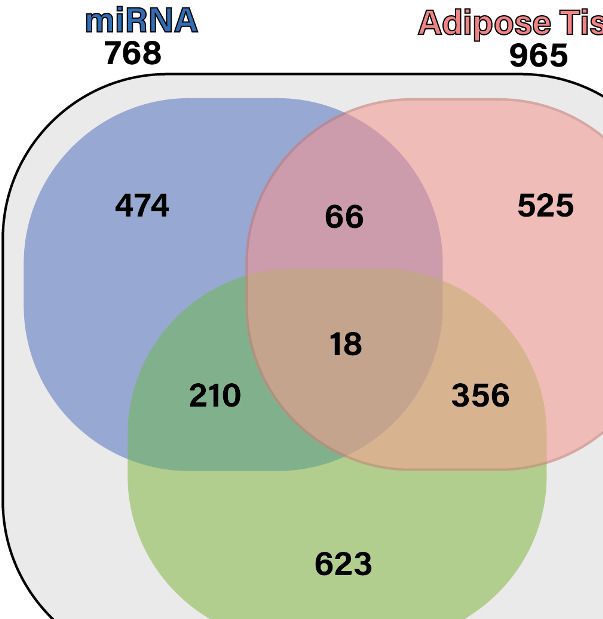
Research article                                                                         Computational and Systems Biology Medicine

                                        D) PBMC and Adipose Tissue Transcriptome

                                              IDA = Inferred from Direct Assay
                                              IEA = Inferred from Electronic Annotation

                                    Figure 4. An overlapping gene set in peripheral blood mononuclear cell (PBMC) and adipose tissue transcriptome
                                    can be used to classify glucocorticoid (GC) response. These analyses were performed to depict the common
                                    predictive genes in PBMCs and adipose tissue. (A) Partial least squares discriminant analysis (PLSDA) showing
                                    complete separation of hydrocortisone (HC) infusion (GC exposure, blue points) from saline infusion (GC
                                    Figure 4 continued on next page

Chantzichristos et al. eLife 2021;10:e62236. DOI: https://doi.org/10.7554/eLife.62236                                                     10 of 39
Research article Computational and Systems Biology Medicine
Figure 4 continued
withdrawal, orange points) using 271 of 965 PBMC transcripts confirmed as robust in the hypernetwork by analysis
of dissimilarity. X-variates 1 and 2: PLSDA components; expl. var: explained variance. (B) BORUTA feature selection
identifies variables (genes) of importance in classification using a Random Forest approach to model experimental
background noise (green: confirmed classification; yellow: tentative classification: red: rejected classification; blue:
‘shadow’ variable modeling experimental noise). Of 271 transcripts initially used, 59 were identified as important
(confirmed [green] or tentative [yellow]) in separating GC exposure from GC withdrawal, as well as having the
same direction fold change in both PBMC and adipose tissue transcriptomic data sets. (C) Predictive genes that
are significantly differentially expressed between GC exposure and GC withdrawal in both PBMC and adipose
tissue transcriptomes and display fold change in the same direction in both tissues (n = 9). (D) Association of
predictive genes (six out of nine) with GC response through gene ontology. Data demonstrates the presence of a
robust transcriptomic profile predicting GC response in two independent tissues.
The online version of this article includes the following figure supplement(s) for figure 4:
Figure supplement 1. Random forest distribution of minimal depth.
(low vs. physiological GC exposure, respectively) (Bergthorsdottir et al., 2017); and (iii) acute low,
medium, and excessive GC exposure in 20 healthy subjects (Stimson et al., 2017).
From this analysis, miR-122-5p was significantly associated with different GC exposure in all stud-
ies (Figure 7A– D). The expression of miR-122-5p was higher in subjects with rheumatoid arthritis
and reduced GC exposure due to tertiary adrenal insufficiency (Figure 7A), and subjects with Addi-
son’s disease had higher expression of miR-122-5p than healthy matched controls (Figure 7B). In the
experimental study in healthy subjects, the expression of miR-122-5p was increased both after low
and excessive high GC exposure compared to medium GC exposure at both high and low insulin
levels (Figure 7C, D, respectively). The other 11 miRNAs (including miR-425-3p) did not show a rela-
tionship with GC exposure in the three replication studies.
Table 3. Validation of the predictive genes from the current exploratory study against previous studies examining GC response in
cellular systems.
AUC
(95% OOB* OOB* error
Study title GEO # PMID N CI) AUC† rate‡ (%)
Dexamethasone effect on epidermal keratinocytes in vitro GSE26487 17095510 20 0.70 0.80 30
(Stojadinovic et al., 2007) (0.51–
0.89)
Dexamethasone effect on GC-resistant and -sensitive lymphoblastic GSE22152 21092265 (Carlet et al., 24 0.71 0.78 29
leukemia cell lines 2010) (0.52–
0.90)
In vivo GC effect on non-leukemic peripheral blood lymphocytes GSE22779 21092265 (Carlet et al., 16 0.88 0.96 6
2010) (0.63–
1.0)
Osteosarcoma cell line response to activation of specific GC receptor GSE6711 17682054 (Lu et al., 2007) 60 0.96 0.99 3
alpha isoforms 22174376 (Jewell et al., (0.89–
2012) 1.0)
GC effect on lens epithelial cells GSE3040 16319822 (Gupta et al., 12 0.83 0.72 17
2005) (0.63–
1.0)
*OOB data, the bootstrapping approach of Random Forest, ensures that every tree is built using ~63% of the available data, leaving ~ 37% that can be
used for a validation test.
†
AUC up to 0.96 demonstrates a high probability of correctly classifying a randomly selected sample from each study.
‡
OOB error rate = prediction error using the OOB validation data.
The gene set that classified both PBMC and adipose tissue transcriptomes in relation to GC exposure with fold change in the same direction
(see Figure 4B – 59 genes) was validated by further testing in five other publicly available studies of GC action in cellular systems.
AUC: area under the curve of the receiver operating characteristic; CI: confidence interval; GC: glucocorticoid; GEO: Gene Expression Omnibus; GEO #:
study number deposited with GEO; N: study number size; OOB: out-of-bag; PBMC: peripheral blood mononuclear cell; PMID: PubMed ID number of the
manuscript describing the data.
Chantzichristos et al. eLife 2021;10:e62236. DOI: https://doi.org/10.7554/eLife.62236 11 of 39Research article Computational and Systems Biology Medicine
$"%4"*#2*5() *++(,-&,.+*#-/0(1%2-,3(
23,+&#'("++&%,*-")4
/
01/
!" !"#$%&'() *++(,-&,.+*#-/0(1%2-,3( #"
!"#!
!"#$%&'(&)*+,%-*.
$%&
Figure 5. Integration of all circulating ‘omic data sets associated with glucocorticoid (GC) response. These analyses were performed to lead to
putative biomarkers of GC action. (A) Hypernetwork summary heat map of shared correlations between all circulating ‘omic elements (peripheral blood
mononuclear cell transcriptome, plasma microRNA [miRNA], serum metabolome; n = 336) with differential expression between GC exposure and GC
withdrawal. (B) Network representation of central cluster (red square in A [n = 139], of which 120 map to genes/miRNA/metabolites). Blue circles: genes
with differential expression; red circle: differentially expressed metabolites; green: differentially expressed miRNA. Red box highlights DCK, one of the
nine genes identified as a classifier of GC response (see Figure 4C). (C) Module decomposition of the hypernetwork. Genes modules (hexagons
representing multiple highly connected genes) named by the most central gene in each module. miR-122-5p is present in the core of two modules
(shown); color of modules represents centrality hierarchy: red: most central in the network; green: least central in the network.
Figure 5 continued on next page
Chantzichristos et al. eLife 2021;10:e62236. DOI: https://doi.org/10.7554/eLife.62236 12 of 39Research article Computational and Systems Biology Medicine
Figure 5 continued
The online version of this article includes the following figure supplement(s) for figure 5:
Figure supplement 1. Heat map with clusters of circulating ‘omic data associated with glucocorticoid exposure identified using a correlation matrix.
Discussion
In a clinical experimental study designed to identify biomarkers of GC action, we succeeded in gen-
erating two profoundly different states of GC exposure within the physiological range in the same
individual. The novelty of this study is the identification of pathways related to GC response and
putative biomarkers of GC action in gene expression, metabolome, and miRNAs derived from inte-
grated multi-omic analysis in two independent tissues. We identified a transcriptomic profile that
was under similar GC regulation in both PBMC and adipose tissue transcriptomes, which was then
validated by comparison to a range of previously published data by other research groups from cel-
lular assays. We also identified a circulating miRNA, miR-122-5p, which was correlated with the circu-
lating transcriptome and metabolome findings, suggesting for the first time a functional role in GC
action. Moreover, the association between the expression of miR-122-5p and GC exposure was rep-
licated in three independent study groups.
In order to identify putative biomarkers of GC action in humans, a clinical study was considered
to be the most appropriate experimental setting. Addison’s disease or primary adrenal insufficiency
is a rare disorder, but a unique clinical model for GC biomarker discovery due to absent or very low
endogenous GC production (Gan et al., 2014; Sævik et al., 2020). Subjects with Addison’s disease
were studied in a random order during physiological GC exposure and GC withdrawal. During GC
exposure, infusion of HC delivered in isotonic saline via an infusion pump using a circadian pattern
and saline alone (using the same volume and infusion pattern as during HC infusion) was
!"#$%&&$'()*+,!-."/01)02(,0//"+*
!"#$##%
"
#
1)2!#""!34
$
!#
!"
!"#$%&'&(%)*'+,-+./0&$12.
%&'()*&+ ,-+3%4"52*3*'
,-+)./
Figure 6. Replication of miR-122-5p as a putative biomarker of glucocorticoid (GC) action in the current biomarker
discovery study. Targeted replication of plasma miR-122-5p fold change from the current study population
between subjects with Addison’s disease during GC exposure and GC withdrawal showed a significant down-
regulation of miR-122-5p expression with increased GC exposure (p=0.009) conducted using an independent RNA
separation procedure in the same samples.
Chantzichristos et al. eLife 2021;10:e62236. DOI: https://doi.org/10.7554/eLife.62236 13 of 39Research article Computational and Systems Biology Medicine
!" #"
!"#$#% !"#$#&
!"
$" %"
!"#$%&'()*"' +,-%&'()*"'
!"#$#' !"#$#& !"#$#(
Figure 7. Replication of miR-122-5p as a putative biomarker of glucocorticoid (GC) action in independent patient groups with different GC exposure.
(A) The expression of miR-122-5p was higher in subjects with rheumatoid arthritis and reduced GC exposure due to tertiary adrenal insufficiency after a
short-term stop of the GC treatment (AI) than in those without tertiary adrenal insufficiency (Normal). (B) Subjects with Addison’s disease (AD) had
higher expression of miR-122-5p than healthy matched controls (Control). In an experimental study in healthy subjects, the expression of miR-122-5p
Figure 7 continued on next page
Chantzichristos et al. eLife 2021;10:e62236. DOI: https://doi.org/10.7554/eLife.62236 14 of 39Research article Computational and Systems Biology Medicine
Figure 7 continued
was increased both after low and excessive high GC exposure (LowGC and ExcessGC, respectively) compared to medium GC exposure (MedGC) at
both (C) high and (D) low serum insulin levels. Diamond: mean. Box = median ± interquartile range. Whiskers = upper and lower quartiles. miR-122-5p
axis is presented as normalized expression.
administered during the GC withdrawal in order to prevent a state of sodium and fluid deficiency.
This study design therefore allowed a within-individual comparison accounting for circadian rhythm
and food intake. The marked difference in serum and urinary cortisol and cortisone, and the similar
serum electrolytes, glucose, body weight, and blood pressure between the two interventions sup-
port the experimental success of the study design and strongly indicate that confounders related to
metabolic changes or other secondary events related to the GC exposure or GC withdrawal were
not influencing the output of the study. The measurable but very low concentrations of serum corti-
sol and cortisone throughout the GC withdrawal may be explained by a residual adrenal steroid
secretion in some subjects (Gan et al., 2014; Sævik et al., 2020) and/or due to conversion of corti-
sone to cortisol in the liver and adipose tissue (Stimson et al., 2014).
Network models of ‘omic data can be used as a framework to assess the potential utility of bio-
markers (Stevens et al., 2014). In this study, we have used a hypernetwork model of GC action
based on differential gene expression in PBMCs as a basis to integrate adipose tissue transcriptome,
plasma miRNA, and serum metabolomic data. Hypernetwork analysis leverages the power inherent
in large data sets to assess interactions between ‘omic elements in a manner that is robust to false
positives (Battiston et al., 2020). The associated interactome network derived from the PBMC tran-
scriptome was shown to contain a number of genes with previously known GC-dependent binding
of NR3C1 (the GC receptor) to regulatory elements, evidence that supports the specificity of the
study design (Davis et al., 2018; Casper et al., 2018). Gene ontology analysis of the differential
gene expression identified a range of pathways classically associated with GC action including GC-
receptor signaling, immunoregulatory pathways such as those involving NF-kB, metabolic pathways,
and cell cycle pathways. The plasma miRNA and serum metabolomic data was shown to map to the
interactome network model of GC action, and this was taken as support for this data being putative
circulating biomarkers functionally related to GC action.
Differential expression induced by GC treatment in both PBMCs and adipose tissue was indirectly
associated with similar downstream elements by gene ontology analysis. These genes were not
directly implicated with GC response, so, while the exact mechanisms may be different in each tis-
sue, effects are coordinated through the same elements. Integration of the multi-omic data including
both PBMC and adipose tissue transcriptomes was performed in order to increase the robustness of
putative markers that could reflect action in other tissues such as adipose tissue, which is an impor-
tant target organ for the metabolic actions of GCs. The 59 genes that behaved similarly in PBMC
and adipose tissue were then validated in a range of studies examining GC response in different cel-
lular systems. These included primary cell culture on keratinocytes (Stojadinovic et al., 2007) and
lens epithelial cells (Gupta et al., 2005), along with PBMCs (Carlet et al., 2010) and cancer cells
[both lymphoblastic leukemia (Carlet et al., 2010) and osteosarcoma (Lu et al., 2007; Jewell et al.,
2012)]. The set of nine genes co-regulated in relation to GC exposure and GC withdrawal in both
PBMC and adipose tissue transcriptomes can therefore be considered as putative markers of GC
response. These could be used as a gene set to interrogate GC action in other experimental
settings.
All the miRNA findings in this study are novel. While emerging experimental evidence indicates
impact on regulation of GC action at several points by miRNAs (Clayton et al., 2018), this is the first
time that miRNAs are shown to be globally correlated to GC action in humans. Both the hypernet-
work analysis and the interactome network model implied the functional significance of some miR-
NAs, particularly miR-122-5p. In our hypernetwork model, the expression of miR-122-5p was
correlated with clusters of genes that were centrally coordinated by expression of both RNF157 and
TBXAS1, the former suggested to be a key regulator of both PI3K and MAPK signaling pathways,
commonly perturbated in cancer and metabolic disorders (Dogan et al., 2017). Expression of
TBXAS1 is pharmacogenomic linked to inhaled GC exposure in asthma (Dahlin et al., 2020). miR-
122 is precursor transcript of mature miRNAs, including miR-122-5p (Carthew and Sontheimer,
2009; Bartel, 2004). miR-122 is expressed in the liver in humans (Tsai et al., 2009;
Chantzichristos et al. eLife 2021;10:e62236. DOI: https://doi.org/10.7554/eLife.62236 15 of 39Research article Computational and Systems Biology Medicine
GTEx Consortium, 2015; GTEx Consortium, 2013) and mice (Tsai et al., 2009). Hepatocyte nuclear
factor HNF4A (Li et al., 2011; Xu et al., 2010), along with HNF3A (FOXOA1), HNF3B (FOXOA2),
and HNF1A (Xu et al., 2010; Coulouarn et al., 2009), has been shown to be a key regulator of miR-
122 expression in human cells. Down-regulation of miR-122 in murine models has been associated
with non-alcoholic fatty liver disease (Alisi et al., 2011) and diabetes mellitus (Guay et al., 2011),
and in humans, miR-122-5p has also been associated with fatty liver disease (Raitoharju et al.,
2016).
miR-122-5p may be a functional link between unphysiological GC exposure and metabolic and
cardiovascular disease. Increased exposure to GCs impairs glucose tolerance and may induce type 2
diabetes (Hackett et al., 2014). Indeed, reduced miR-122-5p expression has been seen in animal
models of diabetes, and the reduction of this miRNA in response to increased GC exposure may
suggest that miR-122-5p is a functional link between GC action and metabolism. In support of these
findings are observations showing that miR-122-5p regulate insulin sensitivity in murine hepatic cells
by targeting the insulin-like growth factor (IGF) 1 receptor (Dong et al., 2019). Recent human stud-
ies have also suggested that miR-122-5p is an indicator of the metabolic syndrome, with reduced
expression in response to weight loss in overweight/obese subjects (Hess et al., 2020). miR-122-5p
has also been suggested as a biomarker of coronary artery stenosis and plaque instability
(Wang et al., 2019; Singh et al., 2020; Ling et al., 2020). As unphysiological GC exposure has
been associated with obesity, diabetes, and cardiovascular disease (Walker, 2007), it is possible
that miR-122-5p is reflecting different GC exposure in these disorders. The subjects with Addison’s
disease in our clinical experimental study had no other comorbidities previously known to be associ-
ated with miR-122-5p expression, and therefore the presence of such confounders in our miR-122-
5p finding seems to be unlike.
Specific miRNAs circulating in a stable, cell-free form in plasma or serum may serve as biomarkers
in some diseases (Kroh et al., 2010), and, in our integrated analysis, they seem to be a realistic and
clinically useful marker of GC action. We therefore focused on the replication of the miRNA findings
from the discovery study. For this purpose, we performed a targeted analysis of 12 putative miRNAs
and analyzed them in 120 subjects from independent study groups with different GC exposure in
terms of dose, duration of exposure, and route of administration. The rationale for selecting these
groups was that their GC exposure mostly remained within the normal physiological range. Despite
the experimental differences between these studies, and the fact that these studies were not
designed to study miRNA biomarkers of GC action, miR-122-5p was down-regulated by increased
GC exposure in all of them. One exception was when short-term excessively high GC exposure was
studied in afternoon samples in 20 subjects. There is no clear explanation for this, except the possi-
bility that high non-physiological GC exposure has other secondary effects that may affect the levels
of miR-122-5p.
The network analysis also identified putative metabolomic markers of GC action. GCs have a key
role in metabolic regulation of stress by mobilizing energy through glucose, protein, and lipid
metabolism. Previous studies have found an association between different GC doses and levels of
branched-chain amino acids, fatty acids, some acyl carnitines, and tryptophan and its metabolites
(Alwashih et al., 2017a; Sorgdrager et al., 2018). In our study, the amino acid tyrosine and the
pyrimidine base uracil had a central position in the hypernetwork, which defined a group of highly
connected multi-omic relationships within physiological GC exposure. Some of the other metabolo-
mic data from our study was also in line with previous metabolomic studies in patients with adrenal
insufficiency (Alwashih et al., 2017b; Sorgdrager et al., 2018). Excessive exposure to GCs in
healthy subjects has, on the other hand, shown a strong, immediately and long-lasting impact on
numerous biological pathways in the metabolome that may be either direct or indirect through the
metabolic and cardiovascular action of pharmacological doses of GCs (Bordag et al., 2015).
There are some study limitations that need to be acknowledged. The low number of subjects
included in the clinical experimental study could have reduced the power to detect a putative
marker in individual ‘omic data sets, but this limitation was compensated for by the crossover study
design and the integration of multi-omic layers. Another limitation is that we have only studied
markers collected in the morning during physiologically peak cortisol exposure. However, the
strengths of our study are the experimental study design, consideration of diurnal variation in GC
action and impact of food intake, and the within-individual comparison, which minimizes confound-
ers, as well as the fact that the putative markers that we have replicated are associated with known
Chantzichristos et al. eLife 2021;10:e62236. DOI: https://doi.org/10.7554/eLife.62236 16 of 39Research article Computational and Systems Biology Medicine
GC-responsive genes in two different tissues, suggesting their functional importance in GC action.
Moreover, the integration of multi-omic layers allows for the reduction of background noise
(Huang et al., 2017) and forms the basis for a detailed model of GC action. Hypernetwork summa-
ries of correlation networks are recognized as providing signatures of mechanism (Pearcy et al.,
2016; Johnson, 2011; Butte et al., 2000; Oldham et al., 2006) and, as such, are useful to assess
both function and define markers of direct action.
In this clinical biomarker discovery study, we identified genes, miRNA, and metabolites that are
differently expressed during GC exposure and GC withdrawal in subjects with Addison’s disease.
The multi-omic data showed a high degree of coherence, and network analysis identified transcrip-
tomics and metabolites that were closely correlated. The final outcome of the study is identification
of a miRNA that is regulated by GC exposure and correlated with genes and metabolites that are
also regulated by GCs in this study, indicating its functional relevance. The replication of this miRNA
in three independent study groups increases the likelihood that the discovered miRNA, miR-122-5p,
could become a biomarker of GC action to be used in clinical settings.
Materials and methods
Key resources table
Reagent type (species) or
resource Designation Source or reference Identifiers Additional information
Recombinant DNA reagent GeneChip WT PLUS Affymetrix Inc Other P/N 703174 Rev. 1
Reagent Kit
Commercial assay or kit Human Gene 1.0 ST array Affymetrix Inc – –
Commercial assay or kit Human Gene 1.1 ST array Affymetrix Inc – –
Commercial assay or kit Human Gene 2.0 ST array Affymetrix Inc – –
Commercial assay or kit miRCURY LNA Universal Exiqon – –
RT microRNA PCR,
Polyadenylation, and
cDNA Synthesis Kit
Commercial assay or kit miRCURY RNA Isolation Exiqon – –
Kit-Biofluids
Chemical compound, drug Solu-Cortef Pfizer Inc – –
Software, algorithm Agilent Masshunter Agilent Technologies, Inc Other Version B.08.00
Profinder
Software, algorithm SPSS SPSS RRID:SCR_002865 –
Software, algorithm R R Project for Statistical RRID:SCR_001905 –
Computing
Software, algorithm Rstudio Rstudio RRID:SCR_000432 –
Software, algorithm MetaboAnalystR – RRID:SCR_016723 –
Software, algorithm Moduland algorithm – https://www.linkgroup.hu/ –
docs/ModuLand-ESM1-v5.
pdf
Software, algorithm Cytoscape Cytoscape RRID:SCR_003032 –
Software, algorithm Qlucore Qlucore Omics Explorer https://www.qlucore.com/ –
bioinformatics
Software, algorithm Robust Multi-Array – http://www.molmine.com –
Average algorithm
Software, algorithm ChromaTOF LECO https://www.leco.com –
Software, algorithm MATLAB R2016a Mathworks https://www.mathworks. –
com
Software, algorithm Roche LC software Roche Molecular Systems, – –
Inc
Software, algorithm NormFinder Aarhus University Hospital, RRID:SCR_003387 –
Denmark
Continued on next page
Chantzichristos et al. eLife 2021;10:e62236. DOI: https://doi.org/10.7554/eLife.62236 17 of 39Research article Computational and Systems Biology Medicine
Continued
Reagent type (species) or
resource Designation Source or reference Identifiers Additional information
Software, algorithm NIST MS 2.0 software NIST https://chemdata.nist.gov –
Other LightCycler 480 Real-Time Roche Molecular Systems, RRID:SCR_020502 –
PCR System Inc
Other Agilent 1290 Infinity Agilent Technologies, Inc https://www.agilent.com –
UHPLC-system
Other Agilent 2100 Bioanalyzer Agilent Technologies, Inc RRID:SCR_018043 –
system
Other Agilent 6550 iFunnel Agilent Technologies, Inc RRID:SCR_019433 –
Q-TOF LC/MS
Other ENCODE Stanford University RRID:SCR_015482 –
Other UCSC Genome Browser UCSC RRID:SCR_005780 –
Other TarBase DIANA Tools RRID:SCR_010841 –
Other miRecords Biolead.org RRID:SCR_013021 –
Other TargetScan Whitehead Institute for RRID:SCR_010845 –
Biomedical Research
Other BioGRID TyersLab.com RRID:SCR_007393 –
Other Ingenuity Pathway Analysis Qiagen RRID:SCR_008653 –
Experimental study design
Study design
The study was a prospective, single-center, single-blind, randomized, two-period/crossover clinical
trial.
Study subjects
Men and women with Addison’s disease for >12 months on stable cortisol replacement (with HC
15–30 mg/day) for 3 months followed at the Center for Adrenal diseases in the Out-patient Clinic
at the Department of Endocrinology-Diabetes-Metabolism, Sahlgrenska University Hospital (tertiary
referral hospital), Gothenburg, Sweden, were eligible for inclusion. Other inclusion criteria were age
20–60 years, body mass index 20–30 kg/m2, and ability to comply with the protocol procedures.
Exclusion criteria were GC replacement therapy for indication other than Addison’s disease, any
treatment with sex hormones including contraceptive drugs, treatment with levothyroxine, renal or
hepatic failure, significant and symptomatic cardiovascular disease, diabetes mellitus, current infec-
tious disease with fever, and pregnancy or breastfeeding. Recruitment was stopped when all eligible
subjects had been asked to participate.
Power calculation was not performed because of the exploratory nature of the study. Power cal-
culations were also difficult in the context of ‘omic analysis as there may be variable effect sizes over
different ‘omic elements.
The study was approved by the Ethics Review Board of the University of Gothenburg, Sweden
(permit no. 374-13, 8 August 2013) and conducted in accordance with the Declaration of Helsinki.
Written informed consent was obtained from all subjects before participation. The study was regis-
tered at ClinicalTrials.gov with identifier NCT02152553.
Study treatment
HC infusion was prepared by adding 0.4 mL of Solu-Cortef 50 mg/mL to 999.6 mL 0.9% saline, which
resulted in 1 mg HC per 50 mL intravenous infusion. HC infusion was adjusted in accordance with
previous observations in healthy males (Kerrigan et al., 1993) and interventions in both sexes
(Løvås and Husebye, 2007; Figure 1B). The aim was to achieve a near-physiological circadian corti-
sol curve with early morning rise in serum cortisol that would peak at 7 AM and trough concentra-
tions at midnight. In the GC-withdrawal intervention, 0.9% saline infusion alone was administered
Chantzichristos et al. eLife 2021;10:e62236. DOI: https://doi.org/10.7554/eLife.62236 18 of 39Research article Computational and Systems Biology Medicine
using the same volume as during the HC infusion. Thus, a person weighing 75 kg received 2 L of
intravenous infusion over 22 hr during each intervention.
Interventions
All subjects were admitted after an overnight fast to the in-patient Endocrinology Department at the
Sahlgrenska University Hospital at 8 AM (first intervention day) and were discharged at 12 PM the
following day (second day). Subjects were randomized using a free randomization plan (generated
at http://www.randomization.com/ on 27 April 2014) before the first intervention to receive either
HC infusion or only saline infusion in a single-blind, crossover manner at least 2 weeks apart
(Figure 1B). The researcher responsible for the clinical study generated the randomization plan,
enrolled the study subjects, and assigned participants to interventions. Female subjects (when fertile)
were studied during the early follicular phase (days 5–10) of their regular cycle under both interven-
tions. Subjects were told not to take their ordinary mineralocorticoid dose on the day before each
intervention but to take their ordinary HC dose. Subjects received standard meals at fixed times dur-
ing both interventions. Their consumption of coffee or tea was recorded during the first intervention
in order to consume the same amount and at the same time points during the second intervention.
During each intervention, the subjects’ blood pressure, body temperature, and weight were mon-
itored. Because of the study design and the variations in circadian rhythm, blood sampling was col-
lected at exactly the same time before the start of intervention, at midnight (12 AM), and in the
morning of the second intervention day (7 AM). Urine was collected between midnight and morning
(overnight), and abdominal subcutaneous fat was collected in the morning of the second intervention
day immediately after blood and urine sampling. Adipose tissue was collected after local injection
with lidocaine under the umbilicus on the right side of the abdomen during saline infusion and on
the left side during HC infusion. The study was unblinded for each study subject after the completion
of all aspects of the study (the second intervention).
Replication studies
Baseline samples in subjects treated with prednisolone for rheumatoid
arthritis
This was a cross-sectional clinical study of prednisolone-induced adrenal insufficiency undertaken at
the Department of Medical Endocrinology and Metabolism, at University Hospital, Rigshospitalet,
Copenhagen, Denmark, between 2012 and 2018 (Borresen et al., 2017). In the current replication
analysis, 60 subjects were included. All subjects had rheumatoid arthritis, received long-term pred-
nisolone treatment (minimum 6 months), and treated with a current prednisolone dose of 5 mg/day.
Of the 60 subjects, 23 had an insufficient response to the Synacthen test (GC-induced adrenal insuffi-
ciency, AI group) and 37 had a normal response (normal group). The samples included in the replica-
tion analysis were collected in the morning after an approximately 48 hr pause of prednisolone
dosing (before the Synacthen test) and after overnight fasting. Plasma miRNA analysis of frozen sam-
ples was performed at Exiqon Services, Denmark.
Case–control study in subjects with or without Addison’s disease
This was an observational, cross-sectional, single-center, case–control study undertaken in our unit in
Gothenburg, Sweden, between 2005 and 2009 (Bergthorsdottir et al., 2017). In the current replica-
tion analysis, the subgroup of 20 subjects with Addison’s disease under daily replacement therapy
with oral HC 30 mg (AD group) and their 20 healthy control subjects with no GC therapy matched
for age and gender (control group) were included. The samples included in the replication analysis
were collected in the morning between 8 AM and 10 AM after an overnight fast, and for the cases
after morning administration of their oral HC, which means a very low cortisol exposure during the
night before sample collection. Plasma miRNA analysis of frozen samples was performed at Exiqon
Services, Denmark.
Randomized, crossover study in healthy subjects
This was a randomized, double-blind study in 20 lean healthy male volunteers undertaken at the
Edinburgh Clinical Research Facility between July 2010 and April 2012. The full protocol has been
published previously (Stimson et al., 2017). Volunteers were randomized to receive either a low- or
Chantzichristos et al. eLife 2021;10:e62236. DOI: https://doi.org/10.7554/eLife.62236 19 of 39You can also read