The Spatial and Spectral Resolution of ASTER Infrared Image Data: A Paradigm Shift in Volcanological Remote Sensing
←
→
Page content transcription
If your browser does not render page correctly, please read the page content below
remote sensing
Review
The Spatial and Spectral Resolution of ASTER
Infrared Image Data: A Paradigm Shift in
Volcanological Remote Sensing
Michael S. Ramsey *           and Ian T.W. Flynn
 Department of Geology and Environmental Science, University of Pittsburgh, 4107 O’Hara Street, Pittsburgh,
 PA 15260-3332, USA; ITF2@pitt.edu
 * Correspondence: mramsey@pitt.edu

 Received: 26 December 2019; Accepted: 12 February 2020; Published: 23 February 2020

 Abstract: During the past two decades, the Advanced Spaceborne Thermal Emission and Reflection
 Radiometer (ASTER) instrument on the Terra satellite has acquired nearly 320,000 scenes of the
 world’s volcanoes. This is ~10% of the data in the global ASTER archive. Many of these scenes
 captured volcanic activity at never before seen spatial and spectral scales, particularly in the thermal
 infrared (TIR) region. Despite this large archive of data, the temporal resolution of ASTER is simply
 not adequate to understand ongoing eruptions and assess the hazards to local populations in near real
 time. However, programs designed to integrate ASTER into a volcanic data sensor web have greatly
 improved the cadence of the data (in some cases, to as many as 3 scenes in 48 h). This frequency
 can inform our understanding of what is possible with future systems collecting similar data on the
 daily or hourly time scales. Here, we present the history of ASTER’s contributions to volcanology,
 highlighting unique aspects of the instrument and its data. The ASTER archive was mined to provide
 statistics including the number of observations with volcanic activity, its type, and the average cloud
 cover. These were noted for more than 2000 scenes over periods of 1, 5 and 20 years.

 Keywords: ASTER; thermal infrared data; volcanic processes; image archive; future concepts

1. Introduction

1.1. ASTER Instrument and History
     The Advanced Spaceborne Thermal Emission and Reflection Radiometer (ASTER) instrument
was launched on the NASA Terra satellite on 18 December 1999. Prior to the instrument beginning its
operational phase on 4 March 2000, ASTER acquired several images including the first thermal infrared
(TIR) image on 6 February (Figure 1). That image was of Erta Ale volcano (Ethiopia), and initiated a
long association of ASTER data with volcanological observations. ASTER was developed and built in
Japan under the Japanese Ministry of Economy, Trade and Industry (METI), and is one of five Earth
observing instruments on Terra. The combined science team of Japanese and United States investigators
has changed over the years, however always maintaining a strong volcanological component [1,2].
During the past two decades, the data from ASTER have been applied to numerous questions and
scales of surface processes, most notably for volcanic activity, e.g., [3–6].
     ASTER was designed to observe the surface at multiple spatial and spectral resolutions as well
as from different viewing geometries. It is actually a suite of three instruments with independent
bore-sighted telescopes, originally having 14 spectral channels in the visible/near-infrared (VNIR),
the shortwave infrared (SWIR), and the thermal infrared (TIR) regions [7]. The VNIR instrument
(0.52–0.86 µm) has three spectral channels at a spatial resolution of 15 m/pixel paired with one channel

Remote Sens. 2020, 12, 738; doi:10.3390/rs12040738                        www.mdpi.com/journal/remotesensing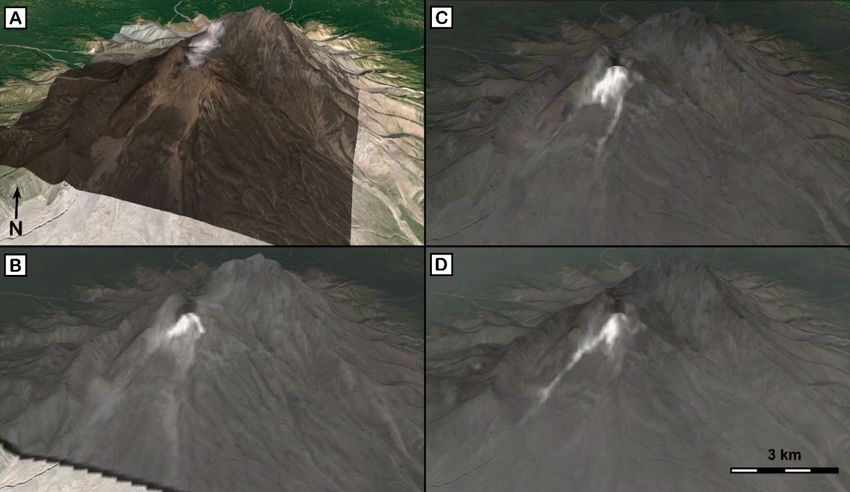
Remote Sens. 2020, 12, 738 2 of 40
Remote Sens. 2020, 12, x FOR PEER REVIEW 2 of 39
oriented in a backward look direction for the creation of digital elevation models (DEMs). The SWIR
channel oriented in a backward look direction for the creation of digital elevation models (DEMs).
instrument
The SWIR(1.6–2.43 µm)
instrument unfortunately
(1.6–2.43 failed in 2008,
μm) unfortunately failed but originally
in 2008, had sixhad
but originally channels at a spatial
six channels at a
resolution of 30 m/pixel. Finally, and perhaps most important for many aspects
spatial resolution of 30 m/pixel. Finally, and perhaps most important for many aspects of of volcanological
remote sensing, remote
volcanological the TIRsensing,
instrument
the TIR(8.13–11.65
instrumentµm) has five μm)
(8.13–11.65 channels at achannels
has five spatial at
resolution
a spatial of
90 resolution
m/pixel. ofDuring
90 m/pixel. During the lifetime of the mission, ASTER has acquired over 3.5individual
the lifetime of the mission, ASTER has acquired over 3.5 million million
scenes—approximately 22% of which
individual scenes—approximately 22%were collected
of which at night.atHere,
were collected night.we describe
Here, the two-decade
we describe the two-
history of history
decade ASTER,ofspecific
ASTER, programs to improvetothe
specific programs observational
improve frequencyfrequency
the observational of volcanoes, and present
of volcanoes,
examples of those
and present data. of those data.
examples
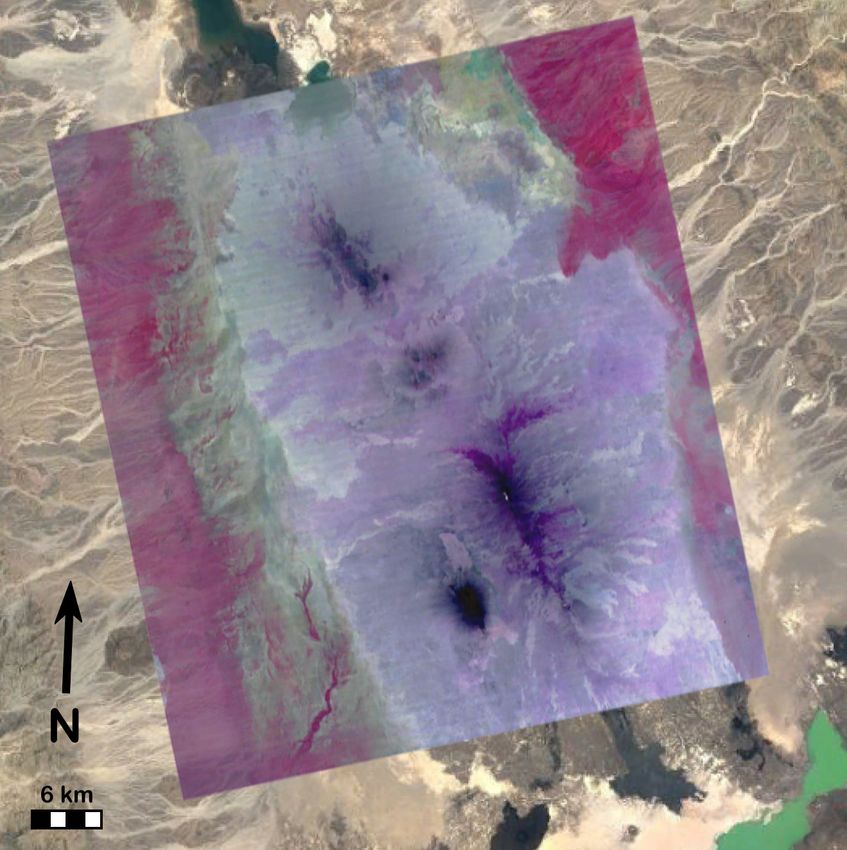
Figure
Figure 1. 1.The
Thefirst
firstAdvanced
Advanced Spaceborne
Spaceborne Thermal Emissionand
Thermal Emission andReflection
ReflectionRadiometer
Radiometer (ASTER)
(ASTER)
multispectral
multispectral thermal infrared (TIR) image acquired on 6 February 2000, before the start of of
thermal infrared (TIR) image acquired on 6 February 2000, before the start thethe
instrument’s science operational phase. Erta Ale volcano, Ethiopia (summit location: 13.60 ◦ N, 40.67◦ E),
instrument’s science operational phase. Erta Ale volcano, Ethiopia (summit location: 13.60°N,
is 40.67°E),
shown using a decorrelation
is shown stretch (DCS)
using a decorrelation stretchof(DCS)
the TIR bands
of the 14, 12,14,1012,in10red,
TIR bands green,
in red, andand
green, blue,
respectively. Color variations
blue, respectively. are mainly
Color variations caused
are mainly by rock
caused and and
by rock soil compositional
soil compositional differences,
differences,and only
and
possible with the
only possible withASTER
the ASTERmultispectral TIRTIR
multispectral data.
data.The
Theblues
bluesand
and purple colorsare
purple colors areindicative
indicative of of
dominantly
dominantly basalticlava
basaltic lavaflows.
flows.The
Thesmall
small cluster
cluster of white
whitepixels
pixelsininthe
thelower
lowercentral
central part
partof of
thethe
image
image
is the
is the summit
summit lavalake
lava lakethermal
thermalanomaly.
anomaly. The
The ASTER DCS DCSdata
dataare
areoverlain
overlainonona visible
a visibleGoogle
Google Earth
Earth
image for context. Image credit: NASA/METI/AIST/Japan Space Systems,
image for context. Image credit: NASA/METI/AIST/Japan Space Systems, and U.S./Japan ASTER and U.S./Japan ASTER
Science
Science Team.
Team.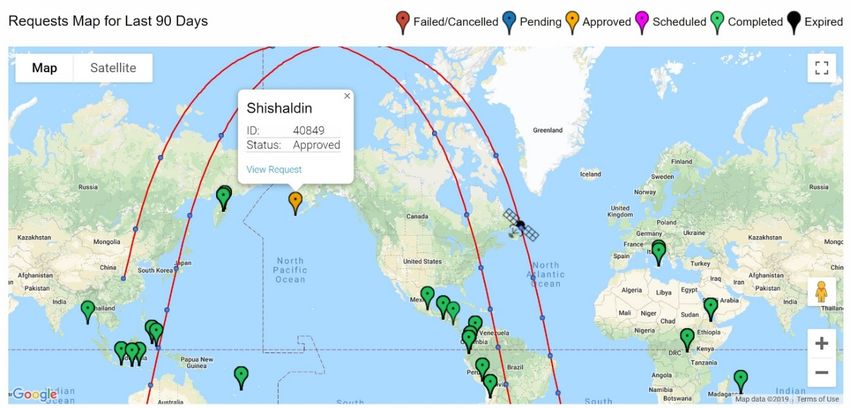
Remote Sens. 2020, 12, 738 3 of 40
Remote Sens. 2020, 12, x FOR PEER REVIEW 3 of 39
1.2. Twenty
1.2. Years of
Twenty Years of Volcanic
VolcanicStudies
StudiesUsing
UsingASTER
ASTERData
Data
The ASTER
The ASTER Science
Science Team
Team created
created useful
useful derived
derived science
science products
products that that have
have benefited numerous
benefited numerous
scientific fields such as volcanology. These include a robust temperature
scientific fields such as volcanology. These include a robust temperature emissivity separation algorithm emissivity separation
algorithm
for the firstfor the first
orbital orbital
high spatialhigh spatial resolution
resolution multispectralmultispectral
TIR data TIR data [8], programs
[8], programs such as thesuch as the
Science
Science Team Acquisition Request (STAR) to acquire data focused on important
Team Acquisition Request (STAR) to acquire data focused on important science questions of individual science questions of
individual users/teams, as well as the ability to generate DEMs [9]. These
users/teams, as well as the ability to generate DEMs [9]. These individual-scene DEMs of 60 by 60 km individual-scene DEMs of
60 bylater
were 60 km were laterglobally
composited composited into globally
the ASTER intoGlobal
the ASTERDEMGlobal DEM or GDEM—version
or GDEM—version 3 of which was 3 of
which was released in August
released in August 2019 [10,11]. 2019 [10,11].
Arguably, volcanology
Arguably, volcanology is is one
one of of the
the scientific
scientific disciplines
disciplines on on which
which ASTER
ASTER data data have
have hadhad the
the
greatest impact. In order to quantify this impact and gather all volcanology
greatest impact. In order to quantify this impact and gather all volcanology related studies together into related studies together
intoreference
one one reference
document,document,
we have weperformed
have performed an extensive
an extensive literatureliterature review (Supplementary
review (Appendix A). This found
materials). This found 271 peer-reviewed publications from 1 January
271 peer-reviewed publications from 1 January 1995 to 1 December 2019, an average of nearly 1995 to 1 December 2019, an 11
average of nearly 11 per year (Figure 2). Papers published prior to the Terra
per year (Figure 2). Papers published prior to the Terra launch were considered precursory studies, launch were considered
precursorydescribing
commonly studies, commonly
how the futuredescribing
ASTERhow datathe future
would ASTER
be used data would
for certain volcanicbe used forThis
studies. certain
list
volcanic studies. This list of 271 publications was subdivided into 12 categories
of 271 publications was subdivided into 12 categories based on the volcanic focus of the papers. based on the volcanic
focuscategory
The of the names
papers.and Thenumber
category names in
of papers and number
those of papers
categories (shown in inthose categories
parentheses) (shown
are: Analogs in
parentheses)
(3), Calibration are:
(4),Analogs
Lava Flows (3), Calibration
(4), Gas/Plumes (4), Lava Flows (4), Gas/Plumes
(30), Geothermal (9), Mapping(30), (54),Geothermal
Modeling (16), (9),
Mapping (54), Modeling (16), Monitoring (96), Operational (4), Other
Monitoring (96), Operational (4), Other (4), Precursory (16), and Topography (31). Based on this (4), Precursory (16), and
Topography (31).
categorization, ASTER Baseddataonhave
thisbeen
categorization,
primarily used ASTER data have
to monitor volcanicbeen primarily
activity; used to
somewhat monitor
surprising
volcanic activity;
considering the lowersomewhat
temporal surprising
frequency considering
of the data.the lower
This speakstemporal frequency
to the need of the
for future data.
high This
spatial,
speaks to the need for future high spatial, high spectral resolution data at
high spectral resolution data at temporal resolutions far better than the nominal 16 day equatorial repeattemporal resolutions far
better than the nominal 16 day equatorial repeat time of ASTER and
time of ASTER and Landsat, or even the 5 day resolution of the Sentinel-2 constellation. This same Landsat, or even the 5 day
resolution
finding wasofalso
the brought
Sentinel-2 constellation.
forward Thisrecent
in the most same Decadal
finding wasSurvey alsoforbrought forwardwhich
Earth Science, in thenoted
most
recent Decadal Survey for Earth Science, which noted data such as these
data such as these are critical for addressing two of the most important science questions related to are critical for addressing
two of the
natural most [12].
hazards important science questions related to natural hazards [12].
Figure 2. The number of volcano-related publications per year that have incorporated ASTER data
Figure
in some2.aspect
The number of volcano-related
of the work. Through 2016,publications
the growthperhas
year thatroughly
been have incorporated
exponentialASTER
(dashed data in
line).
somegrowth
That aspect of thedeclined
has work. Through 2016,
somewhat in the
thegrowth has been
last several years,roughly exponential
although (dashedrespectable.
still remaining line). That
growth
The totalhas declined
number somewhat in
of publications the last
shown several
is 271, years,the
spanning although still remaining respectable. The
last 25 years.
total number of publications shown is 271, spanning the last 25 years.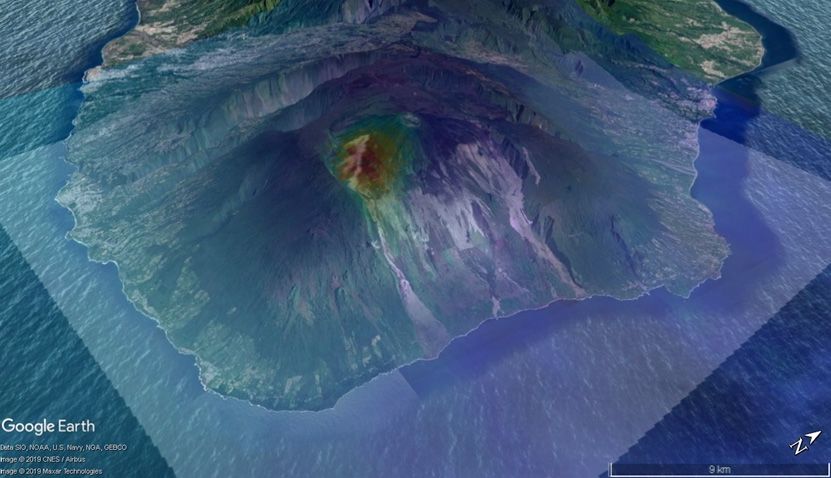
Remote Sens. 2020, 12, 738                                                                          4 of 40

2. Background

2.1. Volcanological Remote Sensing
     The data from spaceborne sensors used to detect, monitor, and even forecast eruptions have been
analyzed since the earliest days of the satellite era, e.g., [13–15]. Those early studies using the data
available at the time focused mostly on hot spot detection and temperature measurements with TIR
data. The studies continued to expand despite the fact that no sensor launched by any country has
ever been specifically devoted to volcano science. Scientific studies grew ever more complex with
the launch of new sensors providing better spatial, temporal and spectral data, arguably creating
the field of spaceborne volcanology. The ability to extract critical information from subtle phases
of precursory activity in order to perform the detailed spectral mapping of the erupted products
grew exponentially [16]. Many of these studies describe the detection of a new thermal anomaly at a
quiescent volcano, which gave rise to models of the sub-pixel temperature distribution. High temporal
temperature data allowed more accurate modeling of lava and gas flux rates as well as chronological
descriptions of each eruptive phase. Ramsey and Harris [17] summarized the history of satellite-based
TIR research of active volcanoes into four broad themes: (1) thermal detection, (2) analysis of sub-pixel
components, (3) heat/mass flux studies, and (4) eruption chronologies. Ramsey [2] added a fifth theme,
the creation of sensor webs consisting of integrated data from multiple sensors to improve the spatial
and/or temporal resolution.
     Volcanology, as is the case for many other disciplines relying on orbital image data, adapted to the
fundamental technological divide of the availability of high temporal/low spatial resolution versus
that of low temporal/high spatial resolution data. Volcanological processes operating at the minute
to hourly time scale (e.g., lava effusion, plume emplacement, drifting ash clouds) require data very
different than those acquired on the time scale of days to weeks. The former falls under a class of
TIR sensors designed primarily for weather and atmospheric studies and includes sensors such as
the Advanced Very High Resolution Radiometer (AVHRR), the Along Track Scanning Radiometer
(ATSR), the Moderate Resolution Imaging Spectroradiometer (MODIS), the Visible Infrared Imaging
Radiometer Suite (VIIRS), as well as instruments on the Geostationary Operational Environmental
Satellites (GOES). These sensors are commonly designed with wide swath widths, a limited number of
spectral bands, and spatial resolutions of 1.0 km/pixel or larger, which result in temporal frequencies of
minutes to hours. Modeling the data to extract information below the scale of the pixel have made these
datasets invaluable for both the rapid detection of new activity as well as the analysis of time-scale
dependent eruptive processes [18–20].
     TIR data of the Earth’s surface evolved from very course spatial resolution to the sub-100 m scale,
and from one spectral channel for temperature measurements to five for the ASTER and ECOsystem
Spaceborne Thermal Radiometer Experiment on Space Station (ECOSTRESS) instruments. This class
of sensors includes instruments on the current Landsat platforms as well as older systems like ASTER
and newer ones such as ECOSTRESS. These commonly have a larger number of spectral bands than
the weather class of sensors, spatial resolutions of 100 m/pixel or better, but a temporal frequency of
days to weeks. The improved spatial and spectral resolution does provide for studies of smaller-scale
volcanic processes with detection of much smaller temperature variations, e.g., [3,5,21]. These sensors
are also excellent for detecting early precursory activity despite the infrequent coverage, e.g., [22].
However, the data cannot be used to describe the high-frequency changes ongoing during an eruption
despite providing a detailed “snapshot in time” of that activity.

2.2. The 2018 Decadal Survey Recommendations
     Land surface image data at ever-improving spatial, spectral and temporal scales, which also span
a wide wavelength range from the VNIR to the TIR, have greatly improved our understanding of
geological and biological processes operating at those observational scales. This has been recognized
for decades with Landsat data, which have been improved spatially and spectrally as changes were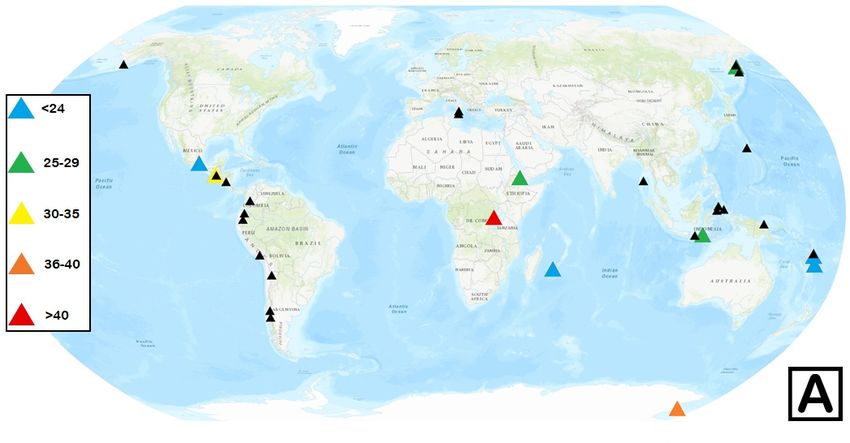
Remote Sens. 2020, 12, 738                                                                         5 of 40

made to the instrument design. Following its launch, ASTER data greatly increased both the spatial and
spectral ranges, providing new capabilities from that of Landsat, significant especially for volcanology.
     The need to continue (and improve upon) this class of measurement was recognized in the first
Decadal Survey (DS) for Earth Science in 2007 [23]. In that report, a notional list of mission concepts
was proposed, which included the Hyperspectral Infrared Imager (HyspIRI) mission that paired a
hyperspectral visible/shortwave infrared (VSWIR) instrument with a multispectral TIR instrument.
Many years of planning, design and science concept studies were later performed. Ultimately, however,
the mission was never selected by NASA to move forward and the concept study was formally ended
with the publication of the second Decadal Survey in 2018 [12].
     The second report focused on science questions and key observables, around which new mission
concepts could be structured. Notably, the lack of future global TIR and VSWIR image data was once
again brought forward in the new DS report. For example, the requirement for infrared measurements
spanned all of the working group panels, being mentioned over 190 times in the report and 12 times
in the requests for information from the general science community. Focusing specifically on the
reports of the Ecosystems and the Earth Surface and Interior panels, which contributed most directly
to the need for TIR data, those data were key inputs for 14 different science objectives—half of which
were designated as “most” or “very” important, the top categories. The science and applications
summary includes the need for measurements of surface geology, active geologic processes such as
natural disasters, surface/water temperature, as well as functional traits of vegetation and ecosystems.
The Earth Surface and Interior panel, for example, focused two of its top-level science questions
on natural disasters: data prior to the event and the outcomes following. TIR measurements are
noted as vital for several of these disasters, including volcanoes, landslides and wildfires. Although
temperature is an important measurement, the need for vast improvements in TIR spatial, spectral
and temporal resolution data was made clear. TIR data acquired in 1–2 channels at 100 m resolution
every 2 weeks no longer satisfies the requirements deemed important by the science community for
the future. Hyperspectral TIR coupled with vastly improved temporal resolution at spatial scales
exceeding current ASTER capabilities were recommended. The DS report lists several Designated
Observables (DOs), including the Surface Biology and Geology (SBG) DO. A mission concept designed
to address this DO will likely include some combination of these recommended scales of TIR data,
which will allow far more detailed volcanic measurements than currently possible with either ASTER
or Landsat data.

3. The Methodology of ASTER Volcano Observations

3.1. The Need for More Routine ASTER Volcano Observations

3.1.1. The ASTER Volcano Science Team Acquisition Request (STAR)
     The recognition that ASTER data would provide a fundamentally new tool for volcanic observations
was documented even before the Terra launch [7]. During that development period, the ASTER Science
Team (AST) foresaw that the instrument would eventually provide data at spatial and spectral scales
never before observed, routine data at night, the ability to point off-nadir to improve temporal revisit
time, and therefore, required daily observation schedules. Being a scheduled instrument, unlike
many other nadir-viewing systems, brought both a higher level of mission complexity as well as
unique opportunities for Earth observations. Scheduling allowed specific ground targeting, a focus on
larger-scale global processes, as well as an important goal of creating a global map of ASTER data.
     One observational and scheduling strategy developed was the creation of the science team
acquisition request or STAR. The STARs are a series of globally distributed regions of interest (ROIs)
over targets with high scientific value. The ROIs had associated attributes such as seasonality,
instrument gain settings, number of observation attempts per year, etc. These targets were integrated
into the daily scheduling so that both STAR-focused scenes were acquired together with the many
other required observations during any given orbital period. The STAR’s assured a priority set of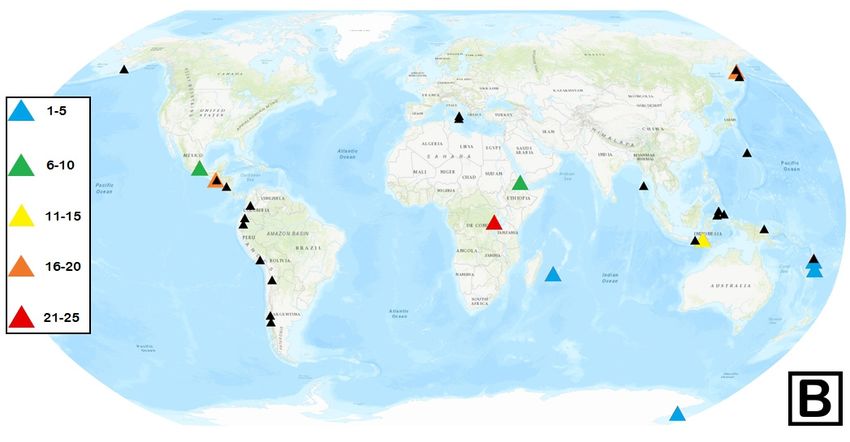
Remote Sens. 2020, 12, 738                                                                           6 of 40

observations for high-interest science such as monitoring the global land ice inventory, change detection
of large urban environments, and volcanic activity [24–26].
      The ASTER Volcano STAR’s scheduling plan was designed to allow routine observations over the
world’s volcanoes, which were then made available to the scientific community as quickly as possible [26].
The original plan divided the global list of the approximately 1000 active and/or potentially active
volcanoes into high, medium and low priority classes. These divisions, initially dubbed class A, B, and C,
respectively, varied according to the historical frequency of their eruption activity. Class A consisted of
volcanoes that had several recorded eruptions during the prior decade; class B volcanoes had several
recorded eruptions during the past several decades; and class C consisted of the remainder of volcanoes
that had not seen activity in the prior century. The STAR designated that class A targets would be
observed every 48 days during the day and every 32 days at night. Class B targets were to be observed
every 3 months, both in the day and night. Finally, class C targets were to be observed once every
6 months [27,28]. Although this plan continues to provide regular data of all the volcanoes on Earth, many
eruptions and the precursory activity prior, were missed due to this schedule rigidity. For the Volcano
STAR, ASTER acquires ~16,000 scenes per year on average, which is a combination of day and nighttime
data, for a total of ~320,000 individual ASTER volcano scenes over the mission lifetime. Therefore, for the
964 individual volcano ROIs in the ASTER Volcano STAR, each volcano is observed ~16 times per year on
average. Although an improvement over the nominal observational schedule, this frequency is still not
enough to allow rapid response observations nor discrimination of short-timescale activity, especially
considering that some percentage of these scenes are dominated by clouds.

3.1.2. The ASTER Urgent Request Protocol (URP)
      Because of the lack of an adequate temporal sampling of the very restless and actively erupting
volcanoes with the volcano STAR, the ASTER Urgent Request Protocol (URP) Program was proposed [2,29].
Simply, the URP is a means to improve the number of observations at the most active volcanic centers
around the world. The URP integrates ASTER into a sensor web construct where all scales of activity at
an erupting volcano can be captured [29,30]. The initial and most straight-forward implementation of
this approach for the URP uses detection of thermally elevated pixels in high temporal resolution data
to subsequently trigger more rapid scheduling and acquisition of the higher spatial/spectral resolution
data from ASTER. With such a system in place, the high-frequency activity can be continually imaged
throughout the eruption, with the high spatial resolution data ideal for capturing small scale changes.
These ASTER data also serve as validation for the low spatial, high temporal resolution data.
      The URP program has been in place as part of the ASTER sensor’s operational scheduling since
2005 [2,29], responsible for over 5000 additional scenes of active volcanoes during that time (one
new scene on average every day). Perhaps more importantly, the URP can be triggered manually if
precursory activity is noted based on ground-based observations or reports. This allows pre-eruption
data to be acquired that significantly add to the monitoring process [22].
      Later expansion of the URP Program increased the original monitored area from the northern Pacific
region to the entire globe [2]. The URP currently operates with two global monitoring systems using
MODIS data: MODVOLC [31] and Middle InfraRed Observation of Volcanic Activity (MIROVA) [32] as
well as AVHRR data focused in the north Pacific region using the Okmok algorithm [33]. New triggering
systems are now being tested that will integrate ground-based thermal camera data as the source for
new URP data. A trial system at Mt. Etna volcano in Italy has been ongoing since mid-2019 and
will expand to Piton de la Fournaise volcano on Réunion Island in 2020 using seismic alerts as the
triggering source. The addition of the URP to the ASTER observation schedule is a vast improvement
from the original volcano STAR [3,27]. Importantly, however, the URP operates in tandem with the
volcano STAR. The volcano STAR data represent additional scenes for the very active volcanoes,
thus supplementing the URP archive. Conversely, the volcano STAR data are commonly the only
information for the less active, non-thermally elevated targets, and therefore continue to represent an
important source for global volcano data.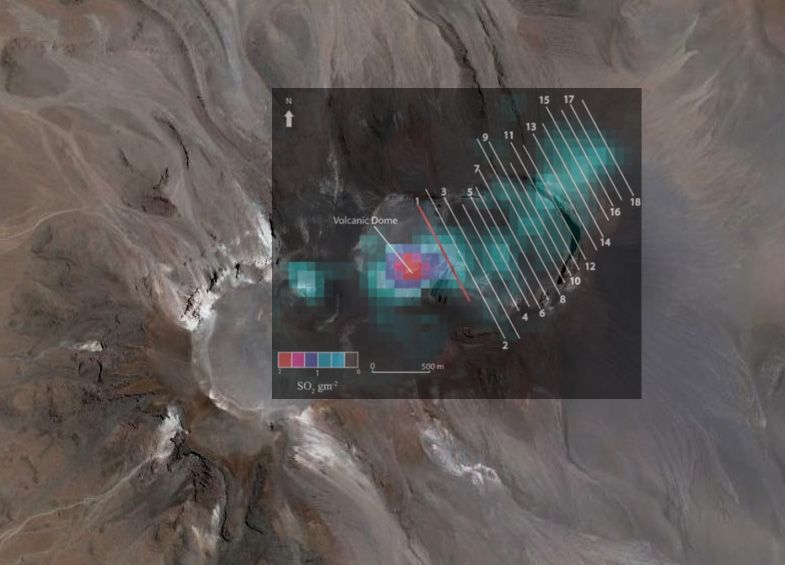
Remote Sens. 2020, 12, 738                                                                                             7 of 40

3.2. Volcano Data Archives

3.2.1. The ASTER Image Database for Volcanoes
     The entire ASTER archive is available at the Land Processes Distributed Active Archive Center (LP
DAAC), which can be searched using tools such as EarthDATA and GloVis (Table 1). Other web-based
data repositories, however, have been created specifically for the volcano data products. The first of
these is the Image Database for Volcanoes (IDV), which was created by M. Urai, and is located in and
served from Japan [27,34]. A new volcano image is commonly added within a week of acquisition. The
database contains all ASTER images of the 964 target volcanoes that comprise the ASTER Volcano STAR.
A 20 km2 area centered on the geographic location of volcano is shown and stored in the database. Links
to each volcano are also displayed and upon selection, the best VNIR image, geographic information,
and a table ordered by date of all the acquisitions are shown. The chronological list has thumbnails of
the each of the three ASTER imaging systems (where available) along with metadata links for access
and download.

               Table 1. Volcano-specific data archives and search tools available for all ASTER data.

                    Site Name                           Site Web Address and Relevant Information
                                              https://lpdaac.usgs.gov/data/get-started-data/collection-overview/
                                                                   missions/aster-overview/
        Land Processes Distributed Active
           Archive Center (LP DAAC)         Contains the entire ASTER archive from 2000 to present, including the
                                                           on-demand higher-level data products
                                                        https://gbank.gsj.jp/vsidb/image/index-E.html
          Image Database for Volcanoes
                     (IDV)                  Contains a 20 km2 area around each of the 964 volcanoes in the ASTER
                                             Volcano STAR database, for the entire mission from 2000 to present
                                                                    http://ava.jpl.nasa.gov

          ASTER Volcano Archive (AVA)       Contains the full ASTER scene in multiple formats for ~1500 volcanoes,
                                            in addition to other sensor data and derived products. Archive currently
                                                                     spans from 2000 to 2017
                                                                  https://earthdata.nasa.gov/
             EarthDATA Search Tool           Searchable visual archive for the entire ASTER mission from 2000 to
                                                present, including the on-demand higher-level data products
                                                                    https://glovis.usgs.gov/
                GloVis Search Tool           Searchable visual archive for the entire ASTER mission from 2000 to
                                                                            present

     Urai [34] conducted an initial evaluation of the ASTER Volcano STAR performance using data in
the IDV. As expected, volcanoes in Iceland and Kamchatka were observed the most frequently. At the
time of the study, 77% of all the volcanoes in the database had at least one daytime image with
Remote Sens. 2020, 12, 738 8 of 40
volcanoes can be searched by name or location, and thumbnail images. Unlike the IDV, AVA data can be
downloaded as full ASTER scenes in geoTIFF, KML, or HDF formats. These data can be also combined
with the DEM files and ancillary data in an easily accessible format, which is useful in organizing the
Remote Sens. 2020, 12, x FOR PEER REVIEW 8 of 39
multispectral geological analysis of a particular volcano [35]. As of this writing, however, no new data
have been
Theseadded
data can tobe the archive
also since
combined late
with the2017.
DEMThis is scheduled
files and to be
ancillary data reactivated
in an sometime
easily accessible format,in 2020.
which is useful in organizing the multispectral geological analysis of a particular volcano [35]. As of
3.3. Operational
this writing,Structure
however,ofnothe Ongoing
new ASTER
data have Volcano
been added to Observations
the archive since late 2017. This is scheduled
to be reactivated sometime in 2020.
All ASTER data acquired as part of ongoing routine Earth observations (i.e., the Volcano STAR,
global3.3.
map imaging,
Operational etc.) are
Structure of thearchived at the Volcano
Ongoing ASTER LP DAAC. These data are stored in several formats
Observations
including raw radiance at sensor, from which numerous level 2 data products (e.g., digital elevation
All ASTER data acquired as part of ongoing routine Earth observations (i.e., the Volcano STAR,
model, surface TIR temperature), can be ordered as on-demand products. Image data that fulfill the
global map imaging, etc.) are archived at the LP DAAC. These data are stored in several formats
requirements
includingofrawtheradiance
VolcanoatSTAR sensor,arefrom
alsowhich
assessed weekly
numerous and2 stored
level in the IDV
data products (e.g.,and theelevation
digital AVA archives,
the latter
model,until 2017.TIR
surface These volcanocan
temperature), archives allow
be ordered as quick
on-demanddata products.
searches Imageon particular
data that volcanoes
fulfill the and
visualizations of the
requirements of latest data, whereas
the Volcano STAR arethe LPassessed
also DAAC weeklyarchiveandcontains
storedall in the
the data, all possible
IDV and the AVAlevel 2
archives, the latter until 2017. These volcano archives
options and the most up to date processing levels for each on-demand product. allow quick data searches on particular
volcanoes
Data and visualizations
collected as part of the of URP
the latest data, whereas
Program are alsothe LP DAAC stored
eventually archive in contains
the LPallDAAC
the data, ASTER
all possible level 2 options and the most up to date processing levels for each on-demand product.
archive and are pulled over to the individual volcano archives as well. However, because of their
Data collected as part of the URP Program are also eventually stored in the LP DAAC ASTER
expedited classification, these data are processed quickly into the Level 1BE (expedited) format and
archive and are pulled over to the individual volcano archives as well. However, because of their
stagedexpedited
on the expedited datathese
classification, system webpage
data at thequickly
are processed LP DAAC into for
the immediate downloadformat
Level 1BE (expedited) and assessment.
and
Withinstaged
2 h ofonthethe
data being acquired,
expedited data system all scientists
webpage at involved with the
the LP DAAC forURP Program
immediate are automatically
download and
notified by emailWithin
assessment. and have2 h ofimmediate
the data being web-based
acquired, access to the
all scientists new scene.
involved with theAny URPsignificant
Program are changes
automatically
detected in the datanotified by emaileruption
of a particular and haveare immediate
disseminatedweb-based
to theaccess to the new
responsible scene. Any
monitoring agencies,
significantworking
local scientists changes detected in the dataas
on the eruption, ofwell
a particular eruption
as the global are disseminated
community through to the responsible
e-mail and mailing
monitoring agencies, local scientists working on the eruption, as well as the global community
lists. More detailed science analysis is then commonly performed over time and with the arrival of
through e-mail and mailing lists. More detailed science analysis is then commonly performed over
new data. All new, newly scheduled, and ongoing volcano observations of each URP volcano are
time and with the arrival of new data. All new, newly scheduled, and ongoing volcano observations
tracked bothURP
of each through
volcanoa database
are tracked and
bothemail system
through as welland
a database as email
web-based
system mapas welltool
as showing
web-basedall the
currentmap tool showing all the current targets color coded by ASTER observations status (Figurepin
targets color coded by ASTER observations status (Figure 3). Each color coded 3). is clickable
Each
allowing
colora coded
query pinof the latest observations
is clickable allowing a query andoflinks to theobservations
the latest metadata for andeach
linksscene. Also shown
to the metadata for is the
currenteach scene. Also
position of theshown
Terraissatellite.
the current position of the Terra satellite.
FigureFigure
3. The3. The ASTER
ASTER Urgent
Urgent RequestProtocol
Request Protocol (URP)
(URP)Program
Program scheduling
schedulinginterface usingusing
interface Google
Google
Maps, and maintained at the LP DAAC. All currently monitored URP target volcanoes areshown
Maps, and maintained at the LP DAAC. All currently monitored URP target volcanoes are shown with
with a color-coded pin. These are updated automatically when new targets are triggered or existing
a color-coded pin. These are updated automatically when new targets are triggered or existing ones
ones have a change of status. Each pin is clickable to display more information and links to other
have a change of status. Each pin is clickable to display more information and links to other metadata.
metadata. The position of the Terra spacecraft and its orbit tracks are also shown.
The position of the Terra spacecraft and its orbit tracks are also shown.Remote Sens. 2020, 12, 738 9 of 40
3.4. Statistical Analysis
All ASTER scenes used in this study were acquired from the LP DAAC through the NASA
EarthData web-based search tool using an initial search refinement by date. The refined datasets were
then downloaded as ASTER Level 2 surface kinetic temperature (AST_08) products. This data product
allows the most efficient way to identify volcanic activity by temperature within a given scene. Scenes
were automatically scanned and later visually inspected for any thermal variations. If no activity was
initially identified, a more detailed investigation for thermally elevated pixels was performed for each
scene. If this process yielded a negative result, the scene was classified as having no detectable volcanic
activity. If volcanic (thermal) activity was present, then the type of activity was classed as a plume,
lava flow, other flow, or summit hot spot. The cloud cover percentage was also visually determined for
all the scenes investigated. This was then compared to the ASTER Cloud Cover Assessment Algorithm
(ACCAA) value for future assessment analysis.
4. Results
4.1. ASTER Capabilities and Observation Strategies
The unique instrument characteristics that make ASTER particularly well suited for volcanic
observations include multispectral TIR data, routine TIR data at night, high spatial resolution data,
variable gain settings to limit data saturation, off-axis pointing, and generation of along-track digital
elevation models [3,36]. For example, the multispectral TIR data at a relatively high spatial resolution
allowed a variety of surface materials to be distinguished and a better understanding of thermal and
compositional mixing at the sub-100 m pixel scale [6,37,38]. The following are examples particularly
relevant to each of the ASTER instrument characteristics. For a complete list of all ASTER-specific
volcanological papers, see Appendix A.
4.1.1. Routine TIR Data at Night: Elevated Temperatures at Fuego Volcano, Guatemala
Unlike other orbiting instruments of similar spatial and temporal resolutions, ASTER routinely
acquires TIR data at night. In certain special observational modes (e.g., large and highly radiant lava
flows), VNIR nighttime data can also be acquired. Nighttime TIR have the advantage of reduced
residual solar heating, reduced thermal topographic effects, and typically have lower cloud percentages
compared to daytime scenes [3]. Subtle thermal anomalies are therefore more easily identified in
nighttime TIR data. A new study by Flynn and Ramsey [39] of Fuego volcano from (1 January 2000
until 30 April 2018) found that ASTER acquired 308 scenes—193 of which were collected at night.
Of those nighttime scenes, 109 had visible volcanic activity present, with 47 being summit hot spots
and 62 showing either lava flows or pyroclastic density currents (PDCs). These data were compared
to the Guatemalan monitoring agency’s weekly reports to determine the specific volcanic event that
could have caused the thermal detections in the ASTER data. This data synthesis is then used to create
volcanic hazard maps and cross check datasets for missed events. Without the nighttime TIR data,
many of these volcanic events may not have been observed.
4.1.2. Multispectral TIR Data: SO2 Plumes from Lascar Volcano, Chile
The multispectral resolution of the ASTER TIR data enabled Henney et al., [40] to detect and
measure very low SO2 concentrations (Remote Sens. 2020, 12, 738 10 of 40
Remote Sens. 2020, 12, x FOR PEER REVIEW 10 of 39
Figure 4. The map of the very low SO22 burden retrieved using ASTER TIR data acquired at Lascar
volcano, Chile (summit location: ◦ S, 67.73◦ W)
location: 23.37
23.37°S, 67.73°W) on 7 December 2004. ImageImage is draped on a visible
Google Earth image for context. Numbered
Numbered lineslines indicate
indicate transects
transects taken
taken through
through the plume and
reported in the original study. SO
study. 2 results were created using the Map_SO 2 software of Realmuto [41]
2
and each color bin corresponds to ~0.3 g/m of 2 of SO
SO22..Figure
Figuremodified
modifiedfrom
fromHenney
Henneyetetal.
al.[40].
[40].
4.1.3. High Spatial Resolution Data: TIR Analysis of Hawaiian Volcanoes
4.1.3. High Spatial Resolution Data: TIR Analysis of Hawaiian Volcanoes
The high spatial resolution of the ASTER data, in particular in the TIR, was documented by Patrick
The high spatial resolution of the ASTER data, in particular in the TIR, was documented by
and Witzke [42] for long-term mapping and monitoring of the active or potentially active volcanoes on
Patrick and Witzke [42] for long-term mapping and monitoring of the active or potentially active
the islands of Hawai’i and Maui. The goal of the study was to determine the baseline thermal behavior
volcanoes on the islands of Hawai’i and Maui. The goal of the study was to determine the baseline
over ten years (2000–2010) in order to assess thermal changes that may precede a future eruption.
thermal behavior over ten years (2000–2010) in order to assess thermal changes that may precede a
They used cloud-free kinetic temperature ASTER data acquired for the five major subaerial volcanoes
future eruption. They used cloud-free kinetic temperature ASTER data acquired for the five major
in Hawai‘i (Kı̄lauea, Mauna Loa, Hualālai, Mauna Kea, and Haleakalā). The data were geolocated
subaerial volcanoes in Hawai‘i (Kīlauea, Mauna Loa, Hualālai, Mauna Kea, and Haleakalā). The data
and stacked to create time-averaged thermal maps and to extract temperature trends over the study
were geolocated and stacked to create time-averaged thermal maps and to extract temperature trends
period. Conspicuous thermal areas were found on the summits and rift zones of Kı̄lauea, Mauna Loa,
over the study period. Conspicuous thermal areas were found on the summits and rift zones of
and the small pit craters on Hualālai. No thermal areas were detected on Haleakalā or Mauna Kea.
Kīlauea, Mauna Loa, and the small pit craters on Hualālai. No thermal areas were detected on
One limiting factor noted for the lack of detections was the pixel size of the ASTER TIR, which despite
Haleakalā or Mauna Kea. One limiting factor noted for the lack of detections was the pixel size of the
being one of the highest from orbit, was seen as still too large to detect possible subtle thermal changes
ASTER TIR, which despite being one of the highest from orbit, was seen as still too large to detect
as well as to identify small-scale, low-temperature thermal activity.
possible subtle thermal changes as well as to identify small-scale, low-temperature thermal activity.
4.1.4. Variable Gain Settings (VNIR/SWIR): High Temperature Monitoring of Klyuchevskoy
4.1.4. Variable
Volcano, RussiaGain Settings (VNIR/SWIR): High Temperature Monitoring of Klyuchevskoy
Volcano, Russia
The ASTER VNIR and SWIR (no longer functioning) subsystems both have/had the ability to
The
acquire dataASTER VNIR and
at different SWIR
data gain(no longerThe
settings. functioning)
VNIR hassubsystems
three settingsboth(low,
have/had
normal,theand
ability to
high),
acquire data at different data gain settings. The VNIR has three settings (low, normal,
whereas the SWIR had four (low1, low2, normal, and high). These gain settings must be set prior to and high),
whereas
scheduling thean
SWIR had four so
observation, (low1,
some low2, normal,
degree and high).
of advanced These gain
knowledge of settings
the targetmust be set prior
is required. to
They
scheduling an observation, so some degree of advanced knowledge of the target is required.
were created to limit data saturation in regions of excessively high or low radiance (e.g., bright glacier They
were createdsurfaces,
and clouds to limit data
darksaturation
water body in surfaces,
regions ofetc.).
excessively high
Typically, or low
these gainradiance
settings(e.g., bright glacier
are uniformly set
and clouds surfaces, dark water body surfaces, etc.). Typically, these gain settings
across all bands in the VNIR and the SWIR (when it was operating). However, a unique scenario was are uniformly set
across
createdallfor
bands in the VNIR
the volcano STARand the SWIR
whereby (when
every it was
other SWIR operating).
band wasHowever,
alternateda unique
betweenscenario was
the normal
created
and the for
low2thegain
volcano STAR
settings whereby
in order every other
to maximize theSWIR band of
possibility was alternated
capturing between
some the normal
unsaturated data
and the low2 gain settings in order to maximize the possibility of capturing some unsaturated data
of a future volcanic target that may have lava on the surface [25]. The saturation pixel-integratedRemote Sens. 2020, 12, 738 11 of 40
of a future volcanic target that may have lava on the surface [25]. The saturation pixel-integrated
brightness temperature for the SWIR ranged from 86 ◦ C in band 9 (wavelength = 2.336 µm and gain =
Remote Sens. 2020, 12, x FOR PEER REVIEW 11 of 39
high) to 467 ◦ C in band 4 (wavelength = 0.804 µm and gain = low2). For the VNIR, the range is 669 ◦ C in
band 3brightness
(wavelength = 0.807 µm
temperature for and gain =ranged
the SWIR high) to 1393
from
◦ C in band 1 (wavelength = 0.556 µm and gain =
86 °C in band 9 (wavelength = 2.336 μm and gain =
low). Byhigh)comparison,
to 467 °C in thebandTIR has only =one
4 (wavelength gain
0.804 μm setting
and gain and a saturation
= low2). pixel-integrated
For the VNIR, the range is 669brightness
°C in
temperature
band 3 of ◦
97 C. = 0.807 μm and gain = high) to 1393 °C in band 1 (wavelength = 0.556 μm and gain =
(wavelength
low). By
These comparison,
variable gain the TIR has
settings onlyproven
have one gainquite
settinguseful
and a saturation
for deriving pixel-integrated brightness
accurate pixel-integrated
temperature of 97 °C.
brightness temperatures of large, highly radiant lava flows over the ASTER mission lifetime.
These variable gain settings have proven quite useful for deriving accurate pixel-integrated
For example, Rose and Ramsey [43] describe the use of all three ASTER subsystems to monitor
brightness temperatures of large, highly radiant lava flows over the ASTER mission lifetime. For
the emplacement of multiple long lava flows at Klyuchevskoy volcano, Kamchatka during the 2005
example, Rose and Ramsey [43] describe the use of all three ASTER subsystems to monitor the
and 2007 eruptions.of In
emplacement 2007, long
multiple temperatures were
lava flows at extracted volcano,
Klyuchevskoy from 4 January
Kamchatka to during
7 June the
2007 and
2005 and fit into
the volcanic warning color codes over that period (Figure 5). For the first 4.5 months
2007 eruptions. In 2007, temperatures were extracted from 4 January to 7 June 2007 and fit into the of the eruption,
TIR data remained
volcanic warning unsaturated and that
color codes over the period
SWIR-derived
(Figure 5). temperatures, acquired
For the first 4.5 months ineruption,
of the high-gain TIRmode,
data remained unsaturated and the SWIR-derived temperatures, acquired
were only detectable in the highest SWIR wavelengths. This corresponded to the time period that in high-gain mode, were
only detectable
Klyuchevskoy in the highest
was designated withSWIR
yellow wavelengths.
and orange This corresponded
color to the time
codes, signifying period that
increasing levels of
Klyuchevskoy was designated with yellow and orange color codes, signifying increasing levels of
restlessness, but no eruption. From 26 April to 10 May, all TIR and SWIR-derived temperatures became
restlessness, but no eruption. From 26 April to 10 May, all TIR and SWIR-derived temperatures
saturated due to the emplacement of new open-channel lava flow that was radiant enough to be
became saturated due to the emplacement of new open-channel lava flow that was radiant enough
detected atdetected
the 15 m ◦ C) were detected for
to be at VNIR
the 15 mspatial
VNIR scale.
spatial VNIR-derived
scale. VNIR-derived temperatures
temperatures (852–895
(852–895 °C) were detected
the firstfortime
the in the
first eruption.
time These detections
in the eruption. took place
These detections took one
placeweek beforebefore
one week the alert levellevel
the alert waswasraised to
red (signifying
raised to red an(signifying
active eruption),
an activeattesting
eruption),to the importance
attesting of high-repeat,
to the importance non-saturated
of high-repeat, non-saturateddata for
data for the monitoring of these
the monitoring of these more remote volcanoes. more remote volcanoes.
5. Maximum
FigureFigure 5. Maximum ASTER-derived
ASTER-derived pixel-integrated brightnesstemperatures
pixel-integrated brightness temperatures detected
detected during
during the the
2007 eruption
2007 eruption of Klyuchevskoy
of Klyuchevskoy volcano,
volcano, Russia.
Russia. Thermal
Thermal infrared
infrared (TIR)temperatures
(TIR) temperatures are are denoted
denoted with
purplewith purple
squares; squares; shortwave
shortwave infrared temperatures
infrared (SWIR) (SWIR) temperatures with green
with green triangles;
triangles; and and visible/near-
visible/near-infrared
infrared (VNIR) temperatures with blue circles. The background colors represent the volcanic color
(VNIR) temperatures with blue circles. The background colors represent the volcanic color code issued
code issued by the monitoring agencies (yellow = elevated unrest above known background levels;
by the monitoring agencies (yellow = elevated unrest above known background levels; orange =
orange = heightened unrest with increased likelihood of eruption; red = eruption is forecast to be
heightened unrest with increased likelihood of eruption; red = eruption is forecast to be imminent).
imminent). TIR and SWIR temperatures become saturated (and VNIR temperatures become
TIR and SWIR temperatures
measureable) become
near the time shownsaturated
by the thin(and VNIR
vertical line.temperatures
This saturationbecome
indicatesmeasureable) near the
that a significant
time shown
amount byofthe thin radiant
highly verticallava
line.is This saturation
on the surface andindicates
occurred that a significant
despite amount
adjustments to theofSWIR
highly radiant
gain
lava is settings.
on the surface and occurred
Importantly, despite
this was more thanadjustments to the
two weeks before theSWIR
color gain settings.
code is changedImportantly, this was
to red. Modified
fromtwo
more than Roseweeks
and Ramsey
before[43].
the color code is changed to red. Modified from Rose and Ramsey [43].Remote Sens. 2020, 12, 738 12 of 40
Remote Sens. 2020, 12, x FOR PEER REVIEW 12 of 39
4.1.5. Off-Axis Pointing Capability: Improved Observational Frequency at Piton de la Fournaise
4.1.5. Off-Axis Pointing Capability: Improved Observational Frequency at Piton de la Fournaise
Volcano, France
Volcano, France
During
During thethe April–May
April–May 2018 2018 eruption
eruption of of Piton
Piton de
de lala Fournaise
Fournaise volcano
volcano on on Réunion
Réunion Island,
Island,
satellite-based
satellite-based surveillance of the thermal activity and emitted plumes was paired withwith
surveillance of the thermal activity and emitted plumes was paired near-real-
near-real-time
time flow modeling
flow modeling to createtoancreate an ensemble-based
ensemble-based approach inapproach
response to in the
response to the
crisis [44]. Thiscrisis [44]. effort
combined This
combined effort of four institutions in several countries using data from numerous
of four institutions in several countries using data from numerous sensors to model and forecast lava sensors to model
and
flowforecast
advancelavawas flow
doneadvance
as a proof was done as in
of concept a proof
order ofto concept
assist theinsmall
order to assist
staff of the the smallobservatory
volcano staff of the
volcano observatory
on the island. on the
Rapid data island. Rapid
acquisition was data acquisition
critical and providedwas critical
by MODIS and via
provided by MODIS
the MIROVA via
system
the MIROVA system to determine lava discharge rates. The less frequent but
to determine lava discharge rates. The less frequent but higher spatial resolution ASTER data were higher spatial resolution
ASTER
important data were
both for important
determining both
the for determining
length, shape andthe length,ofshape
direction andusing
the flow direction of the
the TIR dataflow using
(Figure 6),
the TIR data (Figure 6), as well as the precise location of the vent using the VNIR
as well as the precise location of the vent using the VNIR data. The TIR images served as a validation data. The TIR images
served
for the as a validation
MODIS data andfor the
the predicted
MODIS data andslope
down the predicted down slope
flow modeling, whereasflowthemodeling, whereasvent
VNIR-derived the
VNIR-derived
location was used vent aslocation was used
the initiation pointasfor thethe
initiation point forcritical
flow modeling, the flowformodeling, criticalDuring
model accuracy. for modelthe
accuracy. During the 35 day eruption, a total of 11 ASTER images were
35 day eruption, a total of 11 ASTER images were acquired. This average of ~1 image every 3 days acquired. This average of ~1
image every 3 days was a significant improvement over the nominal 16 day
was a significant improvement over the nominal 16 day repeat time for targets close to the equator. repeat time for targets
closeimproved
The to the equator.
temporalThe improved
resolutiontemporal
was onlyresolution
made possiblewas only
withmade possibleURP
the ASTER withProgram
the ASTER andURPthe
Program and the off-nadir pointing
◦ capability of 8° nominally
off-nadir pointing capability of 8 nominally and up to 24 for the VNIR. ◦ and up to 24° for the VNIR.
Figure 6. Piton de la Fournaise volcano, Réunion Island (summit location: 21.24◦ S, 55.71◦ E) during the
Figure 6. Piton de la Fournaise volcano, Réunion Island (summit location: 21.24°S, 55.71°E) during the
April–May 2018 eruption crisis. Image/data modified from Harris et al. [44]. A color-coded Moderate
April–May 2018 eruption crisis. Image/data modified from Harris et al. [44]. A color-coded Moderate
Resolution Imaging Spectroradiometer (MODIS) radiance image produced by the Middle InfraRed
Resolution Imaging Spectroradiometer (MODIS) radiance image produced by the Middle InfraRed
Observation of Volcanic Activity (MIROVA) monitoring system is draped over a 3D Google Earth
Observation of Volcanic Activity (MIROVA) monitoring system is draped over a 3D Google Earth
visible image for context. These KML image products are routinely produced by MIROVA. Draped on
visible image for context. These KML image products are routinely produced by MIROVA. Draped
both data sets is the nighttime ASTER TIR data acquired as part of the URP Program. The ASTER image,
on both data sets is the nighttime ASTER TIR data acquired as part of the URP Program. The ASTER
acquired 6 days after the triggering MODIS detection, shows the spatial details of the propagating lava
image, acquired 6 days after the triggering MODIS detection, shows the spatial details of the
flow as the brighter white pixels within the colorized MODIS pixels.
propagating lava flow as the brighter white pixels within the colorized MODIS pixels.
4.1.6. Generation of Along-Track Digital Elevation Models (DEMs): Volcanoes in Guatemala,
New Zealand,
4.1.6. andofMexico
Generation Along-Track Digital Elevation Models (DEMs): Volcanoes in Guatemala, New
Zealand, and Mexico
The ability to produce single 60 by 60 km scene DEMs from any daytime VNIR data is another
significant capability
The ability of the instrument.
to produce single 60 byImportantly,
60 km scenethese
DEMs data provided
from digitalVNIR
any daytime topography
data isfor most
another
of the Earth’s
significant land surface
capability at 10 m accuracy
of the instrument. early in
Importantly, the data
these mission whendigital
provided such information wasmost
topography for not
of the Earth’s land surface at 10 m accuracy early in the mission when such information was notRemote Sens. 2020, 12, 738 13 of 40
Remote Sens. 2020, 12, x FOR PEER REVIEW 13 of 39
available from other data sources such as radar. radar. Later in the
the mission,
mission, these
these individual-scene
individual-scene DEMs
were compiled
were compiledintointoa aseamless
seamless global
global datadata set known
set known asASTER
as the the ASTER
GlobalGlobal
DEM or DEM or GDEM.
GDEM. The GDEMThe
GDEM hassignal
has better betterto signal to noise
noise and removesandareas
removes areasor
of clouds ofother
clouds or other
artificial artificial
errors errorsfound
commonly commonly
in the
found in the single-scene
single-scene DEMs (Figure DEMs (Figure
7). The final 7). The final
version (v.3)version (v.3) was
was released released2019
in August in August
having2019 having
corrections
corrections
made to minormade to minor
areas areaserrors.
of known of known errors.
Figure 7.7. Examples
Examplesofof ASTER-derived
ASTER-derived DEMs
DEMs for Fuego
for Fuego Volcano,
Volcano, Guatemala
Guatemala (summit(summit 14.48◦ N,
location: location:
◦
14.48°N,
90.88 W).90.88°W). (A) Single-scene
(A) Single-scene DEM fromDEM from
VNIR VNIR
data data acquired
acquired on 10 December
on 10 December 2018.are
2018. Clouds Clouds are
causing
causing the erroneous
the erroneous topographic
topographic high
high that that obscures
obscures the summit
the summit and central
and central crater. crater. Theto
The pixel pixel
pixeltonoise
pixel
noise
is alsoisclearly
also clearly visible.
visible. (B) ASTER
(B) ASTER GDEM GDEM v3 using
v3 using onlyonly cloud-free
cloud-free scenes
scenes and and greatly
greatly improving
improving the
the signal
signal to noise
to noise of DEM.
of the the DEM.
Whereas the GDEM provides an excellent baseline for volcanological studies reliant upon
topography, it does not account for changes to the surface, either during the period used for the
GDEM creation (2000–2011) as they would have been averaged out or not included in subsequent
data. Dynamic
Dynamic topography
topographyisisa acharacteristic
characteristic ofof
mostmostactive volcanoes
active volcanoes andandaccurate knowledge
accurate knowledgeof that
of
topography
that becomes
topography important
becomes for anyfor
important typeanyof type
lava or
of pyroclastic flow forecast
lava or pyroclastic flowmodeling. Therefore,
forecast modeling.
current single-scene
Therefore, DEMs continue
current single-scene DEMs to be an important
continue to be andataset for volcanological
important studies using ASTER.
dataset for volcanological studies
Stevens
using et al., [45]
ASTER. noted
Stevens this[45]
et al., point in their
noted this study
point in examining
their study theexamining
accuracy of thethe ASTERofsingle-scene
accuracy the ASTER
DEM for Ruapehu
single-scene DEM for andRuapehu
Taranaki and
volcanoes
Taranakiin New Zealand.
volcanoes TheyZealand.
in New found anThey
average root-mean-squared
found an average root-
(RMS) error of ~10 m for the ASTER single-scene DEM compared to
mean-squared (RMS) error of ~10 m for the ASTER single-scene DEM compared to digitized digitized 1:50,000 scale topographic
1:50,000
maps,topographic
scale and later notedmaps, that
andthese
laterdata
notedwill
thatcontinue
these datato be relevant
will continue fortofuture surface
be relevant forchange
future even as
surface
global DEM products from radar systems came online. A later study by Huggel
change even as global DEM products from radar systems came online. A later study by Huggel et al., et al., [46] evaluated
the ASTER
[46] evaluatedDEM theagainst
ASTERsuch DEMa against
global dataset, the Shuttle
such a global Radar
dataset, Topography
the Shuttle RadarMission
Topography(SRTM) DEM.
Mission
The dataDEM.
(SRTM) were used for lahar
The data weremodeling
used for on Popocatépetl
lahar modeling on Volcano, Mexico.Volcano,
Popocatépetl They found that although
Mexico. They foundthe
higher number of errors in the ASTER DEM affected certain models more, both
that although the higher number of errors in the ASTER DEM affected certain models more, both the the ASTER and SRTM
DEMs were
ASTER and feasible
SRTM DEMs for lahar modeling,
were feasible butfor that
lahar verification
modeling,and butsensitivity analysisand
that verification of the chosen
sensitivity
DEM is fundamental
analysis of the chosen to DEM
deriving accurate hazard
is fundamental maps from
to deriving the modeled
accurate hazardinundation
maps fromareas. the modeled
inundation areas.
4.2. URP-Specific Results
4.2. URP-Specific
ASTER data Results
for a subset of volcanoes over several different time intervals were examined for this
studyASTER
and thedata
significant statistics
for a subset were compiled.
of volcanoes The volcanoes
over several differentwere
timeall continuously
intervals (or nearly for
were examined so)
active throughout these periods. The goal of this statistical analysis was to determine the improvement
this study and the significant statistics were compiled. The volcanoes were all continuously (or nearly
of the
so) URP throughout
active over the nominal
theseVolcano STAR
periods. Theobservations.
goal of thisFurther details
statistical such as
analysis the to
was number of cloudy
determine the
scenes, the number of scenes with confirmed activity and the days between successive
improvement of the URP over the nominal Volcano STAR observations. Further details such as the observations
were
numberalsoof
calculated. The interval
cloudy scenes, periods of
the number were: one year
scenes with(1confirmed
June 2018 to 31 Mayand
activity 2019)
thefordays
10 volcanoes;
between
successive observations were also calculated. The interval periods were: one year (1 June 2018 to 31You can also read