Loss of FLCN-FNIP1/2 induces a non-canonical interferon response in human renal tubular epithelial cells - eLife
←
→
Page content transcription
If your browser does not render page correctly, please read the page content below
RESEARCH ARTICLE

                                     Loss of FLCN-FNIP1/2 induces a non-
                                     canonical interferon response in human
                                     renal tubular epithelial cells
                                     Iris E Glykofridis1*, Jaco C Knol2, Jesper A Balk1, Denise Westland3,
                                     Thang V Pham2, Sander R Piersma2, Sinéad M Lougheed2, Sepide Derakhshan4,
                                     Puck Veen1, Martin A Rooimans1, Saskia E van Mil1, Franziska Böttger2,
                                     Pino J Poddighe5, Irma van de Beek5, Jarno Drost4, Fried JT Zwartkruis3,
                                     Renee X de Menezes6, Hanne EJ Meijers-Heijboer1, Arjan C Houweling5,
                                     Connie R Jimenez2*, Rob MF Wolthuis1*
                                     1
                                       Amsterdam UMC, location VUmc, Vrije Universiteit Amsterdam, Clinical Genetics,
                                     Cancer Center Amsterdam, Amsterdam, Netherlands; 2Amsterdam UMC, location
                                     VUmc, Vrije Universiteit Amsterdam, Medical Oncology, Cancer Center Amsterdam,
                                     Amsterdam, Netherlands; 3University Medical Center Utrecht, Center for Molecular
                                     Medicine, Molecular Cancer Research, Universiteitsweg, Utrecht, Netherlands;
                                     4
                                       Princess Máxima Center for Pediatric Oncology, Oncode Institute, Heidelberglaan,
                                     Utrecht, Netherlands; 5Amsterdam UMC, location VUmc, Vrije Universiteit
                                     Amsterdam, Clinical Genetics, Amsterdam, Netherlands; 6NKI-AvL, Biostatistics
                                     Unit, Amsterdam, Netherlands

*For correspondence:                 Abstract Germline mutations in the Folliculin (FLCN) tumor suppressor gene cause Birt–Hogg–
i.glykofridis@amsterdamumc.nl        Dubé (BHD) syndrome, a rare autosomal dominant disorder predisposing carriers to kidney tumors.
(IEG);                               FLCN is a conserved, essential gene linked to diverse cellular processes but the mechanism by
c.jimenez@amsterdamumc.nl            which FLCN prevents kidney cancer remains unknown. Here, we show that disrupting FLCN in
(CRJ);                               human renal tubular epithelial cells (RPTEC/TERT1) activates TFE3, upregulating expression of its
r.wolthuis@amsterdamumc.nl           E-box targets, including RRAGD and GPNMB, without modifying mTORC1 activity. Surprisingly, the
(RMFW)
                                     absence of FLCN or its binding partners FNIP1/FNIP2 induces interferon response genes
Competing interests: The             independently of interferon. Mechanistically, FLCN loss promotes STAT2 recruitment to chromatin
authors declare that no              and slows cellular proliferation. Our integrated analysis identifies STAT1/2 signaling as a novel
competing interests exist.           target of FLCN in renal cells and BHD tumors. STAT1/2 activation appears to counterbalance TFE3-
Funding: See page 25                 directed hyper-proliferation and may influence immune responses. These findings shed light on
                                     unique roles of FLCN in human renal tumorigenesis and pinpoint candidate prognostic biomarkers.
Received: 31 July 2020
Accepted: 16 January 2021
Published: 18 January 2021

Reviewing editor: Wilbert
Zwart, Netherlands Cancer
                                     Introduction
Institute, Netherlands               Renal cell carcinoma (RCC) is the most common form of kidney cancer representing up to 5% of
                                     newly identified cancer cases (Ferlay et al., 2019; Lopez-Beltran et al., 2006; Siegel et al., 2018).
   Copyright Glykofridis et al.
                                     Generally, RCCs are diagnosed in adults, with the exception of translocation RCC, which is driven by
This article is distributed under
                                     a hyper-activated fusion protein of the transcriptional activators TFE3 or TFEB and comprises 20–
the terms of the Creative
Commons Attribution License,         75% of RCCs in childhood (Ambalavanan and Geller, 2019; Caliò et al., 2019; Lee et al., 2018).
which permits unrestricted use       Birt-Hogg-Dubé syndrome (BHD) is a dominantly inherited kidney cancer syndrome caused by
and redistribution provided that     mono-allelic germline loss-of-function mutations of the essential and conserved Folliculin (FLCN)
the original author and source are   gene (Nahorski et al., 2011; Nickerson et al., 2002). The lifetime risk for BHD patients to develop
credited.                            RCC is ~10 times higher than for the unaffected population (Houweling et al., 2011;

Glykofridis et al. eLife 2021;10:e61630. DOI: https://doi.org/10.7554/eLife.61630                                                  1 of 36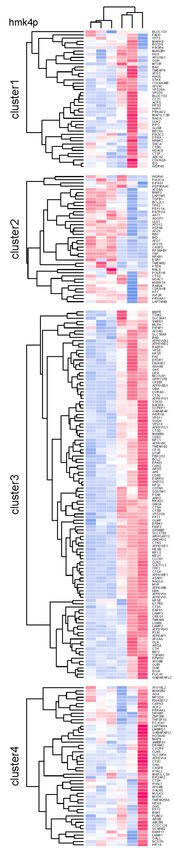
Research article                                                                          Cancer Biology Genetics and Genomics

                                    Pavlovich et al., 2005; Toro et al., 2008; Zbar et al., 2002). BHD patients are predisposed to bilat-
                                    eral and multifocal renal tumors (Nickerson et al., 2002; Schmidt et al., 2005; Zbar et al., 2002)
                                    and dependent on surveillance by renal imaging for early detection and curative treatment prior to
                                    metastasis (Johannesma et al., 2019). Loss of heterozygosity, by gene silencing or an inactivating
                                    somatic mutation of the wild-type FLCN allele, is a prerequisite for kidney cancer development in
                                    BHD patients (Vocke et al., 2005).
                                        Much of our understanding of BHD-related RCC is based on studies in BHD animal models
                                    (Chen et al., 2008; Chen et al., 2015; Hudon et al., 2010) and a BHD kidney tumor-derived cell
                                    line (Yang et al., 2008). These studies have connected FLCN to diverse cellular processes including
                                    mitochondrial biogenesis, stress resistance, autophagy, membrane trafficking, stem cell pluripo-
                                    tency, and ciliogenesis (Baba et al., 2006; Betschinger et al., 2013; Dunlop et al., 2014;
                                    Hasumi et al., 2012; Laviolette et al., 2013; Luijten et al., 2013; Nookala et al., 2012;
                                    Possik et al., 2014). The FLCN protein has been reported to affect multiple regulatory factors
                                    including mTOR, AMPK, HIF1, TGF-b, and Wnt (Baba et al., 2006; De Zan et al., 2020; El-
                                    Houjeiri et al., 2019; Hong et al., 2010b; Khabibullin et al., 2014; Mathieu et al., 2019;
                                    Preston et al., 2011; Yan et al., 2016). Nevertheless, the mechanism by which FLCN loss induces
                                    tumorigenesis is largely unknown. Conflicting results, such as activating or inhibitory effects of FLCN
                                    on mTOR signaling (Baba et al., 2006; Bastola et al., 2013; Hartman et al., 2009; Hasumi et al.,
                                    2009; Hudon et al., 2010; Napolitano et al., 2020; Takagi et al., 2008; Tsun et al., 2013), and the
                                    range of the processes attributed to FLCN loss, prohibit a clear understanding of the pathways by
                                    which FLCN suppresses renal tumorigenesis.
                                        Here, we present the molecular and cellular consequences of knocking out FLCN or its binding
                                    partners FNIP1/FNIP2 in a human renal proximal tubular epithelial cell model, representing the cells
                                    of origin of RCC (Holthöfer et al., 1983). We performed RNA sequencing (RNAseq) and proteo-
                                    mics, followed by pathway analyses and mining of regulatory promotor motifs of differentially
                                    expressed genes, revealing that FLCN loss induces two separate transcriptional signatures. The first
                                    is characterized by E-box controlled genes and confirms TFE3 as a main target of the FLCN-FNIP1/2
                                    axis (El-Houjeiri et al., 2019; Endoh et al., 2020; Hong et al., 2010b; Petit et al., 2013). Secondly,
                                    we discovered that loss of FLCN-FNIP1/2 induces a set of genes under control of interferon-stimu-
                                    lated response elements (ISREs). The ISRE gene activation program is directed by upregulate STAT1
                                    and STAT2 and may explain why loss of the FLCN tumor suppressor, paradoxically, reduces cellular
                                    proliferation. We propose that TFE3 and STAT1/2 are the two main, independent transcriptional
                                    effectors of FLCN-FNIP1/2 loss in human renal epithelial cells. Preliminary data indicate that these
                                    gene networks may also be activated in BHD tumors. Taken together, our findings may help the
                                    development of prognostic biomarkers or targeted therapies.

                                    Results
                                    Knocking out FLCN activates TFE3 in renal proximal tubular cells
                                    To study the effects of FLCN loss in a context relevant for oncogenesis, we used an immortalized,
                                    diploid renal proximal tubular epithelial cell line (RPTEC/TERT1, ATCC CRL-4031; Wieser et al.,
                                    2008, hereafter called RPTEC) as a model system, which retains the capacity to form 3D tubular
                                    structures (Figure 1A). First, we constructed an inducible Cas9-expressing RPTEC cell line and veri-
                                    fied doxycycline-induced Cas9 protein expression by immunoblots (Figure 1B). Because a TP53-
                                    dependent DNA damage response prohibits effective gene editing in some cell types
                                    (Haapaniemi et al., 2018; Ihry et al., 2018), we simultaneously knocked-out TP53 and FLCN to
                                    improve targeting efficiency. Guide RNAs (gRNAs) targeting 5’ coding exons of TP53 and FLCN
                                    (Figure 1C) were co-transfected and targeted exons of single-cell derived clones were sequenced.
                                    Indel analysis showed that each clone carried a unique genetic disruption of FLCN and TP53 (Fig-
                                    ure 1—figure supplement 1A). By karyotypic analysis, we found that four out of six knock out (KO)
                                    cell lines had become aneuploid (Figure 1D). We conclude, however, that aneuploidy occurred
                                    spontaneously during cell line formation because it appeared independently of FLCN, TP53, or
                                    inducible Cas9 status (Figure 1D). At a later stage, we indeed developed diploid FLCN knock out
                                    RPTEC cell lines using more advanced gRNA delivery assays (see below). However, considering that
                                    kidney tumors are often aneuploid (Kardas et al., 2005; Morlote et al., 2019), we first used the cell

Glykofridis et al. eLife 2021;10:e61630. DOI: https://doi.org/10.7554/eLife.61630                                                   2 of 36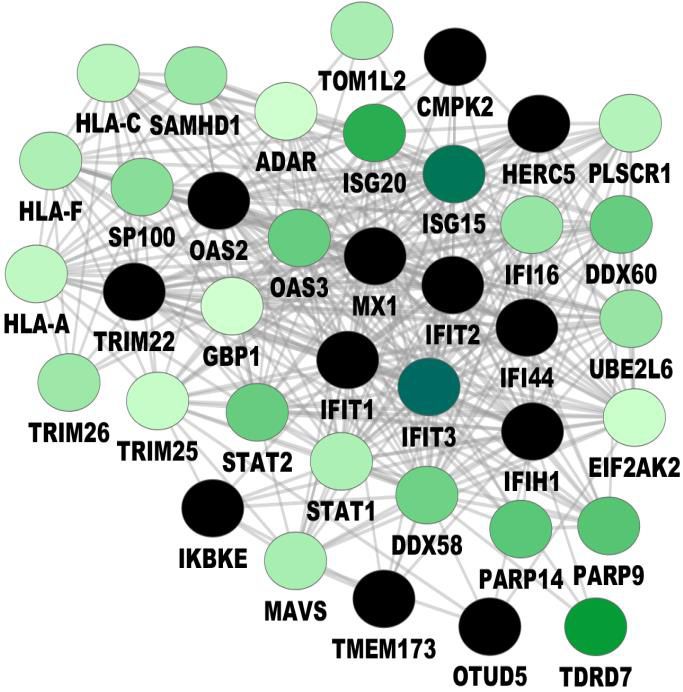
Research article Cancer Biology Genetics and Genomics
A RPTEC/TERT1
B
RPTEC/TERT1 tet on Cas9
Doxycycline : − +
150 Cas9
37 Actin
2D 3D
C ATG gFLCN_5 gFLCN_7
FLCN 5’- 1 2 3 4 5 6 7 8 9 10 11 12 13 14 -3’
ATG gTP53_4
TP53 5’- 1 2 3 4 5 6 7 8 9 10 11 -3’
D
Cell line FLCN indel status TP53 indel status Karyotype
RPTEC/TERT1 wt wt 46,XY (Wieser et al., 2008)
RPTEC tet on Cas9 wt wt 46,XY & 68~90,XXYY
RPTEC tet on Cas9 TP53KO wt KO (pool) 46,XY & 50~59,XXYY
RPTEC tet on Cas9 TP53KO FLCNKO C1 KO (exon 5: +1, -12, -15, -16) KO (exon 4: +1,-4,-16,-10) 59~87,XXYY
RPTEC tet on Cas9 TP53 KO FLCN KO C2 KO (exon 5: -15,-16,-14) KO (exon 4: -11, -4, -7) 57~59,XXYY
RPTEC tet on Cas9 TP53KO FLCN KO C3 KO (exon 7: -4, -4) KO (exon 4: +1, +1) 46,XY
E F RPTEC/TERT1 tet on Cas9 TP53KO
RPTEC/TERT1 TFE3 LAMP2
2% FCS 0% FCS 0% FCS minus AA AA addback
150
Vinculin
100
75
FLCN
2% FCS 0% FCS 0% FCS minus AA AA addback
37 AQP1
37
RPTEC/TERT1 tet on Cas9 TP53 KO FLCNKO C3
GAPDH TFE3 LAMP2
FLCNPOS FLCNNEG
2% FCS 0% FCS 0% FCS minus AA AA addback
2% FCS 0% FCS 0% FCS minus AA AA addback
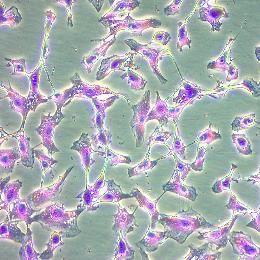
Figure 1. Renal proximal tubular epithelial cells as a model for FLCN loss. (A) Brightfield images (50 magnification) of a human renal proximal tubular
epithelial cell model (RPTEC/TERT1). Left image shows 2D culture of cells with typical dome formation. Right image shows 3D tubular structures that
form when RPTECs are cultured according to Secker, 2018. (B) Doxycycline-inducible Cas9 expression of RPTEC tet-on Cas9 cell line. Cas9 protein
expression after 24 hr treatment with 10 ng/ml doxycycline was assessed by immunoblotting. Experiment was performed twice. (C) CRISPR/Cas9-
Figure 1 continued on next page
Glykofridis et al. eLife 2021;10:e61630. DOI: https://doi.org/10.7554/eLife.61630 3 of 36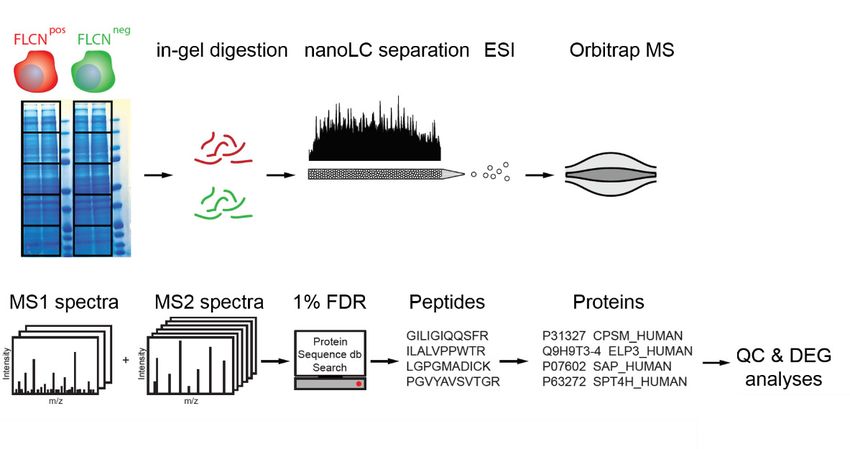
Research article                                                                                 Cancer Biology Genetics and Genomics

Figure 1 continued
mediated knockout strategy of FLCN and TP53 in RPTEC/TERT1 cells; gRNAs were designed to target early exons of FLCN and TP53 coding regions.
(D) Overview of FLCN and TP53 indel status and karyotype per selected cell line clone. Cell-line-specific Sanger sequence chromatograms are shown in
Figure 1—figure supplement 1A. (E) Western blot of FLCN protein levels of indicated cell line clones. Expression of renal proximal tubular-specific
marker AQP1 is shown as a control. Dotted lines indicate separate blots. Western blot of TP53 protein levels is shown in Figure 1—figure supplement
1B. (F) Immunofluorescence staining of TFE3 and lysosomal marker LAMP2 show enhanced nuclear TFE3 upon FLCN loss independent of nutrient
availability. FCS = fetal calf serum, AA = amino acids. Staining of FLCNKO RPTEC C1 and C2 are shown in Figure 1—figure supplement 1C.
The online version of this article includes the following figure supplement(s) for figure 1:
Figure supplement 1. Characterization of TP53KO and FLCNKO cell lines.

                                    lines of Figure 1D to identify FLCN-specific effects that occur independently of karyotype. We
                                    started by comparing two groups of cell lines: RPTEC (‘WT’), RPTEC tet-on Cas9 (‘Cas9’), and RPTEC
                                    tet-on Cas9 TP53-/- (‘TP53KO‘) were assigned to the FLCNPOS group, while three individually isolated
                                    RPTEC tet-on Cas9 TP53-/- FLCN-/- clones (‘FLCNKO C1‘,‘FLCNKO C2‘, and ‘FLCNKO C3‘) were
                                    assigned to the FLCNNEG group. C1 and C2 were created by gRNAs targeting FLCN exon 5
                                    (‘gFLCN_5‘) and C3 by gRNAs targeting FLCN exon 7 (‘gFLCN_7‘). Loss of FLCN and TP53 protein
                                    expression was confirmed by immunoblots, which also showed that expression of the renal proximal
                                    tubular marker aquaporin-1 (AQP1) was unchanged (Bedford et al., 2003; Figure 1E and Figure 1—
                                    figure supplement 1B).
                                        Previous studies reported that FLCN prevents nuclear localization of TFE3 under nutrient-rich
                                    conditions. TFE3, and its close family member TFEB, are transcription factors directing an autophagy
                                    and stress tolerance gene program under growth restrictive conditions (Hong et al., 2010a;
                                    Wada et al., 2016). To investigate the status of this pathway in our FLCN knock-out RPTEC cell
                                    models, we visualized TFE3 localization in the presence or absence of FLCN. Immunofluorescence
                                    co-staining of TFE3 and the lysosomal marker LAMP2 in either fed, starved, or amino acid (AA)-
                                    depleted conditions are shown in Figure 1F and Figure 1—figure supplement 1C. RPTEC cells
                                    showed cytoplasmic TFE3 under normal growth conditions but TFE3 completely translocated to the
                                    nucleus after withdrawal of serum and amino acids (Figure 1F, upper panels). In contrast, TFE3 local-
                                    ized in the nucleus of the majority of cells from each of the three RPTEC FLCNNEG cell lines, inde-
                                    pendent of starvation or refeeding, revealing that FLCNNEG cells fail to convey proper nutrient
                                    sensing and TFE3 responses (Figure 1F, lower panels and Figure 1—figure supplement 1C). We
                                    conclude that, in the absence of FLCN, TFE3 is constitutively active in renal epithelial cells, confirm-
                                    ing TFE3 as a bona fide target of the FLCN tumor suppressor (El-Houjeiri et al., 2019; Wada et al.,
                                    2016).

                                    Overlapping transcriptomic and proteomic alterations induced by FLCN
                                    loss
                                    Subsequently, we determined changes in gene transcription and protein expression patterns in our
                                    FLCNPOS and FLCNNEG RPTEC cell lines by mRNA sequencing (RNAseq) and proteomic workflows
                                    shown in Figure 2A. For specificity, we only compared profiles of the FLCNPOS and FLCNNEG cell
                                    lines between the groups defined by rectangles in Figure 2—figure supplement 1A (for RNAseq)
                                    and Figure 2—figure supplement 2A (for proteomics). To correct for possible clonal effects on
                                    global transcription, three different TP53 knock-out clones were included in the RNAseq analysis.
                                    We used edgeR (Robinson et al., 2010) to identify FLCN-related effects and visualized differential
                                    expressed genes in volcano plots (Figure 2B). Green circles show genes upregulated in FLCNNEG
                                    cells and pink circles indicate genes expressed at a higher level in control (FLCNPOS) cells. The
                                    threshold line represents a false discovery rate (FDR) of
Research article                                                                                   Cancer Biology Genetics and Genomics

     A
                  TRANSCRIPTOMICS
                  PROTEOMICS

     B                                                         C
                                     RNA           FLCN POS                             PROTEIN            FLCN POS
                                                   FLCN NEG                                                FLCN NEG
                                                              -log10 p-value
    -log10 FDR

                                    log2 FC                                             log2 FC

     D                                                         E

                                                                                                         TP53KO_Repl2
                                                      TP53KO_C3                                          TP53KO_Repl1
                                                                                                         CAS9_Repl2
                                                      TP53KO_C1                                          CAS9_Repl1
                                                                                                         WT_Repl2
                                                      TP53KO_C2                                          WT_Repl1
                                                                                                         FLCNKO_C3_Repl2
                                                      FLCNKO_C3                                          FLCNKO_C3_Repl1
                                                                                                         FLCNKO_C1_Repl2
                                                      FLCNKO_C2                                          FLCNKO_C1_Repl1
                                                                                                         FLCNKO_C2_Repl2
                                                      FLCNKO_C1                                          FLCNKO_C2_Repl1

Figure 2. Integrated transcriptomic and proteomic analyses of renal tubular FLCN loss. (A) Schematic overview of transcriptomic and proteomic
workflows. (B) Volcano plot showing significantly increased or decreased expression of genes in FLCNPOS vs. FLCNNEG comparison derived from
transcriptomic analysis. Colored circles above threshold line are FDR < 0.05; statistical details can be found in Materials and methods section. (C)
Volcano plot showing (significantly) increased or decreased expression of proteins in FLCNPOS vs. FLCNNEG comparison derived from proteomic
Figure 2 continued on next page

Glykofridis et al. eLife 2021;10:e61630. DOI: https://doi.org/10.7554/eLife.61630                                                                      5 of 36
Research article                                                                                  Cancer Biology Genetics and Genomics

Figure 2 continued
analysis. Colored circles above threshold line are p
Research article Cancer Biology Genetics and Genomics
A RNA
B RPTEC/TERT1 tet on Cas9 TP53KO
C3 C1 C2C1 C2 C3
FLCNpos FNIP2 GPNMB RRAGD
FLCNneg
6 100 300
4 200
50
2 100
0 0 0
Relative expression (fold change)
SQSTM1 RRAGC GABARAP
6 10 6
4 4
5
2 2
0 0 0
ARHGAP12 AMDHD2 WIPI1
6 6 6
4 4 4
2 2 2
0 0 0
C1 C2 C3 C1 C2 C3 C1 C2 C3 C1 C2 C3 C1 C2 C3 C1 C2 C3
FLCN POS FLCN NEG FLCN POS FLCN NEG FLCN POS FLCN NEG
C
RPTEC/TERT1 tet on Cas9
75 150
SQSTM1 FNIP2
100 GPNMB
37
GAPDH 37 Actin
50
RRAGD
37
GAPDH
D
FLCNKO C1-C3 +siNT
1.5
FLCNKO C1-C3 +siTFE3/TFEB
Relative fold change
1.0
0.5
0.0
1
2
1
P
2
D
C
B
E3
EB
2
I
D
P1
M
A
G
G
M
IP
IP
TF
H
ST
R
TF
A
A
PN
W
A
FN
D
A
R
R
G
SQ
M
B
G
R
R
H
A
A
R
G
A
Figure 3. FLCN loss results in upregulation of subset of TFE target genes. (A) Heat map showing k-means Pearson correlation clustering of TMM-
normalized RNAseq data of FLCNpos versus FLCNneg RPTECs. We analyzed published TFEB/TFE3 target genes. Yellow boxed cluster three shows the
subset (n = 115) of TFEB/TFE3 targets upregulated in all three FLCNNEG clones. (B) Upregulation of TFE target genes FNIP2, GPNMB, RRAGD,
SQSTM1, RRAGC, GABARAP, ARHGAP12, AMDHD2, and WIPI1 in FLCNNEG RPTECs. Results of three independent experiments with three technical
Figure 3 continued on next page
Glykofridis et al. eLife 2021;10:e61630. DOI: https://doi.org/10.7554/eLife.61630 7 of 36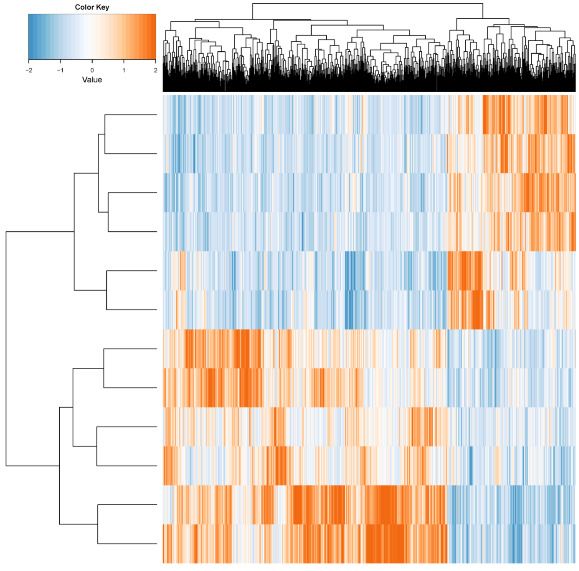
Research article Cancer Biology Genetics and Genomics
Figure 3 continued
replicates. To determine quantitative gene expression levels, data were normalized to the geometric mean of two housekeeping genes. See Figure 3—
source data 1 for raw qRT-PCR values and fold change calculations. (C) Western blots of RPTEC/TERT1 tet-on Cas9 cell lines. All FLCNNEG clones show
strong induction of protein expression of TFE targets GPNMB, RRAGD, SQSTM1, and FNIP2. GAPDH and Actin were used as loading controls. Western
blots were performed three times. (D) Knock down of TFE3/TFEB (10 nM siRNA, 72 hr) ameliorates the TFE expression gene signature induced by FLCN
loss in three FLCNNEG clones. Expression levels were determined by qRT-PCR, normalized to siNT-treated clones and are representative of three
independent experiments. To determine quantitative gene expression data levels were normalized to the geometric mean of two housekeeping genes.
Also see Figure 8—figure supplement 1C. Effects of siTFE3 alone are shown in Figure 3—figure supplement 1C. See Figure 3—source data 1 for
raw qRT-PCR values and fold change calculations.
The online version of this article includes the following source data and figure supplement(s) for figure 3:
Source data 1. Raw qRT-PCR values and fold change calculations belonging to Figure 3B and D and Figure —figure supplement 1C.
Figure supplement 1. Comparative analyses of RPTEC FLCNPOS vs. FLCNNEG cell line pairs and validations of TP53WT FLCNKO RPTEC cell line.
mTOR in response to starvation did not differ between FLCNPOS and FLCNNEG as detected by
immunofluorescent co-staining of mTOR and lysosomal marker LAMP2 (Figure 4B, FLCNNEG C3 is
representative of the three FLCNNEG clones which all show normal mTOR dynamics). So, in contrast
to several previous studies, but in line with a recent report (El-Houjeiri et al., 2019), we found no
evidence for directly altered mTOR signaling or nutrient sensing in the absence of FLCN in renal
tubular cells.
An interferon (IFN) gene signature is induced in the absence of FLCN
To further identify the main biological processes influenced by FLCN expression, we performed
Molecular Signatures Database (MSigDB) gene set enrichment analyses (GSEA) (Subramanian et al.,
2005) on both RNA and protein data sets (pre-ranked list of p-values, classic ES). Figure 5A displays
hallmark gene sets ranked by normalized enrichment score (NES) and significance (FDR is repre-
sented by the size of the dot). Gene sets significantly enriched in either RNA or protein (FDR < 0.05)
are shown, with biological processes enriched in FLCNNEG indicated in green, and processes
enriched in FLCNPOS in pink. An overview of less significant (FDR > 0.05) hallmark gene sets is shown
in Figure 6—figure supplement 1A. We found a higher representation of cell cycle related pro-
cesses in FLCNPOS cells, in both RNA and protein data (Figure 5A, Figure 6—figure supplement
1A, pink marks: E2F_TARGETS, G2M_CHECKPOINT, MITOTIC_SPINDLE, MYC_TARGETS). Growth
curves confirmed that deletion of FLCN reduced proliferation of RPTEC cells significantly (p=8.31E-
11; Table 1 and accompanying Figure in Materials and methods), an unexpected effect of tumor sup-
pressor gene inactivation (Figure 5B). Other typical cellular processes and signal transduction cas-
cades that mark FLCNPOS RPTECs were MTORC1_SIGNALING, HYPOXIA, and
TGF_BETA_SIGNALING. Interestingly, however, in FLCNNEG RPTECs, the immune-response-related
hallmarks were highly significantly enriched in both RNA and protein data (Figure 5A, Figure 6—fig-
ure supplement 1A, IFN_GAMMA_RESPONSE, IFN_ALPHA_RESPONSE, COMPLEMENT). BinGO
(Maere et al., 2005) gene ontology analyses of differential expression patterns in FLCNNEG RPTECs
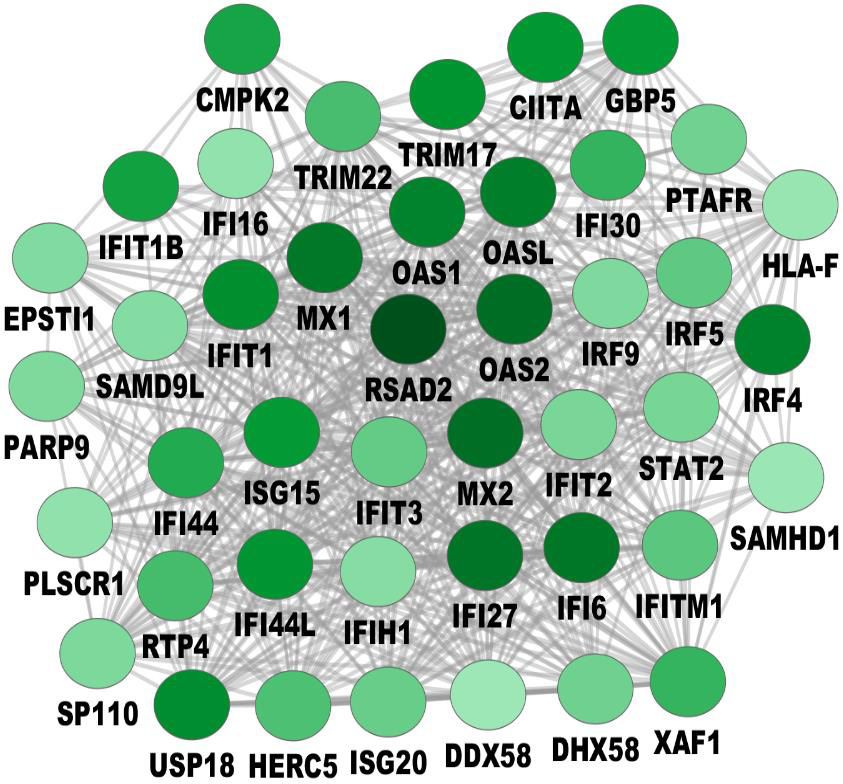
also revealed many overlapping immune and IFN response signature genes, including ISG15, IFIT1,
IF16, MX1, OAS2, and STAT2 in both RNA and protein data (Figure 5C,D; orange circles show over-
lap). These findings indicate that the IFN response signature program is a key target of FLCN in
renal epithelial cells.
Two distinct transcriptional programs are strongly induced by FLCN
loss
To specify how transcription is changed in FLCNNEG RPTEC, we used iRegulon (Janky et al., 2014),
which prioritizes candidate regulatory transcription factors based on enriched promotor motifs
upstream of the transcription start sites (TSS) (Figure 6A). The iRegulon analysis of distinct promotor
motifs directing genes upregulated in FLCNNEG (n = 711, FDR < 0.05 and logFC > 2) are shown in
Figure 6B. A similar overview is shown in Figure 6C, based on significantly upregulated proteins in
FLCNNEG RPTEC (n = 498, p 2).
Importantly, the majority of regulatory elements enriched in FLCNNEG RPTEC can be assigned to
either the basic helix-loop-helix E-box motif group (e.g. regulated by TFE3/TFEB) or to the Inter-
feron-Stimulated Response Element (ISRE) motif group (Figure 6D). In FLCNPOS RPTECs, iRegulon
Glykofridis et al. eLife 2021;10:e61630. DOI: https://doi.org/10.7554/eLife.61630 8 of 36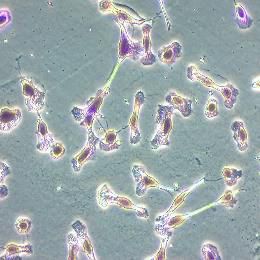
Research article                                                                                  Cancer Biology Genetics and Genomics

    A
                                  RPTEC/TERT1 tet on Cas9 TP53KO - serum starved

                     FLCNW T      FLCNKO   C3 FLCNKO C2
                                                                                           FLCNW T     FLCNKO   C3 FLCNKO C2

                                                        amino acids                                                             amino acids
                                                                                     75
               20                                                                                                               pS6K_T389
                                                          4E-BP1
                                                                                     75
               37                                                                                                               S6K
                                                          GAPDH
                                                                                     50                                         pPKB_S473
               75
                                                          FLCN                       37                                         GAPDH
               37                                         GAPDH
                                                                                     50                                         PKB
                                                                                      37
                                                                                                                                GAPDH

    B
    RPTEC tet on Cas9 TP53KO_serum starved                                   RPTEC_tet on Cas9 TP53KO FLCNKO C3_serum starved

    mTOR                  Lamp2                 Merge                        mTOR                 Lamp2                 Merge
    RPTEC tet on Cas9 TP53KO_ serum starved_minus AA                         RPTEC_tet on Cas9 TP53KO FLCNKO C3_serum starved_minus AA

    mTOR                  Lamp2                 Merge                        mTOR                 Lamp2                 Merge
    RPTEC tet on Cas9 TP53KO_serum starved_plus AA                           RPTEC_tet on Cas9 TP53KO FLCNKO C3_serum starved_plus AA

    mTOR                  Lamp2                 Merge                        mTOR                 Lamp2                 Merge

Figure 4. mTOR localization and signaling in response to starvation does not change upon FLCN loss in RPTEC. (A) To detect changes in canonical
mTOR signaling, phosphorylation levels of S6 kinase (S6K_T389) and AKT/PKB (PKB_S473) and total protein levels of S6K, AKT/PKB, 4E-BP1 were
assessed by western blot. Serum starved FLCNPOS and FLCNNEG RPTEC cell lines with and without additional amino acids (AA) depletion were
analyzed three times. (B) Immunofluorescence staining of mTOR and lysosomal marker LAMP2 show no FLCN dependent difference of mTOR
localization in response to starvation. FCS = fetal calf serum, AA = amino acids. Staining of FLCNNEG RPTEC C3 is representative for three independent
FLCNNEG clones.

Glykofridis et al. eLife 2021;10:e61630. DOI: https://doi.org/10.7554/eLife.61630                                                              9 of 36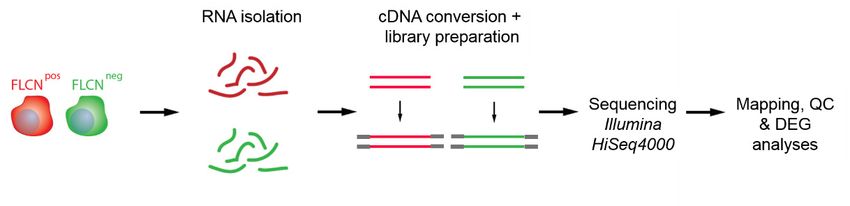
Research article                                                                                                               Cancer Biology Genetics and Genomics

    A                                                                          B
                                                                                                     RPTEC growth rates
                                                                                     5×10 6
                                                                                                  FLCNPOS C1
                                                                                                  FLCNPOS C2
                                                                                                  FLCNPOS C3
                                                                                                  FLCNNEG C1
                                                                                                  FLCNNEG C2
                                                                                                  FLCNNEG C3

                                                                       Cell number
                                                                                 2.5×10 6

                                                                                         0

                                                                                                     24

                                                                                                               96

                                                                                                                      0

                                                                                                                                4

                                                                                                                                      8
                                                                                              0

                                                                                                                    12

                                                                                                                              14

                                                                                                                                    16
                                                                                                           Time elapsed (h)

    C                          RNA
                                                                 D                                        PROTEIN

                                                         overlapping

Figure 5. Gene set enrichment analysis reveals FLCN-dependent biological processes. (A) For Gene Set Enrichment Analysis (GSEA) genes or proteins
were ranked based on p-values, with genes/proteins that are expressed significantly higher in FLCNNEG RPTECs shown on top of the list (hallmark gene
sets, classic ES). Enriched hallmark gene sets are ranked by normalized enrichment score (NES). Gene sets enriched in FLCNNEG are shown in green
and gene sets enriched in FLCNPOS in pink. The size of the dot reflects the significance of the enrichment (FDR=false discovery rate). Only biological
Figure 5 continued on next page

Glykofridis et al. eLife 2021;10:e61630. DOI: https://doi.org/10.7554/eLife.61630                                                                                     10 of 36
Research article Cancer Biology Genetics and Genomics
Figure 5 continued
processes that were significant in either RNA and/or protein data are depicted in this Figure. An extended version with all identified gene sets is shown
in Figure 6—figure supplement 1A. (B) FLCNNEG RPTECs grow significantly slower (p=8.31E-11) when compared to FLCNPOS RPTEC. Cell lines were
seeded in equal densities and total cell number was counted for 7 consecutive days. Results shown are representative for two independent
experiments. (C) Gene Ontology (biological processes, BinGO) analysis of mRNAs higher expressed in FLCNNEG RPTECs reveals highly overlapping
(orange circles) clusters of immune- and interferon-response-related genes between both data sets. Shade of green nodes represents fold change. (D)
Gene Ontology (biological processes, BinGO) analysis of proteins higher expressed in FLCNNEG RPTECs reveals highly overlapping (orange circles)
clusters of immune and interferon response related genes between both data sets. Shades of green nodes represent different levels of fold change.
Black nodes indicate uniquely detected proteins in FLCNNEG RPTEC.
analyses did not identify regulatory elements shared in both RNA and protein data (Figure 6—fig-
ure supplement 1B). Upregulation of E-box or ISRE motif-dependent genes induced by FLCN loss
in our RNAseq and proteomics analyses are shown in Figure 6E–H. Significant induction of the ISRE
targets MX1, ISG15, IRF9, IFIT1, STAT1, and STAT2 next to TFE3 and E-box targets GPNMB,
RRAGD, FNIP2, CTSD, and SQSTM1 were validated by qPCR in Figure 6—figure supplement 1C.
We then analyzed protein expression levels compared to normal human kidney lysates using mass
spectrometry of two independent BHD kidney tumors (Figure 6—figure supplement 1D and E).
Although full interpretation of these results awaits the analysis of a larger tumor sample size, we
observed elevated expression of both the ISRE as E-box associated genes in FLCNNEG BHD tumors
(Figure 6I). Based on these results, we conclude that FLCN loss upregulates two major gene classes:
TFE3/TFEB regulated E-box targets and IFN-associated ISRE targets. Our integrated analysis reveals
these genes and their protein products as candidate positive biomarkers for FLCN loss in BHD-
related kidney cancer.
FLCN-FNIP1/2 loss upregulates STAT2 in a cell-type-specific manner
FLCN acts in a protein complex with FNIP1 and FNIP2 (Baba et al., 2006; Hasumi et al., 2015;
Hasumi et al., 2008). When FNIP1 and FNIP2 are inactivated simultaneously, mice develop kidney
cancer (Hasumi et al., 2015). To investigate whether deletion of both FNIP1 and FNIP2 in RPTEC
had a molecular effect similar to that of FLCN loss, we created a FNIP1/FNIP2NEG RPTEC cell line
(Figure 7—figure supplement 1A) and analyzed gene induction. This confirmed that upregulation
of ISRE or E-box motif genes is specifically connected to inactivation of the FLCN-FNIP1/FNIP2 axis
(Figure 7A). Furthermore, TFE3 localized to the nucleus upon FNIP1/2 loss (Figure 7—figure sup-
plement 1B).
Having validated a new gene program targeted by the FLCN-FNIP1/2 complex in RPTECs, we
next determined whether FLCN-dependent control of ISRE target genes occurred in cells of different
tissue origin, too. Using a similar approach as in RPTEC, we created a FLCNNEG retinal pigment epi-
thelial cell line (RPE1/TERT tet-on Cas9 TP53KO Benedict et al., 2020; Figure 7—figure supplement
1C). Quantitative RT-PCR analyses revealed that, strikingly, ISRE and E-box associated genes were
not induced in RPE1 cells by FLCN loss (Figure 7B). RRAGD was the only exception yet was
induced ~10 times less strongly in RPE1 as compared to RPTEC cells. These results indicate that the
two main gene induction programs directed by FLCN-FNIP1/2 are renal specific.
To identify the dominant signature of regulatory elements responding to FLCN loss in RPTEC, we
further looked into the shared hits of RNA and protein data sets. Upon selecting the most signifi-
cantly overlapping effects (FDR < 0.01, n = 181) (Figure 7C), iRegulon analysis of differential RNAs
overlapping with differential proteins (r > 0.8, n = 49) upon FLCN loss predicted STAT1 and STAT2-
binding motifs as the most enriched upstream regulatory elements (Figure 7D).
To prove that these upregulated gene programs were truly FLCN dependent, we complemented
FLCNNEG RPTEC C2 by re-introducing FLCN (Figure 7—figure supplement 1D). FLCN re-expres-
sion in FLCNNEG RPTEC C2 restored regulation of TFE3 localization and nutrient sensing (Figure 7—
figure supplement 1E). Moreover, re-introducing FLCN completely reverted the ISRE expression
phenotype (Figure 7E). To confirm the roles of STAT1/2, we knocked them down using siRNAs in
FLCNNEG RPTEC C2. Quantitative RT-PCR showed that upregulation of the ISRE-associated gene
program was entirely STAT1/2-dependent (Figure 7E). In addition, immunoblotting subcellular frac-
tions showed higher protein levels of both STAT1 and STAT2 in FLCNNEG cells (Figure 7F).
Glykofridis et al. eLife 2021;10:e61630. DOI: https://doi.org/10.7554/eLife.61630 11 of 36Research article Cancer Biology Genetics and Genomics
A Differential genes B
FLCNPOS vs. FLCNNEG RPTEC RNA
TF NES # targets # motifs element
500bp TSS
IRF4 4,41 150 9 ISRE + AICE
FOS 4,19 72 2 TRE + AP-1
STAT2 3,69 94 1 ISRE
Identify master transcriptional PPARG 3,55 52 2 PPRE
regulators of genes
20kb TSS
HIGH in FLCNNEG RNF138 3,85 228 3 ?
MBTPS2 3,80 270 2 ?
C PROTEIN
REST 3,65 60 20 NRSE
TF NES # targets # motifs element D E-box ISRE
SREBF1 6,69 259 112 E-box + SRE
TFEB 5,87 166 4 E-box
ARNTL 5,22 142 5 E-box
IRF3 5,16 70 5 ISRE
STAT1 4,95 115 8 ISRE + GAS
HES5 4,88 99 4 E-box + N-box
500bp TSS
MITF 4,64 45 2 E-box + M-box
HES2 4,57 217 35 E-box + N-box
STAT2 4,41 24 2 ISRE
PAX2 4,06 102 3 ?
HIF1A 3,98 185 3 HRE E E-box
ns ns ns ns ns
USF1 3,91 157 16 E-box 8
MLXIPL 3,86 73 2 E-box
Normalized counts (RNA)
USF2 3,76 221 3 E-box
6
STAT1 3,58 20 2 ISRE + GAS
STAT2 6,68 36 2 ISRE 4
STAT1 5,74 29 2 ISRE + GAS
STAT1 5,48 309 14 ISRE + GAS
2
20kb TSS
MLXIPL 5,43 323 77 E-box
MXD4 3,95 111 1 ?
IRF1 3,80 33 1 ISRE 0 FLCNpos
F FLCNneg
B
1
1
1
1
2
G
EB
E3
D
USF1 3,80 221 8 E-box
H
IP
C
S1
M
M
G
A
TF
TS
SA
TF
ST
A
FN
VR
PN
VP
R
A
SQ
U
G
R
NKX2-3 3,74 163 3 ?
ns ns
SP1 3,71 226 2 GC-box 200
150
ISRE
G
Normalized counts (protein)
100
50
8 10
Normalized counts (RNA)
6
5
4
0
2
B
C
1
1
F
C
1
1
2
G
H
IP
C
S1
M
IT
G
FE
M
A
TS
SA
ST
A
VR
;M
FN
PN
VP
;T
R
A
EB
SQ
U
;R
E3
G
D
TF
TF
G
A
0
R
R
FLCNpos
I
S2
ST T 1
C I44
T2
IS 1
IF 5
C 22
F9
ST 4
TR 2
T1
T2
O 3
1
4
H
X
F
IT
1
IH
PK
27
IM
G
FLCNneg
I
I
A
A
IR
IR
A
M
IF
BHD tumor (n=2)
IF
IF
IF
D
M
ns
80
Normalized counts (protein)
200 Human kidney (n=2)
150
Normalized counts (protein)
100 40
50
10 30
20
5
10
0
1
X2
T2
B
1
1
T4
SQ G C
1
15
S1
IT
M
H
0
M
G
A
TA
;M
SA
ST
IF
A
PN
VP
ST
IS
R
X1
;S
A
X1 2
T2
C I44
IS 2
IF 5
C 22
F9
;S F 4
T1
T2
O 3
1
TR 2
4
ST T 4
G
;R
M AS
X
IT
1
IH
PK
27
T1
M
IM
G
D
I
I
A
IR
T1 IR
TA
;M
IF
IF
IF
IF
D
A
G
M
ST
A
R
R
A
ST
Figure 6. Identification of regulatory elements activated by FLCN loss in RPTEC and BHD tumors. (A) Identification of transcriptional regulatory
elements associated with loss of FLCN expression. Regulons were identified by iRegulon (Janky et al., 2014), using an input a list of differential
expressed genes (Figure 3). (B) Upstream regulons enriched in FLCNNEG RPTEC based on significantly upregulated genes derived from our
transcriptomic data set (n = 711, FDR < 0.05 and logFC > 2). Transcription factors with normalized enrichment scores (NES) higher than 3.5 are shown,
Figure 6 continued on next page
Glykofridis et al. eLife 2021;10:e61630. DOI: https://doi.org/10.7554/eLife.61630 12 of 36Research article Cancer Biology Genetics and Genomics
Figure 6 continued
together with detected number of targets, motifs, and elements. ISREs are highlighted in orange. Upper part shows motifs enriched 500 bp upstream
from transcription start site (TSS), lower part shows motifs enriched 20 kb around TSS. (C) Upstream regulons enriched in FLCNNEG RPTEC based on
significantly upregulated proteins derived from our proteomic data set (n = 498, p 2). Transcription factors with normalized enrichment
score (NES) higher than 3.5 are shown, together with number of targets, motifs, and elements detected. ISREs are highlighted in orange and E-boxes in
purple. STAT1 appears twice due to the fact that iRegulon ranks this transcription factor to be the most likely upstream regulator for two sets of targets
genes, containing slightly different ISRE-motifs 20 kb upstream from the TSS. (D) Two major enriched motif elements detected in iRegulon analysis of
genes upregulated in FLCNNEG RPTEC. Regulons can be assigned to E-box (in purple) or ISRE (in orange) motif group. (E) Bar graphs of RNA
expression levels of genes associated with an E-box motif, derived from RPTEC transcriptomic data set. FLCNPOS values are shown in pink and
FLCNNEG values are shown in green. Significant p-values are indicated as *0.05, **0.01, ***0.001, ****0.0001. (F) Bar graphs of protein expression
levels of genes associated with an E-box motif, derived from RPTEC proteomic data set. FLCNPOS values are shown in pink and FLCNNEG values are
shown in green. FNIP2 peptides were not detected in our proteomic experiment and therefore absent in the bar graph. Significant p-values are
indicated as *0.05, **0.01, ***0.001, ****0.0001. (G) Bar graphs of RNA expression levels of genes associated with an ISRE motif derived from
RPTEC transcriptomic data set. FLCNPOS values are shown in pink and FLCNNEG values are shown in green. Significant p-values are indicated as *0.05,
**0.01, ***0.001, ****0.0001. (H) Bar graphs of protein expression levels of genes associated with an ISRE motif derived from RPTEC proteomic
data set. FLCNPOS values are shown in pink and FLCNNEG values are shown in green. IRF9 and IRF4 peptides were not detected in our proteomic
experiment and therefore absent in the bar graph. Significant p-values are indicated as *0.05, **0.01, ***0.001, ****0.0001. (I) Dot plot of protein
expression levels of genes associated with an E-box (left) or ISRE motif (right) derived from BHD kidney tumor proteomic data sets (see Figure 6—
figure supplement 1D and E), as compared to normal kidney tissue. FLCNPOS values are shown in pink and FLCNNEG values are shown in green.
STAT2 levels were below detection levels in these protein extracts.
The online version of this article includes the following source data and figure supplement(s) for figure 6:
Figure supplement 1. Extended GSEA and iRegulon analysis of FLCN loss in RPTEC and BHD tumors.
Figure supplement 1—source data 1. Raw qRT-PCR values and fold change calculations belonging to Figure 6—figure supplement 1C.
Importantly, nuclear STAT2 was exclusively bound to chromatin in the absence of FLCN (Figure 7G)
identifying STAT2 as a key target of FLCN.
Canonical IFN signaling follows IFNa or IFNg stimulation of IFN receptors, resulting in auto-phos-
phorylation of Janus Kinases 1/2 (JAK1/JAK2) and Tyrosine Kinase 2 (TYK2). As a consequence,
STAT1 and STAT2 are phosphorylated enabling formation of (homo)dimers or the ISGF3 complex
(composed of STAT1, STAT2, and IRF9) which translocate to the nucleus to initiate transcription of
ISRE genes (Majoros et al., 2017). To understand how STAT2 is activated upon FLCN loss, we mea-
sured IFN levels in supernatant of FLCNNEG RPTEC cell lines, using a flow-cytometry-based cytomet-
ric bead array (CBA) or an enzyme-linked immunosorbent assay (ELISA). However, we did not detect
any secreted IFNg or IFNa, indicating that autocrine stimulation of IFN signaling did not cause the
upregulated ISRE gene program or chromatin binding of STAT2 in FLCNNEG RPTEC (Figure 7—fig-
ure supplement 1F). Also, we did not detect IFNA, IFNB and IFNG expression, nor differential
expression of the IFN receptors (IFNAR1, IFNAR2, IFNGR1 and IFNGR2) in FLCNNEG RPTEC (Fig-
ure 7—figure supplement 1G). Finally, in a recent phospho-proteomic analysis of our FLCNNEG cell
lines (not described in this paper), loss of FLCN did not lead to phosphorylation of upstream kinases
JAK2 and TYK, or STAT2 itself. Lack of induced STAT1 phosphorylation as detected by immunoblot
further confirmed that FLCNNEG cells do not activate the IFN receptor (Figure 7—figure supple-
ment 1H). Together, these results show that FLCN loss in RPTEC leads to a non-canonical, IFN-inde-
pendent activation of unphosphorylated STAT1 and STAT2.
FLCN loss counteracts TFE3-induced hyperproliferation
As the experiments described above confirm our hypothesis that both TFE3 and STAT2 are FLCN
targets, we started to investigate their potential contribution to renal cell transformation in vitro. We
aimed to compare the effect of TFE3 activation resulting from FLCN loss to that of an active TFE3
gene fusion that is constitutively nuclear. Xp11 translocation RCC is a rare subtype of kidney cancer
associated with various TFE3, TFEB, or MITF gene fusions, resulting in oncogenic, nuclear forms of
these transcription factors (Caliò et al., 2019). This type of RCC behaves remarkably aggressively,
with poor progression-free survival rates (Lee et al., 2018). One common fusion partner for TFE3 is
the DNA-binding splicing factor SFPQ (PSF), which we expressed in RPTEC. For comparison, we cre-
ated a new, diploid FLCN knock-out cell line by a recently improved gRNA and Cas9 delivery proto-
col (Figure 8—figure supplement 1A and B). In both SFPQ-TFE3 and FLCNKO RPTEC cell lines, we
confirmed high expression of TFE targets GPNMB, RRAGD, FNIP2, and WIPI1 (Figure 8A). TFE3 or
Glykofridis et al. eLife 2021;10:e61630. DOI: https://doi.org/10.7554/eLife.61630 13 of 36Research article Cancer Biology Genetics and Genomics
A B
RPTEC/TERT1 tet on Cas9 FNIP1/2 POS RPE/TERT1 tet on Cas9 TP53KO FLCNPOS
FNIP1/2 NEG FLCNNEG
ISRE E-box ISRE E-box
1000 12
500 8
Relative fold change
Relative fold change
4
50 2
25
0 0 *
STAT1
STAT1
ST T2
M 2
M 1
IS X1
IF 1
O IT1
O S2
S2
R D
FN GD
C SD
W D
W I1
I1
IR 9
F9
P B
R B
IS 15
IR 5
FNIP2
C 2
AT
X
IT
F
1
STAT1
STAT1
ST T2
M 2
M 1
IS X1
IF 1
O IT1
O S2
2
RA D
FN GD
CTSD
W SD
W I1
I1
IR 9
F9
PN B
R B
IS 15
IR 5
R AG
G NM
R NM
TS
IP
IP
IP
FNIP2
CT 2
G
G
AT
X
IT
AS
F
1
A
A
A
R AG
G NM
R M
T
IP
IP
IP
IF
A
G
G
A
A
ST
IF
P
ST
P
G
G
C Spearman correlations D iRegulon overlap RNA + PROTEIN
RNA + protein data TF NES # targets # motifs
all (n=5496) STAT2 11,74 26 20
FLCN diff exp (n=181) IRF3 11,19 13 10
500bp TSS
FDRResearch article Cancer Biology Genetics and Genomics
Figure 7 continued
qRT-PCR values and fold change calculations. (B) qRT-PCR levels of genes with ISRE or E-box motif in FLCNPOS and FLCNNEG retinal pigment epithelial
cells (RPE/TERT1 tet on Cas9 TP53KO) reveal that the identified FLCN dependent gene signature is absent in an epithelial cell type of another tissue
origin. Results shown are representative for two independent experiments. To determine quantitative gene expression data levels were normalized to
the geometric mean of two housekeeping genes. *OAS2 level in FLCNNEG RPE was too low to detect using qRT-PCR. See Figure 7—source data 1 for
raw qRT-PCR values and fold change calculations. (C) Spearman correlation analysis reveals overlapping FLCN-dependent RNA and protein data. FLCN
differential mRNAs and proteins (FDR < 0.01, n = 181, red line) showed a higher correlation than the overlap of all identified mRNAs and proteins in our
datasets (blue line). Statistical methods are described in Materials and methods section. (D) iRegulon analysis of differentially expressed genes
(FDR < 0.01) with highest correlation with differentially expressed proteins (r > 0.8, n = 49) reveal STAT1, STAT2, IRF1, and IRF3 as most obvious
upstream transcriptional regulators. Only regulons displaying normalized enrichment scores (NES) > 4.5 are shown. STAT2 appears twice due to the
fact that iRegulon ranks this transcription factor to be the most likely upstream regulator for two sets of targets genes, containing slightly different ISRE-
motifs upstream from the transcription start site (TSS). (E) Reintroducing FLCN (overexpression, OE) or siRNA-mediated knock down of STAT1/STAT2
(10 nM, 72 hr) revert the IFN expression gene signature induced by FLCN loss in RPTEC FLCNNEG C2. FLCN OE also lowers the enhanced expression of
E-box-associated target genes but knock down of STAT1/2 has no effect on E-box-associated genes. Expression levels were determined by qRT-PCR
and are representative of two independent experiments. To determine quantitative gene expression data levels were normalized to the geometric
mean of two housekeeping genes. See Figure 7—source data 1 for raw qRT-PCR values and fold change calculations. (F) Western blots of subcellular
fractionated samples show higher expression of STAT1 and STAT2 in FLCNNEG RPTEC as compared to FLCNPOS RPTEC. STAT2 was also detected in
both cytoplasmic and nuclear fractions. Tubulin and histone H3 levels were used as loading control and to distinguish each fraction (N=nuclear,
C=cytoplasmic). Results shown are representative of two independent fractionations. (G) Western blot of subcellular fractionated samples shows
enhanced STAT2 DNA binding in FLCNNEG RPTEC. Results shown are representative of three independent fractionations.
The online version of this article includes the following source data and figure supplement(s) for figure 7:
Source data 1. Raw qRT-PCR values and fold change calculations belonging to 7A, 7B and 7E.
Figure supplement 1. Validation of FLCNs role in the IFN response in additional cell models.
the constitutively active SFPQ-TFE3 fusion protein are both bound to chromatin fractions of FLCNKO
RPTEC or SFPQ-TFE3 RPTECs, respectively (Figure 8B). Knock down of TFE3/TFEB in the new TP53
wild-type FLCNKO RPTEC cell line confirmed that TFE is required for the E-box expression program
induced by FLCN loss (Figure 3D, Figure 8—figure supplement 1C).
Importantly, SFPQ-TFE3 expression did not induce IFN response genes in RPTECs, showing that
the IFN gene induction signature is a specific effect of FLCN loss (Figure 8A). Concordantly, STAT2
recruitment to chromatin was enhanced in the absence of FLCN but not detected after expression
of SFPQ-TFE3 (Figure 8B).
In agreement with the known growth inhibitory effects of the IFN stimulated gene program, but
unexpected considering that FLCN is a tumor suppressor gene, FLCN loss reduced RPTEC colony
formation and slowed cellular proliferation, regardless of TP53 status (Figure 8C upper panels,
Figure 5B). Indeed, re-introducing FLCN expression in FLCNKO RPTEC rescued cellular proliferation
(Figure 8D). Reversely, the absence of FLCN dominantly repressed the hyper-proliferative effects of
an active, oncogenic TFE3 fusion protein in RPTEC, similar to the growth reduction observed after
treating SFPQ-TFE3 RPTECs with 100 IU/ml IFNg (Figure 8C lower panels, Figure 8E). The growth
inhibitory effect of knocking out FLCN in SFPQ-TFE3 RPTECs also correlated with strong induction
of ISRE genes (Figure 8—figure supplement 1D). In conclusion, these results show that FLCN loss
induces a STAT2-mediated IFN signature that results in growth inhibition, which counteracts the
hyperproliferative effects of constitutive activation of TFE3 (Figure 8—figure supplement 1E). This
indicates that, next to its growth stimulatory effects on cell proliferation via TFE3 activation, loss of
FLCN also has a growth suppressive effect executed by STAT2 activation in renal tubular cells.
STAT2 activation may also contribute to a pro-oncogenic state by contributing to an inflammatory
response (Figure 8—figure supplement 1E). Determining the role of STAT2 activity in tumorigene-
sis will require further analysis of bio-markers and immune-infiltrates in a large set of BHD tumors.
Discussion
FLCN, together with its binding partners FNIP1 and FNIP2, forms a regulatory protein complex
found in species ranging from yeast to humans (Nookala et al., 2012; Pacitto et al., 2015;
Zhang et al., 2012). Pleiotropic effects resulting from its mutation in different model systems have
hampered a clear understanding of the biological function of the FLCN-FNIP1/2 axis. At the organis-
mal level, FLCN also plays different roles in different tissues. This is already apparent from the clinical
Glykofridis et al. eLife 2021;10:e61630. DOI: https://doi.org/10.7554/eLife.61630 15 of 36Research article Cancer Biology Genetics and Genomics
A RPTEC/TERT1
ISRE E-box
500
WT
250
SFPQ-TFE3
Relative fold change
FLCNKO
4
2
0
O S2
O 2
2
M 1
M 1
IS X1
ST T1
ST T1
ST T1
ST T2
ST T2
M 2
IF 1
IF 1
O T1
D
AGD
FN D
F9
IR 9
F9
P B
PN B
B
W I1
W I1
I1
CT D
CT D
SD
IS 15
IS 15
IR 5
FN P2
FN P2
CT 2
AS
AS
X
X
AT
IT
IT
F
1
RRAG
RR G
G M
G NM
RR M
S
S
IP
IP
IP
IP
G
G
G
A
A
A
A
A
IR
I
A
IF
I
I
A
PN
W
ST
G
B RPTEC/TERT1 C
Chromatin bound fractions
RPTEC/TERT1
WT FLCNKO
SFPQ-TFE3
75 TFE3
SFPQ-TFE3 SFPQ-TFE3 +
FLCNKO
15 Histone H3
100
STAT2
D E
RPTEC growth rates RPTEC growth rates
6×10 6 WT 2.4×10 6
FLCNKO
FLCNKO SFPQ-TFE3
FLCNKO + FLCN SFPQ-TFE3 + FLCNKO
SFPQ-TFE3 + IFNg
1.8×10 6
4×10 6
Cell number
Cell number
1.2×10 6
2×10 6
6×10 5
0 0
0 96 168 264 0 96 168
Time elapsed (h) Time elapsed (h)
Figure 8. FLCN loss induces an interferon signature which counteracts growth promoting effects of active TFE3 in renal tubular cells. (A) Expression of
a constitutively active SFPQ-TFE3 fusion protein in RPTEC results in upregulation of E-box-associated targets but does not induce enhanced expression
of ISRE-associated genes. FLCNKO RPTEC cells show both upregulation of E-box and ISRE-associated genes. Expression levels were determined by
qPCR and are representative of two independent experiments. To determine quantitative gene expression data, levels were normalized to the
Figure 8 continued on next page
Glykofridis et al. eLife 2021;10:e61630. DOI: https://doi.org/10.7554/eLife.61630 16 of 36Research article Cancer Biology Genetics and Genomics
Figure 8 continued
geometric mean of two housekeeping genes. See Figure 8—source data 1 for raw qRT-PCR values and fold change calculations. (B) Western blots of
subcellular fractions show enhanced binding of TFE3 to DNA in FLCNNEG RPTEC and SFPQ-TFE3 RPTEC. STAT2 DNA-binding was enhanced upon
FLCN loss but reduced by SFPQ-TFE3 over-expression in RPTEC. STAT2 was blotted on separate blots of the same lysates. Histone H3 levels were
used as loading control and as marker for chromatin fraction. Western blot was performed two times, using independent fractionations. (C) Colony
formation assays show that loss of FLCN in wild-type or SFPQ-TFE3 RPTEC reduces colony outgrowth. SFPQ-TFE3 RPTEC show more colonies than
wild type RPTEC after 10 days. Insets show bright field images (20 magnification). Cells were seeded in three technical replicates and experiment was
performed twice. (D) Loss of FLCN in RPTEC results in slower growth, which is reverted when FLCN expression is restored by over-expression. Cell lines
were seeded in equal densities and total cell numbers were counted three times within 11 days. Results shown are representative for two independent
experiments. (E) Treatment with IFNg (100IU/ml) or combining FLCNKO in SFPQ-TFE3 RPTEC results in growth inhibition. Cell lines were seeded in
equal densities and total cell number was counted twice within 7 days. Results shown are representative for two independent experiments. The growth
curve of FLCNKO RPTEC (D) is added for comparison.
The online version of this article includes the following source data and figure supplement(s) for figure 8:
Source data 1. Raw qRT-PCR values and fold change calculations belonging to Figure 8A and Figure 8—figure supplement 1C and D.
Figure supplement 1. Creation and validation of FLCNNEG and SFPQ-TFE3 RPTECs.
manifestations in BHD syndrome, varying from fibrofolliculomas of the skin, to pulmonary cysts with
increased risk for pneumothorax, and renal cysts associated with increased cancer risk (Birt et al.,
1977; Houweling et al., 2011; Nickerson et al., 2002; Schmidt et al., 2005; Zbar et al., 2002).
While manifestations in the skin and lung in BHD probably reflect an effect of FLCN haplo-insuffi-
ciency, kidney tumorigenesis in BHD carriers starts by complete functional inactivation of the remain-
ing wild type FLCN allele (van Steensel et al., 2007; Vocke et al., 2005). Here, we modeled the
molecular and cellular effects of FLCN inactivation in the cell type most relevant for kidney tumori-
genesis. The RPTEC/TERT1 cell line is widely accepted as an appropriate in vitro model system for
human kidney function (Aschauer et al., 2015). Nevertheless, it is important to emphasize that many
of our conclusions are based on independent clones derived from a single human cell line. Here, we
observed that loss of FLCN had three main effects in RPTEC/TERT1: (1) severely reduced cellular
proliferation, regardless of TP53 activity or alterations in karyotype; (2) nuclear accumulation and
activation of TFE3, concomitant with TFE3/TFEB-dependent upregulation of a specific set of E-box
genes linked to autophagy and lysosomal control; (3) IFN-independent upregulation and chromatin
binding of STAT2, activating a gene program of typical IFN response genes, possibly in cooperation
with STAT1. Upregulated genes besides STAT1 and STAT2 include MX1, IFIT1, ISG15, IRF9, and
OAS2. We found the combination of these two master gene programs to be a renal-specific
response to FLCN inactivation, also observed after knocking out FNIP1 and FNIP2. Re-expressing
FLCN reverted these effects, proving that they are specific to FLCN loss.
How these gene expression programs contribute to oncogenesis needs to be resolved, but TFE3
activation was clearly sufficient to promote uncontrolled, enhanced proliferation and loss of contact
inhibition in RPTEC cells (e.g. Figure 8). Knocking out FLCN in the context of active TFE3 slowed
cellular proliferation to the level observed after IFNg treatment. The upregulated IFN signature could
thus explain why loss of the FLCN tumor suppressor, paradoxically, represses cellular proliferation.
In relation to cancer, slow growth induced by FLCN loss and STAT2 upregulation may form a barrier
to TFE3-driven renal tumorigenesis in BHD patients. On the other hand, it is possible that the activa-
tion of the IFN program is associated with a pro-oncogenic inflammatory response. The TFE3 and
IFN signature programs are connected in this respect: TFE3/TFEB upregulate cytokines in macro-
phages that elicit an innate immune response linked to pathogen resistance (El-Houjeiri et al.,
2019). In our RPTEC FLCNNEG cell models however, we observed a clear downregulation in secreted
cytokine IL-8 and no consistent changes in IL-6 expression (data not shown), suggesting that, at least
in renal cells, the IFN program induced by FLCN inactivation is not connected to inflammation per
se.
Preliminary analysis of BHD tumor material showed the presence of immune cells at tumor mar-
gins (unpublished findings) and upregulation of ISRE genes (Figure 6I). Collectively our data lead to
the hypothesis that renal tumorigenesis in BHD patients could follow two different paths: either pro-
inflammatory effects of specific E-box and/or ISRE genes are further aggravated by secondary muta-
tions during tumor evolution, or growth-suppression by IFN signature genes, which is dominant over
the effects of TFE3 activation, is gradually lost by additionally acquired mutations thus leading to
Glykofridis et al. eLife 2021;10:e61630. DOI: https://doi.org/10.7554/eLife.61630 17 of 36Research article Cancer Biology Genetics and Genomics
TFE3-driven tumor progression. This suggests that certain IFN response genes which strongly reduce
proliferation form a deeper tumor suppressive layer protecting against uncontrolled proliferation in
the absence of sufficient FLCN expression. This hypothesis fits with the observation that renal tumors
specifically driven by TFE3 activation behave more aggressively as compared to slowly growing BHD
tumors. Speculatively, BHD tumors fall into two mutually exclusive classes, with either high or low
IFN signatures and/or STAT2 expression depending on their growth properties.
From our results, it is clear that FLCN loss promotes STAT2 binding to chromatin but we did not
resolve a clear mechanism by which FLCN loss promotes these changes. Because TFE3 activation is
not sufficient to induce STAT2 or upregulate ISRE genes, and reciprocally STAT1/2 siRNA does not
downregulate the E-box genes, we conclude that the two gene activation programs are separate
effects of FLCN loss. We considered that FLCN might affect STAT2 protein stability, in a similar man-
ner as observed for a number of viral proteins that bind directly to STAT2 (Grant et al., 2016;
Morrison et al., 2019) but found no evidence for direct complex formation between STAT2 and
FLCN. Also, the protein half-life of STAT2 was similar in the absence of FLCN and no shift was
observed in STAT2 nucleo-cytoplasmic distribution (data not shown).
With respect to candidate TFE3 target genes that drive renal epithelial cell transformation, it is
clear that in the absence of FLCN, particularly GPNMB, RRAGD, ASAH1 and FNIP2, the latter in an
apparent feedback mechanism, are strongly upregulated. In renal cells lacking FNIP1 and FNIP2,
GPNMB and RRAGD are also very strongly induced. This illustrates the potential value of GPNMB
and RRAGD as positive biomarkers for FLCN inactivation such as in BHD tumors.
GPNMB is a transmembrane protein frequently upregulated in a wide variety of tumors, including
lung and renal cancer, yet it is unclear whether GPNMB overexpression in itself is tumorigenic
(Taya and Hammes, 2018). Importantly, GPNMB can be targeted therapeutically using antibody-
drug conjugates which are in clinical trials for cancer therapy, such as glembatumumab vedotin
(Rose et al., 2017), providing an entry point for the evaluation of glembatumumab in the treatment
of BHD tumors. Furthermore, RRAGD is a candidate oncogenic target gene of TFE3, previously asso-
ciated with loss of FLCN (Di Malta et al., 2017; Tsun et al., 2013). Recently, Napolitano et al.,
2020 described TFEB to be the main driver of kidney abnormalities in a BHD mouse model. Their
results show that TFEB is phosphorylated by mTORC1 in substrate-specific mechanism that is medi-
ated by Rag GTPases. FLCN is a key regulator of Rag GTPases but despite the fact that we found
clear upregulation of both RagC and RagD, we found no evidence for mTORC1 hyperactivation in
our human in vitro model system. There might be crucial differences in renal tumorigenesis between
mice and humans, where mTORC1 activation may occur at a later stage in oncogenic transformation
of FLCNNEG renal epithelial cells.
In addition to the upregulated TFE3 and ISRE programs, we observed that several genes were
downregulated by FLCN loss. GSEA analyses of downregulated genes showed overlapping biologi-
cal processes but iRegulon analyses failed to reveal a clear common upstream transcriptional regula-
tor of these genes in mRNA and protein data. Taken together however, the repository of FLCN
target genes and proteins presented here provides a clear basis for further investigations into spe-
cific roles in kidney cancer and other BHD-related symptoms. This could facilitate the discovery of
biomarkers for early-stage tumorigenesis and therapeutic strategies to prevent or treat RCC metas-
tases in BHD patients.
Materials and methods
Cell culture
Renal proximal tubular epithelial cells (RPTEC/TERT1, ATCC CRL-4031) were maintained in DMEM/
F12 (Gibco, Life Technologies, Thermo Fisher Scientific Inc, Waltham, Massachusetts, US) according
to the manufacturer’s protocol with addition of 2% fetal bovine serum (FBS, Gibco). To maintain the
selective pressure for immortalization 0.1 mg/ml G418 Sulfate (Calbiochem, Merck, Darmstadt, Ger-
many) was added. Cell lines were cultured in a humidified atmosphere at 37˚C and 5% CO2. Retinal
pigment epithelial cells (RPE-1/hTERT, ATCC CRL-4000) were maintained in DMEM (Gibco, Life
Technologies) with addition of 8% FBS and 1 mM Sodium Pyruvate (Gibco, Life Technologies). The
generation of used RPE1-hTERT tet-on Cas9 TP53KO cells was described earlier (Benedict et al.,
2020). Both cell lines were obtained recently from ATCC and experiments were performed
Glykofridis et al. eLife 2021;10:e61630. DOI: https://doi.org/10.7554/eLife.61630 18 of 36You can also read