Pentalateral Energy Forum Support Group 2 Generation Adequacy Assessment Jan. 2018 - Admin.ch
←
→
Page content transcription
If your browser does not render page correctly, please read the page content below
- PLEF SG2 Generation Adequacy Assessment 2018 -

   Pentalateral Energy Forum
       Support Group 2

Generation Adequacy Assessment

                  Jan. 2018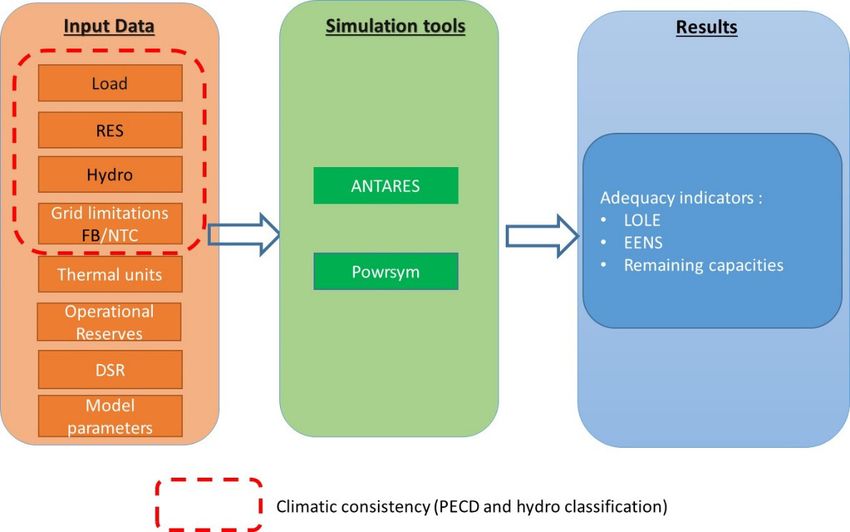
- PLEF SG2 Generation Adequacy Assessment 2018 -

Contents
1     Introduction..................................................................................................................................... 5
2     General approach ............................................................................................................................ 8
3     Methodology ................................................................................................................................. 10
    3.1      Preparation of input data ...................................................................................................... 10
    3.2      Grid modelling ....................................................................................................................... 18
    3.3      Demand Side Flexibility Model .............................................................................................. 28
    3.4      Generation Adequacy Models ............................................................................................... 30
4     Input data and assumptions .......................................................................................................... 38
    4.1      Country specifics ................................................................................................................... 38
    4.2      ROW data .............................................................................................................................. 47
5     Study framework ........................................................................................................................... 49
    5.1      Base Case ............................................................................................................................... 49
    5.2      Sensitivities ............................................................................................................................ 50
6     Results of the adequacy assessment............................................................................................. 53
    6.1      Results summary base case ................................................................................................... 53
    6.2      Results summary Sensitivity Analysis .................................................................................... 62
    6.3      TSO Comments on results ..................................................................................................... 68
7     Conclusions and Lessons learnt ..................................................................................................... 70
8     Appendix........................................................................................................................................ 72
    8.1      Frequently asked questions & answers................................................................................. 72
    8.2      Detailed Model descriptions ................................................................................................. 75
    8.3      FB modelling details .............................................................................................................. 85
    8.4      Net Transfer Capacities ......................................................................................................... 89
    8.5      Alignment of tools ................................................................................................................. 90
    8.6      Glossary ................................................................................................................................. 91
    8.7      Contact .................................................................................................................................. 92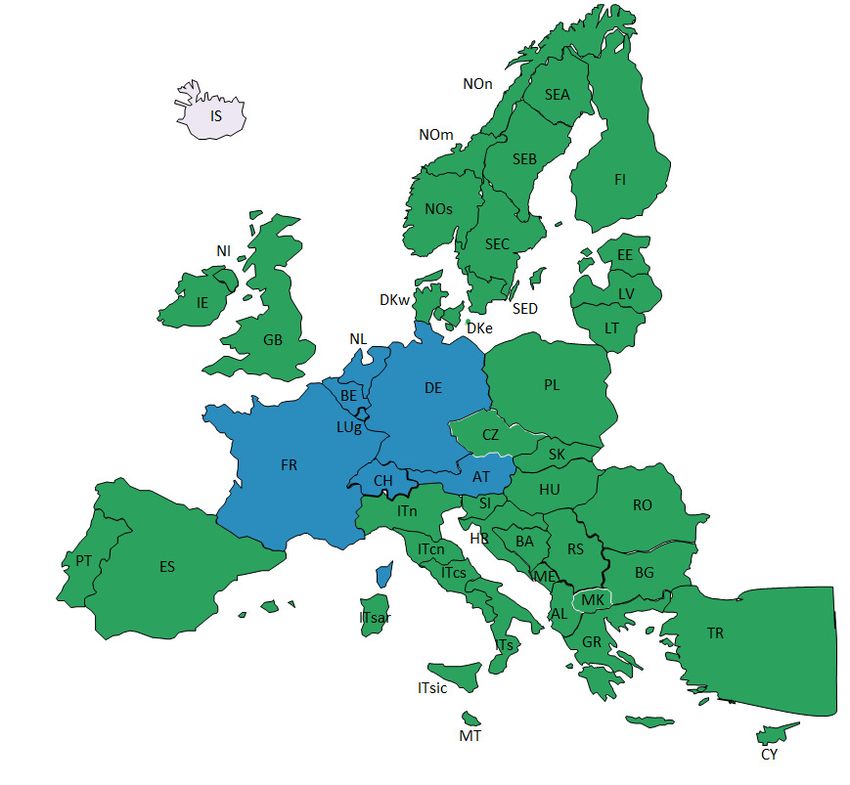
- PLEF SG2 Generation Adequacy Assessment 2018 -

Information about this document:

Description    Pentalateral generation adequacy assessment

Version        Final

Date           January 2018

Status         ( ) Draft                                  (X) Final version

Disclaimer:

It must be noted that the conclusions in this report are inseparable to the hypotheses described and
can only be read in this reference framework. The hypotheses were gathered by the TSOs according
to their best knowledge at the moment of the data collection and validated by ministries and regula-
tors. The TSOs emphasise that the TSOs involved in this study are not responsible in case the hypoth-
eses taken in this report or the estimations based on these hypotheses are not realised in the future.
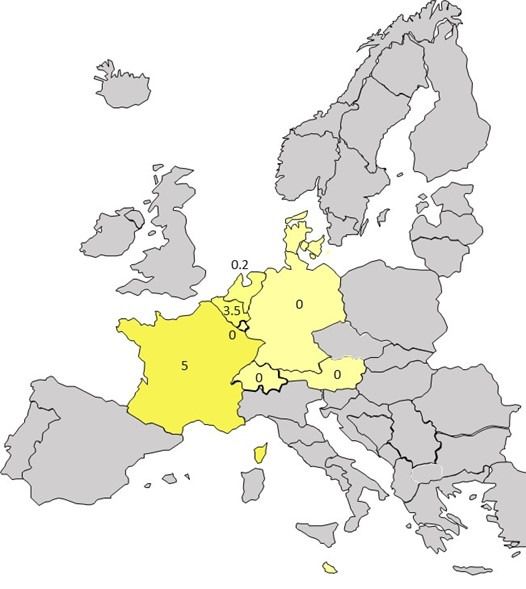
- PLEF SG2 Generation Adequacy Assessment 2018 -

Executive summary
This report provides the main findings of the second edition of the Pentalateral Generation Adequacy
Assessment (PLEF GAA 2.0). The study was carried out by the Transmission System Operators of the
seven countries cooperating in the Pentalateral Energy Forum (PLEF): Austria, Belgium, France, Ger-
many, Luxembourg, the Netherlands and Switzerland (Penta countries/region).

The Pentalateral Energy Forum is the framework for regional cooperation in Central Western Europe
(AT-BE-DE-FR-LU-NL-CH) towards improved electricity market integration and security of supply.

The first PLEF Generation Adequacy Assessment, issued in 2015 and based on the Political Declara-
tion of the Pentalateral Energy Forum of 7 June 2013 in which the Ministers of Energy requested a
Pentalateral Generation Adequacy Assessment, provided a first probabilistic analysis on electricity
security of supply in Europe conducted from a regional perspective, thus making it possible to better
assess generation adequacy jointly, on a regional scale covering the Penta countries. The know-how
on methodology as developed by the Penta TSOs has later on been transferred and applied within
the association of European electricity TSO's in ENTSO-E in the Midterm Adequacy Forecast (MAF).

This second Pentalateral Generation Adequacy Assessment focuses on two main aspects. The first
goal is the development of state of the art methodologies, high quality data collection and enhanced
adequacy modelling techniques and, by application of these methods, to obtain the second goal in
order to provide a probabilistic adequacy assessment for the Penta Region on the horizons defined
by the Ministries (short term: 2018/2019 and medium term: 2023/2024). These results provide deci-
sion-makers with a more holistic assessment of potential capacity scarcities in the Penta region.

Compared to the first assessment, important areas of improvement include better representation of
the grid by using a Flow-Based (FB) approach and an improved model for taking into account flexibili-
ties on the demand side. Also the climate database was extended from 14 to 34 years, now covering
historical weather from 1982 to 2015.

The quantitative results from this study are generally consistent with those from the ENTSO-E MAF
and from national studies. The differences are mainly because of different assumptions and data, the
details can be found in the report. The sensitivity analyses enable different scenarios in a regional
context. Some of these sensitivities, e.g. environmental, economic, as well as grid investment,
demonstrate how these factors can have an important influence on regional generation adequacy.

The results for the first time horizon (2018/2019) show that France and Belgium are most prone to
generation adequacy problems while similar observations can be made for the second time horizon
(2023/2024) for these countries with slight issues (less than 3 LOLE/year) also observable for coun-
tries like the Netherlands and Germany. The economic viability evaluation of Demand Side Flexibility
(DSF) provides an estimate of possible addition of available DSF in some of the PLEF countries for the
analysis of their impact on generation adequacy. The results show that DSF has a clearly positive
impact.

One of the main achievements of this study is the implementation of the FB approach at the regional
level. The approach for FB-Market-Coupling (FB-MC) is a significant step towards more realistic mod-
elling of operational planning in practice nowadays. Contrary to the constant NTC values defined for
long-term planning, representative historical FB domains are chosen as basis and linked to expected
climate and consumption conditions of each day for the winter 2018/19. Combined with the adjusta-
ble NTC values at the border between Germany and Switzerland based on the German wind produc-
tion, this approach is a simple yet realistic representation of what is observed in everyday practice in
the region. As this requires more detailed modelling and realistic inputs, at the moment, it is only
- PLEF SG2 Generation Adequacy Assessment 2018 -

possible to do this for the not-so-far future, i.e. FB approach for the 2018/2019 horizon only. With
breakthroughs in the methodology and grid modelling it would be also possible to conduct FB ap-
proach for the longer time horizon, which could be facilitated via regional cooperation.

The step towards a more realistic modelling of operational planning in practice also means that the
simulation results could better reflect the tight situations observed in practice leading to more realis-
tic adequacy assessment of the region. Because of the aforementioned reasons, the FB and NTC ap-
proaches used for the same time horizon likely lead to different outcomes. FB approach should be
target model, whenever possible, to reflect what is experienced in operational practice.

On the probabilistic approach, though it is quite developed the dependence of generation adequacy
results on climatic conditions is key and despite the extension of the climate database to cover 34
historical years it is still not long enough to cover the necessary meteorological evolution. In this
case, it might be beneficial to consult experts in this domain to evaluate or adjust the probability
assigned to each climate year.

As some of the steps are pioneering and experimental in this study some of the results should be
considered as indicative and evaluated together with those from the ENTSO-E MAF and the respec-
tive national studies, taking into account the differences in assumptions and data.
- PLEF SG2 Generation Adequacy Assessment 2018 -

Contents
1     Introduction..................................................................................................................................... 5
2     General approach ............................................................................................................................ 8
3     Methodology ................................................................................................................................. 10
    3.1      Preparation of input data ...................................................................................................... 10
      3.1.1          Pan European Climate Database ................................................................................... 10
      3.1.2          Load ............................................................................................................................... 10
      3.1.3          Demand Side Response (DSR) ....................................................................................... 11
      3.1.4          Wind and Solar .............................................................................................................. 11
      3.1.5          Hydro ............................................................................................................................. 11
      3.1.6          Thermal units and outages ............................................................................................ 12
      3.1.7          Outages of HVDC lines ................................................................................................... 12
      3.1.8          Fuel and CO2-prices ....................................................................................................... 13
      3.1.9          Perimeter ....................................................................................................................... 14
      3.1.10         Balancing Reserves ........................................................................................................ 14
      3.1.11         System Adequacy Mechanisms ..................................................................................... 15
    3.2      Grid modelling ....................................................................................................................... 18
      3.2.1          Import/Export capacity for the NTC approach .............................................................. 18
      3.2.2          CWE Flow-Based Model ................................................................................................ 19
      3.2.3          NTC vs. FB Model ........................................................................................................... 27
      3.2.4          Wind-Dependent Transmission Capacity ...................................................................... 27
    3.3      Demand Side Flexibility Model .............................................................................................. 28
    3.4      Generation Adequacy Models ............................................................................................... 30
      3.4.1          Advanced tools .............................................................................................................. 31
      3.4.2          Adequacy indicators and relevant model outputs ........................................................ 32
      3.4.3          Monte Carlo scheme - Convergence ............................................................................. 36
      3.4.4          Benefits from using two simulators .............................................................................. 37
4     Input data and assumptions .......................................................................................................... 38
    4.1      Country specifics ................................................................................................................... 38
      4.1.1          Austria ........................................................................................................................... 38
      4.1.2          Belgium .......................................................................................................................... 39
      4.1.3          France ............................................................................................................................ 41
      4.1.4          Germany ........................................................................................................................ 42
      4.1.5          Luxembourg ................................................................................................................... 44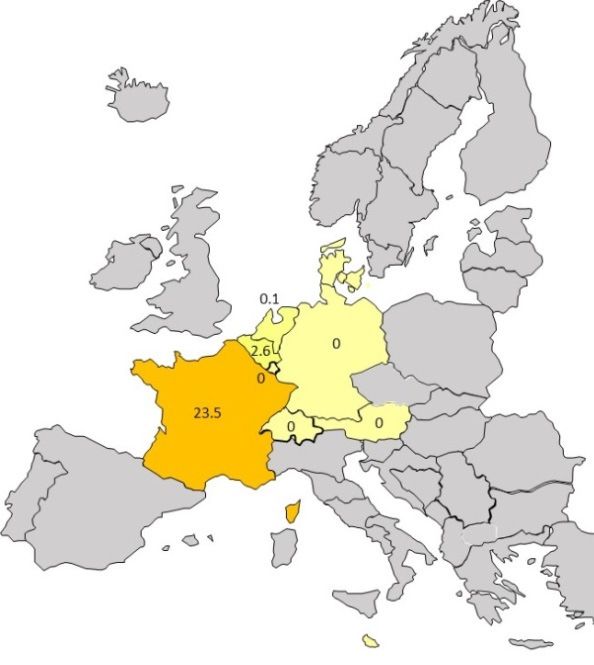
- PLEF SG2 Generation Adequacy Assessment 2018 -

      4.1.6          Switzerland .................................................................................................................... 45
      4.1.7          The Netherlands ............................................................................................................ 46
    4.2      ROW data .............................................................................................................................. 47
5     Study framework ........................................................................................................................... 49
    5.1      Base Case ............................................................................................................................... 49
    5.2      Sensitivities ............................................................................................................................ 50
6     Results of the adequacy assessment............................................................................................. 53
    6.1      Results summary base case ................................................................................................... 53
      6.1.1          Synthetic indicators ....................................................................................................... 53
      6.1.2          Detailed results.............................................................................................................. 54
      6.1.3          Flow Based Results vs. NTC Results ............................................................................... 62
    6.2      Results summary Sensitivity Analysis .................................................................................... 62
      6.2.1          Impact of Economic Sensitivity for 2023/24 ................................................................. 62
      6.2.2          Impact of Environmental sensitivity for 2023/24.......................................................... 63
      6.2.3          Impact of Long term unavailability of nuclear for 2018/19 and 2023/24 ..................... 64
      6.2.4          Impact of Interconnectors projects on 2nd time horizon............................................... 65
      6.2.5          Impact of Demand Side Flexibility ................................................................................. 66
    6.3      TSO Comments on results ..................................................................................................... 68
7     Conclusions and Lessons learnt ..................................................................................................... 70
8     Appendix........................................................................................................................................ 72
    8.1      Frequently asked questions & answers................................................................................. 72
    8.2      Detailed Model descriptions ................................................................................................. 75
      8.2.1          ANTARES ........................................................................................................................ 75
      8.2.2          PowrSym ........................................................................................................................ 78
      8.2.3          AmpFlex ......................................................................................................................... 82
    8.3      FB modelling details .............................................................................................................. 85
    8.4      Net Transfer Capacities ......................................................................................................... 89
    8.5      Alignment of tools ................................................................................................................. 90
    8.6      Glossary ................................................................................................................................. 91
    8.7      Contact .................................................................................................................................. 92
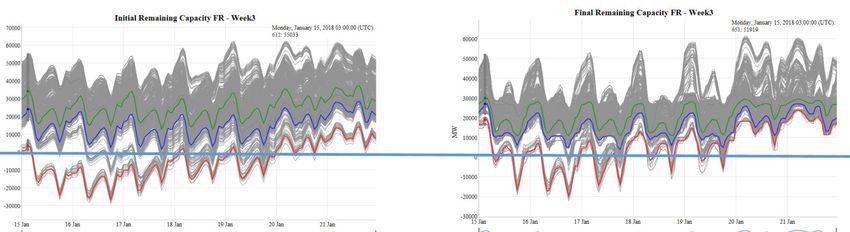
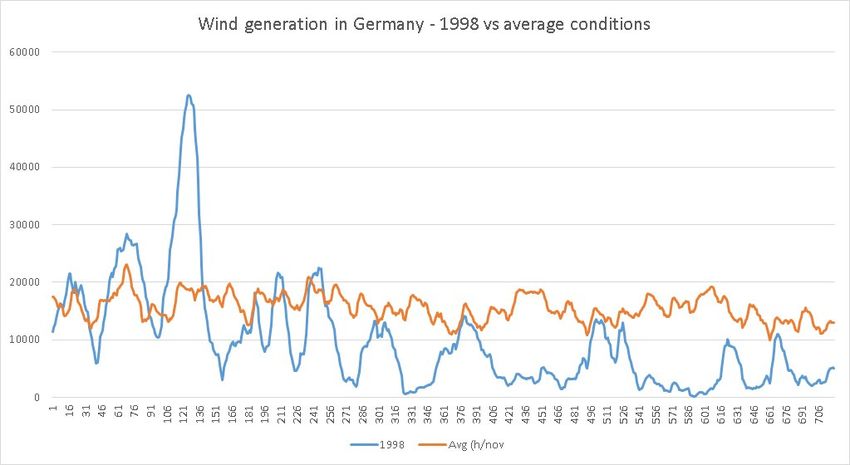
- PLEF SG2 Generation Adequacy Assessment 2018 -

Index of figures and tables
Figure 1 Process of study performance................................................................................................... 8
Figure 2 Perimeter of the modelled countries in this study ................................................................. 14
Figure 3 System adequacy mechanisms (in place or under development) in Central Western Europe16
Figure 4 Example of projection of a flow-based domain on France and Germany axis (15/07/2015 at
hour 15) ................................................................................................................................................. 20
Figure 5 Illustration of the overall process of the probabilistic approach applied for FB domains
selection ................................................................................................................................................ 21
Figure 6 Process of domain selection .................................................................................................... 22
Figure 7 Examples for domain cluster representing the 3 typical working days in winter ................... 23
Figure 8 Effect of grid reinforcements - Typical day 10-12-2015 (Weekday) H19 ................................ 24
Figure 9 Effect of grid reinforcements - Typical day 10-12-2015 (Weekday) H19 (3D view) ................ 25
Figure 10 Illustration of correlation between 'historical' domains and climatic conditions ................. 26
Figure 11 Iterative approach to approximate the optimal installed capacity of demand side
flexibilities per country .......................................................................................................................... 30
Figure 12 Methodology of combining various possible outcomes to achieve statistically representable
results .................................................................................................................................................... 31
Figure 13 Different configurations for the margin indicators ............................................................... 34
Figure 14 Example for situations with load curtailment or unsupplied Energy .................................... 35
Figure 15 Five different status settings to illustrate the situation of the a country ............................. 36
Figure 16 Rationale behind the construction of simulated years, based on 34 climate years and 20
scenarios for thermal availability .......................................................................................................... 36
Figure 17 Convergence of the adequacy indicators Loss of Load Expectation (LOLE) .......................... 37
Figure 18 Process of using two simulations in parallel ......................................................................... 37
Figure 19 Generation mix (operational capacities) of Austria base case 18/19 and 23/24 .................. 39
Figure 20 Generation mix (operational capacities) of Belgium base case 18/19 and 23/24 ................ 41
Figure 21 Generation mix (operational capacities) of France base case 18/19 and 23/24 .................. 42
Figure 22 Generation mix (operational capacities) of Germany base case 18/19 and 23/24 .............. 44
Figure 23 Generation mix (operational capacities) of Luxemburg base case 18/19 and 23/24 ........... 45
Figure 24 Generation mix (operational capacities) of Switzerland base case 18/19 and 23/24 .......... 46
Figure 25 Generation mix (operational capacities) of The Netherlands base case 18/19 and 23/24 .. 47
Figure 26 Evolution of the installed capacity of the row countries ...................................................... 48
Figure 27 Evolution of the load of the row countries ........................................................................... 48
Figure 28 LOLE levels in the base-case (hrs/year) ................................................................................. 53
Figure 29 Expected Energy Not Served in the base-case (GWh/year) .................................................. 54
Figure 30 Monthly LOLE 2nd time horizon. ........................................................................................... 55
Figure 31 Contribution of each climate year to the overall indicator LOLE for the 2nd time horizons 55
Figure 32 Consideration of coldspell in 1985 and 1987 ........................................................................ 56
Figure 33 1985 temperatures in France between December 1st 1984 and February 28th 1985......... 57
Figure 34 Hourly wind generation in MWh ........................................................................................... 58
Figure 35 Hourly pattern of the margin status for the interconnected situation ................................. 58
Figure 36 Status of Austria and Switzerland ......................................................................................... 59
Figure 37 Status of France, Belgium, Germany and Netherlands ......................................................... 59
Figure 38 Remaining capacity France .................................................................................................... 60
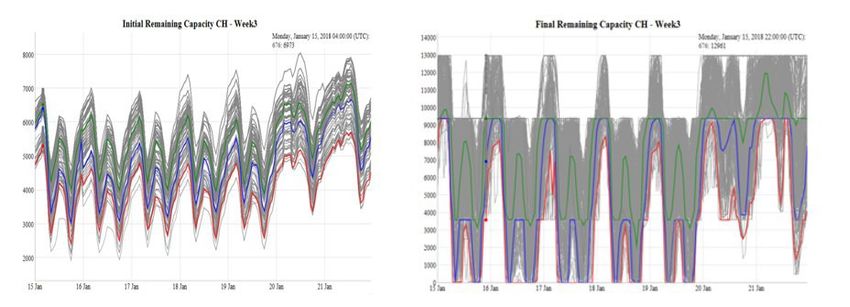
- PLEF SG2 Generation Adequacy Assessment 2018 -

Figure 39 Remaining capacity Switzerland ............................................................................................ 60
Figure 40 Remaining capacity Austria, Belgium, Germany and Netherlands........................................ 61
Figure 41 Comparison of NTC and flow-based results (impact on LOLE) .............................................. 62
Figure 42 Impact of economic sensitivity on LOLE ................................................................................ 63
Figure 43 Impact of environmental sensitivity on LOLE ........................................................................ 63
Figure 44 Impact of LT unavailability of nuclear on LOLE (first time horizon) ...................................... 64
Figure 45 Impact of LT unavailability of nuclear on LOLE (second time horizon) ................................. 65
Figure 46 Impact of grid projects on LOLE ............................................................................................ 65
Figure 47 Impact of DSF sensitivity on LOLE ......................................................................................... 67
Figure 48 Impact of DSF sensitivity on ENS ........................................................................................... 68
Figure 49 Characterization of Antares simulations ............................................................................... 76
Figure 50 Main structure of PowrSym .................................................................................................. 81
Figure 51 Share of the electrical load that is assumed to be flexible according to AmpFlex................ 83
Figure 52: Systematic example for the difference between market flow and the real physical flows
taken into consideration when using fb modelling ............................................................................... 85
Figure 53: Example of flow-based domain (see CWE Flow-Based) ....................................................... 87
Figure 54 LOLE 23/24 Base Case and Sensitivities ................................................................................ 90

Table 1 Features of regional and national analyses ................................................................................ 7
Table 2 Existing Adequacy Standard in PLEF ........................................................................................... 7
Table 3 EU fuel and CO2 prices of the IEA “New Policies Scenario” in the WEO2016 .......................... 13
Table 4 Balancing reserves .................................................................................................................... 15
Table 5 Evolution of net transfer capacities for scenarios 2018/19 and 2023/24 within CWE ............ 19
Table 6 NTC values DE-CH and vice versa according to domain ........................................................... 28
Table 7 RES capacities in Germany ........................................................................................................ 43
Table 8 Reserves in Germany ................................................................................................................ 43
Table 9 Reduction of installed capacity per sensitivity in MW ............................................................. 51
Table 10 Overview of all simulated sensitivities ................................................................................... 52
Table 11 Distribution of DSF sensitivity per country ............................................................................. 66
Table 12 Assumptions regarding the main parameters for the modelling of DSF ................................ 84
Table 13 Net Transfer Capacities........................................................................................................... 89
- PLEF SG2 Generation Adequacy Assessment 2018 -

1 Introduction
This report provides the main finding of the second edition of the Pentalateral Generation Adequacy
Assessment (PLEF GAA 2.0). The study was carried out by the Transmission System Operators of the
seven countries cooperating in the Pentalateral Energy Forum (PLEF): Austria, Belgium, France, Ger-
many, Luxembourg, the Netherlands and Switzerland.

The Pentalateral Energy Forum is the framework for regional cooperation in Central Western Europe
(AT-BE-DE-FR-LU-NL-CH) towards improved electricity market integration and security of supply.

The first PLEF Generation Adequacy Assessment, issued in 2015 and based on the Political Declara-
tion of the Pentalateral Energy Forum of 7 June 2013 in which the Ministers of Energy requested a
Pentalateral Generation Adequacy Assessment, provided a first probabilistic analysis on electricity
security of supply in Europe conducted from a regional perspective, thus making it possible to better
assess generation adequacy jointly, on a regional scale covering the Penta countries. The know-how
on methodology as developed by the Penta TSOs has later on been transferred and applied within
the European Network of Transmission System Operators for Electricity (ENTSO-E) in the Midterm
Adequacy Forecast report (MAF).

In June 2015, the Penta ministers defined in their 2nd Political Declaration further milestones on
security of supply, on market integration and on flexibility, including the aim for further improve-
ments of the common methodology to assess security of supply on the regional level as developed by
the TSOs and continue to publish regular bi-annual reports on the status of security of supply in the
central western European region, starting in 2017.

The declaration was followed-up by a roadmap that was prepared together with the Penta TSOs de-
fining the contents of the next adequacy study, taking into account important insights gained from
the first study by the Penta TSOs on needs to further improve methodology of the assessments. After
completion of the road map Penta TSO have intensively worked together to carry out the new study
establishing an improved level in adequacy assessment.

This second Pentalateral Generation Adequacy Assessment focuses on two main aspects. The first
goal is the development of state of the art methodologies, high quality data collection and enhanced
adequacy modelling techniques and, by application of these methods, to obtain the second goal, in
order to provide a regionally relevant adequacy assessment for the Penta Region on short
(2018/2019) and medium term (2023/2024). These results provide decision-makers with a more ho-
listic assessment of potential capacity scarcities in the Penta region.

Compared to the first assessment, important areas of improvement include i) better representation
of the grid by using a flow-based approach and ii) an improved model for taking into account flexibili-
ties on the demand side. Also the climate database was extended from 14 to 34 years, now covering
historical weather from 1982 to 2015.

The present report starts with the executive summary. Chapter 2 provides a short description of the
background and objective of the study. A description of the high level methodology is presented in
chapter 3, while chapter 4 provides detailed descriptions of methodology, input data and modelling
assumptions. Chapter 5, “Study framework”, provides an overview of the base case scenario’s and
sensitivity analyses that were carried out for the two study horizons. The results of the analyses are
reported in chapter 6. Conclusions and lessons learnt are provided in chapter 7. Chapter 8, the ap-
pendix, contains a “frequently asked questions and answers” list, as well as a description of the simu-
lation tools employed in this study. Details on the FB modelling, NTC, the alignment of the tools on
the results, a glossary and a TSO contact list can also be found in the appendix.
                                                                                                      5
- PLEF SG2 Generation Adequacy Assessment 2018 -
Comparability of Pan European, Regional and National studies
For consistent analyses and comparisons of the results methodological alignment between pan Euro-
pean, regional and national studies is important. This regional PLEG GAA study, ENTSO-E Pan-EU
study (MAF) and various probabilistic national adequacy studies by TSO, currently share a similar
approach.
By means of example, a non-exhaustive list of relevant studies is given below. Although not all stud-
ies in the list below use exactly the same approach, the methodological alignment between these
studies and the PLEF GAA 2017 is significant:
• Elia Adequacy Study for Belgium: The need for strategic reserve for winter 2017-18 and out-
look for 2019-20 and 2020-211
• Elia Adequacy & Flexibility study for 2017-20272
• RTE Bilan Prévisionnel 20163 and forthcoming edition 2017
• TenneT Rapport Monitoring leveringszekerheid 2016-20324
• National Grid EMR Electricity Capacity Report of May 20175
• ENTSO-E Mid Term Adequacy Forecast 20176, currently in consultation.
However, due to the different and complementary scope and usage of Pan-European, regional and
national studies, some differences in the methodological assumptions and data might be considered
between the above mentioned studies. Table 1 highlights some of the main differences observed
between different adequacy assessments in Europe at present.
1
http://www.elia.be/~/media/files/Elia/Products-and-services/Strategic-Reserve/171129_ELIA%20AR-
Winter_UK.pdf
2
http://www.elia.be/en/about-elia/newsroom/news/2016/20-04-2016-Adequacy-study-flexibility-Belgian-
electricity-system
3
http://www.rte-france.com/sites/default/files/bp2016_complet_vf.pdf
4
https://www.tennet.eu/fileadmin/user_upload/Company/Publications/Technical_Publications/Dutch/Rapport
_Monitoring_Leveringszekerheid_2017_web.pdf
5
https://www.emrdeliverybody.com/Lists/Latest%20News/Attachments/116/Electricity%20Capacity%20Report
%202017.pdf
6
https://www.entsoe.eu/Documents/SDC%20documents/MAF/MAF_2017_report_for_consultation.pdf
6- PLEF SG2 Generation Adequacy Assessment 2018 -
Report Time Geographical Climate DSR Flow Based method
horizons perimeter Dataase
MAF 2017 2020, 2025 EU ENTSO-E DSR input Not in 2017
PECD from TSOs
PLEF 2017 2018/2019, EU, but with ENTSO-E DSR input Usage of flow based
2023/2024 focus on ade- PECD from TSOs approach from CWE
quacy within and addi- TSOs, combined with
PLEF region. tional use RES-infeed dependent
MAF data pro- of flexibility NTC approach for PLEF
vides the basis tool countries not within the
for setting up CWE FB region
the model out-
side of the PLEF
region
Probabilistic Different, Single unit reso- ENTSO-E Extensive Flow based approach
national up to 10 lution within PECD and consulta- based on historical do-
studies by years focus perimeter Hydro spe- tion with mains from the CWE FB
TSOs, com- ahead relevant for the cific data- market tool implemented in
parable to study. Dataset bases for parties on some of them for sev-
MAF 2017 consistent with all climatic national eral years now
MAF for rest of years7 assump-
the simulation tions (e.g.
perimeter DSR as-
sumptions)
Table 1 Features of regional and national analyses
The adequacy standard that has to be met are normally defined by each country, in case it is defined.
For the moment, there is no such definition for the other PLEF countries (AT, CH, DE, LU) nor for the
PLEF region.
PLEF Country Adequacy Standard
BE LOLE average of 3h/year & LOLE95 of 20 h8
FR LOLE average of 3h/year9
NL LOLE average of 4h/year10
AT, CH, DE, LU n/a
Table 2 Existing Adequacy Standard in PLEF
7
For its national study RTE uses a specific weather database provided by Meteo France which comprises 200
simulated years of the climate (temperatures, wind, solar radiation) over western Europe, and consistent with
today’s climate
8
Belgian law ‘Elektriciteitswet’ of April 1999
9
French law February and August 2004
10
Dutch adequacy criteria in paragraph 4.2 of report Monitoring Security of Supply (in Dutch 'Rapport Monitor-
ing Leveringszekerheid 2013-2029', www.tennet.eu) of Dutch TSO TenneT
7- PLEF SG2 Generation Adequacy Assessment 2018 -
2 General approach
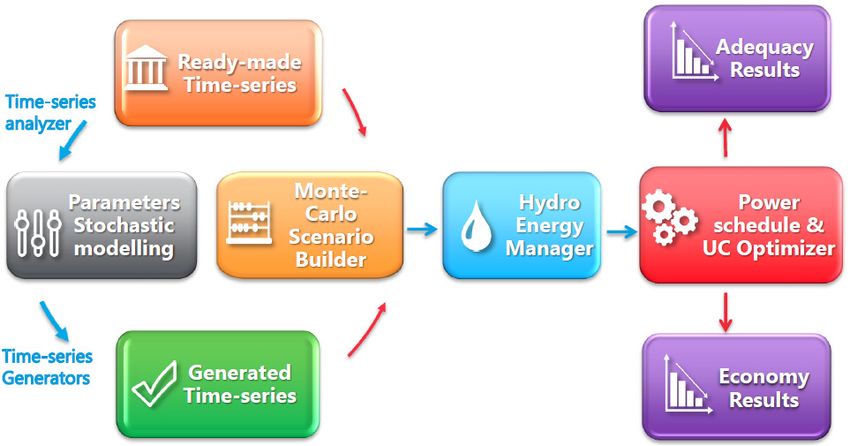
The procedure implemented in this study can be divided into three major steps (see Figure 1): (I.),
inputs are prepared, mainly covering electricity demand, renewables generation profiles, pre-
installed power plant fleet, unscheduled generation unavailability and transmission capacities. (II.),
constraints for the modelling of Flow-Based market coupling (FB Model) and capacities for Demand
Side Flexibilities (DSF Model) are determined. (III.), generation adequacy indicators are computed
utilising two Generation Adequacy models (GA Models).
Figure 1 Process of study performance
According to Figure 1, in this study multiple tools and models are utilized. One reason for this is the
further development of the adequacy assessment regarding the modelling of flow-based market
coupling and demand side flexibilities. Moreover, in order to increase the level of quality and robust-
ness of the presented results two system models (Antares and PowrSym) are used in parallel for de-
termining market results and generation adequacy indicators. While both models use the same input
data and follow the same approach with regard to probabilistic modelling there are differences for
instance regarding the formulation of technical restrictions, which might lead to deviating results.
However, as the results demonstrate, the two models converge well.
The enhanced modelling of flow-based market coupling requires a determination of commercial
transaction constraints on the basis of relevant physical transmission constraints, which are de-
scribed by the flow-based domains. The outputs of the capacity calculation process, in the form of
historically observed flow-based domains, are then incorporated into the generation adequacy mod-
els. It is worth mentioning that planned reinforcements up to Winter 2018/19 have been considered
in this assessment, in order to update the historical domains considered.
A further feature of the improved generation adequacy assessment concerns a determination of
installed DSF capacities for the long-term time horizon, which are consistent with the assumed sce-
nario framework of this study. According to Figure 1, the DSF model uses input data such as electrici-
ty demand, renewables generation profiles and installed power plant fleet. As cross border exchang-
es are only modelled in ANTARES and PowrSym there is a feedback loop from the generation ade-
quacy models to the DSF model, which considers the exchange balances as exogenously given.
8- PLEF SG2 Generation Adequacy Assessment 2018 -
The three steps and underlying methodologies are described in more detail in the subsequent chap-
ters. In chapter 3.1 the preparation of input data, e.g. the determination of temperature-sensitive
load profiles, is briefly described. Chapter 3.2 gives an overview of the flow-based model and the
derivation of the flow-based domains. A description of the DSF model is given in chapter 3.3. Both
generation adequacy models and considered uncertainties are further detailed in chapter 3.4, where
the description of the relevant outputs and indicators used for the generation adequacy analysis can
also be found.
9- PLEF SG2 Generation Adequacy Assessment 2018 -
3 Methodology
3.1 Preparation of input data
The preparation of the PLEF input data is done through a standard data gathering process based on
the one used also for the ENTSO-E MAF study, with the necessary updates by the PLEF TSOs concern-
ing their national data. Attention is paid to adjust the data because of the different time horizons for
the PLEF and the MAF studies. The scenario data have been presented and approved by the PLEF
ministries.
3.1.1 Pan European Climate Database
Weather conditions are becoming a more and more important element in the European power sys-
tem. Dependency on weather is present on both supply and demand side. Important weather-related
supply side uncertainties concern the production of wind, solar PV and hydro power. On the demand
side, in many countries the temperature has a major influence on demand.
In certain situations, the system may become more vulnerable, for example, when there is low avail-
ability of conventional power and simultaneously low feed-in from renewables (RES). All this com-
bined with a cold wave in Europe can cause a significant reduction of the adequacy margin. Because
of the space- and time correlated nature of these weather related parameters, a correct assessment
of the adequacy risks in such situations places high demands on the method of simulation. For this
reason ENTSO-E has improved the modelling of the weather dependent parameters by the develop-
ment of a Pan European Climate database (PECD). This development started about 5 years ago within
the framework Ten Year Network Development Plan (TYNDP) 2012.
This PLEF study uses the 2nd release of the Pan European Climate database (PECD 2.0). This database
enables the creation of correlated chronological time series of weather-dependent parameters (elec-
tricity demand and renewables production) per market area in Europe based on historical weather
over the period 1982-2015 (34 climate years). It also takes into account various available quantities
of production from hydro power production depending on the rainfall (wet, average or dry year) in
these years.
3.1.2 Load
The hourly load data are taken from the ENTSO-E MAF 201711. The thermal sensitivity or tempera-
ture dependency of the hourly load is the same as the one applied for MAF using the Pan European
Climate Database (PECD). The approach applied in the MAF report entails a sensitivity analysis of
load and temperature, in order to consider the impact of heating and cooling on the consumption of
electrical energy. On the basis of a cubical polynomial approximation synthetic hourly load profiles
for each area are created. By this means seasonal and daily impacts of weather conditions, in particu-
lar temperature, as well as impacts of extreme events like cold spells in winter and heat waves in
summer on the electrical load are considered. Because of the slightly different time horizons be-
tween the MAF and the PLEF studies the necessary interpolation/extrapolation is performed.
11
Except for France, which has provided hourly load profiles by use of its own national methodology
10- PLEF SG2 Generation Adequacy Assessment 2018 -
3.1.3 Demand Side Response (DSR)
DSR is modelled as a virtual power plant in the generation adequacy models, with a maximum power
and a strike price corresponding to the data collected, and may be allocated a limit in usage (daily
limit on number of hours) to adapt to the type of usage at stake.
3.1.4 Wind and Solar
Similar to the ENTSO-E MAF study, the Pan European Climate Database (PECD) for wind and solar
production for each country is applied. The extended database is based on existing global climate
reanalysis models and contains hourly climate data for 34 years (1982 to 2015). The used climate
data consider climatic spatial and temporal correlations and allow a consistent set of load, wind and
solar production time series for the subsequent adequacy simulations. Onshore, offshore wind and
solar photovoltaic load factor (percentage of production compared to installed capacity) time series
are given for each market node and scaled to the respective future installed capacity.
With regard to the probabilistic assessment it should be noted that the extension of considered cli-
mate years causes a significant increase in the computational requirements in comparison to the last
PLEF adequacy study. The additional efforts, however, significantly improve the range of possible
weather patterns that are investigated.
3.1.5 Hydro
Modelling a hydro production system, especially one including storage and pump storage power
plants is challenging due to its complexity and the presence of many stochastic variables, e.g. cas-
cades of reservoir basins and unclearly defined marginal costs. Therefore some simplifications have
to be made.
The data collection (using ENTSOE’s templates) splits the hydro generation fleet in several categories,
each having a set of specific constraints.
Run-of-river units of a given market node are merged in a single must-run unit with a predefined
generation time-series of weekly energies provided by each TSO for different hydro conditions (dry,
wet, average year). Theses time series are built based on historical data. The energy is converted in
an hourly flat power profile.
Hydro reservoirs are subject to much more constraints and the generation profile results from an
economic optimization. All annual reservoirs12 of a given market node are merged in the data collec-
tion in a single reservoir. Based on the monthly starting and ending levels of this total-reservoir, and
the monthly inflows provided by each TSO for annual storages, the model determines an energy
credit to be optimally dispatched on a monthly basis. This monthly credit will then be distributed
optimally into weekly credits. Hydro units are dispatched by the optimizer to reach a minimum sys-
tem cost using all dispatchable units. In this way hydro dispatch is dependent on market price signals
in the whole week, i.e. opportunistic costs, and limited by the pre-optimized weekly energy credit.
For reservoir power plants min/max of generation capacities are additional optimization constraints.
Pure pumped storages are modelled with their efficiency rate (75%), and the pumping/generation is
optimized by the model within limitation of capacities (use of max pumping and generation capaci-
12
with a yearly management strategy
11- PLEF SG2 Generation Adequacy Assessment 2018 -
ties collected – MW). Basically the model seeks the best opportunity for pumping (when costs/prices
are low) and for generation (when prices are high) in order to minimize overall costs of the system.
Different types of pumped storage are described in the data collection that distinguishes daily
pumped storage from weekly and yearly pumped storage. Modelling also makes this distinction. The
energy (daily or weekly) produced should be balanced by the pumped energy with respect to the
efficiency rate.
The consideration of hydrological conditions is enriched compared to the last PLEF adequacy assess-
ment. The PLEF study uses new information made available by the Pan-European Market Data Base
collected within current ENTSOE studies (MAF2017 and TYNDP2018). Indeed each Transmission Sys-
tem Operator not only delivers three hydrological data sets corresponding to dry, average, and wet
conditions, but also allocates them to each year from the PECD. This allows a better consistency be-
tween all climatic variables (temperatures, wind, solar radiation and hydro conditions).
3.1.6 Thermal units and outages
Installed capacities for thermal units are based on ENTSO-E data, with the necessary updates by the
PLEF TSOs for their national data. For thermal units, different categories are defined (coal, gas, etc.)
in accordance with the definitions in the ENTSO-E market database. Each category has parameters
defining the main technical and economical characteristics, like maximum power, fuel type, efficien-
cy, fuel cost, operation and maintenance cost, etc.
Each thermal unit is given a rate of unavailability (forced outage and maintenance rate and dura-
tions) that is based on the type of the unit. When no specific data is proposed by the TSO, this infor-
mation is taken from the PEMMDB of ENTSOE where default values based on historically observed
unavailability are available.
The maintenance schedules used in PLEF are taken from the MAF study (adapted when differences
exists on installed capacities for the PLEF region given the different time horizons studied); Such
maintenance schedules result from an optimization which defines maintenance periods throughout
the year. These optimizations respect the minimum maintenance level set for each season (win-
ter/summer) by TSOs within the PEMMDB.
Maintenance plans determination in pan-European studies is clearly a field where modelling im-
provements could be implemented, to better translate not only the rationale of the maintenance
from plant operators (maximize availability on peak period), but also the risks attached to mainte-
nance (for example the risk of an extended duration of a maintenance due to unforeseen reasons).
This would require an enhanced data collection and some complementary efforts in modelling.
On top of this maintenance, the simulators apply random draws to account for forced outages, thus
producing different combinations of outages.
3.1.7 Outages of HVDC lines
In line with MAF, forced outages due to unexpected failures of HVDC links resulting in unavailability
of these transmission links have been taken into account for selected High-Voltage Direct Current
(HVDC) interconnections in the CWE perimeter. It has been considered that a forced outage of these
links will occur with a chance of 6% for a period of 7 consecutive days (based on CIGRE data).
12- PLEF SG2 Generation Adequacy Assessment 2018 -
3.1.8 Fuel and CO2-prices
The assumptions on fuel and CO2 prices for this study were taken from the 2016 edition of the Inter-
national Energy Agency (IEA) World Energy Outlook (WEO). The IEA WEO provides medium to long-
term energy projections on a detailed sector-by-sector and region-by-region basis. It is known as a
well-quoted source and is considered by policy decision makers. Since years ago it has been adapted
as a source for the ENTSO-E TYNDP scenarios and was also used for the 2015 version of the PLEF
Generation Adequacy Study.
The development of the energy sector and its markets is affected by many different uncertainties.
The government policies of the different countries are a major driving force which is shaping the
development of the energy sector. The WEO2016 makes detailed projections for three different sce-
narios: the “Current Policies Scenario”, the “450 Scenario” and the “New Policies Scenario”.
These three scenarios are based on different developments of future government policies. No
changes in government policies are assumed for the “Current Policies Scenario”, whereas the “450
Scenario” assumes that the greenhouse gases in the atmosphere are limited to 450 ppm13 of CO2.
The idea behind the “450 Scenario” is to achieve the climate target and to limit the global tempera-
ture-increase to 2°Celsius. To evaluate the development of the energy sector under the assumption
of today’s policy ambitions the “New Policies Scenario” was defined. For this scenario the current
state of the energy sector, recently announced commitments and likely future policy decisions are
considered. The (Intended) Nationally Determined Contributions, which form the basis for the Paris
Agreement14, serve as a basis for this scenario.15 16
For both horizons in this PLEF study the assumptions according to the WEO2016 “New Policies Sce-
nario” are used for fuel and CO2 prices. This IEA scenario is used as a baseline regarding future devel-
opments of the energy sector under the assumption that underlying trends like the energy demand
remain unchanged. It projects fuel and CO2 prices for the years 2020 and 2025. As these years are
close to the chosen horizons of the PLEF-simulations, it was decided to apply the same assumptions
for this study. The corresponding values are presented in Table 3 below:
Unit Fuel type 2020 2025
€/GJ OIL 12.1 14.6
€/GJ GAS 6.1 7.4
€/GJ 29GJ/ton Hard Coal 2.0 2.1
€/GJ 25GJ/ton Hard Coal 2.3 2.5
€/GJ Heavy Oil 12.7 15.3
€/GJ Light Oil 15.5 18.7
€/GJ Nuclear 0.5 0.5
€/GJ Lignite 1.1 1.1
€/GJ Oil Shale 2.3 2.3
€/tCO2 CO2 price 18.0 25.7
Table 3 EU fuel and CO2 prices of the IEA “New Policies Scenario” in the WEO2016
13
parts per million
14
http://unfccc.int/paris_agreement/items/9485.php
15
http://www.worldenergyoutlook.org/media/weowebsite/2016/WEM_Documentation_WEO2016.pdf
16
https://www.iea.org/publications/scenariosandprojections
13- PLEF SG2 Generation Adequacy Assessment 2018 -
In European power markets generation units are dispatched according to their marginal generation
costs. Besides variable costs for maintenance, marginal costs are mainly determined by fuel and CO2-
prices. Accordingly, the merit order of generation units (without costs due to technical constraints),
i.e. starting from the technology with the lowest cost, determines the cost minimal dispatch.
3.1.9 Perimeter
The perimeter covered in this study is shown in Figure 2 below. The blue highlighted countries repre-
sent the main focus area. The green highlighted countries are also considered in the models to im-
prove the representation of the focus area.
Figure 2 Perimeter of the modelled countries in this study
3.1.10 Balancing Reserves
The total volume of balancing reserves has been provided by TSOs via the MAF 2017 data collection.
A revision of these figures was performed within the CWE by PLEF TSOs. Reserves include both Fre-
quency Containment Reserves (FCR) and Frequency Restoration Reserves (FRR). The figures and the
approach on the modelling are listed in Table 4 . The amount in MW is either directly given or can be
easily derived by multiplying the percentage with the total installed capacity of the corresponding
category on the generation type for the PLEF countries.
These reserves are modelled in the following way:
- Reserves on hydro units – reduction of turbine capacity
- Reserves on thermal units – derating of the thermal capacity among the relevant categories
14- PLEF SG2 Generation Adequacy Assessment 2018 -
For Switzerland the balancing reserves are modelled as extra load, similar to the approach used in
MAF 2017, instead of the reduction of hydro turbine capacity. This means that a fixed value is mod-
elled for every hour, as it is not known in which hours these reserves will be needed for system oper-
ation. The purpose is to simulate a pessimistic scenario for a hydro country where energy constraints
dominate those of installed capacity, assuming that no reserves for balancing can be used for genera-
tion adequacy purposes. This is also consistent with the approach used in the pan-European assess-
ment in MAF.
An overview is provided below for the PLEF countries:
COUNTRY AT
REDUCTION HYDRO [MW] 491
THERMAL REDUCTION % 1% in Gas units
COUNTRY BE
REDUCTION HYDRO [MW]
THERMAL REDUCTION % Light Oil (100 % providing reserves) and 12 % in Gas units
COUNTRY CH
EXTRA LOAD 868 MW
COUNTRY DE
REDUCTION HYDRO [MW] 2658
THERMAL REDUCTION % Hard Coal (3,8%), Gas Turbines (3,7%) and Oil Plants (33,7%)
COUNTRY FR
REDUCTION HYDRO [MW] 500
THERMAL REDUCTION % Nuclear (2%), Coal (2%) and Gas (2%) units
COUNTRY NL
THERMAL REDUCTION % Nuclear (5%), Coal (5%) and Gas (5%) units
(*) although not indicated here explicitly, similar approach has been adopted for the consideration
of reserves in the whole simulated perimeter.
Table 4 Balancing reserves
3.1.11 System Adequacy Mechanisms
In some of the PLEF countries, different types of system adequacy mechanisms (SAM) are imple-
mented. Some countries fully rely on the energy only market (EOM). Capacity mechanisms can target
to safeguard the insurance of either generation adequacy or transmission adequacy.
To analyse whether the capacities contracted in the SAMs should be considered in the assessment,
differentiation between mechanisms is made, which
a) ensure the availability of sufficient energy produced to cover the load (generation adequacy) by
contracting resources in a decentralized capacity market (DCM) or strategic reserve (SR) and
b) ensure the availability of additional generation capacity in case of grid congestion (transmission
adequacy). These capacities are then contracted in a grid reserve (GR) and need to fulfil certain
15You can also read