Identification of functionally distinct macrophage subpopulations in Drosophila - eLife
←
→
Page content transcription
If your browser does not render page correctly, please read the page content below
RESEARCH ARTICLE

                                   Identification of functionally distinct
                                   macrophage subpopulations in Drosophila
                                   Jonathon Alexis Coates1, Elliot Brooks2, Amy Louise Brittle2,
                                   Emma Louise Armitage2, Martin Peter Zeidler1, Iwan Robert Evans2*
                                   1
                                    Department of Biomedical Science and the Bateson Centre, University of Sheffield,
                                   Sheffield, United Kingdom; 2Department of Infection, Immunity and Cardiovascular
                                   Disease and the Bateson Centre, University of Sheffield, Sheffield, United Kingdom

                                   Abstract Vertebrate macrophages are a highly heterogeneous cell population, but while
                                   Drosophila blood is dominated by a macrophage-like lineage (plasmatocytes), until very recently
                                   these cells were considered to represent a homogeneous population. Here, we present our
                                   identification of enhancer elements labelling plasmatocyte subpopulations, which vary in
                                   abundance across development. These subpopulations exhibit functional differences compared to
                                   the overall population, including more potent injury responses and differential localisation and
                                   dynamics in pupae and adults. Our enhancer analysis identified candidate genes regulating
                                   plasmatocyte behaviour: pan-plasmatocyte expression of one such gene (Calnexin14D) improves
                                   wound responses, causing the overall population to resemble more closely the subpopulation
                                   marked by the Calnexin14D-associated enhancer. Finally, we show that exposure to increased
                                   levels of apoptotic cell death modulates subpopulation cell numbers. Taken together this
                                   demonstrates macrophage heterogeneity in Drosophila, identifies mechanisms involved in
                                   subpopulation specification and function and facilitates the use of Drosophila to study macrophage
                                   heterogeneity in vivo.

*For correspondence:
                                   Introduction
i.r.evans@sheffield.ac.uk          Macrophages are key innate immune cells responsible for clearing infections, debris, and apoptotic
                                   cells, the promotion of wound healing and are necessary for normal development (Wynn et al.,
Competing interests: The
                                   2013). However, their aberrant behaviour can also cause or exacerbate numerous human disease
authors declare that no
                                   states, including cancer, atherosclerosis, and neurodegeneration (Wynn et al., 2013). Macrophages
competing interests exist.
                                   are a highly heterogeneous population of cells, which enables them to carry out their wide variety of
Funding: See page 30               roles, and this heterogeneity arises from diverse processes. These processes include the dissemina-
Received: 07 May 2020              tion and maintenance of tissue resident populations (Gordon and Plüddemann, 2017) and the abil-
Accepted: 30 March 2021            ity to adopt a spectrum of different activation states (termed macrophage polarisation), which can
Published: 22 April 2021           range from pro-inflammatory (historically termed as M1-like) to anti-inflammatory, pro-healing (M2-
                                   like) macrophage activation states (Martinez and Gordon, 2014; Murray, 2017).
Reviewing editor: Jiwon Shim,
Hanyang University, Republic of
                                       Macrophage heterogeneity is not limited to mammals, appearing conserved across vertebrate lin-
Korea                              eages – both in terms of polarisation and the presence of tissue resident populations. For example,
                                   evidence suggests the existence of pro-inflammatory macrophage populations in zebrafish (Nguyen-
   Copyright Coates et al. This
                                   Chi et al., 2015), with polarisation also a well-defined phenomenon in other fish species
article is distributed under the
                                   (Wiegertjes et al., 2016). Zebrafish are also known to contain tissue resident macrophages such as
terms of the Creative Commons
Attribution License, which         myeloid-derived microglia (Ferrero et al., 2018; Xu et al., 2016). Vertebrate macrophages interact
permits unrestricted use and       with and can become polarised in response to signals produced by Th1 and Th2 cells, leading to
redistribution provided that the   acquisition of M1-like and M2-like activation states, respectively (Murray, 2017), while B- and T-cell-
original author and source are     based adaptive immunity is thought to have evolved in teleost fish (Buchmann, 2014). Therefore,
credited.                          the absence of an adaptive immune system may restrict the diversity of macrophage populations in

Coates et al. eLife 2021;10:e58686. DOI: https://doi.org/10.7554/eLife.58686                                                       1 of 39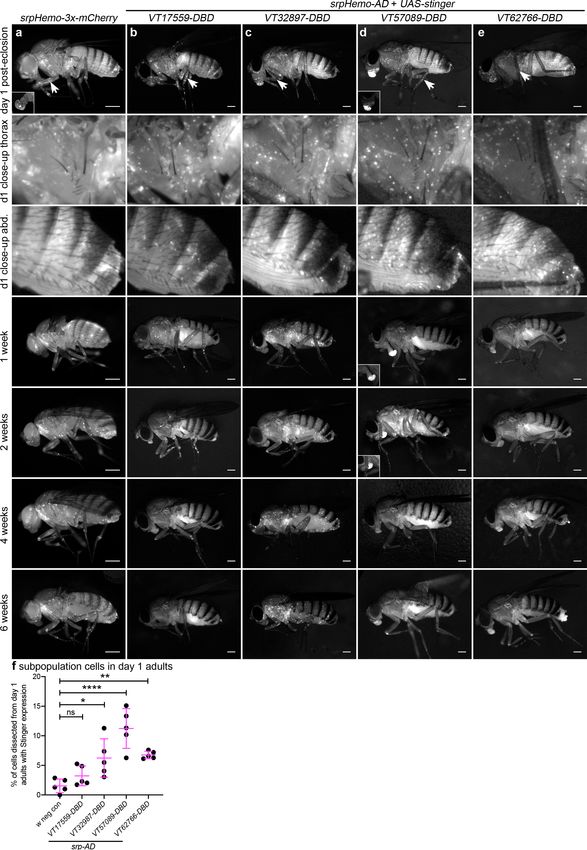
Research article                                                            Developmental Biology Immunology and Inflammation

                                   more simple organisms that possess only an innate immune system. However, the fact that macro-
                                   phage markers can be highly divergent, even when comparing mammals as closely related as mice
                                   and humans (Murray and Wynn, 2011), has hampered investigation of whether this is indeed the
                                   case, indicating a need for alternative markers and approaches.
                                       Macrophage heterogeneity has been extensively studied in mammalian systems and, although
                                   this has provided a good understanding of how macrophages determine their polarisation state, this
                                   has also identified considerable complexity with many activation states possible (Murray et al.,
                                   2014). Additional complexity arises with both M1-like and M2-like macrophages found at the same
                                   sites of pathology, for example within atherosclerotic plaques (Colin et al., 2014). Furthermore, the
                                   cytokine profiles that can be induced in vitro depend on the exact activation methods used experi-
                                   mentally and these do not necessarily reflect polarisation states in vivo (Vogel et al., 2014), while
                                   other macrophage subpopulations may be missed by in vitro approaches. Given these intricacies, it
                                   is clear that we need to better understand the fundamental components and pathways responsible
                                   for the specification of different macrophage subtypes, particularly in vivo. Recently, the ‘macro-
                                   phage-first’ hypothesis has been proposed, re-emphasising the idea that acute signals can polarise
                                   macrophages ahead of the involvement of T cells (Wiegertjes et al., 2016). Consequently, organ-
                                   isms without a fully developed adaptive immune system represent intriguing models in which to
                                   examine this idea and better understand macrophage heterogeneity in vivo.
                                       Drosophila melanogaster has been extensively utilised to study innate immunity (Buchon et al.,
                                   2014), but lacks an adaptive immune system. Fruit fly blood is specified in two waves – an embryonic
                                   wave in the head mesoderm and in the larval lymph gland, with those cells released at the end of lar-
                                   val development (Gold and Brückner, 2015). Blood cell proliferation has also been shown to occur
                                   in haematopoietic pockets attached to the larval body wall (Leitão and Sucena, 2015;
                                   Makhijani et al., 2011). These waves of haematopoiesis generate three types of blood cell (also
                                   referred to as hemocytes): plasmatocytes, crystal cells, and lamellocytes. Of these, plasmatocytes
                                   are functionally equivalent to vertebrate macrophages (Evans et al., 2003; Wood and Jacinto,
                                   2007), with the capacity to phagocytose apoptotic cells and pathogens, secrete extracellular matrix,
                                   disperse during development and migrate to sites of injury (Ratheesh et al., 2015). Although Dro-
                                   sophila blood lineages are considerably less complex than their vertebrate equivalents, they are
                                   specified via transcription factors related to those used during vertebrate myelopoiesis, including
                                   GATA and Runx-related proteins (Evans et al., 2003). Furthermore, plasmatocytes utilise
                                   evolutionarily conserved genes in common with vertebrate innate immune cells to migrate (e.g.
                                   SCAR/WAVE, integrins, and Rho GTPases [Comber et al., 2013; Evans et al., 2013; Paladi and
                                   Tepass, 2004; Siekhaus et al., 2010; Stramer et al., 2005]) and phagocytose (e.g. the CED-1 family
                                   member Draper [Manaka et al., 2004] and CD36-related receptor Croquemort [Franc et al., 1996]).
                                   Given these striking levels of functional and molecular conservation, Drosophila has been extensively
                                   used for research into macrophage behaviour in vivo with its genetic tractability and in vivo imaging
                                   capabilities facilitating elucidation of different macrophage behaviours conserved through evolution
                                   (Ratheesh et al., 2015; Wood and Jacinto, 2007). However, despite these evolutionarily-conserved
                                   commonalities, the plasmatocyte lineage has, until very recently, been considered a homogeneous
                                   cell population. Hints that Drosophila plasmatocytes may exhibit heterogeneity exist in the literature
                                   with variation in marker expression observed in larval hemocytes (Anderl et al., 2016; Kurucz et al.,
                                   2007a; Shin et al., 2020) and non-uniform expression of TGF-b homologues upon injury or infection
                                   in adults (Clark et al., 2011). Recent single-cell RNA-sequencing (scRNAseq) experiments performed
                                   on larval hemocytes have also suggested the presence of multiple clusters of cells, which were inter-
                                   preted as representing either different stages of differentiation or functional groupings
                                   (Cattenoz et al., 2020; Tattikota et al., 2019). However, the in vivo identification of subtypes and
                                   insights into the roles and specification mechanisms of potential macrophage subtypes in Drosophila
                                   has not yet been described.
                                       Here, we describe the first identification and characterisation of molecularly and
                                   functionally distinct plasmatocyte subpopulations within Drosophila melanogaster. Drawing on a col-
                                   lection of reporter lines (https://enhancers.starklab.org/; Kvon et al., 2014), we have identified regu-
                                   latory elements that define novel plasmatocyte subpopulations in vivo. We show that these
                                   molecularly distinct subpopulations exhibit functional differences compared to the overall plasmato-
                                   cyte population and that the proportion of cells within these subpopulations can be modulated by
                                   external stimuli such as increased levels of apoptosis. Furthermore, we show that misexpression of a

Coates et al. eLife 2021;10:e58686. DOI: https://doi.org/10.7554/eLife.58686                                                        2 of 39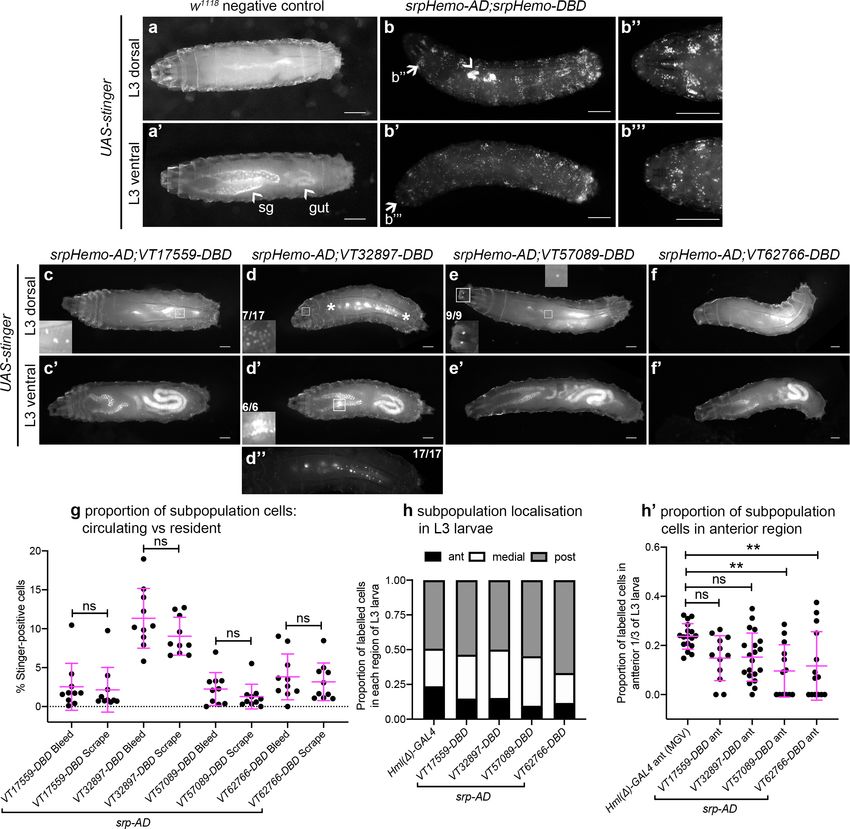
Research article                                                             Developmental Biology Immunology and Inflammation

                                   gene associated with a subpopulation-specific enhancer element is able to modulate plasmatocyte
                                   behaviour in vivo, thereby identifying novel effector genes of plasmatocyte subpopulation function.
                                   Together our findings reveal that macrophage heterogeneity is a fundamental and
                                   evolutionarily conserved characteristic of innate immunity that pre-dates the development of the
                                   adaptive immune system. This significantly extends the utility of an already powerful genetic model
                                   system and provides further avenues to understand regulation of innate immunity and macrophage
                                   heterogeneity.

                                   Results
                                   Drosophila embryonic plasmatocytes do not behave as a uniform
                                   population of cells
                                   The macrophage lineage of hemocytes (plasmatocytes) has historically been considered a homoge-
                                   neous population of cells. However, careful analysis of plasmatocyte behaviour in vivo suggested to
                                   us that this lineage might not be functionally uniform. For instance, imaging the inflammatory
                                   responses of plasmatocytes to epithelial wounds, we find that some cells close to injury sites rapidly
                                   respond by migrating to the wound, while other neighbouring cells fail to respond (Figure 1a;
                                   Video 1). We also find that plasmatocytes exhibit variation in their expression of well-characterised
                                   plasmatocyte markers such as crq-GAL4 (Figure 1b–b’; Franc et al., 1996; Stramer et al., 2005)
                                   and display a broad diversity in their migration speeds within the embryo (random migration at
                                   stage 15; Figure 1c–d). These professional phagocytes also display differences in their capacities to
                                   phagocytose apoptotic cells with some cells engulfing many apoptotic particles, whereas others
                                   engulf very few, if any (Figure 1e). Furthermore, phagocytosis of microorganisms by larval hemo-
                                   cytes also varies significantly from cell-to-cell in vitro (Figure 1f). These differences within the plas-
                                   matocyte lineage led us to hypothesise that this cell population is more heterogeneous than
                                   previously appreciated.

                                   Discrete subpopulations of plasmatocytes are present in the
                                   developing Drosophila embryo
                                   Given the diversity in plasmatocyte behaviour observed (Figure 1), we hypothesised that macro-
                                   phage heterogeneity represents an evolutionarily conserved feature of innate immunity, which there-
                                   fore originally evolved in the absence of an adaptive immune system. To address this and look for
                                   molecular differences between plasmatocytes, we examined transgenic enhancer reporter lines (VT-
                                   GAL4 lines) produced as part of a large-scale tilling array screen (Kvon et al., 2014) that had been
                                   annotated as labelling hemocytes (http://enhancers.starklab.org/). Based on examination of the pub-
                                   lished VT-GAL4 expression patterns, we identified VT-GAL4 lines that appeared to label reduced
                                   numbers of plasmatocytes in the embryo, reasoning that plasmatocyte subpopulations could be
                                   molecularly identified on the basis of differences in reporter expression. While a number of the
                                   enhancers appeared to label all plasmatocytes (e.g. VT41692-GAL4), we identified several that
                                   labelled discrete numbers of plasmatocytes (Figure 2a). We next confirmed that the cells labelled by
                                   these VT-GAL4 lines were plasmatocytes by using these constructs to drive expression of UAS-tdTo-
                                   mato in the background of a GAL4-independent, pan-hemocyte marker (srpHemo-GMA – serpent
                                   enhancer region driving expression of a GFP-tagged actin-binding domain of Moesin; Figure 2b–d).
                                   As initially predicted based on their morphology and position during embryogenesis, each of the
                                   VT-GAL4 lines marking potential subpopulations did indeed express in the hemocyte lineage
                                   (Figure 2e). These subpopulation cells were identified as plasmatocytes based upon their morphol-
                                   ogy, the absence of lamellocytes in embryos and the non-migratory nature of crystal cells
                                   (Wood and Jacinto, 2007) and could be observed to follow both the dorsal and ventral migration
                                   routes (Ratheesh et al., 2015) used by plasmatocytes during their developmental dispersal
                                   (Figure 2e). In order to quantify the proportion of cells labelled by each VT-GAL4 line, we counted
                                   the number of cells labelled on the ventral midline of the developing stage 15 embryo, using VT-
                                   GAL4 lines to drive expression from UAS-GFP. This verified reproducible and consistent labelling of
                                   discrete subsets of plasmatocytes (Figure 2f–h), suggesting that these cells represent stable subpo-
                                   pulations within this macrophage lineage.

Coates et al. eLife 2021;10:e58686. DOI: https://doi.org/10.7554/eLife.58686                                                          3 of 39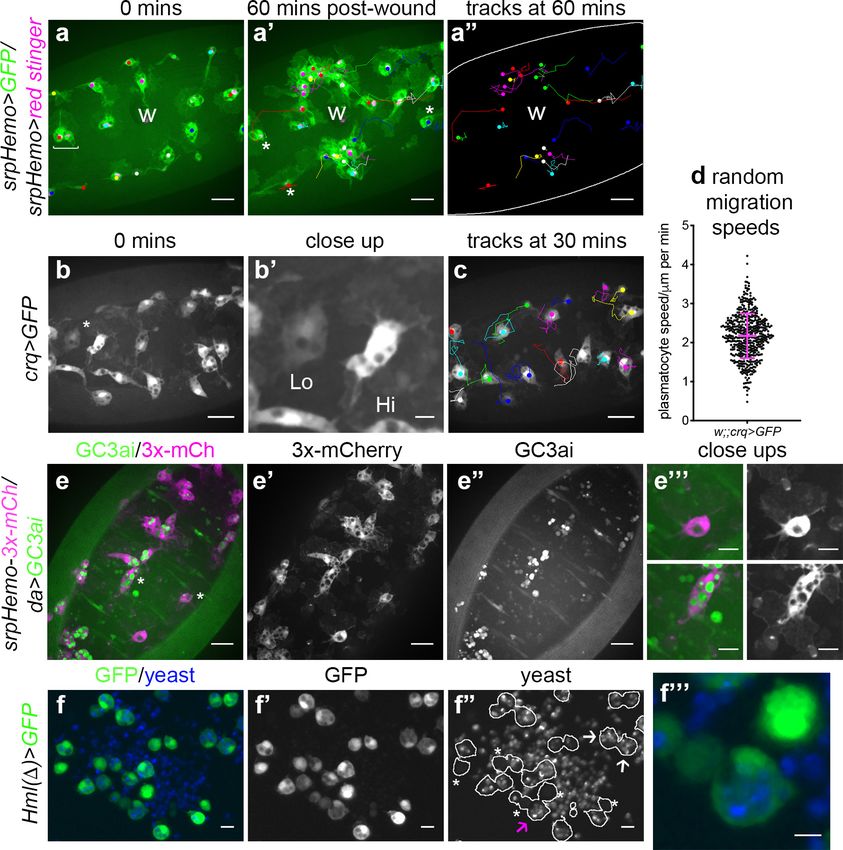
Research article                                                                       Developmental Biology Immunology and Inflammation

                                   Figure 1. Heterogeneity of Drosophila embryonic plasmatocyte responses. (a) GFP (green) and nuclear red stinger
                                   (magenta) labelled plasmatocytes on the ventral side of a stage 15 embryo at 0 min (a) and 60 min post-wounding
                                   (a’); plasmatocyte tracks at each timepoint are overlaid (a–a’) or shown in full (a’’). Examples of plasmatocytes
                                   failing to respond to the wound (w) indicated via asterisks; square bracket (a) indicates neighbouring
                                   plasmatocytes, one of which responds to wounding, while the other fails to respond (see Video 1). (b) Imaging of
                                   plasmatocytes labelled using crq-GAL4 to drive expression of GFP reveals a wide range in levels of crq promoter
                                   activity within plasmatocytes at stage 15; (b’) Close-up of cells marked by an asterisk in (b). (c) Overlay of
                                   plasmatocyte tracks of cells shown in (b) showing significant variation in their random migration speeds. (d)
                                   Scatterplot of plasmatocyte random migration speeds (taken from 23 embryos); line and error bars show mean
                                   and standard deviation, respectively. (e) Imaging the ventral midline at stage 15 shows a wide range in the amount
                                   of apoptotic cell clearance (green in merge; labelled via the caspase-sensitive reporter GC3ai) undertaken by
                                   plasmatocytes (magenta in merge, labelled via srpHemo-3x-mCherry reporter); (e’–e’’) mCherry and GC3ai
                                   channels; (e’’’) close-ups of cells devoid/full of engulfed GC3ai particles (indicated by asterisks in (e)). (f) Larval
                                   hemocytes (green in merge, labelled via Hml(D)-GAL4-driven expression of GFP) exhibit a range in their capacities
                                   to engulf calcofluor-labelled yeast (blue in merge) in vitro; (f’–f’’) GFP and yeast channels; white lines indicate cell
                                   edges in (f’’); asterisks in (f’’) indicate cells that have failed to phagocytose yeast; white arrows in (f’’) indicate cells
                                   that have phagocytosed multiple yeast particles; magenta arrow in (f’’) indicates close-up of region indicated in
                                   (f’’’). Scale bars represent 20 mm (a–a’’, b, c, e–e’’), 10 mm (e’’’, f–f’’), or 5 mm (b’, f’’’). See Supplementary file 1
                                   for full list of genotypes.
                                   The online version of this article includes the following source data for figure 1:
                                   Source data 1. Numerical data used to plot panel (d) of Figure 1.

Coates et al. eLife 2021;10:e58686. DOI: https://doi.org/10.7554/eLife.58686                                                                            4 of 39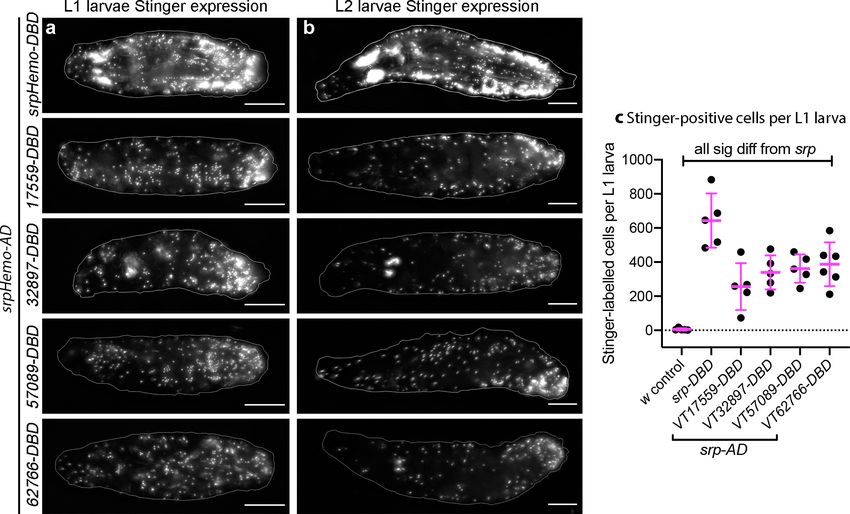
Research article                                                                  Developmental Biology Immunology and Inflammation

                                                                                                To characterise these subpopulations further,
                                                                                             their overlap with the known plasmatocyte
                                                                                             markers Eater, Croquemort, and Simu was inves-
                                                                                             tigated using novel GAL4-independent VT-RFP
                                                                                             reporters, which we generated using the same
                                                                                             enhancer sequences and insertion sites originally
                                                                                             characterised by the Stark lab (Kvon et al.,
                                                                                             2014). While we were unable to detect embry-
                                                                                             onic expression of eater at this stage of develop-
                                                                                             ment (Figure 2—figure supplement 1), reporters
                                                                                             for crq and simu (crq-GAL4,UAS-GFP and simu-
                                                                                             cytGFP), which also encode phagocytic receptors
                                                                                             (Franc et al., 1996; Kurant et al., 2008), clearly
                                                                                             labelled embryonic plasmatocytes (Figure 2—fig-
                                                                                             ure supplement 2). simu-cytGFP-labelled plas-
                                                                                             matocytes with little cell-to-cell variation
                                                                                             (Figure 2—figure supplement 2a), whereas crq-
                                                                                             GAL4,UAS-GFP displayed considerable hetero-
                                   Video 1. Plasmatocytes in similar positions within the    geneity (Figure 1b–b’; Figure 2—figure supple-
                                   embryo do not respond equally to inflammatory
                                                                                             ment 2b–c). However, there was little correlation
                                   stimuli. GFP (green) and red stinger (magenta) labelled
                                                                                             of simu or crq marker expression with subpopula-
                                   plasmatocytes responding to an epithelial wound at
                                                                                             tion cells, since all cells expressed similar levels of
                                   stage 15. Tracks of cell movements are shown via dots
                                   and lines. Magenta circles show cells responding to the
                                                                                             simu, while both crq and VT-RFP expression
                                   wound; blue circles indicate cells that are the same      appeared to vary independently of each other
                                   distance from the wound but fail to respond to the        (Figure 2—figure supplement 2a–b). Taken
                                   wound. Movie corresponds to stills shown in Figure 1a     together, we were able to detect discrete subpo-
                                   and lasts for 60 min post-wounding. Scale bar             pulations of plasmatocytes in the embryo, but
                                   represents 20 mm. See Supplementary file 1 genotype       these subpopulations showed no clear segrega-
                                   in full.                                                  tion with existing plasmatocyte markers.
                                   https://elifesciences.org/articles/58686#video1
                                                                      Subpopulations of Drosophila
                                                                      plasmatocytes vary across
                                                                      development: subpopulation
                                   dynamics in larvae and white pre-pupae
                                   Having identified subpopulations of plasmatocytes in the embryo, we then examined other stages of
                                   development to see whether their presence was maintained or modulated over time. In order to
                                   exclude potential expression in non-hemocyte cells (e.g. the non-plasmatocyte cells apparent in
                                   Figure 2e), we labelled subpopulation cells specifically using a split GAL4 approach (Pfeiffer et al.,
                                   2010), employing the serpent enhancer (a well-characterised hemocyte marker; Lebestky et al.,
                                   2000; Rehorn et al., 1996) and VT enhancers to express the transcriptional activation domain (AD)
                                   and DNA binding domains (DBD) of GAL4 independently. Only when co-expressed in the same cell
                                   do the AD and DBD heterodimerise and allow expression of UAS transgenes (Figure 3—figure sup-
                                   plement 1a). Characterising the split GAL4 lines in the embryo via expression of the EGFP-derivative
                                   Stinger (Barolo et al., 2000) confirmed that this split GAL4 approach labels discrete subpopulations
                                   of plasmatocytes within the embryo, although with a higher proportion of cells labelled compared to
                                   the original VT-GAL4 lines (Figure 3—figure supplement 1b–d) – a difference likely due to a combi-
                                   nation of amplification via the split GAL4 system and enhanced detectability of Stinger, which accu-
                                   mulates in the nucleus due to its nuclear localisation signal. Similar trends in the proportions of
                                   plasmatocytes labelled in a variety of locations across the embryo were observed for each subpopu-
                                   lation; for example, VT32897-labelled cells were the least frequently observed in the lateral head
                                   region and on the dorsal and ventral sides of the embryo (Figure 3—figure supplement 1b–d). As
                                   per Figure 2e, this suggests there are no clear biases between the dispersal routes undertaken by
                                   subpopulation cells.
                                       While serpent expression decreases in hemocytes during larval stages, we found that srpHemo-
                                   AD;srpHemo-DBD in concert with UAS-stinger was sufficient to label large numbers of cells in both
                                   L1 and L2 larvae (Figure 3a–b), consistent with previous publications (Gyoergy et al., 2018).

Coates et al. eLife 2021;10:e58686. DOI: https://doi.org/10.7554/eLife.58686                                                                 5 of 39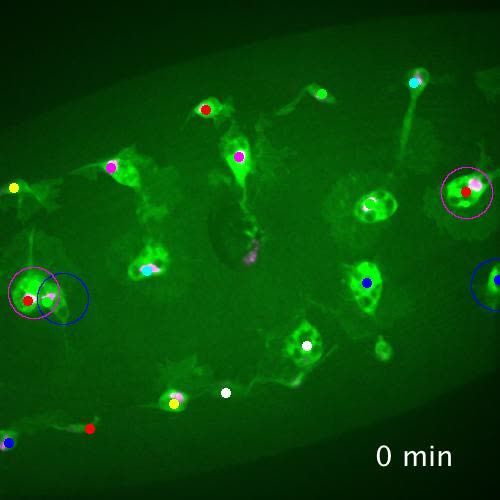
Research article                                                                     Developmental Biology Immunology and Inflammation

Figure 2. Identification of enhancers labelling discrete plasmatocyte subpopulations in Drosophila. (a) Lateral views of stage 13/14 embryos with in situ
hybridisation performed for GAL4 for indicated VT-GAL4 lines (anterior is left). Taken with permission from http://enhancers.starklab.org/ (n.b. these
images are not covered by the CC-BY 4.0 licence and further reproduction of this panel would need permission from the copyright holder); VT41692-
GAL4 represents an example in which the majority of plasmatocytes are labelled. (b) Schematic diagram showing screening approach to identify
Figure 2 continued on next page

Coates et al. eLife 2021;10:e58686. DOI: https://doi.org/10.7554/eLife.58686                                                                      6 of 39
Research article                                                                      Developmental Biology Immunology and Inflammation

Figure 2 continued
subpopulations of plasmatocytes: VT-GAL4-positive plasmatocytes will express both GMA (green) and tdTomato (magenta) – white cells in the
schematic. (c–d) Images showing the ventral midline at stage 14 of negative control (no driver; w;UAS-tdTom/+;srpHemo-GMA) and positive control (w;
srpHemo-GAL4/UAS-tdTom;srpHemo-GMA) embryos. (e) Images showing embryos containing VT-GAL4-labelled cells (via UAS-tdTomato, shown in
magenta) at stage 13 (first row, ventral views), stage 14 (second row, dorsal views), and stage 15 (third row, ventral views). The entire hemocyte
population is labelled via srpHemo-GMA (green); arrows indicate examples of VT-GAL4-positive plasmatocytes; asterisks indicate VT-GAL4-positive
cells that are not labelled by srpHemo-GMA. N.b. VT62766-GAL4 image contrast enhanced to different parameters compared to other images owing
to the very bright labelling of amnioserosal cells (cells on dorsal side of embryo destined to be removed during dorsal closure; labelled with an asterisk)
in the stage 14 image. (f) Labelling of smaller numbers of plasmatocytes on the ventral midline at stage 15 using VT-GAL4 lines indicated and UAS-GFP
(green); boxed regions show close-ups of VT-GAL4-positive plasmatocytes (f’). (g) Ventral view of positive control embryo (w;srpHemo-GAL4,UAS-GFP)
and example plasmatocyte (g’) at stage 15. (h) Scatterplot showing numbers plasmatocytes labelled using VT-GAL4 lines to drive expression from UAS-
GFP on the ventral midline at stage 15; lines and error bars represent mean and standard deviation, respectively. p-Values calculated via one-way
ANOVA with a Dunnett’s multiple comparison post-test (all compared to srpHemo-GAL4 control); n = 9 embryos per genotype. Scale bars represent
150 mm (a) or 10 mm (c–g). See Supplementary file 1 for full list of genotypes; overlap of VT enhancer expression with known plasmatocyte markers can
be found in Figure 2—figure supplements 1 and 2.
The online version of this article includes the following source data and figure supplement(s) for figure 2:
Source data 1. Numerical data used to plot panel (h) of Figure 2.
Figure supplement 1. Subpopulation cells do not express eater in the embryo.
Figure supplement 2. crq and simu do not specifically mark subpopulation cells in the developing embryo.
Figure supplement 2—source data 1. Numerical data used to plot panel (c) of Figure 2—figure supplement 2.

                                     Following hatching of embryos, we cannot use cell morphology to discriminate between plasmato-
                                     cytes and other hemocyte lineages (crystal cells and lamellocytes) and therefore refer to subpopula-
                                     tion cells as hemocytes for post-embryonic stages of development. Quantification of the numbers of
                                     subpopulation cells that could be detected using the split GAL4 system to drive expression from
                                     UAS-stinger showed that roughly 50% of serpent-positive hemocytes were labelled in L1 larvae for
                                     each VT subpopulation (Figure 3a–c). We cannot exclude the possibility that some of the cells
                                     labelled in L1 larvae are fat body cells as serpent is known to be expressed in the fat body
                                     (Rehorn et al., 1996). Therefore, it is possible that greater than 50% of hemocytes are labelled at
                                     this stage; nonetheless, a significant proportion of subpopulation cells are not labelled via these split
                                     GAL4 reporters in L1 larvae (Figure 3a–c). At this stage of development, most hemocytes are found
                                     in sessile patches attached to the body wall (Lanot et al., 2001; Makhijani et al., 2011) – this is also
                                     the case for the majority of subpopulation cells, since live imaging shows little movement relative to
                                     other cells during larval crawling, although some circulating cells could be observed (Video 2).
                                         In contrast to the significant numbers of cells present in L1 and L2 larvae, imaging of L3 larvae
                                     containing split srpHemo-AD and VT-DBD reporters (abbreviated to VTn) revealed that fewer sub-
                                     population cells could be detected at this stage (Figure 4a–f). This decrease in subpopulation cells
                                     does not seem to be linked to lower levels of serpent expression because blood cells are robustly
                                     labelled in positive control L3 larvae (srpHemo-AD in combination with srpHemo-DBD; Figure 4b),
                                     suggesting that serpent expression is not limiting our ability to detect subpopulation cells. More-
                                     over, a reduction in subpopulation cells can also be seen when using the original VT-GAL4 lines to
                                     drive stinger expression at this stage (i.e. independent of a reliance on serpent expression for label-
                                     ling; Figure 4—figure supplement 1a).
                                         Using this approach, VT32897 and VT17559 labelled the most cells (Figure 4c–d), with only the
                                     occasional cell present in VT57089 larvae (Figure 4e) and cells largely absent from VT62766 larvae
                                     (Figure 4f). Labelled cells were also present in the head region, along the dorsal vessel (the fly heart)
                                     and between the salivary glands (which themselves exhibit non-specific labelling) in VT32897 larvae.
                                     The VT32897 head region cells are likely to represent sessile hemocytes, whereas cells at the remain-
                                     ing two sites probably correspond to serpent-positive nephrocytes and garland cells (Brodu et al.,
                                     1999; Das et al., 2008), respectively (Figure 4d). VT57089 shows additional staining in the head
                                     region (potentially the Bolwig organ; Figure 4e) and, as per the dorsal vessel-associated cells in
                                     VT32897 (Figure 4d), hemocytes can also be found in these regions when the total hemocyte popu-
                                     lation is labelled using srpHemo-AD and srpHemo-DBD in positive controls (Figure 4b; Video 3).
                                     Furthermore, these larval distributions closely resemble patterns observed using VT-GAL4 reporters,
                                     albeit with a loss of non srp-dependent labelling due to our split GAL4 approach (data not shown).

Coates et al. eLife 2021;10:e58686. DOI: https://doi.org/10.7554/eLife.58686                                                                       7 of 39
Research article Developmental Biology Immunology and Inflammation
Live imaging of L3 larvae confirmed that hemocytes were predominantly attached to the body wall,
but that small numbers of cells could be detected in circulation (Video 4).
To quantify the proportion of hemocytes that were labelled in L3 larvae and address any bias in
localisation, L3 larvae were bled and then the carcasses scraped (as described in Petraki et al.,
2015) to compare numbers of cells in circulation with those more tightly adhered to tissue, respec-
tively. This approach confirmed the low numbers of cells observed in L3 larval images and revealed
no bias in subpopulation localisation, with similar proportions present in circulation and adhered to
tissue for each subpopulation (Figure 4g). Quantification of subpopulation localisation along the L3
body axis suggested that VT57089 and VT62766 cells exhibit a bias toward the posterior of the lar-
vae compared to the total population (Figure 4h–h’).
Figure 3. Plasmatocyte subpopulations are present in large numbers in L1 and L2 larvae. (a–b) Images of L1 (a) and L2 larvae (b) with cells labelled
using the split GAL4 system (srpHemo-AD in combination with srpHemo-DBD or the VT-DBD transgene indicated) to drive expression from UAS-
stinger. Scale bars represent 150 mm; white lines show edge of the larva; images contrast enhanced to 0.3% saturation. (c) Scatterplot showing numbers
of Stinger-positive cells labelled via the split GAL4 system per larva; numbers of cells were quantified from flattened L1 larvae. w1118;UAS-stinger/+
larvae were used as negative controls; all conditions are significantly different compared to the positive control (w1118;srpHemo-AD/UAS-stinger;
srpHemo-DBD/+) via a one-way ANOVA with a Dunnett’s multiple comparison post-test: srp vs w, pResearch article Developmental Biology Immunology and Inflammation
The striking decrease in proportion of sub-
population cells that can be detected in L3 lar-
vae compared to earlier stages suggests
reprogramming of cells leading to a loss of
enhancer activity. To test this hypothesis, split
GAL4 lines were used in lineage tracing experi-
ments via G-TRACE (Evans et al., 2009). In this
approach, current expression of reporters is
marked via Red Stinger and also leads to the
permanent expression of Stinger via the activity
of a co-expressed FLP recombinase. As such, the
expression of both fluorophores indicates cur-
rent split GAL4 activity, while the expression of
Stinger alone indicates historical activity in cells
Video 2. Localisation and dynamics of subpopulation where expression has since ceased (Figure 4—
cells within L1 larvae. Movies showing localisation and
figure supplement 1b). Analysing the total com-
movement of cells labelled using split GAL4 lines
plement of current and historic subpopulation
(srpHemo-AD in combination with VT17559-DBD,
cells in L3 larvae via G-TRACE revealed that a
VT32897-DBD, VT57089-DBD, or VT62766-DBD) to
drive expression from UAS-stinger in L1 larvae. Images significant proportion of subpopulation cells
taken from timelapse series of single focal planes to were positive for historical expression only
enable rapid imaging. The majority of cells detected (Stinger expression alone; Figure 4—figure sup-
appear attached to the body wall, since they do not plement 1c). This confirms that subpopulation
shift their relative positions during larval movements, cells from earlier timepoints survive in vivo but
although some cells can be seen in circulation. Scale change their transcriptional profile – a finding
bars represent 200 mm. See Supplementary file 1 for consistent with reprogramming events rather
full list of genotypes. than a loss of cells themselves.
https://elifesciences.org/articles/58686#video2 Imaging of white pre-pupae (WPP), the stage
that marks the beginning of pupal development
and metamorphosis, showed very similar pat-
terns across the split GAL4 VT enhancer lines (Figure 5a–f), with a further reduction in the numbers
of cells labelled. It was possible to observe the occasional cell moving in circulation within WPP,
strongly suggesting these cells are hemocytes (Video 5 and Video 6). Live imaging of VT32897 WPP
also confirmed association of cells with the pumping dorsal vessel (Figure 5d; Video 7). Significantly,
this data indicates that the presence of subpopulations within embryos is not simply a consequence
of slow accumulation of fluorescent proteins by weak drivers, since these enhancer-based reporters
do not label an ever-increasing number of cells as development proceeds. Overall, the numbers of
hemocytes within subpopulations that can be detected decreases over larval and early pupal stages,
suggesting that plasmatocyte subpopulations are developmentally regulated and exhibit plasticity.
This reprogramming could reflect specific and changing requirements for specialised plasmatocyte
subpopulations across the life cycle, for example, an association with processes required for organo-
genesis (Charroux and Royet, 2009; Defaye et al., 2009; Regan et al., 2013). The differential local-
isation of some subpopulation cells also indicates the potential that molecularly and
functionally different macrophage populations are present at specific tissues in the fly.
Subpopulation cells return in large numbers during pupal development
Since subpopulation cells appear associated with stages of development when organogenesis and
tissue remodelling occur, we hypothesised that some hemocytes may be reprogrammed via changes
in expression leading to reactivation of the enhancers that mark these subpopulations. This would
enable subpopulations to return during metamorphosis. Imaging pupae at various times after pupar-
ium formation (APF) revealed that subpopulation cells re-emerged in large numbers during this
stage, but with distinct dynamics between subpopulations labelled with different enhancers
(Figure 6a–f). For instance, VT17559 cells are already present in substantial numbers by 18 hr APF
(Figure 6c), whereas VT32897 reporter expression reappears between 24 and 48 hr APF
(Figure 6d). VT57089 and VT62766 cells increased in numbers more gradually over the course of
pupal development (Figure 6e–f). Different subpopulations appear present in subtly distinct
Coates et al. eLife 2021;10:e58686. DOI: https://doi.org/10.7554/eLife.58686 9 of 39Research article Developmental Biology Immunology and Inflammation Figure 4. Plasmatocyte subpopulations are greatly reduced in L3 larvae but exhibit distinctive localisations. (a–f) Dorsal and ventral views of negative control L3 larvae (a, no GAL4), positive control L3 larvae with hemocytes labelled via serpent (b, UAS-stinger driven by srpHemo-AD;srpHemo-DBD) and L3 larvae containing cells labelled through expression of UAS-stinger via srpHemo-AD and the VT-DBD transgenes indicated (c–f). Arrowheads indicate non-specific expression of Stinger in salivary glands and gut (a’ – also visible in dorsal images (c’–f’) but not labelled) and possible proventricular region hemocytes/garland cells (b); arrows (b, b’) indicate regions shown in close-ups of potential hemocyte population in the head region (b’’) and in the Bolwig organ (b’’’); boxes indicate individual hemocytes (c, e) and labelling in the head region (d), proventriculus/of Garland cells (d’), and Bolwig organ (e) shown at enhanced magnification in inset panels; asterisks in (d) denote region shown as a close-up and at a reduced brightness in (d’’) in order to reveal detail of cells along the dorsal vessel; fractions indicate the number of larvae exhibiting a particular localisation out of the total imaged. (g) Scatterplot showing the proportion of subpopulation cells labelled via the split GAL4 system in circulation (initial bleed) compared to the proportions in resident/adhered populations (scraping of the carcass) in the indicated genotypes. Proportions obtained via each method compared via Student’s t-test (n = 10 larvae per genotype; p=0.77 (VT17559), p=0.13 (VT32897), p=0.27 (VT57089), p=0.60 (VT62766)). (h) Bar chart showing the relative proportions of Figure 4 continued on next page Coates et al. eLife 2021;10:e58686. DOI: https://doi.org/10.7554/eLife.58686 10 of 39
Research article                                                                        Developmental Biology Immunology and Inflammation

Figure 4 continued
labelled cells found within the anterior, medial or posterior 1/3 of L3 larvae using Hml(D)-GAL4 to drive EGFP or the split GAL4 system to express
Stinger in all larval hemocytes or subpopulations, respectively (n = 17, 12, 20, 13, 14 larvae). (h’) Scatterplot of the proportions of cells found within the
anterior region of L3 larvae for controls and split GAL4 lines. Kruskall-Wallis test with Dunn’s multiple comparisons test was used to compare
subpopulation values with Hml(D)-GAL4 control; (p=0.11 (VT17559), p=0.061 (VT32897), p=0.0018 (VT57089), p=0.0063 (VT62766)). Scale bars represent
500 mm (a–f); larval images contrast enhanced to 0.3% saturation (a–f); lines and error bars represent mean and standard deviation, respectively (g, h’);
bars represent mean (h); ns and ** denote not significant and p
Research article                                                                     Developmental Biology Immunology and Inflammation

                                                                                                Video 5. Flow of srp-positive cells in circulation within
                                                                                                a white pre-pupa. Movie showing movements of srp-
                                                                                                positive cells within the hemolymph of a white pre-
                                   Video 4. Localisation and dynamics of subpopulation          pupa. Cells labelled via UAS-stinger expression driven
                                   cells within L3 larvae. Movies showing localisation and      by srpHemo-AD in combination with srpHemo-DBD.
                                   movement of cells labelled using split GAL4 lines            Scale bar represents 500 mm. See Supplementary file
                                   (srpHemo-AD in combination with VT17559-DBD,                 1 for genotype in full.
                                   VT32897-DBD, VT57089-DBD, or VT62766-DBD) to                 https://elifesciences.org/articles/58686#video5
                                   drive expression from UAS-stinger in L3 larvae. Images
                                   taken from timelapse series of single focal planes to
                                                                                                stages using the split GAL4 lines (Figure 4c–f),
                                   enable rapid imaging. Far fewer cells are visible
                                                                                                additional lineage-tracing analyses would be
                                   compared to L1 and L2 larvae and the majority of cells
                                   detected appear attached to the body wall, since they        required to uncover whether cells derived from
                                   do not shift their relative positions during larval          the lymph gland contribute to subpopulation cell
                                   movements. Movies repeat with second repetition              numbers in pupae or adults.
                                   showing examples of rare cells in circulation (illustrated
                                   by overlaid tracks). Scale bars represent 500 mm. See        Subpopulation cells behave in a
                                   Supplementary file 1 for full list of genotypes.             functionally distinct manner
                                   https://elifesciences.org/articles/58686#video4              compared to the overall
                                                                                                plasmatocyte population
                                                                                          Given that the VT lines identified above are spe-
                                   cifically and dynamically expressed in subpopulations of hemocytes during Drosophila development,
                                   we next set out to investigate whether the labelled subpopulations are also functionally distinct
                                   using a range of immune-relevant assays. The ability of vertebrate macrophages to respond to pro-
                                   inflammatory stimuli, such as injuries, can vary according to their activation status (Arnold et al.,
                                   2007; Dal-Secco et al., 2015). To investigate this in our system, a well-established assay of inflam-
                                   matory migration (Stramer et al., 2005) was employed (Figure 1a; Video 1). Strikingly, following
                                   laser-induced wounding, cells labelled by three VT-GAL4 lines (VT17559-GAL4, VT32897-GAL4 and
                                   VT62766-GAL4) showed a significantly more potent migratory response to injury. In each case, a
                                   greater proportion of labelled subpopulation cells migrated to wounds, compared to the overall
                                   hemocyte population as labelled by a pan-plasmatocyte driver (Figure 8a–c). Consistent with our
                                   results above, plasmatocytes labelled by the VT lines represent a subset of the total number of
                                   hemocytes present ventrally in stage 15 embryos (Figure 8d).
                                       We next investigated in vivo migration speeds of the embryonic plasmatocyte subpopulations (as
                                   per Figure 1c–d). Stage 15 embryos were imaged for 1 hr and individual plasmatocyte movements
                                   were tracked (Figure 8e–f). Only the VT17559-GAL4-labelled plasmatocyte subpopulation displayed
                                   statistically significantly faster rates of migration compared to the overall plasmatocyte population
                                   (labelled using srpHemo-GAL4; Figure 8g). There were no differences in directionality (cell displace-
                                   ment divided by total path length) for any of the subpopulations, suggesting that the mode of
                                   migration was similar across these lines and with that of the overall population (Figure 8h).
                                       Apoptotic cell clearance (efferocytosis) represents another evolutionarily-conserved function per-
                                   formed by embryonic plasmatocytes (Figure 1e). Therefore, we investigated this function in subpo-
                                   pulations, using numbers of phagosomal vesicles per cell as a proxy for this process (Evans et al.,
                                   2013). Cells labelled via VT17559-GAL4, VT57089-GAL4 and VT62766-GAL4 (but not VT32897-
                                   GAL4) contained fewer phagosomes than the overall plasmatocyte population (Figure 8i–k), sug-
                                   gesting that these discrete populations of cells are less effective at removing apoptotic cells inside

Coates et al. eLife 2021;10:e58686. DOI: https://doi.org/10.7554/eLife.58686                                                                      12 of 39
Research article Developmental Biology Immunology and Inflammation
Figure 5. Plasmatocyte subpopulations are sparse in white pre-pupae. (a–b) Dorsal and ventral views of negative control (a, UAS-stinger, but no driver)
and positive control (b, UAS-stinger driven by srpHemo-AD;srpHemo-DBD) white pre-pupae (WPP); boxes indicate regions shown in close-up views of
positive controls. (c–f) dorsal and ventral views of WPP containing cells labelled using srpHemo-AD and the indicated VT-DBD to drive expression from
UAS-stinger. Very few VT enhancer-labelled cells can be detected in WPP: boxes mark regions shown in close-up views with example hemocytes
indicated with an arrow; dorsal vessel-associated and proventricular region/Garland cells can also be observed in VT32897 WPP (arrowheads in d and
d’, respectively); scale bars represent 500 mm (WPP) or 50 mm (close-ups); WPP images contrast enhanced to 0.3% saturation; close-up images contrast
enhanced individually. See Supplementary file 1 for full list of genotypes.
the developing embryo. To confirm this result dynamically, GFP-myc-2xFYVE, a phosphatidylinositol-
3-phosphate reporter (Wucherpfennig et al., 2003) was used to measure the rate of phagocytosis
in subpopulation cells. This reporter rapidly and transiently localises on the surface of engulfed
phagosomes in plasmatocytes (Roddie et al., 2019). All subpopulations exhibited lower rates of
phagocytosis compared to the overall plasmatocyte population using this reporter (Figure 8l), sug-
gesting the differences in numbers of phagosomes per cell result from distinct phagocytic abilities.
Finally, we examined cell size and the shape of labelled plasmatocyte subpopulations. Vertebrate
macrophages are highly heterogeneous, with distinct morphologies dependent upon their tissue of
residence or polarisation status (McWhorter et al., 2013; Ploeger et al., 2013; Rostam et al.,
2017). We found no obvious size or shape differences between VT-GAL4-labelled cells and the over-
all plasmatocyte population (Figure 8—figure supplement 1a–e). This was also the case when VT-
GAL4-positive cells were compared to internal controls (VT-GAL4-negative cells within the same
embryos) for a range of shape descriptors (Figure 8—figure supplement 1f–i). Similarly, we were
unable to detect differences in ROS levels (Figure 8—figure supplement 2) or the proportion of VT-
GAL4-labelled plasmatocytes that phagocytosed pHrodo-labelled E. coli compared to controls (Fig-
ure 8—figure supplement 3), two processes associated with pro-inflammatory activation of macro-
phages (Benoit et al., 2008).
Taken together these data show that the subpopulations of plasmatocytes identified via the VT-
GAL4 reporters exhibit functional differences compared to the overall plasmatocyte population
(Table 1). Therefore, as well as displaying molecular differences in the form of differential enhancer
Coates et al. eLife 2021;10:e58686. DOI: https://doi.org/10.7554/eLife.58686 13 of 39Research article Developmental Biology Immunology and Inflammation
Video 6. Movement of VT57089 subpopulation cells Video 7. Movement of VT32897-labelled, dorsal vessel-
within a white pre-pupa. Movie showing movements of associated, non-hemocyte cells within a white pre-
VT57089 cells within the hemolymph of a white pre- pupa. Movie showing rhythmic movements of cells in a
pupa (examples highlighted with green circles). Cells white pre-pupa labelled using srpHemo-AD in
labelled via UAS-stinger expression using srpHemo-AD combination with VT32897-DBD to drive expression
and VT57089-DBD. Movie plays twice with an overlay of from UAS-stinger. Cells on dorsal midline (likely to be
the tracks of cells in circulation shown in repeat. Scale nephrocytes) move in time with pumping of the dorsal
bar represents 500 mm. See Supplementary file 1 for vessel in a white pre-pupa. Scale bar represents 500
genotype in full. mm. See Supplementary file 1 for genotype in full.
https://elifesciences.org/articles/58686#video6 https://elifesciences.org/articles/58686#video7
activity, and hence reporter expression, these discrete populations of cells behave differently. This
strongly suggests that these cells represent functionally distinct subpopulations and that the plasma-
tocyte lineage is not homogeneous. Furthermore, not all subpopulations displayed identical func-
tional characteristics, suggesting that there are multiple distinct subtypes present in vivo, although
some overlap between subpopulations seems likely. For example, VT17559-GAL4-labelled cells were
more effective at responding to wounds and migrated more rapidly but carried out less phagocyto-
sis of apoptotic cells. By contrast, VT32987-GAL4-labelled cells only displayed improved wound
responses (Figure 8).
VT enhancers identify functionally active genes within plasmatocytes
In the original study that analysed the VT-GAL4 collection, the majority of active enhancer fragments
tested were found to control transcription of neighbouring genes (Kvon et al., 2014). Thus, genes
proximal to enhancers that label plasmatocyte subpopulations represent candidate regulators of
immune cell function (Table 2; Figure 9a). VT62766-GAL4 labels a subpopulation of plasmatocytes
with enhanced migratory responses to injury (Figure 8a–c) and this enhancer region is found within
the genomic interval containing paralytic (para), which encodes a subunit of a voltage-gated sodium
channel (Lin et al., 2009), and upstream of the 3’ end of Calnexin14D (Cnx14D; Figure 9a). Cnx14D
encodes a calcium-binding chaperone protein resident in the endoplasmic reticulum
(Christodoulou et al., 1997). Alterations in calcium dynamics are associated with clearance of apo-
ptotic cells (Cuttell et al., 2008; Gronski et al., 2009) and modulating calcium signalling within plas-
matocytes alters their ability to respond to wounds (Weavers et al., 2016). Therefore, given the
association of Cnx14D with the VT62766 enhancer and the potential for plasmatocyte behaviours to
be modulated by altered calcium dynamics, we examined whether misexpressing Cnx14D in all plas-
matocytes was sufficient to cause these cells to behave more similarly to the VT62766 subpopula-
tion. Critically, pan-hemocyte expression of Cnx14D stimulated wound responses with elevated
numbers of plasmatocytes responding to injury compared to controls (Figure 9b–c), consistent with
the enhanced wound responses of the endogenous VT62766-GAL4-positive plasmatocyte subpopu-
lation (Figure 8c). This reveals that genes proximal to subpopulation-defining enhancers represent
candidate genes in dictating the biology of cells in those subpopulations. More importantly, misex-
pression of a subpopulation-linked gene promotes a similar behaviour to that subpopulation in the
wider plasmatocyte population.
Coates et al. eLife 2021;10:e58686. DOI: https://doi.org/10.7554/eLife.58686 14 of 39Research article Developmental Biology Immunology and Inflammation
Figure 6. Plasmatocyte subpopulations return with distinct dynamics during pupal development. (a–b) Dorsal images of negative control (a, no GAL4)
and positive control pupae (b, labelled via srpHemo-AD;srpHemo-DBD) at 18 hr after puparium formation (APF). (c–f) dorsal images showing
localisation of cells labelled using srpHemo-AD and VT-DBD (VT enhancers used to drive DBD expression indicated above panels) to drive expression
of UAS-stinger during pupal development from 18 hr AFP to 72 hr APF. All image panels contrast enhanced to 0.3% saturation to reveal localisation of
labelled cells due to differing intensities of reporter line expression. Scale bars represent 500 mm. See Supplementary file 1 for full list of genotypes.
Plasmatocyte subpopulations can be modulated via exposure to
enhanced levels of apoptosis
Having defined functional differences in embryonic plasmatocyte subpopulations and characterised
how these populations shift during development and ageing, we sought to identify the processes via
which these subpopulations were specified. In vertebrates, a range of stimuli drive macrophage het-
erogeneity and polarisation (Martinez and Gordon, 2014; Murray, 2017), with apoptotic cells able
to polarise macrophages towards anti-inflammatory phenotypes (A-Gonzalez et al., 2017;
de Oliveira Fulco et al., 2014). In the developing fly embryo, high apoptotic cell burdens impair
Coates et al. eLife 2021;10:e58686. DOI: https://doi.org/10.7554/eLife.58686 15 of 39Research article Developmental Biology Immunology and Inflammation Figure 7. Plasmatocyte subpopulations exhibit distinct localisations and dynamics as adults age. (a–e) Representative lateral images of adult flies between 0 and 6 weeks of age showing localisation of cells labelled using srpHemo-3x-mCherry (a, positive control), or split GAL4 to drive expression of stinger (b-e, srpHemo-AD;VT-DBD). The VT enhancers used to drive expression of the DNA-binding domain (DBD) of GAL4 correspond to VT17559 (b), VT32897 (c), VT57089 (d), and VT62766 (e); inset images show alternative view of proboscis region from same fly (a) or at a reduced level of Figure 7 continued on next page Coates et al. eLife 2021;10:e58686. DOI: https://doi.org/10.7554/eLife.58686 16 of 39
Research article                                                                      Developmental Biology Immunology and Inflammation

Figure 7 continued
brightness to reveal cellular detail (d). Images contrast enhanced to 0.15% saturation (a–c, e) or 0.75% (d) to reveal localisation of labelled cells due to
differing intensities of reporter line expression. Arrows in top row indicate hemocytes in the legs; 2nd and 3rd rows show close-up of thorax and
abdomen of day one flies; at least five flies were imaged for each timepoint; scale bars represent 500 mm. (f) Scatterplot showing proportion of cells
dissected from day one adults that were labelled using srpHemo-AD and the VT-DBD transgenes indicated to drive expression from UAS-stinger. One-
way ANOVA used to compare to negative control flies (w1118;UAS-stinger/+) with split GAL4 VT lines: n = 5 dissections per genotype; p=0.60 (VT17559),
p=0.013 (VT32897), p0.05), p
Research article                                                               Developmental Biology Immunology and Inflammation

Figure 8. Drosophila plasmatocyte subpopulations demonstrate functional differences compared to the overall plasmatocyte population. (a–b)
Example images showing plasmatocyte wound responses at 60 min post-wounding (maximum projections of 15 mm deep regions). Cells labelled via
UAS-stinger using srpHemo-GAL4 (a) and VT17559-GAL4 (b); dotted lines show wound edges. (c–d) Scatterplots showing percentage of srpHemo-GAL4
(control) or VT-GAL4-labelled plasmatocytes responding to wounds at 60 min (c) or total numbers of labelled plasmatocytes in wounded region (d);
Figure 8 continued on next page

Coates et al. eLife 2021;10:e58686. DOI: https://doi.org/10.7554/eLife.58686                                                            18 of 39
Research article                                                                    Developmental Biology Immunology and Inflammation

Figure 8 continued
p=0.018, 0.041, 0.99, 0.0075 compared to srpHemo-GAL4 (n = 77, 21, 22, 26, 25) (c); p0.05), p
Research article                                                                  Developmental Biology Immunology and Inflammation

Table 2. VT enhancer region location and neighbouring genes.
VT enhancer                      Genomic region*                               Nearest genes                    Distance of enhancer from gene
VT17559                          chr2R: 12,069,698–12,070,780                  Lis-1                            overlapping
                                                                               CG8441                           2,929bp upstream
                                                                               Ptp52F                           3,887bp downstream
VT32897                          chr3L: 18,631,149–18,633,281                  MYPT-75D                         overlapping
                                                                               bora                             13,299bp downstream
                                                                               not                              15,921bp downstream
VT57089                          chrX: 4,961,770–4,962,316                     ovo                              overlapping
                                                                               CG32767                          3,290bp upstream
                                                                               CR44833                          3,870bp downstream
VT62766                          chrX: 16,406,666–16,408,777                   para                             overlapping
                                                                               Cnx14D                           10,404bp upstream
                                                                               CG9903                           26,520bp upstream

* D. melanogaster Apr. 2006 (BDGP R5/dm3) Assembly.
Data taken from http://enhancers.starklab.org/.
The online version of this article includes the following source data for Table 2:
Source data 1. Source data for Table 2.VT enhancer region location and neighbouring genes.

                                     (Clark et al., 2011), and the iron transporter malvolio (Folwell et al., 2006). The ease of extracting
                                     larval hemocytes has meant these cells have received more attention than their embryonic counter-
                                     parts; recent transcriptional profiling approaches via scRNAseq that emerged during preparation of
                                     this manuscript have suggested the existence of distinct larval blood cell populations in Drosophila
                                     (Cattenoz et al., 2020; Fu et al., 2020; Tattikota et al., 2019) and provided further confirmation of
                                     the existence of self-renewing/proliferating plasmatocytes at this stage of development
                                     (Makhijani et al., 2011). Similar approaches have been taken to study the cells of the lymph gland
                                     (Cho et al., 2020), though further work is required to establish whether the blood cells generated in
                                     this second haematopoietic wave contribute to subpopulation numbers in pupae and adults. While it
                                     has been suggested that some of these molecular differences may, at least in part, reflect the pres-
                                     ence of transient progenitor states (Tattikota et al., 2019), these studies identified a number of
                                     potentially different functional groups, including more immune-activated cell populations displaying
                                     expression signatures reflective of active Toll and JNK signalling (Cattenoz et al., 2020; Fu et al.,
                                     2020; Tattikota et al., 2019). Therefore, our identification of developmentally regulated subpopula-
                                     tions, coupled with this recent evidence from larvae, strongly points to functional heterogeneity
                                     within the plasmatocyte lineage.
                                         How do the functionally distinct subpopulations we have uncovered relate to the transcription-
                                     ally-defined clusters revealed via scRNAseq? These approaches profiled L3 larval hemocytes
                                     (Cattenoz et al., 2020; Fu et al., 2020; Tattikota et al., 2019), the stage at which fewest subpopu-
                                     lation cells can be identified. Therefore, it is possible that VT-labelled cells do not correspond to any
                                     of the scRNAseq clusters: subpopulation cells in L3 larvae may represent high expressors from earlier
                                     in development that are only marked due to perdurance of fluorescent protein. Alternatively, in
                                     terms of function, it could be concluded that the VT-labelled subpopulations display a degree of
                                     immune activation given their decreased efficiency at removing apoptotic cells and increased
                                     responses to wounds. These subpopulations could thus relate to clusters displaying signatures of
                                     immune activation (PM3-PM7; Tattikota et al., 2019 PL-Rel, PL-vir1, PL-AMP; Cattenoz et al.,
                                     2020). In contrast to clusters predicted to be proliferative (PM9-11/PL-prolif/PL-Inos), these acti-
                                     vated clusters did not show a bias in their distribution between circulation and sessile patches
                                     (Cattenoz et al., 2020; Tattikota et al., 2019), similar to the localisation of VT-labelled cells. While
                                     we have not categorically identified which genes are regulated by the VT-enhancers that define sub-
                                     populations (see Table 2 for candidates), transcripts of several of these candidates are enriched in
                                     PM6, an immune-activated cluster, and PM12, which accounts for less than 1% of plasmatocytes and
                                     has been difficult to classify since it is defined by uncharacterised genes (Tattikota et al., 2019).

Coates et al. eLife 2021;10:e58686. DOI: https://doi.org/10.7554/eLife.58686                                                          20 of 39
Research article Developmental Biology Immunology and Inflammation
Figure 9. Misexpression of Cnx14D improves plasmatocyte inflammatory responses to injury. (a) Chromosomal
location of the VT62766-GAL4 enhancer region; only one transcript is shown for para, which possesses multiple
splice variants. The VT62766 region is highlighted in yellow and by an asterisk; Cnx14D (indicated by magenta
arrow) lies within para. (b) Scatterplot showing numbers of plasmatocytes present at stage 15 on the ventral side
of the embryo ahead of wounding in controls and on misexpression of Cnx14D in all hemocytes using both
srpHemo-GAL4 and crq-GAL4 (hc>Cnx14D); n = 30 and 38 for control and hc>Cnx14D embryos, respectively,
p=0.670 via Student’s t-test. (c) Scatterplot of wound responses 60 min post-wounding (number of plasmatocytes
at wound, normalised for wound area and to control responses); n = 21 and 30 for control and hc>Cnx14D
embryos, respectively; p=0.0328 via Student’s t-test. Line and error bars represent mean and standard deviation,
respectively (b–c). See Supplementary file 1 for full list of genotypes.
The online version of this article includes the following source data for figure 9:
Source data 1. Numerical data used to plot panel (b) of Figure 9.
Source data 2. Numerical data used to plot panel (c) of Figure 9.
While the field is still at an early stage, further characterisation and new tools based on marker genes
will enable these different clusters and subpopulations to be more carefully compared.
The subpopulations we have identified are significantly reduced in L3 larvae and consequently
may represent functional heterogeneity more relevant to other developmental stages. It is clear that
the biology of Drosophila blood cells varies significantly across the lifecourse: for instance plasmato-
cytes play strikingly different functional roles in embryos and larvae (Charroux and Royet, 2009;
Defaye et al., 2009), shifting from developmental roles to host defence. Additionally, plasmatocytes
undergo directed migration to sites of injury in embryos and pupae (Moreira et al., 2011;
Coates et al. eLife 2021;10:e58686. DOI: https://doi.org/10.7554/eLife.58686 21 of 39You can also read