Microglial trogocytosis and the complement system regulate axonal pruning in vivo - eLife
←
→
Page content transcription
If your browser does not render page correctly, please read the page content below
RESEARCH ARTICLE

                                     Microglial trogocytosis and the
                                     complement system regulate axonal
                                     pruning in vivo
                                     Tony KY Lim, Edward S Ruthazer*

                                     Department of Neurology & Neurosurgery, Montreal Neurological Institute-
                                     Hospital, McGill University, Montreal, Canada

                                     Abstract Partial phagocytosis—called trogocytosis—of axons by microglia has been
                                     documented in ex vivo preparations but has not been directly observed in vivo. The mechanisms
                                     that modulate microglial trogocytosis of axons and its function in neural circuit development remain
                                     poorly understood. Here, we directly observe axon trogocytosis by microglia in vivo in the
                                     developing Xenopus laevis retinotectal circuit. We show that microglia regulate pruning of retinal
                                     ganglion cell axons and are important for proper behavioral response to dark and bright looming
                                     stimuli. Using bioinformatics, we identify amphibian regulator of complement activation 3, a
                                     homolog of human CD46, as a neuronally expressed synapse-associated complement inhibitory
                                     molecule that inhibits trogocytosis and axonal pruning. Using a membrane-bound complement C3
                                     fusion protein, we demonstrate that enhancing complement activity enhances axonal pruning. Our
                                     results support the model that microglia remodel axons via trogocytosis and that neurons can
                                     control this process through expression of complement inhibitory proteins.

                                     Introduction
*For correspondence:                 Microglia, the immune cells of the CNS, are vital for the maintenance and development of a healthy
edward.ruthazer@mcgill.ca            brain. Constantly surveilling the brain (Nimmerjahn et al., 2005; Wake et al., 2009), these highly
                                     phagocytic cells are thought to contribute to developmental synaptic remodeling by phagocytosing
Competing interests: The
                                     inappropriate or supernumerary synapses, a hypothesis that has derived considerable support from
authors declare that no
                                     histological and immunohistochemical evidence identifying synaptic components within endocytic
competing interests exist.
                                     compartments in microglia (Paolicelli et al., 2011; Schafer et al., 2012; Stevens et al., 2007;
Funding: See page 29                 Tremblay et al., 2010). This hypothesis is further supported by numerous studies demonstrating
Received: 16 August 2020             that microglia depletion leads to exuberant axonal outgrowth (Pont-Lezica et al., 2014;
Accepted: 28 February 2021           Squarzoni et al., 2014), impaired pruning of excess synapses (Ji et al., 2013; Milinkeviciute et al.,
Published: 16 March 2021             2019), and increased spine density (Wallace et al., 2020) during development.
                                        Studies depleting microglia or disrupting microglial function provide indirect evidence to support
Reviewing editor: Carol A
Mason, Columbia University,
                                     the hypothesis that microglia remodel synapses through phagocytic mechanisms. An inherent weak-
United States                        ness of indirect approaches is that the source of the synaptic material within microglia is unknown.
                                     For example, it is possible that synaptic components may be found within microglia due to clearance
   Copyright Lim and Ruthazer.
                                     of apoptotic neurons rather than synaptic pruning. More direct approaches are required to verify
This article is distributed under
                                     whether microglia collect synaptic material from living neurons. Currently, direct evidence of com-
the terms of the Creative
Commons Attribution License,         plete elimination of synapses by microglial engulfment remains elusive. However, instead of remov-
which permits unrestricted use       ing entire synapses, microglia have been documented engaging in trogocytosis, or partial
and redistribution provided that     elimination, of axons and presynaptic boutons in ex vivo organotypic cultures and in fixed brain tis-
the original author and source are   sue using electron microscopy (Weinhard et al., 2018), although it remains to be seen whether
credited.                            microglial trogocytosis of axons is a phenomenon that occurs in vivo.

Lim and Ruthazer. eLife 2021;10:e62167. DOI: https://doi.org/10.7554/eLife.62167                                                   1 of 35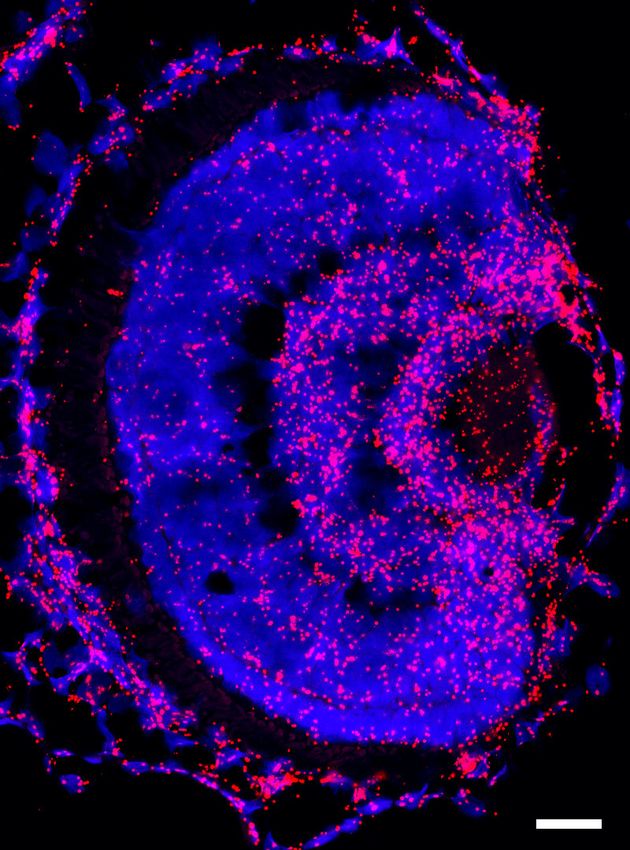
Research article                                                                      Immunology and Inflammation Neuroscience

                                       Even if we accept the hypothesis that microglia trogocytose the axonal compartment, many ques-
                                   tions remain. What impact does partial elimination of presynaptic structures have on circuit remodel-
                                   ing? It is unclear if this phenomenon is required for proper wiring of neuronal circuits. Does
                                   microglial trogocytosis of axons affect axon morphology? While disrupting microglial function enhan-
                                   ces axon tract outgrowth (Pont-Lezica et al., 2014; Squarzoni et al., 2014), it is unknown if this
                                   result is because of a disruption in microglial trogocytosis, or whether non-phagocytic mechanisms
                                   are in play. Is axonal trogocytosis by microglia mechanistically similar to complement-mediated syn-
                                   aptic pruning? There is extensive evidence demonstrating that the complement system regulates
                                   synaptic pruning by microglia via the complement protein C3 (Paolicelli et al., 2011; Schafer et al.,
                                   2012; Stevens et al., 2007). However, knockout (KO) mice lacking complement receptor type 3
                                   (CR3), the receptor for activated C3, do not exhibit a deficit in microglial trogocytosis
                                   (Weinhard et al., 2018), raising the possibility that microglial trogocytosis of axons is mechanistically
                                   distinct from complement-mediated synaptic pruning.
                                       In this study, we addressed these questions and directly observed in vivo trogocytosis of retinal
                                   ganglion cell (RGC) axons by individual microglial cells in real-time using the developing Xenopus
                                   laevis retinotectal circuit. We then developed an assay to monitor microglial trogocytosis of axons
                                   among the population of microglia in the optic tectum. To investigate the functional role of micro-
                                   glial trogocytosis, we depleted microglial cells and found that this enhanced axon arborization and
                                   reversed the behavioral responses to dark and bright looming stimuli. We identified amphibian regu-
                                   lator of complement activation 3 (aRCA3) (Oshiumi et al., 2009), a homolog of mammalian CD46,
                                   as an endogenously expressed, synapse-associated, complement inhibitory molecule in Xenopus lae-
                                   vis RGC neurons. Overexpression of aRCA3 inhibited trogocytosis and axonal pruning. Conversely,
                                   expression of a membrane-bound complement C3 fusion protein in RGCs enhanced axonal pruning.
                                   Our findings provide direct in vivo evidence supporting the hypothesis that microglia trogocytose
                                   presynaptic axonal elements and supports a model in which microglial trogocytosis regulates axonal
                                   pruning to promote proper neural wiring during development (Schafer et al., 2012;
                                   Weinhard et al., 2018). In this model, neurons exert local control of microglial trogocytosis and axo-
                                   nal pruning by expressing complement regulatory proteins.

                                   Results
                                   Microglia in Xenopus laevis tadpoles resemble neonatal mammalian
                                   microglia
                                   Microglia in albino Xenopus laevis tadpoles were labeled with IB4-isolectin conjugated fluorophores
                                   for in vivo imaging. IB4-isolectin binds the RET receptor tyrosine kinase on microglial cells
                                   (Boscia et al., 2013), but does not lead to production of tumor necrosis factor-a or alterations in
                                   microglial morphology (Grinberg et al., 2011). Injection of fluorophore conjugated IB4-isolectin into
                                   the third ventricle of Xenopus laevis tadpoles labels highly mobile cells (Figure 1A and Video 1A)
                                   that have both ameboid-like and primitive ramified-like morphologies, resembling the morphology
                                   of embryonic microglial cells. Ameboid microglia are round or irregular cells with filopodia and/or
                                   pseudopodia, while primitive ramified microglia have scantly developed, poorly branching processes
                                   (Dalmau et al., 1997; Dalmau et al., 1998). Interestingly, IB4-isolectin-labeled cells can be observed
                                   switching back and forth between ameboid-like and primitive ramified-like morphologies (Figure 1B
                                   and Video 1B), suggesting that microglial morphology during development may be more dynamic
                                   than previously thought. Microglial cell bodies in the adult brain demonstrate low mobility (migra-
                                   tion), while microglia in developing brain have highly mobile cell bodies (Smolders et al., 2019).
                                   Microglial mobility was determined to be 1.7 ± 0.3 mm/min (mean ± SD) (Figure 1C), comparable to
                                   what has been observed in neonatal rodent slice culture (1.4 mm/min at E15.5) (Smolders et al.,
                                   2017). To provide functional confirmation that IB4-isolectin-labeled cells are microglial cells, a laser
                                   irradiation injury was performed on the neuropil region. As expected of microglial cells, IB4-isolec-
                                   tin-labeled cells responded to injury by surrounding the damaged zone and removing injured tissue
                                   (Figure 1D and Video 2).
                                       In developing zebrafish larvae, microglia primarily localize to the cell body layer of the optic tec-
                                   tum and are largely excluded from the tectal neuropil (Svahn et al., 2013). Conversely, microglia in
                                   developing mammalian models are found in neuropil regions (Dalmau et al., 1997; Hoshiko et al.,

Lim and Ruthazer. eLife 2021;10:e62167. DOI: https://doi.org/10.7554/eLife.62167                                                     2 of 35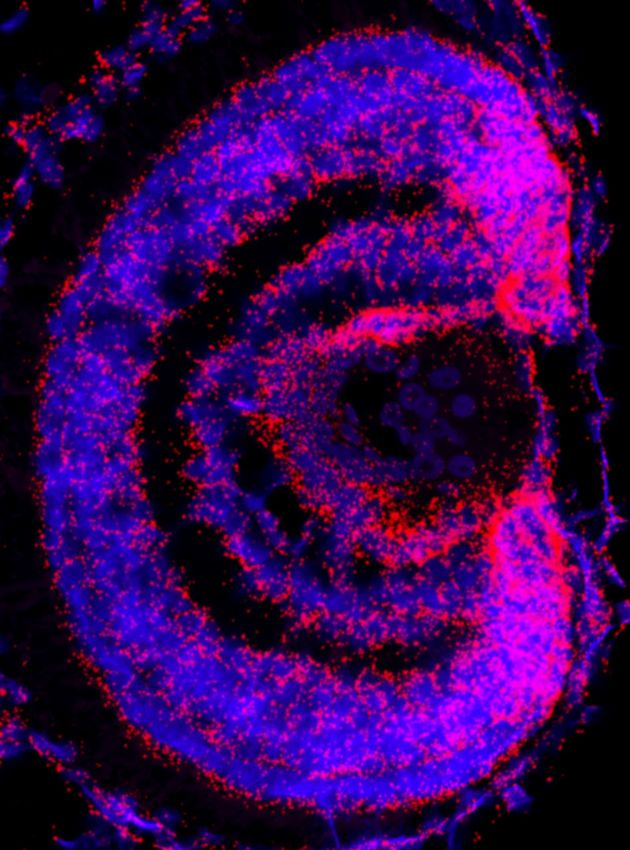
Research article                                                                                                                      Immunology and Inflammation Neuroscience

   A                            B        DPHERLGOLNH         SULPLWLYHUDPL¿HGOLNH    C                            40

                                    PLQ                    PLQ

                                                                                            Relative frequency (%)
                                                                                                                     30

                                                                                                                     20

                                                                                                                     10

                                                                                ȝP                                0
                                    IB4-isolectin                                                                         0     2          4
                                                                                                                              Mobility (Pm/min)
                                                                                                                                                    6

   D    -4h                         -2h                       0h                            +0.5h

                   Pre-injury                                          Laser lesion                                                 Migration
        +1h                         +2h                        +4h                          +6h

                                                                                            ȝP
               Phagocytosis                                                                                                         Clearance

Figure 1. IB4-isolectin-conjugated fluorophores label microglial cells in developing Xenopus laevis tadpoles. (A) The tadpole brain colorized for
identification (yellow = olfactory bulb and forebrain, green = optic tectum, blue = hindbrain). To label microglia, IB4-isolectin conjugated fluorophores
are injected into the 3rd ventricle (red). (B) Dynamic cells with both ameboid-like and primitive ramified-like morphologies are labeled by IB4-isolectin.
(C) The distribution in mobility of IB4-isolectin-labeled cells under normal conditions. Average velocity is 1.8 ± 0.5 mm/min (mean ± SD, n = 5). (D) Laser
irradiation injury of the neuropil and response by IB4-isolectin-labeled cells. Laser irradiation injury induced a region of damaged, autofluorescent,
tissue. IB4-isolectin-labeled cells mobilize to the injury site and remove the injured tissue by phagocytosis. IB4-isolectin-labeled cells are shown in red,
and eGFP-labeled RGC axons are shown in green.
The online version of this article includes the following source data for figure 1:
Source data 1. Microglia mobility measurements in Figure 1C.

                                      2012; Tremblay et al., 2010). In the Xenopus laevis retinotectal circuit, RGC axons project to the
                                      contralateral optic tectum, where they arborize and synapse on tectal neurons in the neuropil region
                                      (Figure 2A). To examine whether Xenopus microglia interact with the tectal neuropil, RGC axons
                                      innervating the neuropil were labeled by bulk electroporation with a plasmid encoding pH-stable
                                      green fluorescent protein (pHtdGFP). In vivo live imaging revealed that, microglia in developing Xen-
                                      opus laevis can be found in both the cell body layer and the neuropil region (Video 3A). Microglia
                                      move in and out of the neuropil region from the cell body layer (Figure 2B and Video 3B) and move
                                      freely through the neuropil (Figure 2C and Video 3B). Additionally, microglia extend processes into
                                      the neuropil to contact axons, with interactions ranging from minutes to hours in duration
                                      (Figure 2D and Video 3C).

                                      In vivo imaging of RGC neurons reveals microglial trogocytosis of axons
                                      and presynaptic structures
                                      We then sought to examine whether microglia cells engage in trogocytosis of RGC axons in the
                                      developing Xenopus laevis retinotectal circuit. As endosomal organelles are typically acidified
                                      (Casey et al., 2010), pH-stability of dyes and fluorescent proteins is an important consideration

Lim and Ruthazer. eLife 2021;10:e62167. DOI: https://doi.org/10.7554/eLife.62167                                                                                                   3 of 35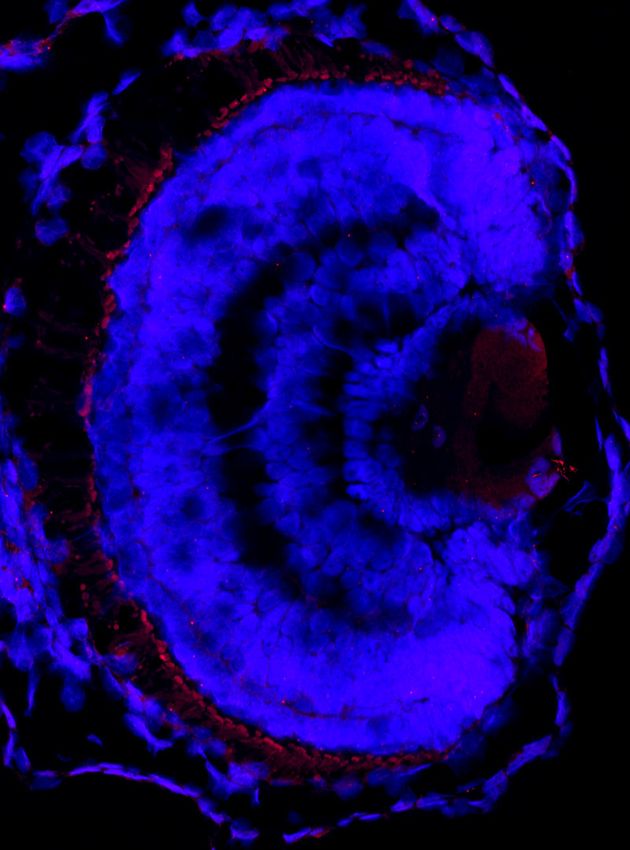
Research article                                                                        Immunology and Inflammation Neuroscience

                                                                                          when performing live imaging of trogocytosis
                                                                                          (Shinoda et al., 2018). To reduce quenching of
                                                                                          fluorescence, we used pHtdGFP (pKa = 4.8)
                                                                                          (Roberts et al., 2016) which is more pH-stable
                                                                                          than EGFP (pKa = 6.15). We expressed pHtdGFP
                                                                                          in RGC axons by electroporation in the eye and
                                                                                          labeled microglia with Alexa 594-conjugated IB4-
                                                                                          isolectin. Two-photon live imaging revealed that
                                                                                          the amount of green fluorescence associated
                                                                                          with individual microglial cells increased following
                                                                                          interactions with pHtdGFP-labeled axons. In the
                                                                                          example shown in Video 4A, a microglial cell
                                                                                          increases in green fluorescence by twofold fol-
                                                                                          lowing interaction with a pHtdGFP-labeled axon
                                                                                          (Figure 2—figure supplement 1A). Similarly, in
                                                                                          the example shown in Figure 2E and Video 4B,
                                                                                          the green fluorescence in the microglial cell
                                                                                          increased threefold following interaction with a
                                   Video 1. IB4-isolectin-labeled cells in Xenopus laevis pHtdGFP-labeled axon (Figure 2—figure supple-
                                   tadpoles are morphologically dynamic and highly
                                                                                          ment 1B). The real-time increase in microglial
                                   mobile. (A) IB4-isolectin cells are highly mobile.
                                                                                          green fluorescence suggests direct transfer of
                                   Timestamp = HH:MM. (B) IB4-isolectin labeled cells
                                   have a dynamic morphology, switching back and forth
                                                                                          fluorescent protein from the pHtdGFP-labeled
                                   between ameboid-like and primitive ramified-like       axon and provides direct in vivo evidence of
                                   morphologies.                                          microglial trogocytosis of the presynaptic RGC
                                   https://elifesciences.org/articles/62167#video1        axon.
                                                                                              Because microglia in developing Xenopus lae-
                                                                                          vis tadpoles are highly mobile, the possibility that
                                                                                          they may leave the imaging field complicates
                                   measuring trogocytosis of axons by individual microglia. To quantify microglial trogocytosis, we
                                   instead took the approach of measuring microglial green fluorescence across the population of
                                   microglia within the optic tectum. A greater number of pHtdGFP-labeled axons in the optic tectum
                                   is expected to lead to more frequent opportunities for trogocytotic interactions between microglia
                                                                                           and pHtdGFP-labeled axons, resulting in greater
                                                                                           amounts of green fluorescent material found
                                                                                           within the microglial population. Based on this
                                                                                           principle, we developed an assay to measure
                                                                                           microglial trogocytosis of RGC axons in Xenopus
                                                                                           laevis tadpoles. At developmental stage 39/40,
                                                                                           RGC axons were labeled by retinal electropora-
                                                                                           tion with plasmid encoding pHtdGFP, and micro-
                                                                                           glia were labeled by intraventricular injection of
                                                                                           Alexa 594-conjugated IB4-isolectin (Figure 3A).
                                                                                           By 2 days post-labeling, axons begin expressing
                                                                                           pHtdGFP and innervate the optic tectum. This
                                                                                           also corresponds to the period when microglia
                                                                                           begin to extensively colonize the optic tectum.
                                                                                           At day 4 and day 5 post-labeling, the optic tec-
                                                                                           tum was imaged by two-photon microscopy. The
                                                                                           number of pHtdGFP-labeled axons present in
                                                                                           the optic tectum was counted and the green
                                   Video 2. Response of IB4-isolectin-labeled cells to
                                                                                           fluorescence within the population of microglia
                                   injury. IB4-isolectin-labeled cells respond to tissue   in the imaging field was quantified using 3D
                                   injury by mobilization to the injury site and           masking      with    the    IB4-isolectin     channel
                                   phagocytosis of injured tissues. Also shown             (Figure  3B). To  control for the possibility of RGC
                                   in Figure 1D. Timestamp = HH:MM.                        apoptosis, data were excluded if axonal bleb-
                                   https://elifesciences.org/articles/62167#video2         bing was observed, or if the number of axons

Lim and Ruthazer. eLife 2021;10:e62167. DOI: https://doi.org/10.7554/eLife.62167                                                         4 of 35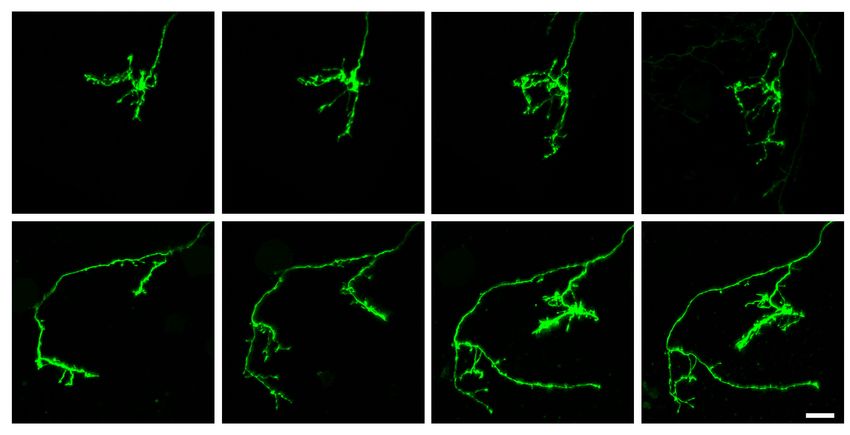
Research article                                                                             Immunology and Inflammation Neuroscience

     A                                     B                 Microglia enter the neuropil region
                                           0h              1h                    2h                   3h                   4h
    Retina                  Optic
                           7HFWXP

                                                                                                                           ȝP

                                           C                     Microglia surveil the neuropil
               Microglia
                                Retinal
                               Ganglion    0h              1h                    2h                   3h                   4h
                              Cell Axons
                              (Neuropil)

        Tectal Neurons
                                                                                                                           ȝP
       (Cell Body Layer)

     D                                     Microglia send processes into the neuropil
                                brief contacts                                                prolonged contacts

      0min                      12min              24min                    0min                  36min                  78min

                                                   ȝP                                                                 ȝP

     E                          5HDOWLPHLQFUHDVHLQPLFURJOLDOJUHHQÀXRUHVFHQFH
                                 following interaction with pHtdGFP-labeled axon
      -30min                                30min                           90min                              150min

      210min                                   270min                      330min                             390min

                                                                                                                                       ȝP

Figure 2. Microglia surveil the tectal neuropil, contact RGC axons, and increase in green fluorescence following an interaction with pHtdGFP-labeled
axons in real-time. (A) A diagram of the developing Xenopus laevis retinotectal circuit. (B) The tectal neuropil does not exclude microglia in Xenopus
laevis. The yellow dotted line indicates the border of the cell body layer and the neuropil region. Microglia (red) can be observed migrating in and out
Figure 2 continued on next page

Lim and Ruthazer. eLife 2021;10:e62167. DOI: https://doi.org/10.7554/eLife.62167                                                                  5 of 35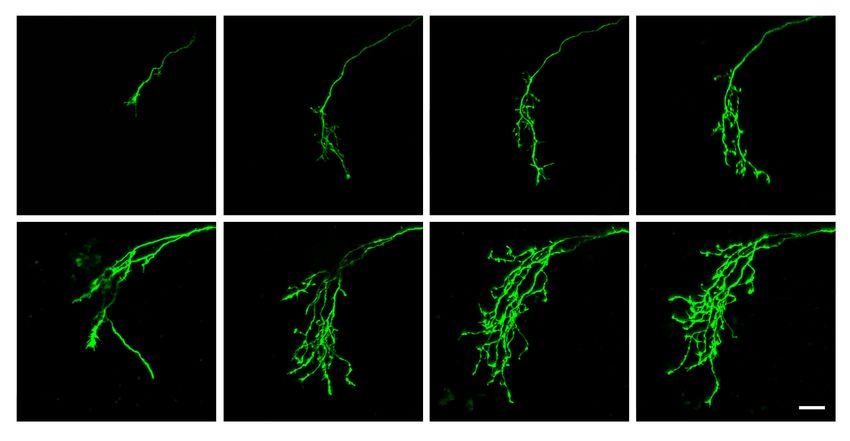
Research article                                                                              Immunology and Inflammation Neuroscience

Figure 2 continued
of the neuropil region from the cell body layer. A single registered optical section is shown. (C) Microglia surveil the neuropil. A microglial cell is
followed over time as it traversed different depths in the tectum. (D) Microglia extend processes (white arrows) into the neuropil. Contact duration
varied between minutes and hours. (E) A microglial cell (blue arrow) interacts with a pHtdGFP-labeled RGC axon and increases in green fluorescence in
real-time. The colocalization of green and red is colorized as white.
The online version of this article includes the following source data and figure supplement(s) for figure 2:
Figure supplement 1. Green fluorescence in microglial cells increases in real-time following interaction with pHtdGFP-labeled axons.
Figure supplement 1—source data 1. Fluorescence changes in microglial cells in time lapse imaging experiments from Figure 2—figure supplement
1.

                                     decreased from day 4 to day 5. Even when electroporation yields no labeled axons, some basal
                                     green fluorescence in microglial cells is still observed (Figure 3C and Figure 3—figure supplement
                                     1). This is because microglia have high levels of autofluorescent molecules such as lipofuscin, biliru-
                                     bin, and porphyrins (Mitchell et al., 2010). At day 4, there is a weak positive correlation between
                                     microglial green fluorescence and the number of pHtdGFP-labeled axons in the optic tectum, a rela-
                                     tionship which is significantly strengthened on day 5 (Figure 3D). The change in green fluorescence
                                     associated with microglia from day 4 to day 5 significantly correlates with the number of pHtdGFP-
                                     labeled axons in the optic tectum (Figure 3—figure supplement 2A) suggesting that microglial cells
                                     accumulate pHtdGFP from intact axons between day 4 and day 5 post-labeling.
                                        To determine if synaptic material is being trogocytosed by microglia, we generated a synapto-
                                     physin-pHtdGFP fusion protein (SYP-pHtdGFP). SYP is a presynaptic vesicle protein (Valtorta et al.,
                                     2004), and SYP fusion proteins are commonly used as synaptic vesicle markers (Nakata et al., 1998;
                                     Ruthazer et al., 2006). Expressing SYP-pHtdGFP in RGC neurons yielded axons with pHtdGFP
                                     puncta along the length of their terminal arbors (Figure 3E). When SYP-pHtdGFP is expressed in
                                     RGC axons, on day 4, no correlation is observed between microglial green fluorescence and the
                                     number of SYP-pHtdGFP-labeled axons in the
                                     optic tectum. However, by day 5, a correlation
                                     between microglial green fluorescence and the
                                     number of SYP-pHtdGFP-labeled axons is
                                     observed (Figure 3F). The change in microglial
                                     green fluorescence from day 4 to day 5 is pro-
                                     portionate to the number of SYP-pHtdGFP-
                                     labeled axons in the optic tectum (Figure 3—fig-
                                     ure supplement 2B), suggesting that microglial
                                     cells trogocytose and accumulate presynaptic
                                     elements from RGC axons over the period from
                                     day 4 to day 5.

                                     Depletion of microglial cells
                                     enhances RGC axon branching and
                                     reverses the profile of behavioral
                                     responses to dark and bright
                                     looming stimuli
                                     To assess the functional roles of microglial trogo-
                                     cytosis, we first depleted microglia using                 Video 3. Microglia surveil the tectal neuropil in
                                     PLX5622. PLX5622 is an inhibitor of colony stim-           developing Xenopus laevis. (A) Microglia associate with
                                     ulating factor one receptor (CSF1R), which is a            the tectal neuropil in Xenopus laevis. Timestamp = HH:
                                     tyrosine kinase receptor essential for microglia           MM. (B) The neuropil does not exclude microglia.
                                                                                                Microglia can mobilize into the neuropil region from
                                     survival (Elmore et al., 2014; Erblich et al.,
                                                                                                the cell body layer and can freely move through the
                                     2011). Animals reared in 10 mM PLX5622 had                 neuropil region. Timestamp = HH:MM. (C) Microglia
                                     significantly reduced microglia numbers in the             surveil the tectal neuropil by extending processes into
                                     optic tectum compared to vehicle-treated ani-              the neuropil from the cell body layer. Timestamp = HH:
                                     mals (Figure 4A and Figure 4B). Morphological              MM.
                                     analysis of surviving microglia also revealed a            https://elifesciences.org/articles/62167#video3

Lim and Ruthazer. eLife 2021;10:e62167. DOI: https://doi.org/10.7554/eLife.62167                                                                6 of 35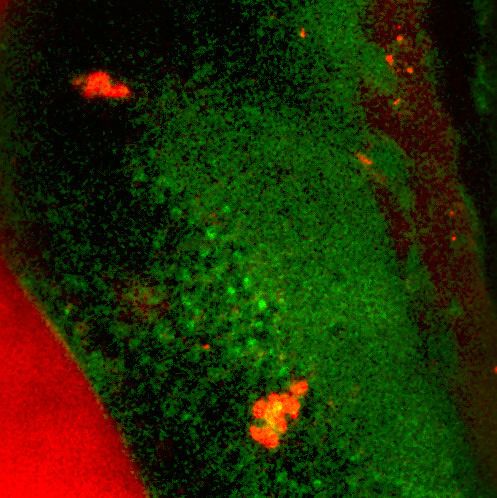
Research article                                                                        Immunology and Inflammation Neuroscience

                                                                                            reduction in the number of processes per micro-
                                                                                            glial cell, indicating a less ramified morphology
                                                                                            (Figure 4C).
                                                                                               Next, we interrogated the effect of microglial
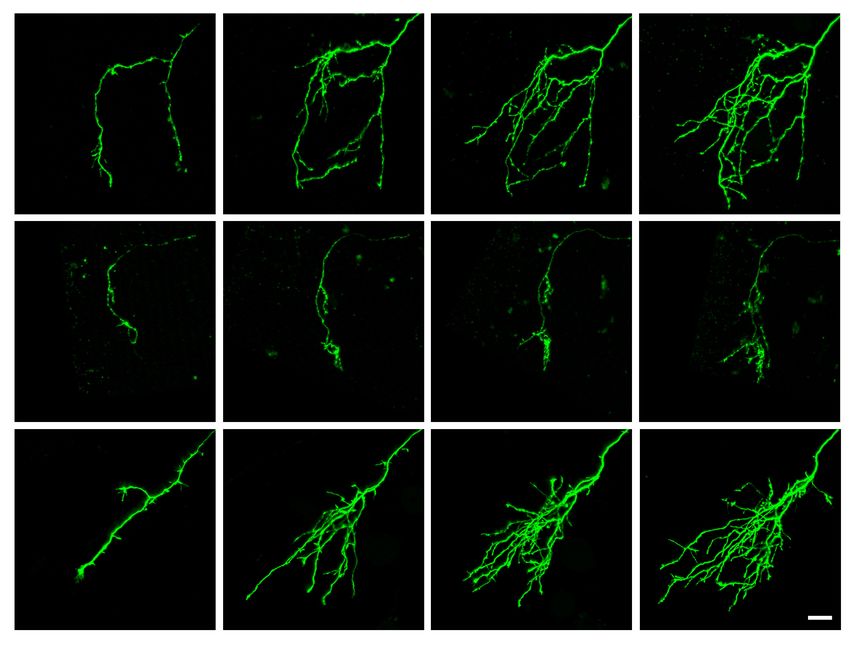
                                                                                            depletion on the morphology of single RGC
                                                                                            axons. Axons were followed for several days in
                                                                                            control      and     microglia-depleted     animals
                                                                                            (Figure 4D). Microglial depletion with PLX5622
                                                                                            did not affect axon arbor length (Figure 4E) but
                                                                                            significantly increased the number of axon
                                                                                            branches (Figure 4F), suggesting that microglia
                                                                                            negatively regulate axonal arborization during
                                                                                            development.
                                                                                               We then sought to delineate the functional
                                                                                            effects of microglial depletion on the develop-
                                                                                            ment of the retinotectal circuit. Previous reports
                                                                                            in Xenopus laevis and in zebrafish have shown
                                                                                            that the retinotectal circuit is a vital processing
                                   Video 4. In vivo real-time trogocytosis in Xenopus
                                   laevis tadpoles imaged by 2-photon microscopy. (A) A     and decision-making center for the visual detec-
                                   microglial cell increases in green fluorescence in real- tion of looming objects (Dong et al., 2009;
                                   time after an interaction with a pHtdGFP-labeled axon.   Khakhalin et al., 2014). Therefore, we devel-
                                   The colocalization of green and red is colorized as      oped a free-swimming looming stimulus assay in
                                   white. Timestamp = HH:MM. (B) Another example of a       Xenopus tadpoles (Figure 5A) to determine the
                                   microglial cell increasing in green fluorescence         functional outcomes of disrupting microglial
                                   following an interaction with a pHtdGFP-labeled axon.
                                                                                            function in this circuit. Tadpole behavioral
                                   This example is shown in Figure 2E. Timestamp = HH:
                                                                                            responses to dark looming stimuli or bright
                                   MM.
                                                                                            looming stimuli (Figure 5B) were recorded and
                                   https://elifesciences.org/articles/62167#video4
                                                                                            custom computer vision software was used to
                                                                                            track the locomotor response of the tadpole
                                                                                            (Figure 5C).
                                       Figure 5D shows contrails from representative animals in response to dark looming stimuli. In
                                   vehicle-treated animals, dark looming stimuli evoked stereotypical defensive escape behavior
                                   (Video 5A), whereas microglia-depleted animals were less likely to make defensive responses to
                                   dark looming stimuli (Video 5B). Presentation of dark looming stimuli elicited an increase in velocity
                                   in control animals (Figure 5E), with a peak in instantaneous velocity at 1.1 ± 0.1 s (mean ± SD, n = 8)
                                   post-stimulus. The distance traveled by control tadpoles over the 3 s immediately following presen-
                                   tation of a dark looming stimulus increased compared to the period before the stimulus was pre-
                                   sented (Figure 5F). This increase was absent in microglia-depleted animals. We categorized tadpole
                                   responses to looming stimuli as exhibiting defensive behavior, absence of defensive behavior or
                                   undeterminable (excluded from response rate calculation). Microglia-depletion significantly reduced
                                   the response rate to dark looming stimuli (Figure 5G).
                                       Figure 5H shows contrails from representative animals in response to bright looming
                                   stimuli. Surprisingly, bright looming stimuli rarely evoked defensive escape behavior in control ani-
                                   mals (Video 6A) but often evoked robust responses in microglia-depleted animals (Video 6B). Pre-
                                   sentation of bright looming stimuli elicited an increase in velocity in microglia-depleted animals
                                   (Figure 5I), with a peak in instantaneous velocity at 1.9 ± 0.6 s (mean ± SD, n = 8) after the onset of
                                   stimulus presentation. The distance traveled by microglia-depleted tadpoles over the 3 s immedi-
                                   ately following presentation of a bright looming stimulus increased compared to the period before
                                   the stimulus was presented (Figure 5J). This increase was absent in vehicle-treated animals. Further-
                                   more, microglia-depletion significantly increased the response rate to bright looming stimuli
                                   (Figure 5K).
                                       In trials where animals exhibited escape behavior to dark or bright looming stimuli, microglia
                                   depletion did not significantly alter escape distance, maximum escape velocity, or escape angle,
                                   suggesting that microglial depletion did not disrupt motor function (Figure 5—figure supplement
                                   1).

Lim and Ruthazer. eLife 2021;10:e62167. DOI: https://doi.org/10.7554/eLife.62167                                                        7 of 35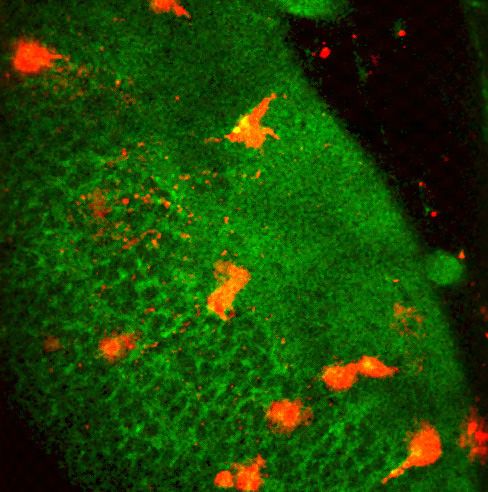
Research article Immunology and Inflammation Neuroscience
A Day 0 Day 1 Day 2 Day 3 Day 4 Day 5
Stage 39/40 Stage 46 Stage 47
Labeled axons innervate optic tectum
RGC electroporation Microglia colonize the optic tectum
with pHtdGFP and
labeling of microglia in vivo in vivo
with IB4-isolectin imaging imaging
B Data Aquisition: Average microglial
2-photon 830 nm 3D masks of microglia JUHHQÀXRUHVFHQFH
IB4-isolectin Alexa 594
pHtdGFP
ȝP
C D
100
Microglial green fluorescence
100 n=16 n=12 n=11 n=8 n = 47
ns *** ****
Microglial green fluorescence
***
80 80
(arbitrary unit)
(arbitrary unit)
60 60 Day 5
r = 0.52
p = 0.002
40 40
Day 4
r = 0.30
20 20 p = 0.038
Day 4 Day 5 Day 4 Day 5 Day 4 Day 5 Day 4 Day 5
0 0
No axons 1-4 axons 5-8 axons 9-12 axons 0 4 8 12
# pHtdGFP-labeled axons
# pHtdGFP-labeled axons
E F
IB4-isolectin Alexa 594 50
Microglial green fluorescence
n = 57
SYP-pHtdGFP
40
(arbitrary unit)
Day 5
r = 0.34
30 p = 0.010
20 Day 4
r = 0.063
p = 0.64
10
ȝP 0
0 4 8 12
# SYP-pHtdGFP labeled axons
Figure 3. Microglia accumulate green fluorescence label from axons expressing pHtdGFP or SYP-pHtdGFP. (A) Timeline of trogocytosis assay. Axons
were labeled with pH-stable GFP (pHtdGFP). 2-photon imaging was performed on day 4 and day 5 post-labeling. (B) Measurement of green
fluorescence signal from microglia. pHtdGFP-labeled axons (green) were imaged concurrently with microglia (magenta). 3D microglia ROIs were
automatically generated (magenta outlines). The average microglial green fluorescence was quantified from the population of microglia sampled in the
Figure 3 continued on next page
Lim and Ruthazer. eLife 2021;10:e62167. DOI: https://doi.org/10.7554/eLife.62167 8 of 35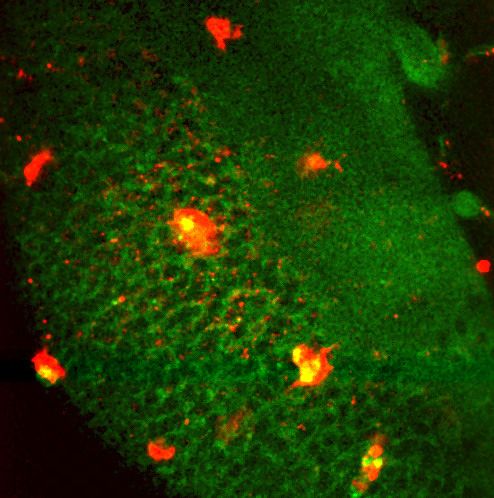
Research article                                                                            Immunology and Inflammation Neuroscience

Figure 3 continued
z-stack. (C) Presence of pHtdGFP-labeled axons in the optic tectum increases microglial green fluorescence between day 4 and day 5. Two-way RM
ANOVA interaction F(3,43) = 6.14, p=0.0014. Sidak’s multiple comparison test ***p
Research article Immunology and Inflammation Neuroscience
A Day 2 Day 3 Day 4 Day 5 B Vehicle (n=8)
10 PM PLX5622 (n=8) ****
50
****
Vehicle Control
40
****
# microglia
30
20
10
0
Day 2 Day 3 Day 4 Day 5
Days post-treatment
C 4 Vehicle (n=8)
ȝ03/;
*** 10 PM PLX5622 (n=8)
# of processes
3
2
1
0
Day 2 Day 3 Day 4 Day 5
BODIPY ȝP
ȝ
IB4-isolectin Alexa 594 Days post-treatment
D Day 2 Day 3 Day 4 Day 5 E 2000 ns
Vehicle (n=7)
10 PM PLX5622 (n=19)
Axon arbor length (Pm)
1500
Vehicle Control
1000
500
0
Day 2 Day 3 Day 4 Day 5
Days post-electroporation
F 150
*
Vehicle (n=7)
10 PM PLX5622 (n=19)
ȝ03/;
# of branches
100
50
0
ȝP Day 2 Day 3 Day 4 Day 5
pHtdGFP
Days post-electroporation
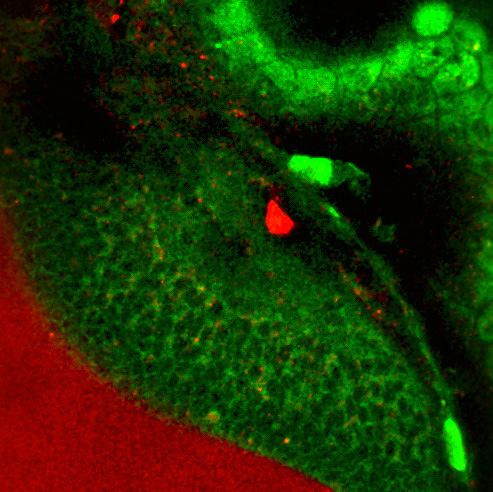
Figure 4. CSF1R antagonism depletes microglia from the optic tectum and increases axon arbor branch number. (A) Animals were treated with vehicle
or 10 mM PLX5622. Brain structures and microglia were labeled using CellTracker Green BODIPY (green) and IB4-isolectin (red), respectively. The white
dotted line indicates the border of the optic tectum. Single optical sections are shown. (B) PX5622 depletes microglia in the optic tectum. Mixed-effects
REML model interaction F(3,39) = 14.23, pResearch article Immunology and Inflammation Neuroscience
A Projector
(Lens removed)
Webcam B
Projector Large glass Dark looming stimulus
lens Paper bowl
screen
Time
V
3D printed Bright looming stimulus
lens mount
Tadpole
3D printed Petri dish Time
V
stage
C 0s +1 s V +3 s
Dark looming stimuli Bright looming stimuli
D H
Vehicle Control ȝ03/; Vehicle Control ȝ03/;
E I
F G J K
Figure 5. Microglial depletion reverses the expected behavioral response to both dark and bright looming stimuli. (A) Schematic of a looming
behavioral task to assess visuomotor responses in Xenopus laevis tadpoles. Stage 47 animals were presented looming stimuli and free-swimming
escape responses were recorded. (B) Exponentially expanding dark and bright circles were presented as looming stimuli. (C) Representative response
to dark looming stimulus (presented at 0 s) in a vehicle-treated animal. A contrail is drawn from 0 to 2 s post-stimulus. (D) Representative contrails of
Figure 5 continued on next page
Lim and Ruthazer. eLife 2021;10:e62167. DOI: https://doi.org/10.7554/eLife.62167 11 of 35Research article Immunology and Inflammation Neuroscience Figure 5 continued the escape responses to dark looming stimuli in a single animal (10 trials). (E) After the dark looming stimulus is presented (0 s), vehicle-treated animals (blue) increase in velocity, whereas microglia-depleted animals (red) do not. n = 8. Data are shown as mean ± SEM. (F) Presentation of dark looming stimuli increases distance traveled over 3 s in vehicle-treated animals (blue) but not microglia-depleted animals (red). 2-way RM ANOVA interaction F (1,14) = 15.82, p=0.0014. Sidak’s multiple comparisons test ****p
Research article                                                                        Immunology and Inflammation Neuroscience

                                       While CD46 is best known for its ability to
                                   inactivate complement C3 and complement C4,
                                   CD46 can also signal through intracellular tyro-
                                   sine kinase activity under certain conditions
                                   (Riley-Vargas et al., 2004). This raises the poten-
                                   tial caveat that the increased axonal arborization
                                   induced by overexpression of aRCA3 may result
                                   from aberrant intracellular signaling. Using a bio-
                                   informatic     tool,    NetPhos3.1     with   cutoff
                                   scores > 0.6 (Blom et al., 2004), we did not find
                                   a predicted tyrosine kinase phosphorylation site
                                   on the cytoplasmic region of aRCA3. Nonethe-
                                   less, it is possible that aRCA3 may exert some of
                                   its effects through an intracellular signaling path-
                                                                                          Video 6. Representative responses to bright looming
                                   way. To provide further functional validation that
                                                                                          stimuli in control and microglia-depleted animals. (A)
                                   the complement system affects axonal arboriza-
                                                                                          Representative response to bright looming stimuli in a
                                   tion, we examined the effects of enhancing com-
                                                                                          vehicle control animal. (B) Representative response to
                                   plement activity on axon morphology.                   bright looming stimuli in a microglia-depleted animal.
                                                                                          https://elifesciences.org/articles/62167#video6
                                   Expression of a membrane-bound
                                   complement C3 fusion protein
                                   reduces RGC axon size and
                                   branching
                                   If aRCA3 affects axon morphology by inhibiting complement activity, enhancing complement activity
                                   on single axons should produce effects opposite to that of aRCA3 overexpression. To explore this
                                   possibility, we designed an axon surface-localized complement C3 fusion protein to enhance com-
                                   plement activity on individual axons (Figure 8A). Synaptobrevin, also known as vesicle-associated
                                   membrane protein 2 (VAMP2), is concentrated in synaptic vesicles, though a significant fraction of
                                   VAMP2 is also present on the axon surface (Ahmari et al., 2000; Sankaranarayanan and Ryan,
                                   2000). We cloned Xenopus laevis complement C3 and fused the N-terminus to the extracellular
                                   C-terminus of Xenopus laevis VAMP2. This design was chosen in favor of a GPI anchor design that
                                   modifies the C-terminus C345C domain of complement C3 as this domain undergoes major rear-
                                   rangement during activation and proteolysis (32˚ rotation, 10 Å translation) (Janssen et al., 2005). In
                                   contrast, the N-terminus of complement C3 is exposed on the surface of the protein and located on
                                   the MG1 domain, a domain that does not undergo marked confirmational changes upon comple-
                                   ment C3 activation and proteolysis (3˚ rotation, 1 Å translation). Thus, expression of VAMP2-C3 in
                                   RGC neurons results in axons tagged with extracellular membrane-bound complement C3. While we
                                   used complement C3 precursor to generate the VAMP2-C3 fusion protein, complement C3 under-
                                   goes spontaneous, low-level activation through the alternative complement pathway
                                   (Pangburn et al., 1981).
                                       VAMP2-C3 was co-expressed with pHtdGFP in RGC neurons, and axons were monitored over
                                   several days (Figure 8B). To control for the possibility that VAMP2 overexpression may affect axon
                                   morphology, we also overexpressed VAMP2 alone in RGC axons. Expression of VAMP2-C3 in RGC
                                   axons significantly reduced axon arbor length and axon branch number when compared to control
                                   or VAMP2 overexpression (Figure 8C and Figure 8D), demonstrating that enhancing complement
                                   activity negatively regulates axonal arborization.

                                   Discussion
                                   In vivo evidence of microglial trogocytosis of axons during healthy
                                   development
                                   Previous real-time imaging experiments in ex vivo slice culture have shown that microglia trogocy-
                                   tose presynaptic elements (Weinhard et al., 2018). Our real-time imaging results now add in vivo
                                   support to the hypothesis that microglia engulf synaptic material via trogocytosis. Additionally, label-
                                   ing of axons with pHtdGFP or SYP-pHtdGFP resulted in an increase in fluorescent label within

Lim and Ruthazer. eLife 2021;10:e62167. DOI: https://doi.org/10.7554/eLife.62167                                                            13 of 35
Research article Immunology and Inflammation Neuroscience
A THY1
B
FCGR2A
CD14
CD33
Microglia
Vascular cells
Oligodendrocytes
CD81 CD19
ICAM1 ICAM2
Oligodendrocyte
ITGAM progenitor cells
CR2 ITGB2
Astrocytes
Excitatory neurons
C3AR1
Inhibitory neurons
CD59
CFHR5
CD46 CR1
C3 C5AR1
CFHR1 CD97
CD55 Expression
7ULPPHGPHDQ
CFI
C4A
C4B
CFHR4
10
10
CFH
CFB
C2
88
CFHR3 CFD 66
44
C5AR2
22
00
= SMART Protein Domains: SM00032 Log (CPM+1)
Domain abundant in Complement Control Proteins 2
C CD46 (human)
Non-cytoplasmic
CCP CCP CCP CCP
Cytoplasmic
0 100 200 300
LOC108708165 - aRCA3 (Xenopus laevis)
Non-cytoplasmic
CCP CCP CCP CCP CCP CCP CCP CCP
Cytoplasmic
0 100 200 300 400 500
C3
CD46
CD55
CFH
CFB
CR1
CR2
CFHR1
CFHR3
CFHR4
CFHR5
CCP = Complement Control = Transmembrane region
Protein modules
D DapB Polr2a.L aRCA3 E
Lens
GCL
IPL
INL
ONL
ȝP ȝP
Figure 6. Identification of a neuronally expressed membrane-bound complement inhibitory protein, amphibian regulator of complement activation 3
(aRCA3), the predicted homolog of human CD46. (A) Complement C3 was queried on the STRING Protein-Protein Association Network and the top 30
Figure 6 continued on next page
Lim and Ruthazer. eLife 2021;10:e62167. DOI: https://doi.org/10.7554/eLife.62167 14 of 35Research article Immunology and Inflammation Neuroscience
Figure 6 continued
interaction partners are displayed. Red nodes represent proteins which contain complement control domains that inhibit complement activity. Line
thickness indicates the strength of data supporting protein interaction. (B) Complement inhibitory proteins identified by STRING were screened for
neuronal expression in the Allen Brain Map human cortical transcriptomics dataset. Cell type taxonomy and hierarchical clustering was determined
according to previous analysis (Hodge et al., 2019). Only CD46 is highly expressed by neurons. Heat map color scale denotes log two expression
levels as represented by trimmed mean (25–75%). CPM = counts per million. (C) Protein architecture of CD46 and the most similar Xenopus laevis
homolog (aRCA3). Both human CD46 and Xenopus laevis aRCA3 are type I transmembrane proteins, with a non-cytoplasmic region that contains many
complement control protein modules, and a transmembrane anchor near the C-terminus. (D) Fluorescent RNAscope in situ hybridization on retina
sections shows that aRCA3 is endogenously expressed in the retina. Negative control probe DapB was not detected in the retina. Housekeeping gene
Polr2a.L was expressed ubiquitously. (E) High magnification of the highlighted region in Figure 5D. aRCA3 is highly expressed in the GCL, and is
present at lower levels in the INL and ONL. GCL = Ganglion Cell Layer; IPL = Inner Plexiform Layer; INL = Inner Nuclear Layer; ONL = Outer Nuclear
Layer.
The online version of this article includes the following source data for figure 6:
Source data 1. Human cell type expression profiles from the Allen Human Brain database for probable complement inhibitory proteins identified by
STRING.
microglia between days 4 and 5 post-labeling. As SYP-pHtdGFP is primarily localized to synaptic
vesicles, this suggests that the axonal material that microglia engulf contains presynaptic vesicles
and is consistent with correlative electron microscopy studies that have demonstrated putative pre-
synaptic vesicles within microglia (Weinhard et al., 2018), although we did not use correlative elec-
tron microscopy to confirm this in our study.
Numerous past studies have shown that during development microglia have synaptic components
within phagocytic compartments (Paolicelli et al., 2011; Schafer et al., 2012; Stevens et al., 2007;
Tremblay et al., 2010). However, apoptosis is a prominent feature of neural development
(Nijhawan et al., 2000), and it is unclear whether the source of synaptic material within microglia is
because of engulfment of apoptotic neuronal components or if it is due to engulfment of synaptic
material from live neurons. When investigating trogocytosis, we minimized the effect of apoptosis by
excluding measurements when the number of axons between imaging sessions decreased or when
axonal blebbing was observed, providing in vivo direct evidence that microglia accumulate fluores-
cent label from living axons.
Expression of complement inhibitory or complement enhancing
molecules in neurons regulates axon morphology and trogocytosis by
microglia
Activation of complement C3 exposes a reactive thioester bond that covalently attaches to amine or
carbohydrate groups on cell surfaces (Sahu et al., 1994). Microglia express CR3, a receptor for com-
plement C3 (Ling et al., 1990), and binding of CR3 to its ligand induces phagocytosis
(Newman et al., 1985). Complement C3 localizes to synapses during development and tags synap-
ses for removal by microglia (Stevens et al., 2007). The importance of complement C3 in synaptic
pruning has been studied by disrupting the C3 pathway using C3 KO mice (Stevens et al., 2007),
CR3 KO mice (Schafer et al., 2012), or recently, with the exogenous neuronal expression of the
complement inhibitory proteins Crry (Werneburg et al., 2020) and CD55 (Wang et al., 2020). Here
we show that enhancing the C3 pathway with a membrane-bound VAMP2-C3 fusion protein
increases axonal pruning at the single axon level. Conversely, overexpression of an endogenous
Table 1. Top three most similar proteins to human CD46 in the Xenopus laevis genome.
Protein name Query coverage Percent identity E-value
41
1 Amphibian Regulator of Complement Activation 3 (aRCA3) 64% 34.77% three 10
35
2 Complement Receptor Type 2 70% 31.77% four 10
35
3 Complement Component 4 Binding Protein 76% 31.17% four 10
Lim and Ruthazer. eLife 2021;10:e62167. DOI: https://doi.org/10.7554/eLife.62167 15 of 35Research article Immunology and Inflammation Neuroscience
membrane-bound complement inhibitory mole-
cule inhibits axonal pruning and trogocytosis
(Figure 9A).
While VAMP2-C3 clearly produced effects on
axon morphology, we did not rule out the possi-
bility that the expression of VAMP2-C3 in RGC
neurons may be producing effects on axons that
are not mediated by the complement system.
Additionally, we were unable to determine
whether VAMP2-C3 expression enhanced micro-
glial trogocytosis as electroporation of RGC neu-
Video 7. Predicted tertiary protein structure of CD46
rons with VAMP2-C3 rarely yielded labeled
and aRCA3. (A) The predicted tertiary protein structure
axons. We speculate that expression of VAMP2-
of CD46. (B) The predicted tertiary protein structure of
aRCA3. C3 in RGC neurons reduces viability, as previous
https://elifesciences.org/articles/62167#video7 studies have shown that the complement cas-
cade mediates phagocytosis of RGC neurons
during development (Anderson et al., 2019).
Furthermore, our study indirectly examined the
effects of VAMP2-C3 and aRCA3 on microglial trogocytosis. Future experiments could directly
examine the effects of VAMP2-C3 expression and aRCA3 overexpression on trogocytosis rates by
real-time imaging.
It is hypothesized that neurons endogenously express membrane-bound complement inhibitory
molecules to protect synapses from phagocytosis (Stephan et al., 2012; Stevens et al., 2007), and
our data support this hypothesis. Recently, sushi repeat protein X-linked 2 (SRPX2) has been identi-
fied as a endogenous neuronal complement inhibitor in the mammalian system which protects syn-
apses from complement C1 tagging (Cong et al., 2020). SRPX2 is a secreted protein, and while
secreted complement inhibitory molecules can act via cell-autonomous mechanisms to protect the
neuron that produced it, such molecules also have non-autonomous actions due to the ability to dif-
fuse through the extracellular environment. Conversely, a membrane-bound complement inhibitory
molecule acts solely through cell-autonomous mechanisms and allows for greater spatiotemporal
control of local complement protection. While the identity of a membrane-bound complement inhib-
itory molecule endogenous to mammalian neurons remains elusive, in this study we characterized
Xenopus laevis aRCA3, an endogenously expressed, synaptic vesicle-associated, complement inhibi-
tory molecule. aRCA3 is the most similar amphibian homolog of human CD46. CD46 is a membrane-
bound complement inhibitory molecule that cleaves activated complement C3 and C4 (Barilla-
LaBarca et al., 2002). Using the Allen Brain Institute human multiple cortical areas RNA-seq dataset
(Allen Institute for Brain Science, 2015), we report that CD46 transcripts are enriched in human
neurons. Interestingly, CD46 associates directly with b1-integrins (Lozahic et al., 2000), an adhesion
molecule present on neuronal surfaces (Neugebauer and Reichardt, 1991) and enriched in synapto-
somes (Chan et al., 2003), suggesting that it too may be localized to axon surfaces and synapses. In
our study, we show that aRCA3 expression inhibits both axon trogocytosis by microglia and axonal
pruning—we speculate that CD46 may perform similar functions in mammals. Excessive synaptic
pruning is thought to be one of the underlying causes of schizophrenia (Sellgren et al., 2019), and
three large-scale genetic susceptibility studies have identified the CD46 gene as a significant Schizo-
phrenia-risk locus (Håvik et al., 2011; Kim et al., 2020; Ripke et al., 2014). Clearly, the role of
CD46 in neurodevelopment warrants further study.
Microglia actively suppress exuberant arborization at the single axon
level
Disrupting microglial function by depletion increases axon tract innervation in prenatal models
(Pont-Lezica et al., 2014; Squarzoni et al., 2014). As depleting microglia increases the number of
neural progenitor cells (Cunningham et al., 2013) and the number of RGC neurons in the embryonic
retina (Anderson et al., 2019), it was unclear whether the increased axon tract innervation that
occurs following microglial depletion resulted from a deficit of microglial-mediated axonal pruning,
or whether it was because of an increase in the overall number of axons. To address this, we exam-
ined the effect of microglial depletion on the morphology of single axons, showing that microglia
Lim and Ruthazer. eLife 2021;10:e62167. DOI: https://doi.org/10.7554/eLife.62167 16 of 35Research article Immunology and Inflammation Neuroscience
A B SYP-pHtdGFP D5&$P&KHUU\ 0HUJH C
255
6Research article Immunology and Inflammation Neuroscience Figure 7 continued comparison test *p
Research article                                                                               Immunology and Inflammation Neuroscience

   A                                                     Normal axonal pruning

     Impaired axonal pruning                                                                              Excessive axonal pruning

                                                 -        Complement activity
                                                                                            +

   B                       Normal development                                                 Microglial depletion
                                                                                                                           Impaired
                                                    Microglial-mediated                                               microglial-mediated
                                                      axonal pruning                                                    axonal pruning

                                                      Reduced axonal                                                    Increased axonal
                                                       arborization                                                       arborization

     Microglia                                       Appropriate wiring                                               Inappropriate wiring

                                                         Appropriate                                                      Inappropriate
                                                          behaviour                                                         behaviour

Figure 9. The complement system and microglia regulate axonal pruning at the single axon level. (A) Inhibiting complement activity through
overexpression of a membrane-bound complement inhibitory molecule results in impaired axonal pruning; conversely, increasing complement activity
through expression of a membrane-bound complement enhancing molecule results in excessive axonal pruning. (B) During normal development,
microglia actively trogocytose and prune axons. Disrupting microglial function via microglial depletion increases axonal arborization and also disrupts
the proper response to dark and bright looming stimuli.

                                     suppresses both axon branching and axon growth through the removal of extra branches and axonal
                                     material. While this explanation is at odds with the observation that microglia-depletion did not
                                     increase axon arbor length, it is important to note that with aRCA3 overexpression, a single axon
                                     gains a relative growth advantage over other axons—this is distinct from the case of microglial
                                     depletion, where all axons profit from the same increased growth. If all axons are growing larger at
                                     the same pace, competitive mechanisms (Gosse et al., 2008; Ruthazer et al., 2003) might be
                                     expected to constrain axon arbor sizes. Another interesting possibility is that microglia preferentially
                                     engage in trogocytosis at short, dynamic branches over longer, established, mature branches. In this
                                     case, microglial depletion results in a greater number of short branches, which over the short time
                                     course in this study, do not significantly impact axon branch length.
                                        It is worth considering that there may be unintended side-effects of microglial depletion with
                                     PLX5622 and that many microglial functions beyond trogocytosis of axons may be altered. In our

Lim and Ruthazer. eLife 2021;10:e62167. DOI: https://doi.org/10.7554/eLife.62167                                                                19 of 35
Research article Immunology and Inflammation Neuroscience
study, we found that CSF1R inhibition reduced process branching of remaining microglial cells, an
observation that has also been seen in rodents (Elmore et al., 2014). Decreased microglial process
complexity often accompanies release of cytokines and other neuromodulatory molecules
(Karperien et al., 2013; Hanisch, 2002). While we did not study the effect of microglial depletion
on cytokine and chemokine production in this study, past studies have shown that cytokines and che-
mokines in non-disease mouse models are not altered by PLX5622 (Reshef et al., 2017). A further
potential confound is that low expression of CSF1R has been reported in some neurons in mice hip-
pocampus (Luo et al., 2013). It is possible that CSF1R is present in Xenopus laevis RGC neurons and
we did not exclude the possibility that PLX5622 may be acting directly on RGC axons in our study.
Microglia contribute to proper wiring of the retinotectal circuit in
developing Xenopus laevis
A feed-forward network drives visually evoked escape behavior in Xenopus tadpoles
(Khakhalin et al., 2014). In the retina, photoreceptors act on bipolar cells, which act on RGCs. Some
RGCs are tuned to detect looming (Dunn et al., 2016; Münch et al., 2009), and the population of
RGCs that respond to dark looming stimuli are distinct from the population of RGCs that respond to
bright looming stimuli (Temizer et al., 2015). In zebrafish, these distinct RGC populations project to
different arborization fields in the optic tectum (Robles et al., 2014; Temizer et al., 2015) where
the execution of looming computation and behavioral decision-making occurs (Barker and Baier,
2015; Fotowat and Gabbiani, 2011). In highly predated animals such as crabs, zebrafish, and mice
(Oliva et al., 2007; Temizer et al., 2015; Yilmaz and Meister, 2013), dark looming stimuli—which
signal imminent threat such as an oncoming object or predator—reliably induce escape responses,
whereas bright looming stimuli—which may occur as the animal exits a tunnel or traverses its envi-
ronment—are less effective.
Microglial depletion does not appear to alter motor functionality, suggesting that the hindbrain
and motor circuitry remain intact. Instead, the effects of microglia depletion on looming-evoked
escape behavior must occur further upstream in the retina, the optic tectum, or in the projections
from the tectal neurons to the hindbrain. As microglia depletion induces exuberant RGC axonal
arborization, one explanation for why microglia depletion disrupts defensive behavior to dark loom-
ing stimuli is that the dark looming-sensitive RGC axons cannot effectively wire with their tectal neu-
ron counterparts, resulting in a misclassification of threatening visual stimuli when axonal pruning is
disrupted. When microglia are depleted, axons form more errant connections, and dark looming-
sensitive RGC axons may instead wire together with tectal neurons which are not associated with
threat classification, reducing the probability that dark looming stimuli elicit escape responses. We
predict that the reverse is true for bright looming-sensitive RGC axons, whereby microglia depletion
results in increased likelihood of errant wiring between bright looming RGC axons and tectal neu-
rons that classify threatening visual stimuli, leading to enhancement of escape behavior to bright
looming stimuli. Conversely, it is possible that dark and bright looming-sensitive RGC axons are dif-
ferentially affected by microglial depletion or the circuitry of the retina upstream of RGCs is remod-
eled following microglial depletion, both of which could produce the abnormal behavioral outcomes
we observed. Indeed, the mechanism linking microglial depletion to improper response to looming
stimuli is unclear and warrants future investigation.
Synaptic pruning and trogocytosis are two sides of the same coin:
axonal pruning
Classically, synaptic pruning has been described as the engulfment and elimination of synapses, a
phenomenon dependent on the complement pathway (Paolicelli et al., 2011; Perry and O’Connor,
2008; Schafer et al., 2012; Stevens et al., 2007). While no deficit in microglial trogocytosis has
been observed in ex vivo cultures from CR3 KO mice (Weinhard et al., 2018), one interpretation for
this result is that synaptic pruning and trogocytosis are unique phenomena mediated by different
mechanisms. However, our study suggests that complement-mediated synaptic pruning and trogo-
cytosis are mechanistically related. We find that the complement system influences both axonal tro-
gocytosis and axonal arborization, and it is possible that in CR3 KO mice, compensation through
one of the other receptors for activated C3 occurs. For example, microglia express complement
receptor type 4 (CR4) (Allen Institute for Brain Science, 2015; Hodge et al., 2019) which can bind
Lim and Ruthazer. eLife 2021;10:e62167. DOI: https://doi.org/10.7554/eLife.62167 20 of 35Research article Immunology and Inflammation Neuroscience
activated complement C3 to induce phagocytosis (Ross et al., 1992). Our data supports the hypoth-
esis that neurons control microglial-mediated circuit remodeling through the expression of endoge-
nous membrane-bound complement inhibitory molecules to regulate microglial trogocytosis.
Materials and methods
Key resources table
Reagent type
(species) or
resource Designation Source or reference Identifiers Additional information
Gene (Xenopus aRCA3 NCBI NCBI:XM_018246573.1
laevis)
Gene (Xenopus VAMP2 Xenbase Xenbase:vamp2.S
laevis)
Gene (Xenopus C3 Xenbase Xenbase:c3.L
laevis)
Strain, strain DH5a competent cells Invitrogen Cat#:18265017
background
(Escherichia coli)
Biological sample Albino Xenopus laevis tadpoles Nasco RRID:XEP_Xla200
(Xenopus laevis)
Recombinant DNA pEGFP-N1 Clontech Cat#: 6085–1
reagent
Recombinant DNA pFA6a pH-tdGFP PMID:27324986 RRID:Addgene_74322
reagent
Recombinant DNA pEF1a P2A-pHtdGFP This paper Available from Edward
reagent Ruthazer upon request
Recombinant DNA SYP-GFP plasmid PMID:16571768
reagent
Recombinant DNA pEF1a SYP-pHtdGFP This paper Available from Edward
reagent Ruthazer upon request
Recombinant DNA pEF1a aRCA3-Myc-P2A-pHtdGFP This paper Available from Edward
reagent Ruthazer upon request
Recombinant DNA pEF1a aRCA3-mCherry-Myc- This paper Available from Edward
reagent P2A-SYP-pHtdGFP Ruthazer upon request
Recombinant DNA pEF1a pHtdGFP-P2A-VAMP2 This paper Available from Edward
reagent Ruthazer upon request
Recombinant DNA pEF1a pHtdGFP- This paper Available from Edward
reagent P2A-Myc-VAMP2-C3 Ruthazer upon request
Sequenced-based RNAscope Probe Advanced Cell Diagnostics RNAscope probe: Xl-polr2aL
reagent against Xenopus laevis
polr2a.L
Sequenced-based RNAscope Probe Advanced Cell Diagnostics RNAscope probe: Xl-LOC108708165
reagent against Xenopus laevis
aRCA3
Commercial assay RNAscope Multiplex Advanced Cell Diagnostics Cat#:323136
or kit Fluorescent Reagent Kit v2
Chemical PLX5622 Plexxikon N/A
compound, drug
Chemical Polyethylene glycol 400 Sigma SKU:P3265
compound, drug
Chemical Poloxamer 407 Sigma SKU:16758
compound, drug
Chemical D-a-Tocopherol polyethylene Sigma SKU:57668
compound, drug glycol 1000 succinate
Continued on next page
Lim and Ruthazer. eLife 2021;10:e62167. DOI: https://doi.org/10.7554/eLife.62167 21 of 35Research article Immunology and Inflammation Neuroscience
Continued
Reagent type
(species) or
resource Designation Source or reference Identifiers Additional information
Chemical Isolectin GS-IB4 From Thermo Fisher Scientific Cat#:I21413
compound, drug Griffonia simplicifolia,
Alexa Fluor 594 Conjugate
Chemical CellTracker Thermo Fisher Scientific Cat#:C2102
compound, drug Green BODIPY
Software, algorithm STRING v11.0 protein- PMID:30476243 RRID:SCR_005223
protein association networks
Software, algorithm SMART protein domain PMID:29040681 RRID:SCR_005026
annotation resource 8.0
Software, algorithm Phobius transmembrane PMID:17483518 RRID:SCR_015643
topology tool
Software, algorithm PyMOL 2.4 Schrödinger, LLC. RRID:SCR_000305 Schrödinger, LLC, 2020
Software, algorithm trRosetta PMID:31896580
Software, algorithm ProBLM PMID:25126110
Software, algorithm NetPhos 3.1 PMID:15174133 RRID:SCR_017975
Software, algorithm R 4.0.0 R Core Team RRID:SCR_001905
Software, algorithm RColorBrewer Erich Neuwirth RRID:SCR_016697
Software, algorithm ComplexHeatmap PMID:27207943 RRID:SCR_017270
Software, algorithm Bioconductor 3.11 PMID:25633503 RRID:SCR_006442
Software, algorithm Serial Cloner 2.6.1 SerialBasics RRID:SCR_014513
Software, algorithm Imaris 6 Oxford Instruments RRID:SCR_007370
Software, algorithm Fluoview 5.0 Olympus RRID:SCR_014215
Software, algorithm ThorImage LS Thorlabs
Software, algorithm Leica LAS X Leica RRID:SCR_013673
Software, algorithm FIJI ImageJ PMID:22743772 RRID:SCR_002285 Schindelin et al., 2012
Software, algorithm 3D Objects Counter plugin PMID:17210054 RRID:SCR_017066
Software, algorithm 3D ROI Manager plugin PMID:23681123 RRID:SCR_017065
Software, algorithm TrackMate plugin PMID:27713081
Software, algorithm Descriptor-based PMID:20508634
series registration
plugin
Software, algorithm 3D hybrid median Christopher Philip
filter plugin Mauer and Vytas Bindokas
Software, algorithm ScatterJ plugin PMID:25515182
Software, algorithm MATLAB MathWorks RRID:SCR_001622
Software, algorithm CANDLE PMID:22341767
Software, algorithm Graphpad Prism 9 GraphPad RRID:SCR_002798
Software
Software, algorithm Fisher r-to-z VassarStats RRID:SCR_010263
transformation
calculator
Software, algorithm Cura 4 Ultimaker RRID:SCR_018898
Software, algorithm TinkerCAD Autodesk
Software, algorithm Psychopy 3.0 PMID:30734206 RRID:SCR_006571
Continued on next page
Lim and Ruthazer. eLife 2021;10:e62167. DOI: https://doi.org/10.7554/eLife.62167 22 of 35Research article Immunology and Inflammation Neuroscience
Continued
Reagent type
(species) or
resource Designation Source or reference Identifiers Additional information
Software, algorithm XenLoom (beta): This paper github.com/
Looming Stimulus tonykylim/
Presentation and XenLoom_beta;
Tracking of Lim, 2021;
Xenopus laevis copy archived at
tadpoles swh:1:rev:b487791d
1d91a5950eeb
fd1e7640e
0c3db761cf5
Other Allen Brain Map Human Allen Institute
Multiple Cortical Areas for Brain Science
SMART-seq data set
Other Estink 2000 lumens Amazon.ca ASIN#:B07F7RT9XZ
mini LED projector
Other 96 white 20 lb Staples.ca Item#:380480
bond copy paper
Other Custom 3D printed This paper http://www.thingiverse.
mount for projector lens com/thing:4335379
Other Custom 3D printed stage This paper http://www.thingiverse.
for Xenopus laevis behavior com/thing:4335395
Other 8-inch soda lime Carolina Item#:741006
1500 ml culture dish
Other 60 mm petri dish Fisher Scientific Canada Cat#:FB0875713A
Other PLA 1.75 mm 3D iPrint-3D Transparent purple
printing filament
Other Logitech C920 webcam Logitech Model#:960–000764
Other Anycubic i3 mega 3D printer Amazon.ca ASIN#:B07NY5T1LJ
Lead contact and materials availability
Plasmids generated in this study will be made available upon request. Further information and
requests for resources and reagents should be directed to the Lead Contact, Edward Ruthazer
(edward.ruthazer@mcgill.ca).
Xenopus laevis tadpoles
Adult albino Xenopus laevis frogs (RRID:XEP_Xla200) were maintained and bred at 18˚C. Female
frogs were primed by injection of 50 IU pregnant mare serum gonadotropin (ProSpec-Tany Techno-
Gene Ltd., Ness-Ziona, Isreal). After 3 days, male and primed female frogs were injected with 150 IU
and 400 IU of human chorionic gonadotropin (Sigma-Aldrich, Oakville, CA) into the dorsal lymph
sac, respectively. The injected male and female frogs were placed in isolated tanks for mating.
Embryos were collected the following day and maintained in Modified Barth’s Saline with HEPES
(MBSH) in an incubator at 20˚C with LED illumination set to a 12 hr/12 hr day-night cycle and staged
according to Nieuwkoop and Faber (NF) developmental stages (Nieuwkoop and Faber, 1994). All
experiments were conducted according to protocol application number 2015–7728 approved by
The Animal Care Committee of the Montreal Neurological Institute and in accordance with Canadian
Council on Animal Care guidelines. Xenopus laevis sex cannot be determined visually pre-metamor-
phosis, and thus the sex of experimental animals was unknown.
Labeling of microglia, axons, and brain structures
Stage 39/40 tadpoles were anesthetized with 0.02% MS-222 in 0.1X MBSH. For labeling of microglia,
tadpoles received an intracerebroventricular (icv) injection to the third ventricle of 1 mg/ml Alexa
594 conjugated IB4-isolectin. A minimum of 48 hr was allowed to pass before live imaging studies
were commenced to allow for binding and update of IB4-isolectin by microglial cells. For concurrent
labeling of brain structures, 1 mM CellTracker Green BODIPY in 10% DMSO was injected icv after
Lim and Ruthazer. eLife 2021;10:e62167. DOI: https://doi.org/10.7554/eLife.62167 23 of 35You can also read


