Aircraft-based observation of meteoric material in lower-stratospheric aerosol particles between 15 and 68 N - Recent
←
→
Page content transcription
If your browser does not render page correctly, please read the page content below
Atmos. Chem. Phys., 21, 989–1013, 2021
https://doi.org/10.5194/acp-21-989-2021
© Author(s) 2021. This work is distributed under
the Creative Commons Attribution 4.0 License.

Aircraft-based observation of meteoric material in
lower-stratospheric aerosol particles between 15 and 68◦ N
Johannes Schneider1 , Ralf Weigel2 , Thomas Klimach1 , Antonis Dragoneas1,2 , Oliver Appel1,2 , Andreas Hünig1,2 ,
Sergej Molleker1,2 , Franziska Köllner1,2 , Hans-Christian Clemen1 , Oliver Eppers1,2 , Peter Hoppe1 , Peter Hoor2 ,
Christoph Mahnke2,1,3 , Martina Krämer3,2 , Christian Rolf3 , Jens-Uwe Grooß3 , Andreas Zahn4 , Florian Obersteiner4 ,
Fabrizio Ravegnani5 , Alexey Ulanovsky6 , Hans Schlager7 , Monika Scheibe7 , Glenn S. Diskin8 , Joshua P. DiGangi8 ,
John B. Nowak8 , Martin Zöger9 , and Stephan Borrmann2,1
1 Particle Chemistry Department, Max Planck Institute for Chemistry, Mainz, 55128, Germany
2 Institute for Atmospheric Physics, Johannes Gutenberg University Mainz, Mainz, 55128, Germany
3 Institute of Energy and Climate Research, Forschungszentrum Jülich, Jülich, 52425, Germany
4 Institute of Meteorology and Climate Research, Karlsruhe Institute of Technology (KIT),

Eggenstein-Leopoldshafen, 76344, Germany
5 Institute of Atmospheric Sciences and Climate, ISAC-CNR, Bologna, 40129, Italy
6 Central Aerological Observatory, Dolgoprudny, Moscow region, 141700, Russia
7 Institute of Atmospheric Physics, German Aerospace Center (DLR) Oberpfaffenhofen, Wessling, 82234, Germany
8 NASA Langley Research Center, MS 483, Hampton, VA 23681, USA
9 Flight Experiments, German Aerospace Center (DLR) Oberpfaffenhofen, Wessling, 82234, Germany

Correspondence: Johannes Schneider (johannes.schneider@mpic.de)

Received: 2 July 2020 – Discussion started: 10 August 2020
Revised: 2 December 2020 – Accepted: 2 December 2020 – Published: 26 January 2021

Abstract. We analyse aerosol particle composition measure-       jority (48 610) in the stratosphere, and are interpreted as me-
ments from five research missions between 2014 and 2018          teoric material immersed or dissolved within sulfuric acid. It
to assess the meridional extent of particles containing me-      must be noted that the relative abundance of such meteoric
teoric material in the upper troposphere and lower strato-       particles may be overestimated by about 10 % to 30 % due
sphere (UTLS). Measurements from the Jungfraujoch moun-          to the presence of pure sulfuric acid particles in the strato-
taintop site and a low-altitude aircraft mission show that       sphere which are not detected by the instruments used here.
meteoric material is also present within middle- and lower-      Below the tropopause, the observed fraction of the mete-
tropospheric aerosol but within only a very small proportion     oric particle type decreased sharply with 0.2 %–1 % abun-
of particles. For both the UTLS campaigns and the lower-         dance at Jungfraujoch, and smaller abundances (0.025 %–
and mid-troposphere observations, the measurements were          0.05 %) were observed during the lower-altitude Canadian
conducted with single-particle laser ablation mass spectrom-     Arctic aircraft measurements. The size distribution of the
eters with bipolar-ion detection, which enabled us to measure    meteoric sulfuric particles measured in the UTLS campaigns
the chemical composition of particles in a diameter range of     is consistent with earlier aircraft-based mass-spectrometric
approximately 150 nm to 3 µm. The five UTLS aircraft mis-        measurements, with only 5 %–10 % fractions in the smallest
sions cover a latitude range from 15 to 68◦ N, altitudes up to   particles detected (200–300 nm diameter) but with substan-
21 km, and a potential temperature range from 280 to 480 K.      tial (> 40 %) abundance fractions for particles from 300–350
In total, 338 363 single particles were analysed, of which       up to 900 nm in diameter, suggesting sedimentation is the
147 338 were measured in the stratosphere. Of these total        primary loss mechanism. In the tropical lower stratosphere,
particles, 50 688 were characterized by high abundances of       only a small fraction (< 10 %) of the analysed particles con-
magnesium and iron, together with sulfuric ions, the vast ma-    tained meteoric material. In contrast, in the extratropics the

Published by Copernicus Publications on behalf of the European Geosciences Union.
990                                                    J. Schneider et al.: Meteoric material in lower-stratospheric particles

observed fraction of meteoric particles reached 20 %–40 %          carbon (C), sulfur (S), aluminium (Al), sodium (Na), calcium
directly above the tropopause. At potential temperature lev-       (Ca), and nickel (Ni) (Lodders and Fegley Jr., 1998; Hoppe,
els of more than 40 K above the thermal tropopause, par-           2009; Plane et al., 2015). First detection of magnesium emis-
ticles containing meteoric material were observed in much          sion lines in the night sky spectrum and the conclusion that
higher relative abundances than near the tropopause, and, at       at least part of atmospheric magnesium is of meteoric origin
these altitudes, they occurred at a similar abundance fraction     were reported by Hicks et al. (1972).
across all latitudes and seasons measured. Above 440 K, the           About 8 t d−1 of the cosmic dust particles (with diameters
observed fraction of meteoric particles is above 60 % at lat-      between ∼ 1 and ∼ 300 µm) are completely ablated during
itudes between 20 and 42◦ N. Meteoric smoke particles are          entry into Earth’s atmosphere (Plane, 2003; Carrillo-Sánchez
transported from the mesosphere into the stratosphere within       et al., 2016). Quenching evaporated compounds is expected
the winter polar vortex and are subsequently distributed to-       to cause their rapid re-nucleation in the mesosphere to form
wards low latitudes by isentropic mixing, typically below          new particles of the size of a few nanometres, which are
a potential temperature of 440 K. By contrast, the findings        commonly referred to as meteoric smoke particles (MSPs)
from the UTLS measurements show that meteoric material             (Saunders et al., 2012; Plane et al., 2015; Hervig et al.,
is found in stratospheric aerosol particles at all latitudes and   2017). Recent remote-sensing and in situ measurements in
seasons, which suggests that either isentropic mixing is ef-       the mesosphere indicated that Fe and Mg are the main con-
fective also above 440 K or that meteoric fragments may be         stituents of MSPs (Hervig et al., 2012; Rapp et al., 2012).
the source of a substantial proportion of the observed mete-       MSPs have been identified to act as ice nuclei for noctilu-
oric material.                                                     cent clouds in the mesopause region (e.g. Alpers et al., 2001;
                                                                   Gumbel and Megner, 2009; Megner and Gumbel, 2009; Rapp
                                                                   et al., 2010), and therefore, it is suggested that MSPs have
                                                                   an impact on polar mesospheric summer echoes (Rapp and
1   Introduction                                                   Lübken, 2004; Megner et al., 2006). As MSPs are too small
                                                                   to sediment gravitationally, it is widely assumed that MSPs
Aerosol particles in the upper troposphere and lower strato-       are drained from the mesosphere into the stratosphere most
sphere (UTLS) play an important role in Earth’s radiative          efficiently due to the air mass subsidence within the polar
budget: firstly, by direct scattering of sunlight back to space    winter vortex, on a timescale of months (Plumb et al., 2002;
and secondly, by influencing homogeneous and heteroge-             Curtius et al., 2005; Megner et al., 2008; Plane, 2012; Saun-
neous cirrus cloud formation in the upper troposphere (UT).        ders et al., 2012; Weigel et al., 2014; Plane et al., 2015;
The radiative forcing via aerosol–cloud interaction of ice         Kremser et al., 2016). The aerosol particles in the strato-
clouds in the atmosphere was estimated in a model study to         spheric aerosol layer (Junge et al., 1961; Junge and Manson,
be around +0.27 W m−2 (Gettelman et al., 2012). Further-           1961; Kremser et al., 2016) consist mainly of sulfuric-acid–
more, especially under volcanically influenced conditions,         water (H2 SO4 –H2 O) droplets (Lazrus et al., 1971; Rosen,
aerosol particles in the UTLS provide surfaces for heteroge-       1971; Lazrus and Gandrud, 1974, 1977; Sedlacek et al.,
neous chemical reactions to occur, thereby influencing ozone       1983; Gandrud et al., 1989; Arnold et al., 1998), but a signifi-
chemistry (Pitari et al., 2002; von Hobe et al., 2011), and        cant fraction of none-pure sulfate particles has been observed
influence the stratospheric circulation due to heating of the      by balloon-borne measurements throughout the stratosphere
stratosphere (Robock, 2000; Kremser et al., 2016). Gener-          (Renard et al., 2020). The typical size range of the H2 SO4 –
ally, the dominating sources of aerosol particles and their pre-   H2 O droplets ranges between 100 and 200 nm (Plane et al.,
cursor gases are in the troposphere. Primary emitted particles     2015; Kremser et al., 2016). It is thought that MSPs partially
are for example dust, sea spray, black carbon, and biomass         dissolve in the droplets (Murphy et al., 1998, 2014; Cziczo
burning particles. Secondary aerosol particles are formed          et al., 2001; Saunders et al., 2012) such that a dilute solu-
from precursor gases such as organic and sulfur-containing         tion of highly soluble ferrous or ferric sulfate and hydrated
compounds. The sources for both primary and secondary par-         magnesium sulfate and silicic acid is formed (Saunders et al.,
ticles can be natural or anthropogenic. In contrast, an exclu-     2012). It was further suggested that silicon and aluminium
sively natural source of a certain fraction of atmospheric par-    are present as undissolved granular cores within the droplets
ticles is located outside Earth’s atmosphere, causing an am-       (Murphy et al., 2014), which would explain the observations
bling but continuous particle import of cosmic origin (Prup-       of refractory particles in the Arctic lower stratosphere (Cur-
pacher and Klett, 1997). The magnitude of cosmic mate-             tius et al., 2005; Weigel et al., 2014).
rial entering Earth’s atmosphere is currently estimated to be         As was hypothesized in the 1950s (e.g. Jacchia, 1955),
about 43 ± 14 t d−1 (tonnes per day) (Plane, 2012; Carrillo-       shown in measurements from the 1960s (e.g. Hemenway
Sánchez et al., 2016). Besides oxygen, major elements of           and Soberman, 1962), and recently also further established
meteoric material are iron (Fe), magnesium (Mg), and sili-         by Subasinghe et al. (2016), about 95 % of cosmic bodies
con (Si), which are found with roughly equal proportions in        of sizes greater than 1 mm in diameter undergo fragmenta-
chondritic meteorites; the most abundant minor elements are        tion upon entering Earth’s atmosphere, thereby forming un-

Atmos. Chem. Phys., 21, 989–1013, 2021                                                https://doi.org/10.5194/acp-21-989-2021
J. Schneider et al.: Meteoric material in lower-stratospheric particles                                                        991

ablated meteoric fragments (MFs) of presumably submicron          spectrometry in the tropical and mid-latitude lower strato-
size. If such fragments are formed at sufficient particle con-    sphere at altitudes up to 19 km showed a significant frac-
centrations, these particles may sediment directly into the       tion of particles containing meteoric material and sulfuric
lower stratosphere. It has been suggested that MFs may play       acid (Murphy et al., 1998, 2014; Cziczo et al., 2001; Froyd
a role in polar stratospheric cloud (PSC) formation, thereby      et al., 2009). Indirect evidence for the existence of meteoric
influencing polar ozone destruction (Voigt et al., 2005; James    aerosol particle material in the Arctic lower stratosphere up
et al., 2018). Satellite-based observations of PSCs in the        to 20 km altitude was reported by Curtius et al. (2005) and
Arctic were reproduced by model simulations using CLaMS           Weigel et al. (2014). They measured non-volatile particles
(Chemical Lagrangian Model of the Stratosphere) but only          that were thermally stable on exposure to 250 ◦ C and had di-
if heterogeneous nucleation of NAT (nitric acid trihydrate;       ameters of 10 nm to a few micrometres. The fraction of these
Grooß et al., 2014) and ice particles (Tritscher et al., 2019)    non-volatile particles increased with altitude up to 70 % at
on foreign nuclei were included in the model parameteriza-        potential temperature levels between 430 and 500 K. Ebert
tion. A potential source of the foreign nuclei is meteoric dust   et al. (2016) report on submicrometre particles collected with
(James et al., 2018).                                             a cascade impactor in the Arctic stratosphere during the win-
   Additionally, certain amounts of cosmic particulate mate-      ters of 2010 and 2011 that were analysed for their chemi-
rial enter Earth’s atmosphere as interplanetary dust particles    cal composition and morphology. They found Fe-rich parti-
(IDPs) which, if smaller than 1 µm in diameter, are too small     cles, Ca-rich particles, silicates, silicate–carbon mixed parti-
to experience any ablative altering during atmospheric entry.     cles, and mixed-metal particles from different sources, such
The origin of IDPs is mainly attributed to collisions of as-      as meteoric material, space debris, and to a lower extent ter-
teroids, sublimation of comets, and long-decayed cometary         restrial sources.
trails (Plane, 2003, 2012). In terms of the size-segregated          Here we report findings from aircraft measurements of
mass influx of cosmic particles (Plane, 2003, 2012), the          aerosol particle composition in the lower stratosphere at dif-
contribution of submicrometre-sized IDPs to the total atmo-       ferent altitudes, latitudes, and seasons:
spheric aerosol particle load is estimated to be small with
                                                                      – western Europe for spring (March–April 2014) and
estimates of about 150 t yr−1 .
                                                                        summer (August–September 2018)
   The continuous import of submicrometre IDPs, the spo-
radic events of meteors’ disintegration on atmospheric en-            – Mediterranean for summer (August–September 2016)
try, and the meteoric fragments (with radii < 0.5 µm; Brooke
et al., 2017) contribute to the atmosphere’s load of mete-            – Tropics and subtropics (July–August 2017 and August
oric material, which becomes incorporated and partially dis-            2018)
solved in acidic aerosols (e.g. of HNO3 and/or H2 SO4 at              – North America and the North Atlantic for winter
different dilutions with H2 O). Bardeen et al. (2008) inves-            (January–February 2018).
tigated ablated meteoric material by means of simulations of
a coupled general circulation model and a sectional micro-           In all datasets we observed a distinct particle composition
physics model. Due to a mesospheric meridional circulation,       type in the lower stratosphere that can be interpreted as par-
as Bardeen et al. (2008) revealed, the re-nucleated meteoric      ticles containing meteoric material, dissolved in or coated by
ablation material is transported towards the respective winter    sulfuric acid. We discuss mass spectral composition, size dis-
pole where it subsides within the polar vortex to stratospheric   tribution, vertical profiles, latitudinal distribution, and cross-
altitudes. According to the study by Dhomse et al. (2013), the    tropopause transport of particles containing meteoric mate-
nanoparticles originally released at upper-mesospheric alti-      rial.
tudes (corresponding to MSPs, which are produced by abla-
tion and recombination in the upper atmosphere) reside for        2     Measurements and methods
about 4 years in the atmosphere until they are deposited on
the surface. The same simulations (Dhomse et al., 2013) pre-      2.1    Field measurements
dicted the strongest deposition of meteoric ablation material
at mid latitudes with a substantially (∼ 15 times) higher effi-   This study analyses lower-stratospheric and upper-
ciency over Greenland than in Antarctica.                         tropospheric aerosol composition measurements taken
   The existence of particles containing meteoric material in     during five aircraft-based field campaigns, together with
the lower stratosphere has been shown by direct in situ ob-       two additional composition measurements from the middle
servations. Mossop (1965) reported on insoluble inclusions        and lower troposphere (altitudes below 3600 m a.s.l.). The
found in stratospheric particles sampled at 20 km by the U-       individual campaigns are described briefly in the following.
2 aircraft and suggested a meteoric origin of these particles.    The flight tracks of all UTLS research flights included here
Shedlovsky and Paisley (1966) analysed particles sampled by       as well as the locations of the low-altitude measurements are
the U-2 aircraft and detected sulfur, iron, sodium, copper, and   depicted in Fig. 1. An overview about the five UTLS aircraft
chromium. More recently, aircraft-based in situ aerosol mass      campaigns is provided in Table 1.

https://doi.org/10.5194/acp-21-989-2021                                              Atmos. Chem. Phys., 21, 989–1013, 2021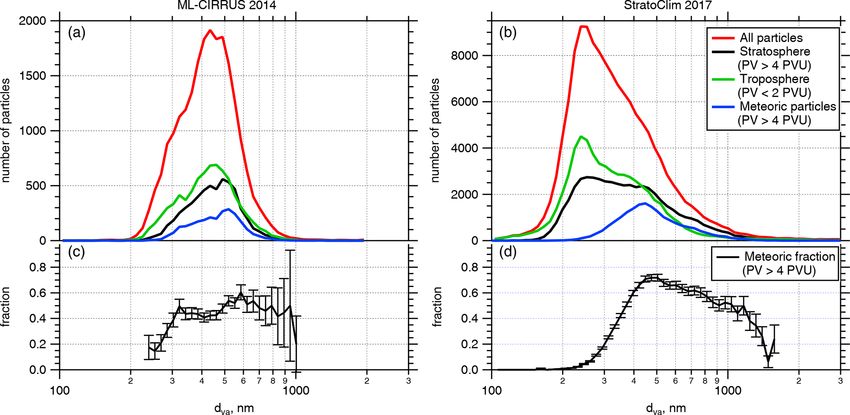
992                                                        J. Schneider et al.: Meteoric material in lower-stratospheric particles

Figure 1. Map of the flight tracks of all UTLS research flights used in this study. Additionally the locations of the low-altitude measurements
are indicated: Jungfraujoch (3600 m a.s.l.) and the operation range of the NETCARE (Network on Climate and Aerosols: Addressing Key
Uncertainties in Remote Canadian Environments) flights (0–3000 m a.s.l.). Please note that dates in this figure are given in the format of year
month day.

Table 1. Overview of the five different aerosol composition measurement datasets from the UTLS used in this study. PV: potential vorticity;
PVU: potential vorticity unit.

      Project                 ML-CIRRUS             StratoClim 2016       StratoClim 2017       ND-MAX                CAFE-Africa
      Time                    Mar–Apr 2014          Aug–Sep 2016          Jul–Aug 2017          Jan–Feb 2018          Aug–Sep 2018
      Measurement region      Western Europe        Eastern               Southern Asia         US to Europe          Atlantic Ocean
                                                    Mediterranean
      Aircraft                HALO (G550)           M-55 Geophysica       M-55 Geophysica       NASA DC-8             HALO (G550)
      Instrument              ALABAMA               ERICA                 ERICA                 ERICA                 ALABAMA
      Ablation laser          266 nm                266 nm                266 nm                266 nm                266 nm
      wavelength
      No. of flights used     15                    3                     8                     3                     3
      in this study
      Altitude range (km)     Up to 13.8 km         Up to 20.2 km         Up to 20.5 km         Up to 11 km           Up to 14.5 km
      Theta range (K)         276–387               295–490               310–480               276–340               295–380
      Latitude range (◦ N)    36.3–57.5             33.4–41.0             20.8–29.5             34.6–68.1             15.0–48.2
      PV range (PVU)          0–10                  0–24                  0–22                  0–8                   0–10
      Total number of         24 833                11 709                138 119               98 598                65 104
      single-particle mass
      spectra
          In stratosphere     6509                  5092                  51 599                73 367                10 771
          (PV > 4 PVU)
      Number of mass          3140                  2412                  18 688                23 138                3310
      spectra dominated by
      magnesium and iron
          In stratosphere     2986                  2271                  18 421                22 050                2882
          (PV > 4 PVU)

Atmos. Chem. Phys., 21, 989–1013, 2021                                                         https://doi.org/10.5194/acp-21-989-2021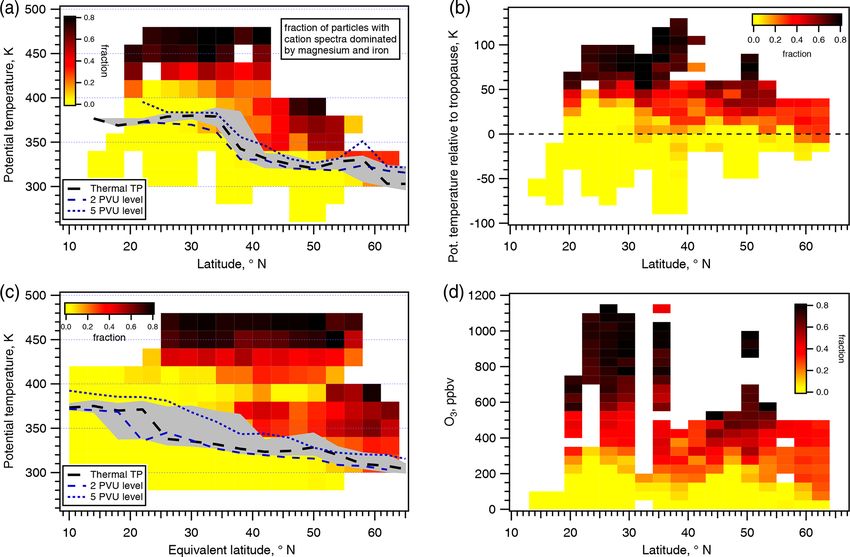
J. Schneider et al.: Meteoric material in lower-stratospheric particles                                                      993

2.1.1   ML-CIRRUS                                                 out of Sal on the Cabo Verde islands. The main objective
                                                                  was to study the African monsoon outflow in the upper tro-
The field campaign ML-CIRRUS (Formation, Lifetime,                posphere over the Atlantic Ocean. This study includes only
Properties and Radiative Impact of Mid-Latitude Cirrus            the measurement data from the three research flights that
Clouds) was conducted in March and April 2014 out                 reached the stratosphere, as was inferred from the temper-
of Oberpfaffenhofen, Germany, using the research aircraft         ature profiles. These flights took place on 15 and 24 August
HALO (High Altitude and Long Range Research Aircraft).            and 7 September 2018, the latter being the ferry flight back to
The objective of ML-CIRRUS was to study cirrus clouds by          Germany. The flight tracks of these three flights are included
in situ and remote-sensing methods. Including test flights, a     in Fig. 1.
total of 16 flights were carried out. Most of the flight time
(in total 88 h) was spent in the upper troposphere and lower      2.1.5    Additional low-altitude datasets
stratosphere. Laser ablation aerosol mass spectrometer data
were recorded during 15 flights, the full dataset from which      To investigate the possible occurrence of meteoric particles
is included in this study. A detailed overview on the mission     in the middle and lower troposphere, we also analyse two
is given by Voigt et al. (2017).                                  additional aerosol composition measurement datasets from
                                                                  lower altitudes: one dataset was obtained during the NET-
2.1.2   StratoClim                                                CARE field campaign (Network on Climate and Aerosols:
                                                                  Addressing Key Uncertainties in Remote Canadian Environ-
Two aircraft-based research campaigns were conducted
                                                                  ments; Abbatt et al., 2019), conducted in the Arctic out of
within StratoClim (Stratospheric and upper tropospheric pro-
                                                                  Resolute Bay (Nunavut, Canada) in July 2014. A single-
cesses for better climate predictions), which is a collabora-
                                                                  particle mass spectrometer was operated on board the Po-
tive research project funded by the European Commission.
                                                                  lar 6 aircraft (Alfred-Wegener-Institut Helmholtz-Zentrum
The first StratoClim campaign took place at Kalamata air-
                                                                  für Polar- und Meeresforschung) and measured at altitudes
port, Greece, in August and September 2016. The aim of the
                                                                  between 0 and 3 km. Details of the campaign and the
mission was to study atmospheric composition in the east-
                                                                  mass spectrometer data are given in Köllner et al. (2017).
ern Mediterranean region, including the remote influence of
                                                                  The other lower-altitude dataset is from the mountaintop
the Asian monsoon anticyclone (AMA) outflow. Three re-
                                                                  Jungfraujoch site (3600 m a.s.l.), where a single-particle
search flights were conducted. The second StratoClim cam-
                                                                  mass spectrometer was operated during the INUIT-JFJ (Ice
paign was a dedicated field activity to investigate the impact
                                                                  Nucleation Research Unit Jungfraujoch) campaign in Jan-
of the AMA on the UTLS and took place at the Tribhuvan In-
                                                                  uary and February 2017. The mass spectrometer data are still
ternational Airport of Kathmandu, Nepal, in July and August
                                                                  unpublished, but details on the campaign can be found in
2017 (e.g. Höpfner et al., 2019). Eight scientific flights were
                                                                  Eriksen Hammer et al. (2018) and Gute et al. (2019).
carried out over Nepal, India, and Bangladesh. The flight
paths spanned latitudes from 21 to 27◦ N and longitudes from
                                                                  2.2     Instrumentation and data analysis
79 to 90◦ E (see Fig. 1).

2.1.3   ND-MAX/ECLIF-2                                            2.2.1    Aerosol mass spectrometer operated during
                                                                           ML-CIRRUS and CAFE-Africa
The ND-MAX/ECLIF-2 (NASA/DLR-Multidisciplinary
Airborne eXperiments/Emission and CLimate Impact of               The aircraft-based laser ablation aerosol mass spectrometer
alternative Fuel) mission aimed at the characterization of        (ALABAMA) is described in detail in Brands et al. (2011),
gaseous and particulate aircraft emissions with a dedicated       Köllner et al. (2017), and Clemen et al. (2020). Briefly, the
aircraft-chasing field experiment over southwestern Ger-          ALABAMA is a bipolar-ion single-particle analysis instru-
many. For this mission, the installation of instrumentation in    ment that samples aerosol particles from ambient air through
the NASA DC-8 aircraft took place at Palmdale, CA, USA.           a constant-pressure inlet (CPI; Molleker et al., 2020) and an
Measurements taken during the ferry flights from Palmdale         aerodynamic lens. The sampled particle size range (vacuum
to Germany, on 13 January 2018 and back on 3 and 4 Febru-         aerodynamic diameter, dva ; DeCarlo et al., 2004) was be-
ary 2018, were used in this study. These flights reached          tween about 200 and 1000 nm during ML-CIRRUS and be-
latitudes up to 68◦ N (see Fig. 1) and longitudes as far as       tween 200 and 3000 nm during CAFE-Africa. Having passed
120◦ W and penetrated deep into the winter stratosphere at        through an aerodynamic lens, the particles are then accel-
around 11 km altitude.                                            erated into a vacuum chamber. The particles are detected
                                                                  by two 405 nm laser diodes, and their velocity information
2.1.4   CAFE-Africa                                               is used to determine their vacuum aerodynamic diameter
                                                                  and to trigger a laser shot of the ablation laser (quadru-
CAFE-Africa (Chemistry of the Atmosphere Field Experi-            pled Nd:YAG, 266 nm) that hits the particles in the ioniza-
ment in Africa) was conducted with HALO in August 2018            tion region of the bipolar-ion time-of-flight mass spectrom-

https://doi.org/10.5194/acp-21-989-2021                                             Atmos. Chem. Phys., 21, 989–1013, 2021
994 J. Schneider et al.: Meteoric material in lower-stratospheric particles
eter. During ML-CIRRUS and CAFE-Africa, aerosol parti- particles was about 40 % at diameters around 500 nm, be-
cles were sampled through the HALO aerosol submicrome- tween 5 % and 10 % below 200 nm, 20 % at 1000 nm, and
tre inlet (HASI, Andreae et al., 2018). The inlet was mounted below 5 % above 2000 nm during the StratoClim measure-
on the upper side of the fuselage of the aircraft. Inside the ments. During StratoClim, the ERICA was operated on 11
aircraft, the sampled aerosol particles were guided through research flights (three in 2016 and eight in 2017), and the
a 2.9 m long stainless-steel sampling line with an inner di- ERICA-LAMS analysed about 150 000 single particles (see
ameter of 5 mm. The calculated transmission efficiency of Table 1). During the three ferry flights conducted in the
this sampling line is shown in the Supplement to this paper ND-MAX/ECLIF-2 project that are used here, the ERICA-
(Fig. S9 in the Supplement). During ML-CIRRUS, the AL- LAMS recorded more than 98 000 single-particle mass spec-
ABAMA was operative during 15 flights and analysed more tra.
than 24 000 ambient aerosol particles (see Table 1). From
CAFE-Africa, we analyse only the measurements from the 2.2.3 Single-particle mass spectrometer data analysis
three flights where HALO reached the stratosphere, as was
inferred from the temperature profiles. In these three flights The aircraft datasets from all five UTLS campaigns were
the ALABAMA sampled and analysed more than 65 000 par- analysed using a consistent procedure to ensure comparabil-
ticles. The higher efficiency and higher upper-size cut-off ity of the results. First, all data measured during one cam-
(see above) of the ALABAMA in CAFE-Africa compared to paign were merged into one dataset per campaign. This re-
ML-CIRRUS are due to several instrumental improvements sulted in datasets containing individual spectra information
such as a new aerodynamic lens system and delayed ion ex- of 11 709 particles (StratoClim 2016) to up to 138 119 par-
traction (Clemen et al., 2020). The ALABAMA was also ticles (StratoClim 2017) as given in Table 1. These datasets
used in the abovementioned low-altitude field campaigns were clustered separately using a fuzzy c-means algorithm
NETCARE and INUIT-JFJ. (for a general description see Bezdek et al., 1984, and Hinz
et al., 1999; for an ALABAMA-specific description see Roth
2.2.2 Aerosol mass spectrometer operated during et al., 2016), with a pre-selected number of 20 clusters per
StratoClim and ND-MAX campaign. Only cations were considered for the clustering
algorithm for two reasons: first, during ML-CIRRUS many
The newly developed mass spectrometer ERICA (ERC – Eu- anion mass spectra were too noisy. Second, the particle type
ropean Research Council – Instrument for Chemical com- of interest was found to be mainly characterized by the cation
position of Aerosols) combines single-particle laser ablation mass spectrum, containing magnesium and iron, as explained
and flash vaporization–ionization techniques. It was designed in the next section. Further clustering details are given in
for fully automated operation on the high-altitude research the Supplement (Sect. S1 and Table S1). For quality assur-
aircraft M-55 “Geophysica” during the StratoClim project ance and uncertainty estimation, the clustering was repeated
and was later reconfigured to be operated on the NASA DC- using different starting conditions and also different algo-
8 during the ND-MAX/ECLIF-2 mission. Here we use only rithms. The results showed only small deviations in the type
data obtained using the laser ablation part of the ERICA of clusters and in the numbers of mass spectra attributed to
(ERICA-LAMS; laser ablation mass spectrometer). The ba- the clusters (Sect. S1 and Table S2 in the Supplement). Mean
sic design is similar to that of the ALABAMA, but since this mass spectra (anions and cations) were calculated for each
is a newly developed instrument, it is also described here. cluster and were used for the interpretation of the particle
The aerosol particles are sampled via a CPI (Molleker et al., type associated with this cluster. To enable understanding of
2020) and an aerodynamic lens designed for PM2.5 (Peck the different origin of the meteoric-signature particles, mete-
et al., 2016). In the vacuum chamber, the particles are de- orological reanalysis data were combined with the measure-
tected by two laser diodes (405 nm) and ablated by a pulsed ments, with histograms of relative particle abundance calcu-
quadrupled Nd:YAG laser emitting at 266 nm. This Nd:YAG lated for each cluster, as a function of altitude, potential tem-
laser is operated without a wavelength separator in the laser perature (“theta”), and potential vorticity (PV).
head and thus emits also a small fraction of the energy in The datasets from low altitudes (NETCARE at Jungfrau-
form of the first and second harmonic (1064 and 532 nm). joch) were treated differently: here we searched specifically
The generated ions are analysed in a bipolar-ion time-of- for mass spectra using selected marker ions that were found
flight mass spectrometer (TOFWERK AG, Thun, Switzer- in the high-altitude data. This is explained later in detail
land). The size range of the ERICA-LAMS is approximately (Sect. 3.7).
100–5000 nm (dva ). Particle size was calibrated using PSL
(polystyrene latex) particles with diameters between 80 and 2.2.4 Auxiliary data
5000 nm. The particle detection efficiency at the laser diodes
reaches a maximum of about 75 % at 400 nm and decreases The existence of steep vertical gradients in water vapour
towards lower and higher diameters. The hit rate, defined as (H2 O) and ozone (O3 ) across the tropopause means that cor-
the ratio of recorded particle mass spectra to laser shots on relations of measurements or reanalysis of these species can
Atmos. Chem. Phys., 21, 989–1013, 2021 https://doi.org/10.5194/acp-21-989-2021J. Schneider et al.: Meteoric material in lower-stratospheric particles 995
be used to investigate the previous tropospheric influence of The measurement uncertainties of the UHSAS were deter-
a stratospheric air mass. We use independent particle num- mined to 10 % (Mahnke, 2018).
ber concentration and particle size measurements to convert Basic meteorological parameters such as pressure and
the mass spectrometer data to number concentrations. These temperature, as well as aircraft position and altitude,
additional measurement datasets are briefly explained here. were obtained during ML-CIRRUS and CAFE-Africa from
Water vapour was measured during ML-CIRRUS and the Basic HALO Measurement and Sensor System (BA-
StratoClim by the airborne Fast In-situ Stratospheric HAMAS), during StratoClim from the Unit for Connec-
Hygrometer (FISH). This instrument uses Lyman-alpha tion with the Scientific Equipment (UCSE) and during ND-
photofragment fluorescence and is described in detail by MAX/ECLIF-2 from the NASA DC-8 facility instrumenta-
Zöger et al. (1999). The detection limit is reported to be be- tion.
low 0.4 ppmv; the uncertainty was determined to be about
8 %–30 % for low H2 O mixing ratios (1–4 ppmv) and 6 %– 2.3 Meteorological reanalysis
8 % between 4 and 1000 ppmv (Meyer et al., 2015). Dur-
ing ML-CIRRUS, FISH sampled the air through a forward- Meteorological parameters for stratifying the data (e.g. the
facing inlet mounted on the upper fuselage of the HALO air- histograms in Sect. 2.2.3) were derived from the ERA-
craft, whereas during StratoClim, the forward-facing FISH Interim reanalysis (Dee et al., 2011) from the European
inlet was mounted on the side of the fuselage of the Geophys- Centre of Medium Range Weather forecast (ECMWF). For
ica aircraft (Afchine et al., 2018). The forward-facing inlet meridional characterization we use equivalent latitude (Lary
also samples cloud droplets and ice crystals, which evapo- et al., 1995) from ERA-Interim. For the vertical coordinate,
rate in the inlet, such that the FISH measurements refer to we use potential vorticity from ERA-Interim and potential
total water. We therefore restricted the dataset to non-cloud temperature derived from observed pressure and temperature
conditions, by removing the data points where the H2 O satu- data. The location of the thermal tropopause (lowest-altitude
ration ratio was greater than 0.8. During ND-MAX/ECLIF-2, negative lapse rate) in potential temperature coordinates was
water vapour was measured using the diode laser hygrom- taken from ERA-Interim.
eter (DLH) of the NASA Langley Research Center (LRC;
Diskin et al., 2002), which has an uncertainty of 5 %. During 3 Results
CAFE-Africa, water vapour was measured by SHARC (So-
phisticated Hygrometer for Atmospheric ResearCh), whose 3.1 Distinct particle type containing magnesium and
detection method is based on direct absorption measurement iron ions
by a tuneable diode laser (TDL) system. The uncertainty of
the SHARC hygrometer is 5 % or ±1 ppmv. In all five upper-tropospheric and lower-stratospheric air-
Ozone was measured during ML-CIRRUS and CAFE- craft datasets, the clustering algorithm yielded a type of mass
Africa by the Fast Airborne Ozone monitor (FAIRO), spectra with a mean cation mass spectrum characterized by a
whereas during StratoClim, O3 was measured by the Fast high abundance of magnesium (Mg+ , m/z 24 for the major
Ozone Analyser (FOZAN-II). FAIRO combines a dry chemi- isotope and m/z 25 and 26 for the minor isotopes; mass-to-
luminescence detector (CI-D) with a two-channel UV (ultra- charge ratio) and iron (Fe+ , m/z 56 for the major isotope
violet) photometer. The total uncertainty is 1.5 % at 8 Hz or and m/z 54 for the most abundant minor isotope). Also ox-
1.5 ppb, whichever is higher (see Zahn et al., 2012). FOZAN- ides of Fe (FeO+ , m/z 72; FeOH+ , m/z 73) were clearly de-
II is likewise based on a CI-D and has an uncertainty of less tected. Additional minor cation peaks include sodium (Na+ ,
than 10 % (see Yushkov et al., 1999, and Ulanovsky et al., m/z 23), aluminium (Al+ , m/z 27), as well as trace signals of
2001). During ND-MAX, O3 was measured by the UV pho- potassium (K+ , m/z 39 and 41) and calcium (Ca+ , m/z 40).
tometric ozone analyser TE49 (Thermo Scientific), which The mean anion mass spectrum contains almost exclusively
has an uncertainty of 5 %. sulfuric acid ions, as HSO− 4 (m/z 97) and H2 SO4 HSO4
−
Aerosol particle size distributions were measured during (m/z 195). Figure 2 shows the averaged bipolar-ion spec-
both HALO missions using an optical particle spectrome- tra of stratospheric particles (PV > 4 PVU) from the aircraft
ter of the type Grimm 1.129 “Sky-OPC” (optical particle mission StratoClim 2017 with the ERICA (Fig. 2a) and from
counter), which was installed next to the ALABAMA. The the aircraft mission CAFE-Africa 2018 with the ALABAMA
Sky-OPC measured the total particle number concentration (Fig. 2c). The mean mass spectrum of the Fe and Mg parti-
and size distribution for particles larger than 250 nm (man- cle type from the 18 421 measurements made during Stra-
ufacturer calibration) in diameter with a reproducibility of toClim 2017 looks remarkably similar to that from the 2882
3 %, given by the manufacturer. During the StratoClim cam- measurements made during CAFE-Africa 2018. A linear cor-
paigns, we used a modified Ultra-High Sensitive Aerosol relation between the mean mass spectra of the Fe and Mg
Spectrometer (UHSAS-A), with a particle diameter range particle type measured during CAFE-Africa and StratoClim
from 65 to 1000 nm. The modifications allowed for an air- yielded an r 2 of 0.97 for both the anions and the cations.
borne application in the stratosphere up to a height of 20 km. The only difference is the detection of SiO− (m/z 44) by
https://doi.org/10.5194/acp-21-989-2021 Atmos. Chem. Phys., 21, 989–1013, 2021996 J. Schneider et al.: Meteoric material in lower-stratospheric particles
the ERICA during StratoClim 2017 that was missing from up to 5 PVU in the subtropics (Kunz et al., 2011). Here we
the CAFE-Africa observations. This might be due to the ad- find that the increase of this particle type fraction occurs at
ditional emission of 1064 and 532 nm light of the ERICA about 2 PVU during ND-MAX/ECLIF-2, StratoClim 2016,
laser in contrast to the ALABAMA laser such that the ioniza- and CAFE-Africa; at 4 PVU during ML-CIRRUS; and at
tion probability of Si-containing compounds is higher in the 8 PVU during StratoClim 2017. In general, PV is not well
ERICA than in the ALABAMA. Additionally, Fig. 2b and d suited to define the tropopause level in the tropics, and there-
show the averaged mass spectrum of all other stratospheric fore, a potential temperature of 380 K is typically used in-
particles measured during the two campaigns. These spec- stead of PV to define the tropical tropopause (Holton et al.,
tra contain anion and cation signals indicating nitrate (NO− 3, 1995). Notably during the Stratoclim 2017 flights sampling
NO− 2 , and NO +
) and several ion signals indicating carbona- above the AMA, the increase of the iron- and magnesium-
ceous material (C+ , C+ + +
2 , C2 H3 , and C3 H7 ). The observation containing particle fraction is found at 400 K, which is con-
that carbonaceous material is found in stratospheric particles sistent with the high tropopause over the AMA. In the low-
agrees with earlier findings by Murphy et al. (1998, 2007, est row of Fig. 3, ozone is used as the vertical coordinate.
2014). Here, the increase of the particle fraction starts above an
Figure 3 shows the fractional abundance of the Fe and Mg ozone mixing ratio of about 150 ppbv, indicating the chemi-
particle type stratified by altitude, potential temperature, po- cal tropopause (Hoor et al., 2002; Zahn and Brenninkmeijer,
tential vorticity, and ozone, with bin sizes of 500 m for alti- 2003; Pan et al., 2004). The different tropopause altitudes
tude, 4 K for potential temperature, 0.5 PVU (potential vor- observed during the individual missions are due to the fact
ticity units, 1 PVU = 10−6 m2 s−1 K kg−1 ) for potential vor- that the height of the tropopause is a function of latitude. The
ticity, and 50 ppbv for ozone. In total, we detected 3140 par- tropical tropopause corresponds to an isentropic surface at
ticles of this type during ML-CIRRUS, 2412 during Strato- a potential temperature level of about 380 K (Holton et al.,
Clim 2016, 18 688 during StratoClim 2017, 23 138 during 1995), corresponding to a geometric altitude of about 17 km
ND-MAX 2018, and 3310 during CAFE-Africa 2018 (see (Fueglistaler et al., 2009). In the extratropics, the isentropes
also Table 1). It has to be emphasized here that this frac- cross the dynamical tropopause that lies here between 2 and
tional abundance refers to the total number of analysed par- 5 PVU. At polar latitudes the tropopause height is typically
ticles by the ERICA and the ALABAMA. Both instruments around 8 km (Wilcox et al., 2012).
use a 266 nm laser for ablation and ionization. Pure sulfuric
acid particles are not ablated and ionized at this wavelength, 3.2 Latitudinal distribution
as was previously reported (Thomson et al., 1997; Murphy,
2007) and validated by laboratory measurements with the To combine all data from the five aircraft campaigns, we
ERICA. Thus, the fraction of the Fe and Mg particle type binned all particles (in total 338 354) by latitude and po-
given here represents an upper limit and may be overesti- tential temperature, using 3◦ bins for latitude and 20 K bins
mated by about 10 %–30 % because pure sulfuric acid par- for potential temperature (theta), thereby displaying the data
ticles are not taken into account. This is discussed in more in theta-latitude space. The same was done for the iron-
detail in Sect. 3.5. and magnesium-dominated particle type (in total 50 688).
During these five aircraft campaigns, the number of the Then we calculated the particle fraction of the magnesium-
Fe- and Mg-containing particles was largest at high altitudes dominated particle type for each bin. Only bins containing
(upper row in Fig. 3), where a fractional abundance of up to more than 10 particles were considered. The result is shown
0.8 was calculated. Similar values (up to 0.6) were reported in Fig. 4a (separated graphs for the individual missions are
by Murphy et al. (2014) for particles with the same ion sig- given in Fig. S6 in the Supplement). We also added to the fig-
nals in the mid-latitude stratosphere. The graphs of potential ure the thermal tropopause from the ECMWF dataset, binned
temperature and potential vorticity (second and third rows) into 4◦ latitude bins. The median thermal tropopause is given
show that the high fractional abundance also corresponds to by the thick dashed line and the 25 % and 75 % quartiles by
high values of potential temperature and potential vorticity, the grey-shaded area. Additionally, a range for the dynami-
indicating that the measurements showing the high fractional cal tropopause is shown, from 2 to 5 PVU, by the thin dashed
abundance of this particle type were taken in the stratosphere. lines. For this, we took all potential temperatures where the
The tropopause as the boundary between the tropo- potential vorticity ranged between 1.5 and 2.5 PVU (4.5 and
sphere and stratosphere is often defined via the temperature 5.5 PVU, respectively) and binned these values into 4◦ lati-
lapse rate (known as the thermal tropopause or cold-point tude bins.
tropopause). The potential vorticity has been found to be a The same procedure was used for the other panels in
better indicator, representing a “dynamical tropopause” in Fig. 4. In Fig. 4b the potential temperature relative to the
the extratropics (Hoskins et al., 1985; Gettelman et al., 2011). tropopause is used as the vertical coordinate with 10 K bins.
The threshold value used to separate the stratosphere from Figure 4c uses equivalent latitude as the horizontal coordi-
the troposphere in the extratropics is typically 2 PVU (e.g. nate. The equivalent latitude of an air parcel is calculated
Holton et al., 1995), whereas this threshold value increases by transforming the contour having the same potential vor-
Atmos. Chem. Phys., 21, 989–1013, 2021 https://doi.org/10.5194/acp-21-989-2021J. Schneider et al.: Meteoric material in lower-stratospheric particles 997 Figure 2. Mean mass spectra of stratospheric particles (PV > 4 PVU). (a, b) StratoClim 2017 (ERICA); (c, d) CAFE-Africa 2018 (AL- ABAMA). Panels (a) and (c) show the averaged mass spectra of particles of which the positive mass spectra are dominated by iron (Fe+ and FeO+ ) and magnesium (Mg+ ). The two anion as well as the two cation mass spectra of the Mg- and Fe-dominated particles correlate between the instruments with r 2 = 0.97. Panels (b) and (d) show the averaged mass spectrum of all other stratospheric particles. ticity and potential temperature into a circle centred at the corresponds to the PV profile of the StratoClim 2017 data pole. The latitude enclosing this circle is then defined as the from Fig. 3 because the stratospheric tropical data in Fig. 4 equivalent latitude. Since potential vorticity is conserved un- are dominated by the StratoClim 2017 dataset. In the AMA, der adiabatic processes, equivalent latitude can be used to which dominated the geographical region of StratoClim 2017 account for reversible adiabatic tracer transport by e.g. plan- during the time of the campaign, the air masses are trans- etary waves (Hegglin et al., 2006; Hoor et al., 2010; Krause ported upwards between about 360 and 460 K (Ploeger et al., et al., 2018). Figure 4d uses ozone as the vertical coordinate, 2017; Vogel et al., 2019). The observation that the fraction of with 50 ppb ozone bins. the iron- and magnesium-dominated particle type increases In theta-latitude space (Fig. 4a), the thermal tropopause only above the extratropical tropopause layer or mixing layer reaches the 380 K level at 34◦ N and remains between 370 (Hoor et al., 2002, 2004; Pan et al., 2004), i.e. 30 K above the and 380 K south of 34◦ N. At mid latitudes, the tropopause tropopause (Fig. 4b), indicates that the source for this parti- height decreases until it reaches 300 K at 60◦ N. In theta- cle type must be above the tropopause because otherwise, the equivalent-latitude space (Fig. 4c), the thermal tropopause upwelling air masses in the AMA would contain this particle shows more variation (larger interquartile range), especially type also at lower potential temperatures. In the stratosphere, between 20 and 40◦ N. the widespread occurrence of high fractions of this particle All sub-panels in Fig. 4 show that the fraction of the iron- type over a broad range of equivalent latitudes above 440 K and magnesium-dominated particles increases in high and (Fig. 4c) indicates that this particle type is very homoge- middle latitudes very close to the position of the tropopause neously distributed in the stratosphere. The large equivalent- but not in the tropics. In theta-latitude space (Fig. 4a), the latitude range is consistent with potential transport between particle fraction remains as low as in the troposphere be- high and low latitudes. From Fig. 4b it can be seen that at tween the tropopause (around 370–380 K) and 400 K at lati- above a distance of about 40 K to the tropopause the propor- tudes south of 30◦ N. Normalizing the potential temperature tion of the iron- and magnesium-dominated particles does to the thermal tropopause (Fig. 4b) confirms this observation. not change substantially with latitude. In Fig. 4d similar be- In theta-equivalent-latitude space (Fig. 4c), this effect is even haviour is observed for ozone levels larger than 300 ppbv. more pronounced: south of 35◦ N equivalent latitude, the area between the tropopause and 420 K shows a very low frac- tion of the iron- and magnesium-dominated particles. This https://doi.org/10.5194/acp-21-989-2021 Atmos. Chem. Phys., 21, 989–1013, 2021
998                                                       J. Schneider et al.: Meteoric material in lower-stratospheric particles

Figure 3. Fractional abundance of particles with cation spectra dominated by magnesium and iron ions. Upper row: as a function of geometric
altitude. Second row: as a function of potential temperature. Third row: as a function of potential vorticity (PV). Fourth row: as a function
of the ozone mixing ratio. The missions are not sorted in chronological order but rather from low potential temperature (leftmost column)
to high potential temperature range (rightmost column). Error bars were calculated from Poisson counting statistics and the propagation of
uncertainty.

3.3   Interpretation as meteoric particles                               and Fe consist of meteoric material dissolved in sulfuric
                                                                         acid (Cziczo et al., 2001). Our cation mass spectra (Fig. 2)
From the previous discussion we concluded that the source                show an ion signature very similar to the cation mass spectra
of this particle type is likely found above the tropopause. The          from stratospheric particles, dissolved meteorites, and artifi-
capacity to record bipolar-ion spectra of single particles al-           cial meteorite particles presented in Cziczo et al. (2001). The
lows us to show that each particle whose cation mass spec-               finding that Si is observed to a much lesser degree than ex-
trum is dominated by Mg and Fe contains sulfuric acid but no             pected from meteoric composition (roughly equal amounts
other frequently observed anions like NO− , NO−           −              of Fe, Mg, and Si) was explained by Cziczo et al. (2001) and
                                                    2 , CN , or
       −
CNO . We therefore conclude that the particles we observe                Murphy et al. (2014) by the low solubility of SiO2 in H2 SO4 .
consist of meteoric material dissolved in sulfuric acid. This            Thus, Si is assumed to be present as a solid inclusion in the
interpretation is fully consistent with the argumentation by             particles and is thereby less efficiently ionized compared to
Murphy et al. (1998) and Cziczo et al. (2001), who measured              the other metals that are dissolved in H2 SO4 .
stratospheric particle composition using a similar laser ion-               Other sources for this particle type, like aircraft or rocket
ization mass spectrometer (Particle Analysis by Laser Mass               exhaust, the uplifting of particles (e.g. desert dust) from
Spectrometry; PALMS) on board the WB-57F high-altitude                   Earth’s surface, and volcanic injection, can be ruled out. The
research aircraft between 5 and 19 km altitude. Additional               majority of aircraft traffic does not occur at such high alti-
PALMS measurements from other campaigns (Cziczo et al.,                  tudes at which the meteoric particles were observed during
2001, 2004; Murphy et al., 2007, 2014) as well as labora-                the StratoClim campaigns. Rocket exhaust can be ruled out
tory measurements with reference meteoric samples and ar-                because the dominating metal in rocket exhaust particles is
tificial meteorite particles supported the conclusion that the           expected to be aluminium (Voigt et al., 2013). Single-particle
stratospheric particles with mass spectra dominated by Mg                mass-spectrometric measurements of rocket exhaust plumes

Atmos. Chem. Phys., 21, 989–1013, 2021                                                       https://doi.org/10.5194/acp-21-989-2021
J. Schneider et al.: Meteoric material in lower-stratospheric particles 999
Figure 4. Fractional abundance of particles with cation mass spectra dominated by magnesium and iron ions as a function of potential
temperature and latitude (a), as a function of distance to the tropopause and latitude (b), as a function of potential temperature and equivalent
latitude (c), and as a function of ozone and latitude (d). The data of all five UTLS aircraft missions have been merged for this figure (in total
338 354 analysed particles). Also shown in (a) and (c) is the median thermal tropopause (from ECMWF; TP) along with interquartile range
(grey shading) and two dynamical tropopause levels (2 and 5 PVU).
showed ions of chlorine; oxygen; and metals like Al, Fe, Ca, (Gallavardin et al., 2008). In the tropical regions, the uplift-
Na, and K but not magnesium (Cziczo et al., 2002). Fur- ing of particles from the troposphere into the stratosphere
thermore, rocket exhaust plumes would hardly lead to the occurs especially in the AMA (Randel et al., 2010; Pan et al.,
observed uniform and wide geographical distribution of the 2016; Yu et al., 2017) and might also carry dust particles into
particle fraction. Volcanic aerosol particles have been mea- the stratosphere. However, to explain the stratospheric abun-
sured in the tropopause region and lowermost stratosphere dance fraction of the observed Fe- and Mg-rich particle type,
after eruptions of Kasatochi and Sarychev (Andersson et al., this particle type would need to be found already during the
2013). These data show that volcanic aerosol particles con- upward transport in the AMA, which is clearly not the case
tain a larger weight percentage of carbonaceous material than (Fig. 4). The mean mass spectra and the vertical profiles of
of ash, which is not reflected in our measurements. Further- another prominent particle type containing Fe, K, and Na, as
more, volcanic ash particles indeed contain not only a num- well as smaller signals of Mg and Ca, is shown in Fig. 5.
ber of elements that are abundant in meteorites, like Fe, Si, This particle type was occasionally observed in the strato-
Ca, and K, but additionally also elements that are charac- sphere (ML-CIRRUS, StratoClim 2017, and CAFE-Africa)
teristic of crustal material like titanium, which was not ob- but in general occurred mainly in the troposphere. We in-
served in our mass spectra. As crustal material that can oc- terpret this particle type as an internal mixture of mineral
cur as particles in the troposphere (like soil dust or desert dust, sea spray, sulfate, and nitrate, due to Na+ , K+ , and Fe+
dust) contains the same elements as the stratospheric parti- cations and chlorine (35 Cl− and 37 Cl− ), nitrate (NO− and
cles we observed (e.g. Na, Mg, Al, K, and Fe), interferences NO− − − − −
2 ), and sulfate (SO , SO2 , SO3 , and HSO4 ) anions. It
with dust particles in the troposphere might be possible, al- was therefore not included in the meteoric dataset discussed
though the ions FeO+ and FeOH+ (m/z 72 and 73) have in this paper. The reason why such particles were found in
not been observed in single-particle spectra of mineral dust the stratosphere during ML-CIRRUS is presumably an out-
https://doi.org/10.5194/acp-21-989-2021 Atmos. Chem. Phys., 21, 989–1013, 20211000 J. Schneider et al.: Meteoric material in lower-stratospheric particles Figure 5. Mean mass spectra and vertical profiles of a particle type containing Na, K, and Fe, with smaller amounts of Mg and Ca. This type, which was observed in all five high-altitude aircraft missions, does not belong to the meteoric particles, although it was sometimes observed at higher altitudes. It can be interpreted as mineral dust, internally mixed with sea spray and secondary inorganic compounds (nitrate and sulfate). Note that during ML-CIRRUS the anion spectra were noisy due to problems with the high-voltage supply of the ALABAMA. Figure 6. Number of analysed single particles as a function of particle size (vacuum aerodynamic diameter, dva ) measured during ML- CIRRUS 2014 (a, c) and StratoClim 2017 (b, d). Panels (a) and (b) show the absolute number of counted particles per size bin; (c) and (d) show the fraction of particles with a meteoric composition signature in the stratosphere (PV > 4 PVU). Error bars were calculated from Poisson counting statistics (number of particles per size bin) and were propagated for the particle fraction. Atmos. Chem. Phys., 21, 989–1013, 2021 https://doi.org/10.5194/acp-21-989-2021
J. Schneider et al.: Meteoric material in lower-stratospheric particles                                                     1001

break of Saharan dust and its transport towards Europe dur-          The observed size range of the meteoric particles between
ing the time of the campaign (Weger et al., 2018). During         about 250 and 1500 nm indicates that their sedimentation
StratoClim 2017 and CAFE-Africa, the vertical uplifting of        may play an important role in the downward transport of me-
such particles of tropospheric origin into the stratosphere can   teoric material through the stratosphere (see Sect. 4). Once
most likely be explained by the Asian and African monsoon         the meteoric aerosol particle material has reached altitude
systems.                                                          levels near the tropopause, its rapid removal out of the strato-
                                                                  sphere due to cross-tropopause exchange and cloud forma-
3.4   Size-resolved fraction of meteoric particles                tion processes is likely.

Both particle mass spectrometers used here (the ALABAMA           3.5   Particle number concentration
and ERICA) determine the particle velocity in the vac-
uum chamber which by laboratory calibration can be con-           It is difficult to estimate accurately the absolute number con-
verted into the vacuum aerodynamic diameter (dva ; DeCarlo        centration of particles containing meteoric material from the
et al., 2004) of each individual particle. To obtain the size     measured particle fraction with our laser ablation mass spec-
distributions shown in Fig. 6a and b, we used logarithmi-         trometers. The main reason is that pure sulfuric acid parti-
cally equidistant size bins between 100 and 2000 nm (ML-          cles are not ablated and ionized by a laser with a wavelength
CIRRUS) and 100 and 5000 nm (StratoClim). These size              of 266 nm because sulfuric acid has a very low absorption
distributions represent the product of instrument efficiency      cross section for wavelengths larger than about 190 nm up to
(inlet transmission, particle detection, and ablation rate) and   visible light (Thomson et al., 1997; Burkholder et al., 2000;
the ambient particle size distribution. Differences between       Murphy, 2007). Thus, the fraction of particles containing me-
the measurements with the ALABAMA during ML-CIRRUS                teoric material will be overestimated due to the presence of
and the ERICA during StratoClim 2017 are therefore mainly         pure sulfuric acid aerosol particles in the stratosphere.
due to the aforementioned differences in instrumental per-            The PALMS instrument, using an ablation laser at 193 nm
formance. The particle sizes were separated between tropo-        (Murphy et al., 1998, 2007, 2014; Cziczo et al., 2001) is able
spheric (PV < 2 PVU) and stratospheric (PV > 4 PVU) con-          to detect pure sulfuric acid particles. The results presented in
ditions.                                                          Murphy et al. (2007) show that the number fraction of the
   In both datasets, the tropospheric particles (green lines)     sulfuric particle type ranges between 10 % and 30 % up to
tend to be smaller than the stratospheric particles (black        8 km above the tropopause and at ozone mixing ratios up to
lines). Figure 6a and b also depict the size distribution of      1200 ppb. These data were obtained at tropical (Costa Rica)
the meteoric particles, and Fig. 6c and d show the ratio be-      and mid latitudes (Texas). In Murphy et al. (2014), the pre-
tween the meteoric particles (also selected for stratospheric     sented number fraction of sulfuric particles measured at mid
conditions) and all stratospheric particles. It turns out that    latitudes ranges between 10 % and 20 %, for ozone mixing
the fraction of meteoric particles is lowest in the smaller-      ratios up to 1800 ppb. We may therefore assume that in our
particle size range for both campaigns: in the ML-CIRRUS          data, where ozone never exceeded 1200 ppb, the underesti-
dataset, the fractional contribution increases from about 0.2     mation of the total analysed particle number due to the pres-
at 250 nm to about 0.5 at 300 nm and remains almost constant      ence of pure sulfuric acid particles is about 20 %, ranging
at 0.5 up to 1000 nm. The StratoClim dataset extends both to      between 10 % and 30 %. This translates into an overestima-
smaller and larger sizes and contains a larger number of parti-   tion of the meteoric particle fraction by the same percent-
cles. Here it can clearly be seen that the fraction of meteoric   age. However, the variation of the pure sulfuric acid fraction
particles is zero at 200 nm, although stratospheric particles     with altitude, potential temperature, latitude, and season is
are detected even below 200 nm. The meteoric fraction rises       not known well enough to apply a correction to our dataset.
to 0.7 at 450 nm and decreases above that size, down to 0.2       Thus, it must be noted that the meteoric particle number frac-
at about 1600 nm. Above that size, only one meteoric par-         tion as well as the following estimation of the absolute num-
ticle was detected, although in total 253 stratospheric parti-    ber concentration of particles containing meteoric material
cles were measured between 1600 and 4400 nm. Thus, the            may be overestimated by 10 %–30 %.
meteoric fraction appears to decrease down to zero above              We estimate the absolute number of meteoric particles by
dva ≈ 1600 nm. This finding is similar to the data shown          multiplying the meteoric particle fraction by the total particle
by Murphy et al. (2014), who found a maximum of mete-             number concentration measured using an independent abso-
oric particles at diameters of around 600–700 nm and a de-        lute particle counting (and sizing) instrument. This process
crease down to zero above dva = 1 µm. However, the frac-          is similar to previous approaches (Qin et al., 2006; Gunsch
tions of meteoric particles below 600 nm is markedly higher       et al., 2018; Froyd et al., 2019).
in our dataset compared to the study of Murphy et al. (2014).         For ML-CIRRUS, we used the Sky-OPC optical parti-
In their dataset, the fraction of meteoric particles decreases    cle spectrometer (Grimm 1.129). The nominal lower cut-
from 0.2 at 600 nm to zero at 500 nm, and no meteoric parti-      off diameter (manufacturer calibration with PSL particles) is
cles were detected below 500 nm diameter.                         250 nm. To account for the refractive index of stratospheric

https://doi.org/10.5194/acp-21-989-2021                                             Atmos. Chem. Phys., 21, 989–1013, 2021
You can also read