A global compilation of U-series-dated fossil coral sea-level indicators for the Last Interglacial period (Marine Isotope Stage 5e) - ESSD
←
→
Page content transcription
If your browser does not render page correctly, please read the page content below
Earth Syst. Sci. Data, 13, 3155–3178, 2021
https://doi.org/10.5194/essd-13-3155-2021
© Author(s) 2021. This work is distributed under
the Creative Commons Attribution 4.0 License.

              A global compilation of U-series-dated fossil coral
              sea-level indicators for the Last Interglacial period
                           (Marine Isotope Stage 5e)
                                        Peter M. Chutcharavan1,2 and Andrea Dutton1
             1 Department   of Geoscience, University of Wisconsin – Madison, Madison, Wisconsin 53706, USA
                 2 Department  of Geological Sciences, University of Florida, Gainesville, Florida 32611, USA
                             Correspondence: Peter M. Chutcharavan (chutcharavan@wisc.edu)

                                 Received: 10 December 2020 – Discussion started: 14 December 2020
                                Revised: 17 May 2021 – Accepted: 25 May 2021 – Published: 2 July 2021

       Abstract. This dataset is a comprehensive, global compilation of published uranium–thorium (U-series) dated
       fossil coral records from ∼ 150 000–110 000 years ago, as well as associated elevation measurements and sam-
       ple metadata. In total, 1312 U-series measurements from 994 unique coral colonies are included in the cur-
       rent version of the dataset, all of which have been normalized and recalculated using the same decay constant
       values. Of these measurements, 444 analyses from 330 colonies are relative sea-level indicators, whereas 15
       analyses from 13 colonies are marine limiting. Two example geochemical screening criteria have been included
       to assist users with identifying altered fossil corals that display geochemical open-system behavior, and the
       originally published interpretations on age quality have been preserved within the sample metadata. Addition-
       ally, a clear distinction has been made between coral colonies that are in primary growth position, which may
       be used for relative sea-level reconstructions, and colonies that have been transported/reworked, which cannot
       be used for these purposes. Future research efforts involving fossil coral sea-level reconstructions should em-
       phasize an “integrated” and holistic approach that combines careful assessment of U-series age quality with
       high-precision surveying techniques and detailed facies/stratigraphic observations. This database is available at
       https://doi.org/10.5281/zenodo.4309796 (Chutcharavan and Dutton, 2020).

1   Introduction and literature overview                             the relationship between orbital forcing, solar insolation, and
                                                                     sea-level/climate change (Chen et al., 1986; Edwards et al.,
Uranium–thorium (U-series) dating of Last Interglacial               1987a, b; Gallup et al., 1994; Stirling et al., 1995, 1998).
(LIG) fossil corals has long been a key component of the pa-         In the last 3 decades, further improvements to existing ther-
leoceanographic toolkit. Early work utilized alpha spectrom-         mal ionization mass spectrometry methods and the develop-
etry, which has analytical uncertainties on the order of sev-        ment of robust inductively coupled plasma mass spectrom-
eral thousand years for LIG fossil corals. Nonetheless, these        etry techniques have continued to push the boundaries of
early studies provided some of the first radiometric age con-        analytical precision, and today many labs routinely gener-
straints on the timing of Late Pleistocene glacial–interglacial      ate coral U-series ages with an analytical precision of several
cycles and were critical for validating the Milankovitch hy-         hundred years for the LIG (e.g., Cheng et al., 2000; Stirling
pothesis (e.g., Broecker et al., 1968; Bender et al., 1979).         et al., 2001; Andersen et al., 2008; McCulloch and Mortimer,
More recently, the advent of modern mass spectrometric U-            2008; Cheng et al., 2013).
series techniques in the mid-1980s reduced analytical un-               Global synthesis studies have estimated that the LIG sea-
certainties of LIG fossil coral U-series ages to 1000 years          level highstand lasted from approximately 129 to 116 thou-
(1 kyr) or less, allowing workers to precisely determine the         sand years ago and that global mean sea level (GMSL) was
timing of the LIG and further refine our understanding of            likely 6–9 m higher than at present (Kopp et al., 2009; Dut-

Published by Copernicus Publications.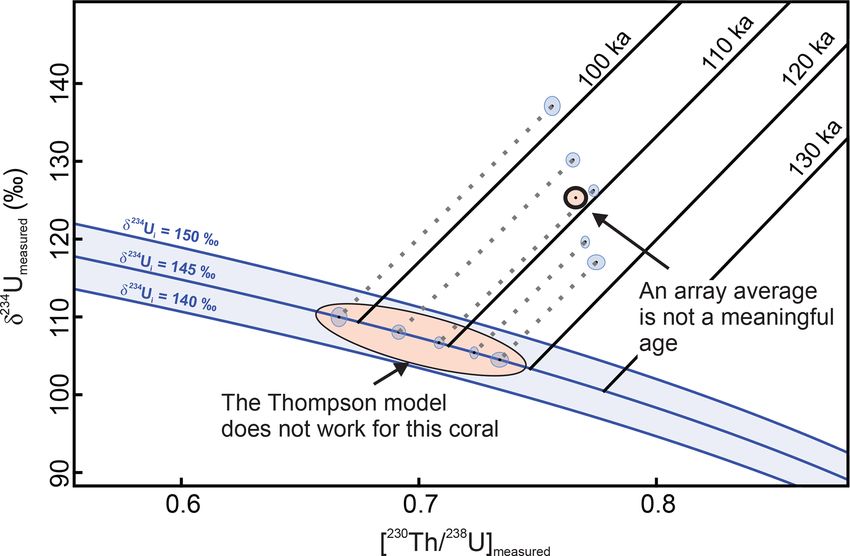
3156                                                 P. M. Chutcharavan and A. Dutton: Last Interglacial fossil coral database

ton and Lambeck, 2012; Masson-Delmotte et al., 2013; Dut-
ton et al., 2015a). However, the rate, timing and magnitude
of GMSL change within the LIG is still debated, with pub-
lished interpretations ranging from a single, stable highstand
peak to multiple peaks separated by ephemeral sea-level falls
(Kopp et al., 2017, and references therein). Reconciling these
different interpretations for how sea level evolved during
the LIG is crucial for improving our understanding of ice
sheet (in)stability during warm periods such as the present
Holocene interglacial and for constraining the future sea-
level response to human-caused climate change.                      Figure 1. Site map of U-series-dated fossil corals compiled for this
   Understanding what the global fossil coral record tells us       study. Sites are differentiated based on regional tectonic setting,
about LIG sea level requires careful interpretations of the         with stable sites marked with a cyan circle, subsiding sites with a
age, elevation and underlying metadata that comprise a coral        purple triangle and uplifting sites with an orange square. Map cre-
                                                                    ated using GMT v5.4.5 (Wessel et al., 2013).
relative sea level (RSL) indicator. This is not a trivial under-
taking, as data reporting protocols vary by research group
and have evolved over the 30+ years that corals have been
                                                                    150–110 kyr and/or (2) derived from a coral colony that was
U-series-dated using mass spectrometry (50+ years if alpha
                                                                    sampled from an LIG fossil reef unit. U-series ages and iso-
spectrometry is considered). It is not only important that the
                                                                    tope ratios were recalculated using the most recent set of de-
originally published information be collated and reported –
                                                                    cay constants for 234 U and 230 Th, to conform to data report-
it must also be standardized. The dataset should also be eas-
                                                                    ing standards that have been established by the U-series com-
ily accessible to users who do not work directly with fossil
                                                                    munity (Cheng et al., 2013; Dutton et al., 2017). Although
coral RSL indicators but require a ready-to-use dataset that
                                                                    comprehensive, this dataset is not necessarily exhaustive, and
has already been quality-checked.
                                                                    we fully expect that the U-series component of WALIS will
   Here we present, to our knowledge, the most comprehen-
                                                                    expand in the coming years as users continue to add legacy
sive compilation to date of U-series-dated fossil coral RSL
                                                                    data and data from newly published studies.
indicators for the LIG as a contribution to the World Atlas
                                                                       We preserved the originally reported values and metadata
of Last Interglacial Shorelines (WALIS, https://warmcoasts.
                                                                    within WALIS, while also producing two pre-screened, in-
eu/world-atlas.html, last access: 20 April 2021). This work
                                                                    terpreted versions of the dataset based on data quality that
builds upon two previous data compilations (Dutton and
                                                                    can assist users with identifying fossil coral U-series dates
Lambeck, 2012; Hibbert et al., 2016) and also includes newly
                                                                    that display open-system behavior. The intention is that this
compiled data from several additional studies (Al-Mikhlafi et
                                                                    combined approach will ensure that this dataset will adhere
al., 2018; Bar et al., 2018; Braithwaite et al., 2004; Dechnik
                                                                    to FAIR data principles, being findable; accessible; interop-
et al., 2017; Kerans et al., 2019; Kindler and Meyer, 2012;
                                                                    erable; and, above all, reusable (Wilkinson et al., 2016). This
Manaa et al., 2016; Muhs et al., 2014; Muhs and Simmons,
                                                                    dataset is open source, and the most recent version can be
2017; Pan et al., 2018; Pedoja et al., 2018; Yehudai et al.,
                                                                    found at https://doi.org/10.5281/zenodo.4309796 (Chutchar-
2017). One advantage of the approach of Dutton and Lam-
                                                                    avan and Dutton, 2020).
beck (2012) and Hibbert et al. (2016) compared to some con-
temporaneous compilations (e.g., Medina-Elizalde, 2013) is
that these studies accounted for subtle but important system-       2    Methods
atic age offsets caused when the compiled data are not nor-
malized to the same set of decay constants for 234 U and 230 Th     This data compilation is one component of the WALIS
and due to variations in spike calibration techniques between       project, which seeks to document all previously published
research groups. This work has been further built upon by           geologic and chronostratigraphic constraints on RSL during
Chutcharavan et al. (2018), who observed that some research         the LIG. Although the primary focus of our contribution is on
groups calibrate their spike’s 230 Th / 238 U activity ratio to a   the U-series aspect of the fossil coral record, this information
standard assumed to be in secular equilibrium (e.g., HU-1),         is inseparable from the elevation information and associated
whereas the 234 U / 238 U activity ratio was calibrated gravi-      metadata when reconstructing RSL at fossil reef sites. A U-
metrically. These considerations are of the utmost impor-           series-dated fossil coral can be used as an RSL indicator, pro-
tance for producing robust interpretations of LIG sea level,        vided that certain criteria are met. In a recent review, Rovere
especially at the millennial scale.                                 et al. (2016) proposed that an RSL indicator has three key
   A site map of all the localities included in the database        components:
is provided in Fig. 1. The dataset includes 1312 individual
U-series measurements and 104 fields for a total of 136 448             1. the indicator’s position, both in terms of geographic co-
entries. All included U-series ages are (1) dated to between               ordinates and relative to an established height datum;

Earth Syst. Sci. Data, 13, 3155–3178, 2021                                            https://doi.org/10.5194/essd-13-3155-2021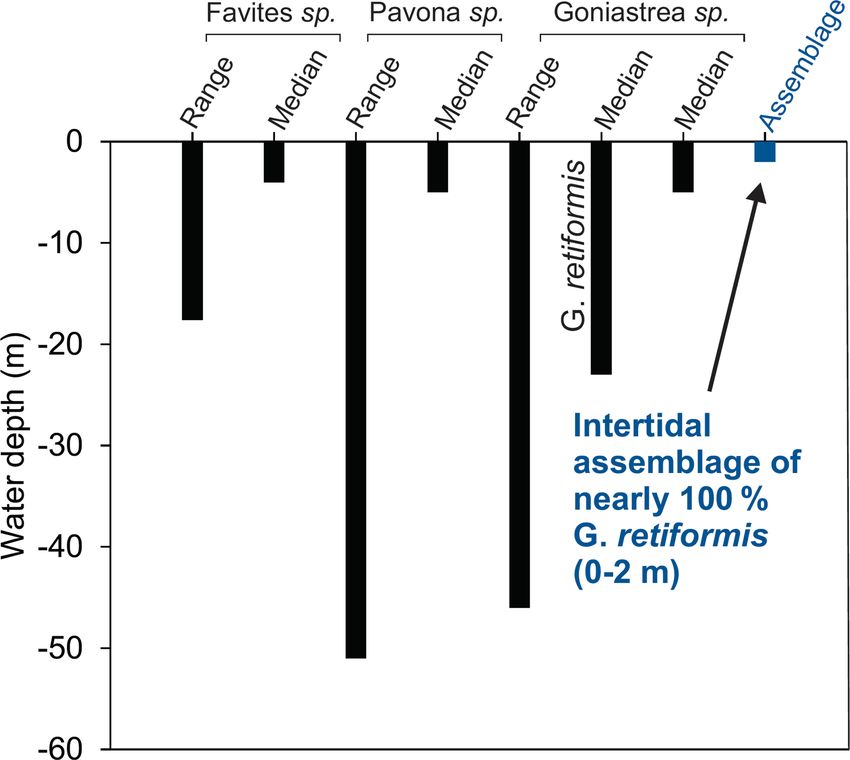
P. M. Chutcharavan and A. Dutton: Last Interglacial fossil coral database                                                         3157

  2. the indicator’s position relative to local sea level at the
     time it was deposited; and
  3. some form of radiometric or chronostratigraphic age
     constraint on the timing of deposit formation.
If a coral with a U-series age has been collected in primary
                                                                    Figure 2. Simplified flowchart of WALIS coral U-series database
growth position and meets criteria 1 and 2, then the coral is       structure. All coral age, elevation and metadata are included in the
considered an RSL indicator. In the absence of paleowater           “U-series” component of the database, whereas the “fossil coral
depth information (i.e., the sample does not meet criterion         RSL” database only includes entries from corals that are in primary
no. 2), corals are generally considered as marine limiting be-      growth position.
cause most coral taxa are limited to below mean lower low
water/mean low water springs (MLLW/MLWS), although
certain coral taxa and growth forms can colonize the inter-         https://doi.org/10.5281/zenodo.3961543 (Rovere et al.,
tidal zone. Hence, in the absence of any additional paleoen-        2020). Published U-series analyses, elevation measure-
vironmental context, sea level is considered to have been at or     ments and relevant metadata for each dated fossil coral are
above the elevation of the top of the coral colony. Fossil coral    uploaded into WALIS either (1) manually via an online
RSL indicators, however, are most useful when the depth at          user interface or (2) with multiple entries at once using a
which the coral was growing is known (see Sect. 2.4).               spreadsheet template. Once entered into WALIS, all of the
   Identification of reliable fossil coral RSL indicators re-       uploaded information is added to the WALIS fossil coral
quires careful vetting of each sample’s age (i.e., diagenetic       U-series database, and each analysis is assigned a unique
screening) and vertical position relative to past sea level. This   identifier (WALIS U-series ID). Finally, all analyses from
is important because ignoring additional relevant observa-          corals that can be used as RSL indicators (i.e., that are both
tions and metadata can result in erroneous conclusions about        in primary growth position and have an associated elevation
past sea-level change. In this compilation, we included new         measurement) are further subset into a fossil coral RSL
paleowater depth interpretations, as well as several screen-        database. Both databases can then be downloaded by any
ing “scenarios” that were designed to screen out altered sam-       WALIS user.
ples using a consistent set of defined criteria. These screen-         This dataset contains several new features that have been
ing scenarios are not intended to be the final word on which        added since the Dutton and Lambeck (2012) and Hibbert et
coral samples should be accepted/rejected in future studies.        al. (2016) compilations. Several key updates are as follows:
Rather, our twin objectives here are (1) to highlight best prac-
tices when interpreting fossil coral RSL data and (2) to pro-         1. New sample identifiers are included, which make it eas-
vide curated example datasets that are immediately available             ier to identify which U-series analyses are associated
to WALIS users seeking a current best estimate of interpreted            with the same coral colony. Sample IDs are reported in
RSL in space and time using the coral data. We caution that              the format XX00-000-000. The first four digits denote
the screened datasets presented here may not identify every              the study that the coral age was published in, whereas
open-system coral, so even U-series ages that pass a partic-             the following sets of three numbers represent the coral
ular closed-system criterion still need to be evaluated in the           sample and U-series analysis, respectively. For exam-
context of existing geologic/sedimentary evidence to assess              ple, CH91-001-002 is the second U-series age reported
whether the age is meaningful. In other words, this screening            for the first coral (here denoted with the number “001”),
process is only the first step in interpreting the sea-level his-        published in Chen et al. (1991). In situations where a
tory based on fossil coral data. Additional stratigraphic, sed-          coral specimen has been reanalyzed in multiple studies
imentologic or other metadata may provide justification to               (e.g., for many samples from Barbados), the first four
modify or reject these preliminary age interpretations. Below,           digits will refer to the oldest paper in which U-series
we explain the method we used to develop these datasets and              ages were reported, while the “references” field will in-
also briefly address the effects of tectonics, glacial isostatic         dicate the study the analysis came from. This ensures
adjustment and dynamic topography on solid-earth displace-               that the user can easily distinguish which samples came
ment, which can cause substantial departures in RSL relative             from the same coral colony, which was not always clear
to GMSL.                                                                 in earlier iterations of this database. This sample naming
                                                                         system has also been utilized for samples dated using
2.1   Database structure and major changes from                          other techniques that are reported in WALIS by other
      previous compilations                                              workers.

A simplified overview of the WALIS U-series fos-                      2. Sample elevations are now reported both in me-
sil coral dataset and workflow is provided in Fig. 2,                    ters above mean sea level (a.m.s.l.) and relative to
and the database field descriptors can be found here:                    MLLW/MLWS. In cases where a proximal tide gauge

https://doi.org/10.5194/essd-13-3155-2021                                           Earth Syst. Sci. Data, 13, 3155–3178, 2021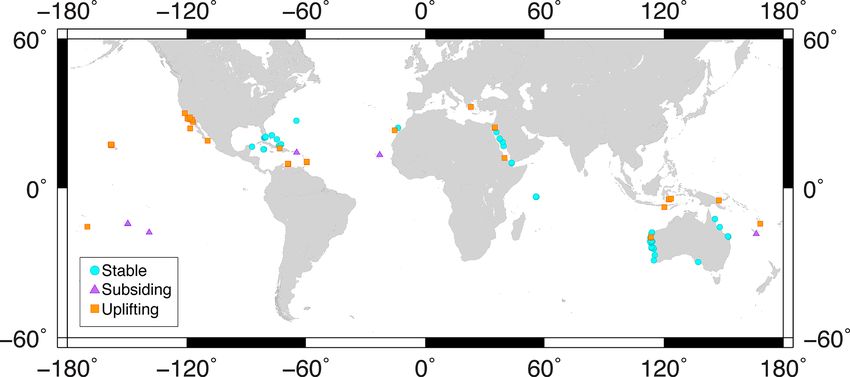
3158                                               P. M. Chutcharavan and A. Dutton: Last Interglacial fossil coral database

    datum was not available, this conversion was done using      2.2   U-series diagenetic considerations
    the IMCalc software package of Lorscheid and Rovere
    (2019).                                                      Corals precipitate their skeletons directly from dissolved
                                                                 ions in seawater, forming a calcium carbonate mineral called
 3. All color coding from the Hibbert et al. (2016) database     aragonite. As part of this process, uranium (U) is incorpo-
    has been removed. This information is now stored in the      rated at parts-per-million concentrations as impurities within
    “comment” columns.                                           the aragonite crystal lattice, and in ideal, closed-system con-
                                                                 ditions thorium (Th) concentrations are negligible. This is
 4. The columns for reporting coral taxonomic information        because of the high particle reactivity of Th, which causes the
    have been revamped to allow entry of family, genus and       element to have a relatively short residence time in the water
    species information for each coral sample. Coral taxa        column. Once the coral skeleton has formed, the U-series ra-
    were updated to reflect the most recent taxonomic clas-      diometric clock is effectively started, and the elapsed time is
    sification as reported by the World Register of Marine       measured by the ingrowth of 230 Th from the radioactive de-
    Species (WoRMS, http://www.marinespecies.org/, last          cay of 234 U and 238 U as the system returns to secular equilib-
    access: 25 February 2019). Reported coral taxonomic          rium (Edwards et al., 1987a, 2003). It is the disequilibrium
    IDs are still preserved, and additional information, such    that arises from the combination of high U concentrations
    as coral morphology, can be added in the comments            and negligible detrital Th content that enables high-precision
    field for this section.                                      U-series dating of coral skeletal material, thus making fossil
                                                                 corals both valuable RSL indicators and an important source
                                                                 of absolute age control for other marine-derived sediments
 5. All U-series ages from transported corals are now
                                                                 (e.g., marine terrace deposits).
    marked as not in primary growth position, even if the
                                                                    Unfortunately, coral skeletal material is also highly sus-
    original publication explicitly states that the sample is
                                                                 ceptible to post-depositional alteration (i.e., diagenesis), par-
    in situ (e.g., an in situ clast/conglomerate).
                                                                 ticularly after exposure to meteoric waters, as is often the
                                                                 case with emergent LIG reef units (Thompson et al., 2003).
 6. We have back-calculated U-series activity ratios, when
                                                                 As a result, a U-series date (i.e., calculated from U-series
    possible, that were not reported in the original publi-
                                                                 measurements without interpretation) must be carefully eval-
    cation and had not already been done by Hibbert et
                                                                 uated for signs of geochemical open-system behavior before
    al. (2016).
                                                                 it can be used to constrain a fossil coral age, which is an
                                                                 interpretation of the U-series date. Prior to U-series dating,
 7. As with Hibbert et al. (2016), all ages and activity ra-     coral samples are frequently prescreened using X-ray diffrac-
    tios, where appropriate, have been recalculated using        tion (XRD) and thin-section microscopy to identify evidence
    the Cheng et al. (2013) decay constants for 230 Th and       of recrystallization and/or alteration of coralline aragonite to
    234 U, and we have normalized reported activity ratios
                                                                 secondary calcite minerals. Even coral samples that do not
    to account for systematic biases due to differences in       have detectable calcite and are not recrystallized can still
    interlaboratory spike calibration techniques. This was       yield anomalously young/old ages for an LIG deposit, indi-
    done using the open-source software EARTHTIME                cating that mineralogically pristine samples can still display
    Redux (ET_redux; https://github.com/CIRDLES/ET_              open-system behavior with respect to U-series isotopes (e.g.,
    Redux, last access: 18 August 2019). Additionally, the       Fig. 3). Therefore, additional geochemical variables are of-
    data normalization procedure now accounts for certain        ten used to evaluate the quality of U-series ages (e.g., see
    cases where the 230 Th / 238 U activity ratio of a labora-   Sect. 2.3).
    tory’s spike was calibrated to a secular equilibrium stan-      Several models have been proposed to correct U-series
    dard, but the 234 U / 238 U activity ratio was calibrated    ages that display open-system behavior, but it is well under-
    gravimetrically. This situation was first addressed for      stood that patterns of diagenesis in altered corals at a study
    fossil coral U-series ages from ∼ 60 to 0 kyr (Chutchar-     site follow multiple diagenetic pathways that cannot be ex-
    avan et al., 2018) but had not yet been applied to the       plained by a single model (Henderson and Slowey, 2000;
    LIG fossil coral dataset.                                    Scholz et al., 2007; Thompson et al., 2003; Villemant and
                                                                 Feuillet, 2003). While there are circumstances in which al-
 8. We have restored some of the original information and        tered coral samples may be good candidates for open-system
    comments from Dutton and Lambeck (2012) that were            correction, this would require further analysis of diagenetic
    not included in the Hibbert et al. (2016) compilation.       trends at each site, which is beyond the scope of this study,
                                                                 as no single open-system model can explain all of diage-
 9. Locality information for Barbados reef terraces have         netic variability in the dataset. For example, the Thompson
    been standardized and reformatted in cases where there       et al. (2003) open-system model is well suited to correct di-
    were multiple names for the same site.                       agenetic arrays common to Barbados and some localities in

Earth Syst. Sci. Data, 13, 3155–3178, 2021                                       https://doi.org/10.5194/essd-13-3155-2021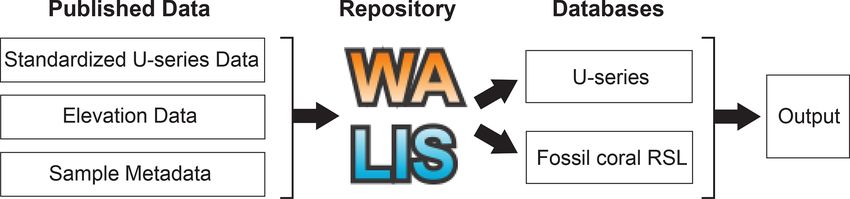
P. M. Chutcharavan and A. Dutton: Last Interglacial fossil coral database 3159
Figure 4. Open-system model of Thompson et al. (2003) applied
to U-series measurements from Seychelles sample DU15-010 from
Fig. 3a (Dutton et al., 2015b). In this case, the diagenetic array is
roughly perpendicular to the open-system isochrons, so the open-
system correction does not change the high degree of age variability
within this coral colony (∼ 20 kyr in total). For this same reason, an
array average does not yield a meaningful age.
2. detrital 232 Th concentrations, where high 232 Th content
can result in anomalously old ages; and
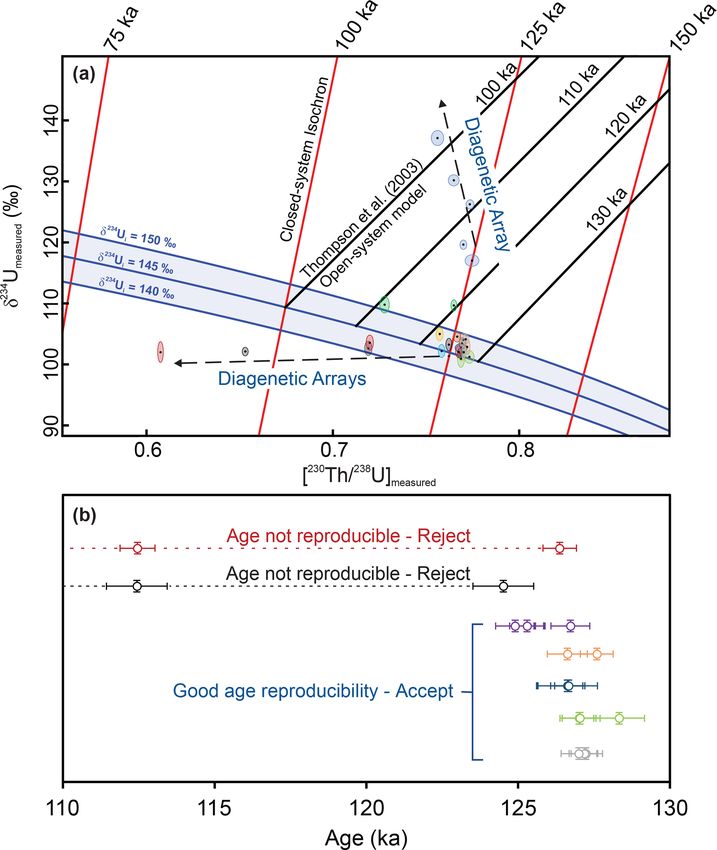
Figure 3. Examples of open-system behavior from LIG fossil coral 3. δ 234 Ui , which, in a closed-system coral, should repre-
U-series data. (a) Evolution diagram with data from the Seychelles sent the uranium isotopic composition of ambient sea-
plotted. Red lines are closed-system isochrons, while black lines water at the time of coral growth.
are open-system isochrons based on the Thompson et al. (2003)
model. Analyses that fall within the shaded blue region are treated For each published data source, the original list of ages that
as closed-system ages, assuming that the δ 234 U value of LIG sea- were accepted/rejected by the study authors is recorded in
water is the same as today (δ 234 Umodern = 145 ‰; Andersen et al., WALIS. It is often difficult to directly compare screened data
2010a; Chutcharavan et al., 2018). Data points that are the same between different publications and research groups, as the
color represent different subsamples from the same coral colony. specific screening criteria applied can vary substantially from
Several prominent diagenetic arrays are indicated with dashed ar- study to study. As a result, previous global fossil coral com-
rows. (b) Analyses from panel (a) that passed closed-system criteria
pilations (Dutton and Lambeck, 2012; Hibbert et al., 2016)
plotted by age. While the red and black measurements individually
meet closed-system criteria, lack of age reproducibility between dif-
have applied these screening criteria uniformly across the en-
ferent subsamples from the same coral colony is indicative of open- tire dataset to ensure that only the most geochemically pris-
system behavior, and these ages should be rejected. Data plotted in tine samples were used for sea-level interpretations. Apply-
panels (a) and (b) from Dutton et al. (2015b). ing a blanket screening criterion, however, results in the vast
majority of U-series analyses being rejected and ignores dif-
ferences that may exist in the nature of diagenesis at different
Western Australia. It does not, however, explain all modes of sites and with different coral taxa. Therefore, we applied two
diagenesis present in the fossil coral record (e.g., Figs. 3a, sets of screening protocols to the dataset: (1) a “strict” pro-
4). Hence, this analysis focuses on assessing closed-system tocol that applies uniform screening cutoffs to each U-series
ages. age based on the three geochemical variables listed above
and (2) a “flexible” protocol that allows for site- and sample-
2.3 Geochemical data quality assessment specific criteria, particularly where multiple subsamples of
the same coral have been dated.
Previous studies typically adopted a set of geochemical The strict screening protocol follows the general approach
screening criteria to remove U-series data that have been of Dutton and Lambeck (2012) and Hibbert et al. (2016),
altered through open-system behavior (e.g., Scholz and with some modification in the case where multiple subsam-
Mangini, 2007). Three of the most common geochemical ples from a single coral specimen were dated. To be accepted,
variables used are a sample must have
1. calcite content; 1. calcite content < 2 %,
https://doi.org/10.5194/essd-13-3155-2021 Earth Syst. Sci. Data, 13, 3155–3178, 20213160 P. M. Chutcharavan and A. Dutton: Last Interglacial fossil coral database
2. detrital 232 Th concentration < 2 parts per billion (ppb), Finally, we expanded the upper limit of the δ 234 Ui thresh-
and old by 2 ‰, so that the new range of acceptable δ 234 Ui values
is 140 ‰–152 ‰, provided that the newly accepted ages are
3. δ 234 Ui within 5 ‰ of the average value for mod-
stratigraphically consistent with the other ages from the site.
ern corals/seawater (∼ 145 ‰; Andersen et al., 2010a;
This was done, in part, because the average δ 234 Usw value
Chutcharavan et al., 2018).
for the LIG is not constrained and there is evidence that the
If any of these values are not reported or cannot be calcu- uranium isotopic composition of seawater has varied by sev-
lated, the U-series age is rejected. Additionally, in the case eral per mil on glacial–interglacial timescales (Chen et al.,
where multiple subsamples of the same coral pass the strict 2016; Chutcharavan et al., 2018). More importantly, it is also
screening criteria, the ages must also be reproducible (i.e., clear that there are likely subtle, unresolved biases in inter-
overlap or nearly overlap within analytical uncertainty) and laboratory calibration protocols that could result in system-
not lie along a diagenetic array (e.g., Fig. 3). Although this atic offsets of a few per mil, depending on the lab where a
last stipulation regarding age reproducibility is necessary to sample was dated (Chutcharavan et al., 2018, and references
evaluate corals with multiple dated subsamples properly, it therein).
has the consequence of biasing the dataset towards corals The purpose of these screening protocols is, specifically,
that have only been dated once but pass the screening cri- to identify the highest-quality closed-system fossil coral U-
teria. Ideally, we would only use fossil coral ages that have series ages that can be used to provide constraints on sea-
been reproduced by multiple subsamples as RSL indicators, level change within the LIG (i.e., on suborbital/millennial
to ensure that multiple subsamples from the same coral spec- timescales). We acknowledged that some users may only be
imen yield reproducible ages. However, this was not feasible interested in knowing whether a geologic feature is broadly
for the dataset considered here, as it would have required re- constrained to the LIG by the fossil coral U-series data, and
jection of nearly all the coral data that were compiled. Al- we have endeavored to make such distinctions where appli-
though the application of uniform screening criteria to the cable in the site descriptions (see Sect. 3). Users are also cau-
global dataset is appealing from a logistical perspective and tioned that the screening protocols provided in this paper are
gives the appearance that data are being treated equally, there only intended as guidelines to assist users with identifying
can be important methodological differences and additional coral U-series ages that display closed-system behavior. A U-
contextual information that cannot be incorporated using a series measurement fitting a set of predetermined geochem-
uniform screening protocol. To address this, we also applied ical parameters does not automatically imply that an age is
a flexible screening protocol that evaluates each study and robust or that it can provide meaningful radiometric age con-
study site independently, so that nuances in U-series age in- straints on LIG sea-level change. Therefore, it is important
terpretations could be evaluated. for the user to carefully evaluate whether a screened age is
Many screening decisions are context based and were ad- consistent with the available geologic context. Additionally,
dressed separately for each site, but some general modifica- the two example screening protocols provided here are by no
tions to the strict screening protocol are addressed here. First, means the only way to screen fossil coral U-series data, and
we expanded the calcite screening threshold to include all we have included a functionality within the WALIS U-series
corals that are below the limit of quantification for the XRD database to upload alternative screening interpretations.
method employed, which can be as high as 4 or 5 % for some
studies.
Second, we allowed for a higher 232 Th threshold of 12 ppb 2.4 Growth position and paleowater depth uncertainties
(i.e., a 230 Th / 232 Th activity ratio of ∼ 500) when age re- 2.4.1 Identifying growth position corals
producibility can be verified by multiple subsamples from
the same coral. This roughly corresponds to a 1 ‰ (or Even if a fossil coral is associated with a robust U-series age,
∼ 0.13 kyr) effect on the measured U-series age, assuming it cannot be treated as an RSL indicator if the vertical posi-
a bulk upper-continental-crust contaminant (Dutton et al., tion of the sample relative to paleo-sea-level is not known.
2015; Taylor and McLennan, 1995; Wedepohl, 1995). Al- This cannot be determined if a coral has been reworked as a
though it has been demonstrated that the composition of de- cobble or clast since it is not known where the sample orig-
trital thorium contamination can depart from bulk crustal inally grew. Therefore, only a fossil coral that has not been
values at different study sites (Cobb et al., 2003; Shen et transported (i.e., is in primary growth position) can be con-
al., 2008), our approach nonetheless offers a first-order es- sidered an RSL indicator.
timate that should approximate the degree of contamination. Determining whether a coral sample is in growth position
Additionally, we accepted samples that do not have detrital from legacy data can be challenging. The reporting criteria
Th information reported in cases where rejecting these sam- used are not standardized across the literature, and even the
ples would have effectively removed the study site from the terminology used can vary from paper to paper, if it is ad-
dataset. Cases where this has been done are noted explicitly dressed at all. Generally speaking, the two most common ex-
in the site summaries. pressions used to indicate that a coral is in place are “growth
Earth Syst. Sci. Data, 13, 3155–3178, 2021 https://doi.org/10.5194/essd-13-3155-2021P. M. Chutcharavan and A. Dutton: Last Interglacial fossil coral database 3161
position” and “in situ”. Growth position is usually interpreted
as expressing greater confidence than in situ, as it implies
that the coral is in the correct growth orientation or that a
clear basal attachment to the reef substrate is visible at the
outcrop scale. For the present study, however, we accepted
corals with either designation as an RSL indicator. Hereafter,
corals that are listed as either in situ or growth position will
be colloquially referred to as in “primary growth position”.
There are two unique circumstances for which additional
information is required to determine if a coral is in primary
growth position. First, some studies refer to a coral spec-
imen as being in primary growth position, yet the deposi-
tional context given clearly indicates that the coral has been
reworked (e.g., “in situ clast” or “in situ conglomerate”). We
interpreted such samples as not being in primary growth po-
sition. Second, we accepted the designation of “coral frame-
work” as equivalent to in situ, and therefore primary growth
position, for samples that were collected via drill core (e.g.,
Camoin et al., 2001; Thomas et al., 2009; Vezina et al., 1999),
because in these cases it was impossible to explore the sam- Figure 5. Comparison of approaches for interpreting sample pa-
ple’s relationship to the rest of the reef unit. It is important, leowater depth based on modern coral depth distributions and reef
however, to recognize that it is possible for coral colonies to assemblages for LIG fossil reef outcrops in the Seychelles. Modern
have been transported but still appear to be in primary growth depth distributions for the genera Favites, Pavona and Goniastrea
position. For example, there are three samples from Stein et (all of which are found in primary growth position in the Seychelles
outcrops) are shown by the black bars in terms of the median and
al. (1993) collected in Papua New Guinea (sample IDs ST93-
total depth range (95 % confidence; OBIS, 2014). The blue bar is
003, ST93-004 and ST93-014) that are reported as being
the paleowater depth interpretation for an intertidal assemblage that
in growth position but are ultimately derived from detached grew in 0–2 m water depth based on facies interpretations of the fos-
limestone blocks and, therefore, were not treated as primary- sil reef outcrops and comparison to modern reef analogues (Dutton
growth-position corals. In some cases, this additional context et al., 2015b).
is not provided in the published literature, and reappraising
the existing stratigraphic evidence at certain field cites may
be warranted (e.g., Skrivanek et al., 2018). However, such an 1982). The assemblage approach is a powerful tool that can
a posteriori assessment is outside the scope of this study and substantially reduce the paleowater depth uncertainty for LIG
the WALIS special issue. fossil reef sites. Assigning paleowater depth ranges based on
fossil reef assemblages does, however, involve a certain de-
2.4.2 Constraining paleowater depth uncertainties
gree of subjectivity. Therefore, users of assemblage-derived
paleowater depth ranges should be aware that these interpre-
After determining that a coral sample has a reliable U-series tations may change after a study’s original publication date
age and is in primary growth position, the final challenge in- if new stratigraphic context and more robust modern and/or
volves determining the paleowater depth uncertainty for the paleoecological studies become available. These are included
coral. As a primary-growth-position coral, we know that the to help define the paleowater depth uncertainty where possi-
sample is, at minimum, marine limiting, as corals from the ble.
highest growth position at an LIG fossil reef site did not nec- A second approach relies upon modern coral depth distri-
essarily grow directly beneath the paleo-sea-surface. Many butions to parameterize paleowater depth uncertainty (e.g.,
of the studies included in our compilation rely on modern Hibbert et al., 2016). A significant drawback of using mod-
analogue studies of present-day reef ecology to constrain pa- ern depth distributions is that relying upon the full range of
leowater depth uncertainties. growth can greatly overestimate the true depth relative to ac-
There are two primary techniques that use the modern ana- tual paleo-sea-level position, as many corals can grow in a
logue approach to constrain paleowater depth (Fig. 5). The wide range of water depths. For example, individual colonies
first technique is an assemblage-based approach, which ex- of the Caribbean coral species Acropora palmata have been
amines a series of variables such as coral taxa/growth forms found growing in water depths up to 22 m in modern reef
present, associated coralline algal species and relevant sed- environments, but this species is more commonly associated
imentary context to identify the most probable depth range with reef crest environments that are < 5 m water depth, with
for the reef unit in which the coral grew (Abbey et al., 2011; a median depth occurrence of −1.5 m (Lighty et al., 1982;
Cabioch et al., 1999; Dechnik et al., 2017; Lighty et al., OBIS, 2014). If field evidence shows that a dated coral was
https://doi.org/10.5194/essd-13-3155-2021 Earth Syst. Sci. Data, 13, 3155–3178, 20213162 P. M. Chutcharavan and A. Dutton: Last Interglacial fossil coral database
part of a Acropora palmata facies where the colonies are in 2.5.1 Tectonic uplift/subsidence
primary growth position, this strengthens the argument that
the coral was growing in the < 5 m water depth as opposed Many of the seminal studies that utilized fossil coral RSL
to closer to the maximum depth range. Therefore, relying on data come from uplifted fossil reef terraces such as those
modern coral depth distributions can, in many cases, substan- found in the island nation of Barbados and on the Huon
tially overestimate the true water depth a fossil coral colony Peninsula in Papua New Guinea (Broecker et al., 1968; Ben-
was growing in, and these depth distributions are not a sub- der et al., 1979; Edwards et al., 1987a; Stein et al., 1993).
stitute for detailed paleoecological and facies analysis. This These sites were targeted largely because the uplifted ter-
is especially true for colonies sampled at or near the highest races facilitated easy sampling of core material without the
occurrence of LIG reef deposits, which were likely growing need for scientific drilling and because the exposed outcrops
at the shallower end of their depth ranges. enabled detailed facies analysis of the fossil reef morphol-
Whenever possible, we used assemblage-derived paleowa- ogy and paleoecology. In contrast, some locations in the
ter depth estimates, which came from either the original WALIS database have experienced subsidence since the LIG.
publication or reinterpretations from a subsequent study. If In many cases, these sites are located on volcanic hot-spot
no paleowater depth constraints were available, then we ap- islands which are subsiding because of crustal loading (e.g.,
plied the taxon-based modern water depth distributions in- Camoin et al., 2001; Thomas et al., 2009).
stead (i.e., the median, upper and lower water depth limits for The challenge of interpreting RSL records at tectoni-
the 95 % confidence level from OBIS, 2014). All paleowater cally active study sites is that the uplift rate must be well
depth interpretations are current as of the date of publication, constrained to extract meaningful information about GMSL
but users are cautioned that some of these interpretations will change. In many cases, previous workers estimated up-
likely need to be revisited in the future as new studies ad- lift/subsidence rates using the highest-growth-position coral
vance our understanding of LIG and modern reef ecology. from an LIG unit (e.g., McMurtry et al., 2010). The general
It should also be noted that in the online WALIS database formula used to correct for tectonic activity is
template there are three values that must be given when as-
Ecorrected = Emeasured − rt, (1)
signing paleowater depth: (1) estimated paleowater depth and
the (2) upper and (3) lower limit of this depth estimate. In the where Ecorrected is the subsidence-corrected elevation,
user interface, the upper depth limit is listed first, followed Emeasured is the present-day elevation, r is rate of elevation
by the estimated paleowater depth and lower limit, with all change (positive if uplifted, negative if subsiding) and t is
depths entered as negative numbers. The estimated paleowa- the age of the sample. The rate of uplift/subsidence is itself
ter depth does not necessarily have to be the midpoint of the determined by
interpreted depth range (e.g., a coral collected from an Acro-
pora palmata reef crest facies with an estimated paleowater (Emax − ELIG )
depth of < 5 m is parameterized as [−5, 0, −5], where the r= , (2)
tLIG
first term represents the position below the sea surface and
the following two terms represent the uncertainty (+, −)). where Emax is the elevation of the highest-growth-position
For simplicity’s sake, in the main text this will be written as coral (regardless of whether the coral has a U-series age),
5 +0/ − 5 m. ELIG is the peak elevation of the LIG highstand based on
GMSL and tLIG is the timing of the LIG highstand. This ap-
2.5 Further elevation uncertainty: causes for RSL proach, however, does not yield the true uplift/subsidence
departures from GMSL rate attributable to local tectonics and/or volcanic loading.
This is because (1) there is still considerable uncertainty sur-
In general, site-specific fossil reef RSL histories for the LIG rounding the actual ELIG value and (2) even if this value
diverge from GMSL because of processes such as regional was well-constrained, both local RSL and the timing of LIG
tectonics, glacial isostatic adjustment (GIA) and dynamic to- highstand would still often depart from ELIG and tLIG be-
pography (Broecker et al., 1968; Farrell and Clark, 1976; cause of GIA effects (Creveling et al., 2015). Therefore, up-
Mitrovica and Milne, 2003; McMurtry et al., 2010; Auster- lift/subsidence rates in this study are included for concep-
mann et al., 2017). Although correcting fossil coral RSL tual purposes only, as uplift/subsidence-corrected coral ele-
records for these processes was not the main focus of this vations do not typically provide precise absolute elevation
study, it is nonetheless important for a user to be cognizant constraints for the position of past sea level.
of this complication when comparing sea-level records from Values used for ELIG and tLIG vary from study to study, so
different sites. It is also worth keeping in mind that, although we standardized the dataset by recalculating r and Ecorrected
all three factors affect the uncertainty in the absolute eleva- for tectonically active sites using a value of 7.5 ± 1.5 m for
tion for coral-derived RSL reconstructions, the relative con- ELIG and 123 ± 6 kyr for tLIG based on the midpoint of LIG
tribution of each varies from site to site. timing and magnitude given by Dutton et al. (2015a). Inter-
preted uplift/subsidence are not prescriptive, and these cor-
Earth Syst. Sci. Data, 13, 3155–3178, 2021 https://doi.org/10.5194/essd-13-3155-2021P. M. Chutcharavan and A. Dutton: Last Interglacial fossil coral database 3163
rections should be reevaluated as new information becomes In summary, there are both local (tectonic) and global-
available. scale (GIA, dynamic topography) processes that can cause
RSL at a fossil reef site to depart from the global mean, and
2.5.2 Glacial isostatic adjustment
they must be accounted for to extract a robust GMSL sig-
nal using U-series ages and elevations of fossil corals. Al-
The advance and retreat of large continental ice sheets dur- though GIA and dynamic topography influence interpreta-
ing the last glacial cycle caused long-lasting, global pertur- tion of RSL compared to GMSL, we do not provide those
bations to the Earth’s gravity field and rotation that persist interpretations here. Instead, this study was undertaken to de-
to this day (Farrell and Clark, 1976; Mitrovica and Milne, fine RSL at each site so that robust RSL interpretations are
2003). This phenomenon, called glacial isostatic adjustment, available that can be used to constrain such processes and, by
can cause meter-scale changes in RSL at fossil reef sites that extension, GMSL.
must be addressed to extract meaningful GMSL information
for fossil coral sea-level indicators (Dutton et al., 2015a). In- 3 LIG fossil coral database
deed, the 6–9 m estimate for the peak magnitude of the LIG
highstand has been inferred from global compilations of RSL An overview of the coral U-series ages available in the
records that were corrected for GIA effects (Dutton and Lam- dataset is included below, organized alphabetically by geo-
beck, 2012; Kopp et al., 2009). graphic study area. Each entry, where appropriate, contains
The magnitude of the difference between RSL and GMSL the following:
at fossil reef sites is spatially variable, depending in part on
the proximity to past continental ice sheets. For instance, 1. the total number of U-series ages available for the study
GIA modeling predicts a gradient in RSL across the circum- area and the number of unique coral specimens dated;
Caribbean region, as many of the sites were sitting atop or
proximal to the peripheral bulge of the Marine Isotope Stage 2. whether any of the corals were dated in duplicate, trip-
(MIS) 6 ice sheet that covered North America (Dutton and licate, etc.;
Lambeck, 2012). This is supported by recent field surveys
3. how many ages were accepted by the original publica-
from The Bahamas, which revealed a ∼ 1 m difference be-
tion;
tween the highest-primary-growth-position corals from LIG
deposits on San Salvador and Great Inagua Island (Skrivanek 4. how many ages (if any) pass the flexible and strict
et al., 2018). In contrast, so-called “far-field” sites such as screening protocols;
the Seychelles and Western Australia are located much far-
ther from continental ice sheets, which reduces the influence 5. identification of corals that pass screening and are in
of GIA and thus enables them to more closely track the mag- primary growth position;
nitude of GMSL change during the LIG (e.g., Dutton et al.,
2015b; O’Leary et al., 2013; Stirling et al., 1998). This re- 6. mention of previous interpretations of paleowater depth
mains an active area of research, particularly for constraining uncertainty and what water depth uncertainties were as-
the global extent and retreat of MIS 6 (∼ 136–129 kyr) con- signed by the present study;
tinental ice sheets (Clark et al., 2020; Creveling et al., 2015;
7. whether the site is tectonically uplifting, subsiding or
Dendy et al., 2017; Hay et al., 2014).
stable; and
2.5.3 Dynamic topography 8. whether the U-series ages have been discussed by other
contributions to the WALIS special issue with regards
Dynamic topography is vertical displacement of the solid to the broader geologic context at each locality.
earth caused by mantle convection. Previous work demon-
strated that the effect of dynamic topography on million-year A summary of the coral U-series ages that passed the strict
timescales is of a similar order of magnitude to apparent and flexible screening protocol is provided in Supplement S1,
changes in GMSL inferred from RSL records (Moucha et and the flexible protocol is also coded into WALIS as the
al., 2008; Müller et al., 2008; Rowley et al., 2013). Recent preferred screening protocol utilized in this paper.
work demonstrated that this is also the case for the LIG, in In total, 141 U-series ages were accepted from 104 unique
that dynamic topography can cause meter-scale differences coral samples that passed the strict screening protocol,
in RSL between the LIG and the present day at some locali- whereas 286 ages from 215 samples were accepted under
ties (Austermann et al., 2017). These studies clearly demon- the flexible protocol (Table 1). Of the samples that were
strate that the effect of dynamic topography on LIG RSL treated as RSL indicators, 59 ages were accepted from 39
records is nontrivial, and further work is needed to assess coral samples under the strict protocol, whereas 150 ages
how mantle dynamic topography may affect interpretations from 112 coral samples were accepted under the flexible
of past sea level from fossil reef sites. protocol. Finally, for the marine-limiting samples, four ages
https://doi.org/10.5194/essd-13-3155-2021 Earth Syst. Sci. Data, 13, 3155–3178, 20213164 P. M. Chutcharavan and A. Dutton: Last Interglacial fossil coral database
from three coral samples were accepted under the strict pro- teristics of the two fossil coral reefs using high-precision sur-
tocol, whereas nine analyses from eight coral samples were veying techniques and published new paleowater depth inter-
accepted under the flexible protocol. We did not include coral pretations (Skrivanek et al., 2018). It is difficult to compare
U-series ages that were measured using the considerably less the present dataset to the reef zones described in Skrivanek et
precise dating method of alpha spectrometry, but the ability al. (2018), as Chen et al. (1991) did not distinguish between
to add alpha dates is present in the WALIS user interface. The reef units in their study. All of the corals in primary growth
addition of alpha spectrometry ages to this dataset by com- position, however, were colonies of Pseudodiploria clivosa
munity members is encouraged, especially for sites where or Orbicella annularis, which were found in units with inter-
mass spectrometric U-series measurements are not available. preted paleowater depths of 0.2–5 m at Devil’s Point reef and
0.2–3 m at Cockburn Town (Skrivanek et al., 2018).
3.1 The Bahamas
Thompson et al. (2011) distinguished corals that were de-
rived from a rubble layer from those collected from the in situ
Corals were U-series-dated from emergent LIG reef deposits reef framework but gave no elevation information associated
on Great Inagua, San Salvador and the Abaco Islands in The with each sample, so none of the samples are used as RSL
Bahamas (Chen et al., 1991; Hearty et al., 2007; Thompson indicators here. Though elevation estimates were provided
et al., 2011). A total of 200 U-series ages from 142 unique in Thompson et al. (2011) for each reef unit, these eleva-
coral specimens were reported, with 29 of these corals dated tions do not always match those subsequently surveyed at the
at least in duplicate. In total, the original study authors ac- same sites, calling into question the use of those approximate
cepted 49 U-series ages from 37 coral samples as closed- elevations (Skrivanek et al., 2018). Primary-growth-position
system ages. Thompson et al. (2011) did not use closed- corals can, however, still be used to constrain the maximum
system ages and instead applied an open-system correction to age of each fossil reef, even without published elevation data.
each sample. Under the strict screening protocol, 35 U-series A total of five corals (11 analyses in total) from Thompson et
ages from 26 coral samples were accepted. This number in- al. (2011) are in primary growth position and passed the flex-
creased to 43 U-series ages from 29 corals when the flexi- ible screening criteria. These ages range from 127.3 ± 0.6 to
ble screening protocol was applied. Sample ages that passed 119.8 ± 0.3 kyr for the Devil’s Point reef and 125.2 ± 1.5 to
flexible screening ranged from 131.3 ± 1.4 kyr for CH91-002 122.2 ± 1.7 kyr for the Cockburn Town reef.
to a weighted mean age of 119.8 ± 0.3 kyr for TH11-023
(weighted mean ages are reported where multiple subsam- 3.2 Baja California, Mexico
ples of the same coral passed the screening criteria).
Several site-specific adjustments were made under the U-series coral ages were reported for three locations along
flexible screening protocol. First, the 232 Th concentrations the Pacific coast of Baja California, Mexico (Muhs et al.,
for Chen et al. (1991) were recalculated using the published 2002a). Corals collected for that study came from detrital
230 Th / 232 Th activity ratios from their supplement, as in cer- sedimentary deposits on marine terraces and, therefore, were
tain cases only one 232 Th concentration was reported for not in primary growth position and cannot be used as strictly
multiple subsamples of the same coral. Second, we only con- reliable RSL indicators. Instead, the study authors used coral
sidered samples that were dated at least in duplicate from U-series ages as a constraint on the maximum age of the ter-
Thompson et al. (2011), as calcite content was not reported races. In total, 26 corals were dated, and the study authors
in that study and there are no elevation data from which accepted 16 of the U-series ages. None of these ages passed
stratigraphic relationships can be derived. Finally, we ac- the strict or flexible closed-system criteria.
cepted ages from sample CH91-023 as closed-system since
the ages were reproducible and calcite content was on the 3.3 Barbados
cutoff threshold at 2 %.
Assessing whether corals from The Bahamas dataset were Barbados is one of the most intensely studied LIG fossil reef
in primary growth position is challenging. Chen et al. (1991) localities in the world, with 141 U-series analyses reported
applied the term “in situ” to describe both growth position for 107 corals from 11 separate studies (Bard et al., 1990;
corals that are part of the reef framework and detrital coral Blanchon and Eisenhauer, 2001; Cutler et al., 2003; Edwards
rubble that had been cemented in place. For the present com- et al., 1997, 1987b; Gallup et al., 1994, 2002; Hamelin et al.,
pilation, we categorized all corals derived from rubble layers 1991; Muhs and Simmons, 2017; Speed and Cheng, 2004;
as “not in primary growth position”. Using this approach, a Thompson et al., 2003). The island is located on an accre-
total of 14 ages from Chen et al. (1991), derived from 11 tionary prism and has experienced differential uplift since the
coral specimens, can be treated as RSL indicators under the LIG. Local uplift rates vary from ∼ 0.2 m/kyr in the north and
flexible screening protocol. Previous workers assigned a pa- south of Barbados to as high as ∼ 0.5 m/kyr near the Cler-
leowater depth range of 3 to 4 m for the Cockburn Town and mont Nose/University of the West Indies transect near the
Devil’s Point sites (Chen et al., 1991). A more recent study, middle of the island (e.g., Muhs and Simmons, 2017; Tay-
however, reevaluated the vertical position and facies charac- lor and Mann, 1991), so care must be taken when applying
Earth Syst. Sci. Data, 13, 3155–3178, 2021 https://doi.org/10.5194/essd-13-3155-2021P. M. Chutcharavan and A. Dutton: Last Interglacial fossil coral database 3165
Table 1. Summary of samples that passed closed-system screening protocols.
Total∗ Published Strict (this study) Flexible (this study)
Location Analyses Samples Analyses Samples Analyses Samples Analyses Samples
Bahamas 200 142 49 37 35 26 43 29
Baja California 26 26 16 16 0 0 0 0
Barbados 141 107 40 33 24 17 41 28
Bermuda 9 9 7 7 2 2 3 3
California 153 148 34 32 0 0 4 3
Canary Islands 2 2 2 2 0 0 0 0
Cabo Verde 10 6 10 6 0 0 1 1
Curaçao 25 5 5 4 1 1 4 3
Eritrea 7 6 6 5 0 0 0 0
Florida 55 51 15 13 4 3 13 10
French Polynesia 19 12 6 3 5 3 9 5
Grand Cayman 15 15 12 12 0 0 0 0
Great Barrier Reef 40 14 11 5 3 2 7 3
Greece 2 2 2 2 0 0 0 0
Gulf of Aqaba 67 18 6 4 2 2 2 2
Haiti 3 2 3 2 0 0 3 2
Hawaii 82 72 59 52 25 23 34 29
Indonesia 21 21 14 14 4 4 10 10
New Caledonia 19 15 0 0 0 0 0 0
Niue 1 1 1 1 0 0 0 0
Papua New Guinea 47 34 11 7 11 5 13 7
Saudi Arabia 25 25 17 17 1 1 2 2
Seychelles 67 31 38 24 5 3 25 14
Southern Australia 4 4 1 1 0 0 0 0
St. Croix, US Virgin Islands 6 6 5 5 4 4 5 5
Turks and Caicos 19 19 13 13 0 0 0 0
Vanuatu 3 2 3 2 3 2 3 2
Western Australia 176 156 59 55 9 5 61 56
Yemen 35 33 0 0 0 0 0 0
Yucatán 33 10 7 5 3 1 3 1
Total 1312 994 452 379 141 104 286 215
∗ Includes all reported analyses and samples (as opposed to the other three pairs of columns, which only include analyses that were accepted by the respective
screening protocol).
subsidence corrections to the Barbados dataset. Additionally, (BL01-001-001) to 172.5 ± 1.4 kyr (GA02-006-001). The
the dataset can be challenging to interpret, as there are mul- oldest age was sampled from “Lazaretto unit”, which is part
tiple names for some localities, and some coral samples have of the LIG Rendezvous Hill terrace, but this unit is actu-
been dated in two or more studies. To facilitate data accessi- ally MIS 6 in age (Speed and Cheng, 2004). It should be
bility, we standardized site location names (e.g., all LIG sam- noted that one sample which passed both screening proto-
ples from the Clermont Nose area were given the site name cols, GA02-032-001 (136.4 ± 0.9 kyr), was rejected, as this
“Univ. West Indies (UWI) Transect”), and we endeavored to age was eventually retracted by the Gallup et al. (2002)
link U-series measurements across multiple studies that were study authors after multiple dated subsamples from the same
derived from the same coral colony. colony were unable to reproduce the reported age. Several of
Of the U-series ages reported, the original study authors the corals were also dated using Pa–Th methods (Cutler et
accepted 40 ages from 33 unique coral specimens. It should al., 2003; Edwards et al., 1997; Gallup et al., 2002).
be noted that Thompson et al. (2003) did not apply closed- Of the samples that passed flexible screening, a total of
system screening criteria; rather, an open-system model was eight U-series ages (six corals in total) came from corals that
used. Under the strict screening protocol, a total of 24 U- were stated as being in primary growth position, with ages
series ages were accepted from 17 corals, whereas the flex- ranging from 103.8 ± 1.0 kyr (BL01-001) to 172.5 ± 1.4 kyr
ible protocol accepted 41 ages from 28 corals. Ages from (GA02-006). The number of RSL data points is increased to
the flexible screening protocol range from 103.8 ± 1.0 kyr 29 ages from 21 corals by including all samples that were
https://doi.org/10.5194/essd-13-3155-2021 Earth Syst. Sci. Data, 13, 3155–3178, 2021You can also read