Drought effects on leaf fall, leaf flushing and stem growth in the Amazon forest: reconciling remote sensing data and field observations
←
→
Page content transcription
If your browser does not render page correctly, please read the page content below
Biogeosciences, 18, 4445–4472, 2021
https://doi.org/10.5194/bg-18-4445-2021
© Author(s) 2021. This work is distributed under
the Creative Commons Attribution 4.0 License.

Drought effects on leaf fall, leaf flushing and stem growth
in the Amazon forest: reconciling remote sensing data
and field observations
Thomas Janssen1 , Ype van der Velde1 , Florian Hofhansl2 , Sebastiaan Luyssaert3 , Kim Naudts1 , Bart Driessen4 ,
Katrin Fleischer5 , and Han Dolman1
1 Department of Earth Sciences, Vrije Universiteit Amsterdam, Amsterdam, the Netherlands
2 Biodiversity,
              Ecology, and Conservation Research Group, International Institute for Applied Systems Analysis (IIASA),
Laxenburg, Austria
3 Department of Ecological Science, Vrije Universiteit Amsterdam, Amsterdam, the Netherlands
4 Department of Computer Science, Universidad de Alcalá de Henares, Madrid, Spain
5 Department of Biogeochemical Signals, Max Planck Institute for Biogeochemistry, Jena, Germany

Correspondence: Thomas Janssen (t.a.j.janssen@vu.nl)

Received: 8 February 2021 – Discussion started: 22 February 2021
Revised: 2 June 2021 – Accepted: 21 June 2021 – Published: 29 July 2021

Abstract. Large amounts of carbon flow through tropical              zon basin that flushed leaves at the onset of both droughts
ecosystems every year, from which a part is sequestered in           (+0.9σ ∼ +2.0σ ) showed positive anomalies in remotely
biomass through tree growth. However, the effects of ongo-           sensed enhanced vegetation index, while sun-induced fluo-
ing warming and drying on tree growth and carbon seques-             rescence and vegetation optical depth were reduced. The pre-
tration in tropical forest is still highly uncertain. Field obser-   viously observed counterintuitive response of canopy green-
vations are sparse and limited to a few sites, while remote          up during drought in the Amazon basin detected by many re-
sensing analysis shows diverging growth responses to past            mote sensing analyses can therefore be a result of enhanced
droughts that cannot be interpreted with confidence. To rec-         leaf flushing at the onset of a drought. The long-term esti-
oncile data from field observations and remote sensing, we           mates of leaf litterfall and stem growth point to a decline in
collated in situ measurements of stem growth and leaf lit-           stem growth and a simultaneous increase in leaf litterfall in
terfall from inventory plots across the Amazon region and            the Amazon basin since 1982. These trends are associated
other neotropical ecosystems. These data were used to train          with increased warming and drying of the Amazonian cli-
two machine-learning models and to evaluate model perfor-            mate and could point to a further decline in the Amazon car-
mance on reproducing stem growth and litterfall rates. The           bon sink strength.
models utilized multiple climatological variables and other
geospatial datasets (terrain, soil and vegetation properties)
as explanatory variables. The output consisted of monthly
estimates of leaf litterfall (R 2 = 0.71, NRMSE = 9.4 %)             1   Introduction
and stem growth (R 2 = 0.54, NRMSE = 10.6 %) across the
neotropics from 1982 to 2019 at a high spatial resolution            Tropical forests, in particular in the Amazon basin, contribute
(0.1◦ ). Modelled time series allow us to assess the impacts         substantially (∼ 25 %) to the terrestrial carbon sink (Brienen
of the 2005 and 2015 droughts in the Amazon basin on                 et al., 2015; Pan et al., 2011). The Amazon forest alone cur-
regional scales. The more severe 2015 drought was esti-              rently stores an estimated 100 to 115 Pg of carbon in living
mated to have caused widespread declines in stem growth              biomass, and intact forests have taken up an additional net
(−1.8σ ), coinciding with enhanced leaf fall (+1.4σ ), which         0.43 Pg of carbon each year through tree stem growth since
were only locally apparent in 2005. Regions in the Ama-              the 1980s (Feldpausch et al., 2012; Phillips et al., 2017). It

Published by Copernicus Publications on behalf of the European Geosciences Union.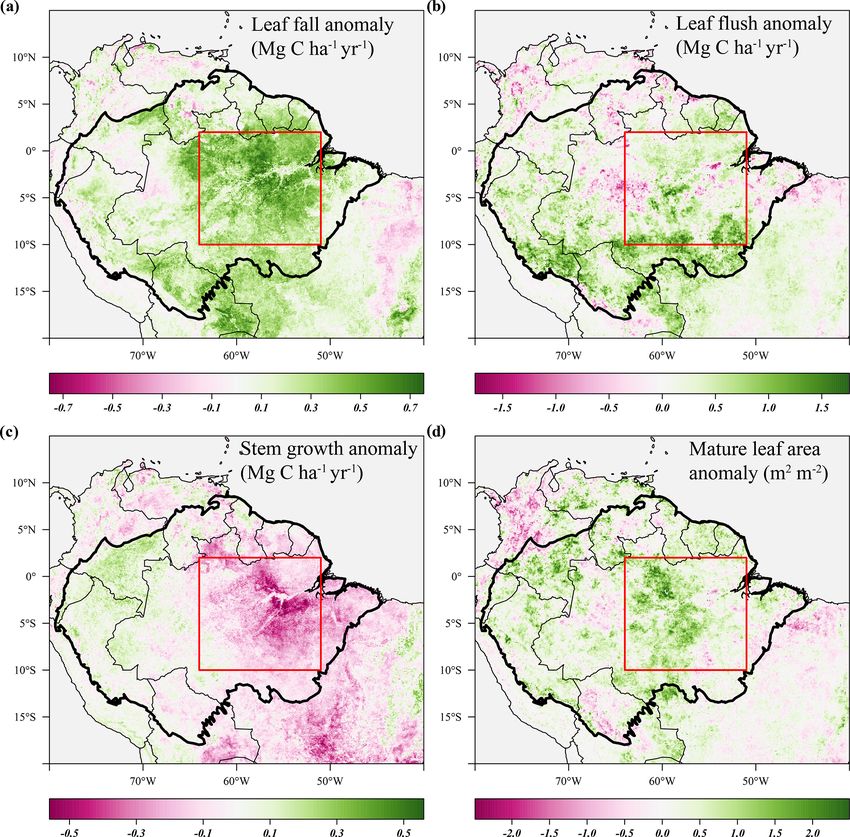
4446                                             T. Janssen et al.: Drought effects on leaf fall, leaf flushing and stem growth

thereby acts to reduce the impact of deforestation and fossil         The discrepancy between drought responses observed in
fuel emissions on the atmospheric CO2 growth rate and miti-        remote sensing products can partly be explained by the elec-
gates global climate change (Phillips et al., 2017). Most land     tromagnetic spectrum that the sensors utilize, so that the re-
surface models project that the Amazon carbon sink will be         trieved signal is sensitive to different vegetation properties.
sustained throughout the 21st century, mainly driven by the        Vegetation indices derived from multispectral sensors that
positive effect of elevated atmospheric CO2 on plant growth        utilize red and near-infrared bands in the spectrum are sensi-
(i.e. CO2 fertilization) (Holm et al., 2020; Rammig et al.,        tive to vegetation greenness and consistently show canopy
2010). In addition, forest plot inventory data suggest a per-      green-up during and just after drought (Gonçalves et al.,
sistent carbon sink in intact Amazonian forests (Phillips et       2020; Lee et al., 2013; Saleska et al., 2007; Yang et al., 2018).
al., 2008) although the sink strength (i.e. the rate of net car-   However, the apparent green-up during drought has been
bon uptake) has been declining since the start of the 21st cen-    coined an artefact and has been attributed to changes in atmo-
tury (Brienen et al., 2015; Hubau et al., 2020). The decline       spheric properties during drought (Asner and Alencar, 2010;
in the carbon sink strength is mainly driven by increased          Samanta et al., 2010), to changes in sun-sensor geometry
tree mortality, while tree growth remained relatively stable       (Morton et al., 2014) and to structural changes in the forest
(Brienen et al., 2015). This suggests that the positive effect     canopy (Anderson et al., 2010). Furthermore, other evidence
of elevated atmospheric CO2 on plant photosynthesis and            from remote sensing analyses also seems to contradict the
growth may increasingly be cancelled out by other limiting         Amazon green-up during drought hypothesis (Anderson et
factors, such as nutrient availability (Fleischer et al., 2019;    al., 2018; Xu et al., 2011). Firstly, sun-induced fluorescence
Hofhansl et al., 2016; Lapola et al., 2009). Additionally, the     (SIF), measured with hyperspectral sensors and regarded a
Amazon region is experiencing a change in the hydrological         good proxy of canopy photosynthesis, is generally found to
cycle with increasing wet season precipitation and flooding,       decrease during drought (Koren et al., 2018; Lee et al., 2013;
a decline in dry season precipitation, more frequent episodic      Yang et al., 2018). Secondly, remotely sensed passive and ac-
droughts, and increasing regional air temperatures (Cox et         tive microwave data show clear negative anomalies in vege-
al., 2008; Fu et al., 2013; Gloor et al., 2013; Janssen et al.,    tation optical depth (VOD) and radar backscatter in response
2020a; Jiménez-Muñoz et al., 2016). In light of these ob-          to drought in the Amazon basin; both metrics are considered
served changes in regional climate and forest functioning,         sensitive to vegetation water content and biomass (Frolking
it is highly uncertain whether intact Amazonian forest will        et al., 2011, 2017; Liu et al., 2018b; Saatchi et al., 2013).
continue to act as a carbon sink in the future or will become a    For example, monthly observations of remotely sensed radar
net source of CO2 that could amplify global climate change         backscatter showed clear negative anomalies during the 2015
(Boisier et al., 2015; Fu et al., 2013; Janssen et al., 2020a;     drought in the central Amazon that were correlated to in situ
Malhi et al., 2009a; Marengo et al., 2010).                        observed declines in stem diameter growth (van Emmerik et
                                                                   al., 2017). There is currently a lack of understanding of how
1.1    How sensitive is tree growth to drought in                  observed remote sensing responses to drought translate into
       Amazonian forests?                                          actual responses of above-ground forest growth and function-
                                                                   ing in tropical forests.
Past responses of the Amazon forest productivity to droughts
have been studied using satellite remote sensing analyses and      1.2   What is known about the drivers of stem and
field observations but sometimes with conflicting results. For           canopy growth?
example, many field observations show clear reductions in
tree stem growth during drought (Feldpausch et al., 2016;          Total plant growth or biomass production is commonly di-
Hofhansl et al., 2014; Rifai et al., 2018), while others found     vided into leaf growth, stem and branch growth, fine and
no reductions in stem growth during a drought (Doughty             coarse root growth, and reproductive growth. Besides quan-
et al., 2015a; Phillips et al., 2009). Remote sensing stud-        tifying total biomass production, it is relevant to know how
ies complemented field observations and provided useful in-        biomass production is partitioned, because biomass in short-
sights into the responses of forest productivity and above-        lived leaves and fine roots has a much shorter residence time
ground biomass to drought over time on regional and global         compared to biomass in stems, branches and coarse roots. In
scales (e.g. Liu et al., 2018b; Saleska et al., 2007). How-        neotropical forests, the relative allocation of carbohydrates
ever, as remote sensing techniques measure electromagnetic         to biomass production in the canopy, stem and roots varies
radiation, it is notoriously difficult to interpret an observed    both spatially with climate and differences in soil proper-
drought response in remote sensing data and translate this         ties (Hofhansl et al., 2015, 2020) as well as over time with
response into a quantifiable change in growth or ecosystem         changes in water availability, air temperature and insolation
carbon uptake (Mitchard et al., 2009a, b). Furthermore, dif-       (Doughty et al., 2014, 2015a; Girardin et al., 2016). Stem
ferent remote sensing sensors sometimes point to contrasting       growth is mostly estimated using a combination of dendrom-
responses of forest productivity to drought and seem to devi-      eter measurements and allometric equations (e.g. Malhi et
ate from ground observations (Anderson et al., 2010).              al., 2009b). Canopy growth is often determined by quantify-

Biogeosciences, 18, 4445–4472, 2021                                                   https://doi.org/10.5194/bg-18-4445-2021
T. Janssen et al.: Drought effects on leaf fall, leaf flushing and stem growth                                                   4447

ing the amount of litterfall that is collected in so-called lit-    2     Methods
ter traps (e.g. Chave et al., 2010). In neotropical forest plots,
stem growth increases with soil phosphorus availability, soil       2.1    Inventory data
clay fraction and mean annual precipitation (Aragão et al.,
2009; Banin et al., 2014; Hofhansl et al., 2015; Quesada et         We searched the available literature using the Google,
al., 2012; Soong et al., 2020). In contrast, the spatial vari-      Google Dataset Search and Google Scholar search engines
ability in canopy production between sites is not explained         for reported stem growth and litterfall data collected between
by differences in mean annual precipitation or soil properties      1981 and 2019 at sites across tropical and subtropical South
(Chave et al., 2009). Therefore, the drivers of the spatial vari-   and Central America between 30◦ S and 30◦ N. The search
ability in canopy growth across neotropical forests remain          time span was chosen to match that of the ERA5-Land cli-
largely unknown.                                                    mate dataset that provided the explanatory variables in the
   In humid Amazonian and other neotropical forests, leaf           empirical models (see Sect. 2.4). Search terms included leaf
flushing in the early dry season results in the increase in         litterfall, litterfall, litterfall production, stem growth, diam-
canopy growth and a simultaneous decline in stem growth             eter growth and tree growth. In addition, the Spanish and
(Doughty et al., 2014; Girardin et al., 2016; Hofhansl et al.,      Portuguese literature was searched for studies that reported
2014). The decline in stem growth during the dry season in          litterfall production with the key words producción de ho-
humid forests is not related to a decline in overall biomass        jarasca and produção de serapilheira, respectively.
production but is related to a shift in carbohydrate allocation         Monthly values of stem growth and litterfall were ex-
from the root and stem towards the canopy (Doughty et al.,          tracted from existing datasets as well as published papers
2014, 2015b). In tropical dry forests, leaf litterfall increases    and compiled into a new dataset together with the month
in the dry season, and leaf flushing is delayed until the start     and year of observation, site name, location and data source
of the wet season when soil water is replenished (Sanches           (see Data availability). The majority of monthly data were
et al., 2008; Selva et al., 2007). Furthermore, the rate of dry     extracted from published figures in individual papers using a
season litterfall is observed to be higher near the forest edge     publicly available digitizing tool (Rohatgi, 2018). When the
compared to the interior, associated with drier and warmer          measurement time spanned multiple months or years, for ex-
microclimatic conditions near the forest edge (Schessl et al.,      ample tree census data (e.g. Brienen et al., 2015), instead of a
2008; Sizer et al., 2000). On more-wind-exposed sites in the        well-defined year and month of observation, we included the
neotropics, not seasonality but the sporadic occurrence of          start and end date of the census interval in the dataset. Total
tropical storms is driving the temporal variability in litterfall   fine litterfall (including leaves, fruits, flowers and twigs) and
and canopy growth (Heineman et al., 2015; Liu et al., 2018a;        leaf litterfall were, whenever possible, separately retrieved
Veneklaas, 1991). Finally, hot and dry conditions associated        from the literature. When only leaf litterfall or total fine lit-
with the warm phase (El Niño) of the El Niño–Southern Os-           terfall was provided in the original study, which was the case
cillation (ENSO) and tropical North Atlantic sea surface tem-       for 123 out of 211 studies that reported litterfall data, the
perature anomalies (Marengo et al., 2011) have been linked          missing litterfall data were estimated from a linear relation-
to periods of elevated litterfall (Detto et al., 2018; Thomas,      ship between leaf litterfall and total fine litterfall (R 2 = 0.93,
1999) and reduced stem growth in neotropical forests (Feld-         p
4448                                              T. Janssen et al.: Drought effects on leaf fall, leaf flushing and stem growth

tracted from the global gridded plant traits product of Butler      content (g kg−1 ) by soil total nitrogen content (g kg−1 ) from
et al. (2017). Monthly LAI was extracted for each site from         the SoilGrids dataset (Hengl et al., 2017). Furthermore, the
July 1981 until December 2018 from the Global Data Set              leaf N : P ratio was calculated from the leaf nitrogen (mg g−1 )
of Vegetation Leaf Area Index (LAI3g) (Zhu et al., 2013).           and leaf phosphorus content (mg g−1 ) present in the global
The LAI3g is a validated global product developed using             gridded plant trait dataset (Butler et al., 2017). The gridded
multi-spectral remote sensing data in a neural network algo-        leaf N : P ratio was included into the empirical model as the
rithm, showing reasonable accuracy (RMSE = 0.68 m2 m−2 )            gradient in plant available phosphorus is a key driver of forest
at ground truthing sites in various biomes and no saturation        structure and productivity across the Amazon basin (Quesada
of LAI in dense broadleaf tropical forests (Zhu et al., 2013).      et al., 2012). Finally, the distance to the forest edge was cal-
   In addition to leaf flushing, we estimated the proportion of     culated from the 500 m horizontal resolution above-ground
mature leaf area as                                                 biomass map as the Euclidean distance between every cell
                                                                    and the nearest cell with an above-ground biomass value be-
              −2
              X                                                     low an arbitrary threshold of 50 Mg biomass ha−1 (consid-
LAImature =          (leaf flush · SLA)n .                   (2)
                                                                    ered to not be forest). Because of the relatively high horizon-
              n=−5
                                                                    tal resolution (500 m) of the above-ground biomass map, the
   In neotropical humid forests, newly flushed leaves take ap-      distance to the forest edge could not only identify the dis-
proximately 2 months to fully mature and reach their optimal        tance to large clearings and transitions to more open biomes
photosynthetic capacity about 2–5 months after leaf flushing        but also the distance to smaller clearings and rivers.
(Albert et al., 2018). Therefore, the sum of leaf area flushed         To further expand the number of features available to train
between 2 and 5 months in the past, here termed the mature          the model and to include historical climate data in the model,
leaf area, was thought to be a proxy of canopy photosynthetic       all monthly climate data up to 1 year in the past were sepa-
capacity and canopy greenness.                                      rately added to the model. In this way, the model cannot only
                                                                    choose to use, for example, total precipitation in the present
2.2    Geospatial data and derived features                         month but also the total precipitation in the previous month
                                                                    and the total presentation in the same month 1 year in the
Properties that were not observed at the field plots included in    past to model stem growth and leaf litterfall in that particular
the dataset (see Sect. 2.1) were extracted from multiple grid-      month.
ded geospatial datasets, including soil properties, plant traits,
standing biomass and climate data (Table 1). We included            2.3   Remote sensing data
a broad range of geospatial variables that could possibly be
used to predict the spatial and temporal variability in stem        Reconciling differences between remote sensing observa-
growth and leaf litterfall. However, the remote sensing prod-       tions from different sensors, as well as reconciling field
ucts that were used in the comparison with the model output,        and remote sensing observations, required long-term records
the MODIS enhanced vegetation index (EVI), the vegetation           of remote sensing products from different sensors. The en-
optical depth and sun-induced fluorescence (see Sect. 2.3),         hanced vegetation index (EVI) from the Moderate Resolu-
were not used as explanatory variables in the model to pre-         tion Imaging Spectroradiometer (MODIS) vegetation index
vent interdependencies from occurring between the model             product (MOD13C2 version 6) was used as an indicator of
output and the remote sensing data.                                 vegetation greenness (Gao et al., 2000). EVI is regarded as
   Climate variables were retrieved as monthly averages from        an improved vegetation index compared to the normalized
January 1981 to September 2019 at a 0.1◦ horizontal res-            difference vegetation index (NDVI), as it relies on the blue
olution from the ERA5-Land reanalysis dataset (Hersbach             band next to the red and near-infrared bands and uses aerosol
et al., 2020). In addition, hourly averages of instantaneous        resistance coefficients in its formulation (Huete et al., 2000).
10 m wind gust were retrieved from January 1979 to Septem-          The data were acquired from the website of the United States
ber 2019 at a 0.25◦ horizontal resolution from the ERA5             Geological Survey on a 0.05◦ grid with a 16 d temporal reso-
dataset. From the hourly averages of wind gust, the maxi-           lution from February 2000 up to April 2020. The pixel relia-
mum wind gust in each month was calculated, which is ex-            bility layer that comes with the MOD13C2 product was used
pected to be a good indicator of sporadic high litterfall fol-      to mask out all EVI pixels with unreliable data, keeping only
lowing tropical cyclones (e.g. Whigham et al., 1991).               the most reliable data (pixel reliability = 0) (Didan, 2015).
   The number of explanatory variables, from here on called         Hereafter, the images were averaged to monthly values to be
features, was further expanded by calculating derived fea-          able to compare the EVI to the empirically modelled stem
tures from the aforementioned datasets. Providing the empir-        growth, leaf litterfall and leaf flushing data.
ical model with a large variety of often-related features helps        In addition, we used remotely sensed sun-induced flu-
in building performant models with a relatively low num-            orescence (SIF) data as a proxy of canopy photosynthe-
ber of dependent variables (Guyon and Elisseeff, 2003). The         sis. The SIF data used were retrieved from the recent Sun-
soil C : N ratio was calculated by dividing soil organic carbon     Induced Fluorescence of Terrestrial Ecosystems Retrieval

Biogeosciences, 18, 4445–4472, 2021                                                    https://doi.org/10.5194/bg-18-4445-2021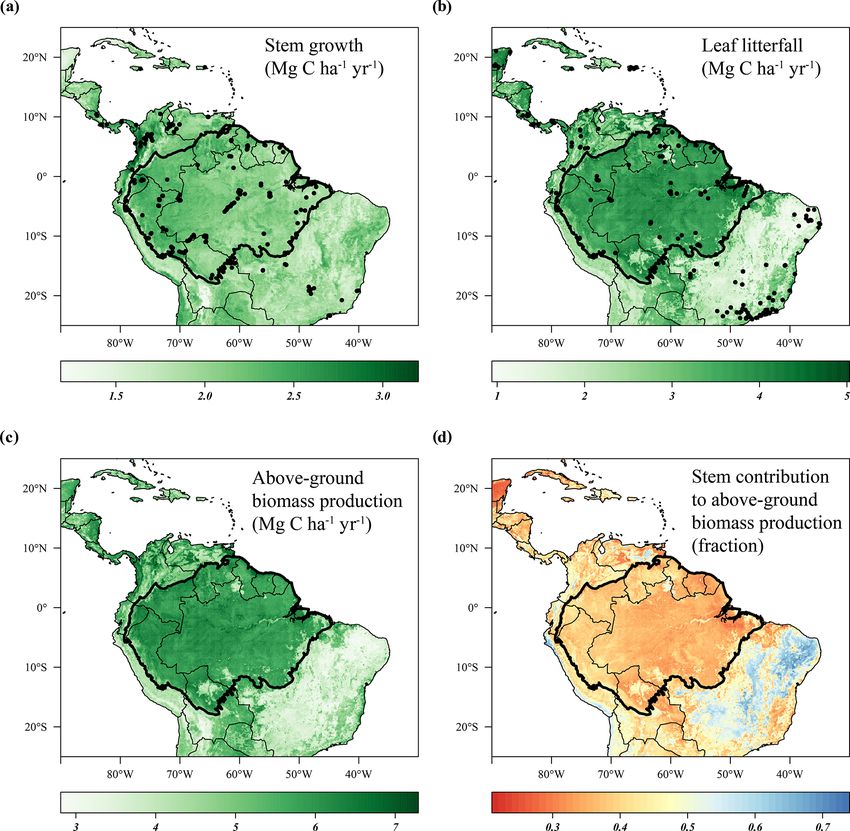
Table 1. Geospatial datasets used as explanatory variables in the XGBoost models. In brackets is the native horizontal resolution of the dataset if a spatially aggregated product was
                                          used. The SoilGrids dataset (Hengl et al., 2017) contains data from seven soil layers at different depths below the surface. For this study, these layers were merged into two layers with
                                          a shallow soil layer (L1–L3) and a deep soil layer (L4–L7).

                                           Product name                            Variables                                          Horizontal resolution    Temporal coverage           Data source
                                                                                                                                                               (dd-mm-yyyy)
                                           Plant traits                            Specific leaf area (m2 kg−1 )                      0.5◦ ∼ 56 km             –                           Butler et al. (2017)
                                                                                   Leaf nitrogen (mg g−1 )
                                                                                   Leaf phosphorous (mg g−1 )
                                           ESA CCI Aboveground Biomass             Above-ground biomass (Mg ha−1 )                    500 m (100 m)            2017                        ESA Climate Change Initiative
                                                                                                                                                                                           (Santoro and Cartus, 2019)

                                           NASA Vegetation Continuous Field        Percentage tree cover (%)                          0.05◦ ∼ 5.6 km           1982–2016                   Hansen and Song (2018)

https://doi.org/10.5194/bg-18-4445-2021
                                           v1 (VCF5KYR)
                                           ALOS elevation and terrain              Elevation (m above sea level)                      1 km (90 m)              2006–2011                   Tadono et al. (2014)
                                                                                   Slope (◦ )
                                                                                   Aspect (◦ )
                                           SoilGrids – global gridded soil data,   Available soil water capacity (%)                  1 km (250 m)             –                           Hengl et al. (2015, 2017)
                                           second version (2017)                   Cation exchange capacity (cmol kg−1 )
                                                                                   Bedrock depth (cm)
                                                                                   Clay, sand and silt fractions (%)
                                                                                   pH measured in water (index)
                                                                                   Organic carbon content (g kg−1 )
                                                                                   Total nitrogen (g kg−1 )
                                                                                                                                                                                                                                       T. Janssen et al.: Drought effects on leaf fall, leaf flushing and stem growth

                                           GFPLAIN250m                             Floodplain presence                                250 m                    –                           Nardi et al. (2019)
                                           ERA5 hourly averaged data               Instantaneous 10 m wind gust (m s−1 )              0.25◦ ∼ 28 km            01-01-1979                  Hersbach et al. (2020)
                                           from 1979 to present                                                                                                01-09-2019
                                           ERA5-Land monthly averaged data         10 m wind speed (m s−1 )                           0.1◦ ∼ 11 km             01-01-1981                  Hersbach et al. (2020)
                                                                                                                                                               01-09-2019
                                           from 1981 to present                    Dewpoint temperature at 2 m (K)
                                                                                   Temperature at 2 m (K)
                                                                                   Evaporation (m of water equivalent)
                                                                                   Leaf area index high vegetation (m2 m−2 )
                                                                                   Surface latent heat flux (J m−2 )
                                                                                   Surface net solar radiation (J m−2 )
                                                                                   Surface sensible heat flux (J m−2 )
                                                                                   Total precipitation (m)
                                                                                   Volumetric soil water in four layers (m3 m−3 )
                                                                                   Skin reservoir content (m)

Biogeosciences, 18, 4445–4472, 2021
                                                                                                                                                                                                                                       4449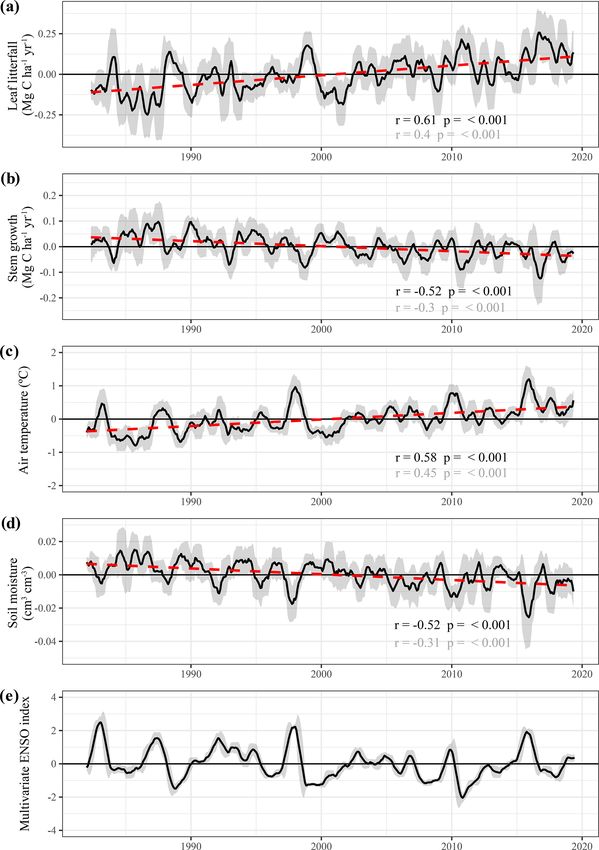
4450                                            T. Janssen et al.: Drought effects on leaf fall, leaf flushing and stem growth

version 2 dataset (SIFTER v2). The SIF measurements               mlr (Bischl et al., 2020) to tune hyperparameters and select
are derived from hyperspectral observations of the GOME-          the final features used in the model.
2 sensor aboard the Metop-A satellite (van Schaik et al.,            Two XGBoost models were constructed to estimate
2020). Monthly point observations of SIF (January 2007–           monthly leaf litterfall and stem growth separately. Before set-
December 2016) were projected on a 0.5◦ global grid and           ting up the models, the stochastic behaviour present in the
spatially aggregated to monthly averages for comparison           monthly time series of leaf litterfall and stem growth was re-
with the field data and other remote sensing datasets.            duced by using a moving average filter with a window size
   Finally, monthly data were also available for vegetation       of 3 months. The 3-month window size, the lowest possi-
optical depth (VOD), a passive microwave product (Liu et          ble window size, was chosen to reduce the sometimes large
al., 2013; Meesters et al., 2005). VOD is directly proportional   month-to-month variation in leaf litterfall and stem growth
to the vegetation water content and therefore sensitive to        while maintaining sufficient variation between consecutive
canopy density and biomass (Jackson and Schmugge, 1991;           months to identify extremes. Furthermore, positive outliers,
Meesters et al., 2005; Owe et al., 2001). Furthermore, the ad-    defined as values higher than 3 times the standard devia-
vantage of also using VOD compared to the MODIS EVI is            tion above the mean, were omitted. The monthly climate
that VOD is unaffected by cloud cover. VOD has been used to       data linked to the stem growth and leaf litterfall observations
study vegetation phenology (Jones et al., 2011, 2014) and to      spanning multiple months to years were averaged using the
monitor global vegetation dynamics (Andela et al., 2013; Liu      start date and end date of the observation interval. To account
et al., 2007, 2013, 2015) and deforestation (van Marle et al.,    for the difference in observation time span, weights were as-
2016). We used C-band (June 2002–December 2018) and X-            signed to the observations in the model as follows:
band (December 1997–December 2018) VOD data from the
global long-term Vegetation Optical Depth Climate Archive         Observation weight = 1 + ln (nmonths ) ,                   (3)
(Moesinger et al., 2020).
                                                                  where nmonths is the length of the time interval in months.
                                                                  By using the natural logarithm to assign weights, observa-
2.4    Data analysis
                                                                  tions covering multiple months to years were assigned 2 to
                                                                  5 times the weight of a monthly observation. This was pre-
Machine learning enables integrating the different spatial and    ferred in contrast to assigning weights directly proportional
temporal scales inherent to the field observations in a sin-      to the length of the time interval as this would inflate the
gle method and making predictions based on the trends iden-       importance of a few sites with very long observation time
tified in the data. Extreme gradient boosting (XGBoost), a        intervals in the model.
machine-learning method for classification and regression            Model performance was evaluated by dividing all leaf lit-
(Chen and Guestrin, 2016), was used to upscale in situ mea-       terfall and stem growth data into a training dataset containing
surements to estimate monthly leaf litterfall and stem growth     60 % of all observations at each site and a test dataset con-
rates for the neotropics from 1982 to 2019.                       taining the remaining 40 % of the observations. The initial
    The XGBoost algorithm was selected for its demonstrated       XGBoost model was constructed using the default learning
performance when applied to similar environmental science         rate (0.3), and the best model iteration was estimated using
problems such as soil mapping (Hengl et al., 2017) and es-        a 10-fold cross-validation of the training data, selecting the
timating evapotranspiration (Fan et al., 2018). Like other        iteration with the lowest root mean squared error (RMSE)
boosting algorithms, XGBoost uses an ensemble of weak             on the cross-validated data. Next, we filtered out 80 % of the
prediction models, iteratively building each new model to im-     initial 235 features with the lowest feature importance (gain)
prove the prediction of the ensemble of previous models. In       to reduce the dimensionality of the data and speed up sub-
essence, XGBoost constructs a series of relatively shallow re-    sequent tuning. Hyperparameter tuning of all the model pa-
gression trees that provide a continuous output value at each     rameters was done by random search using 1000 iterations
leaf; these output values are summed over all regression trees    and 10-fold cross-validation. Subsequently, feature selection
to derive the final prediction. The output value of each re-      was done to select a maximum of 20 features for each model
gression tree is scaled by a predetermined factor η (learning     with the updated hyperparameters and random search using
rate), which reduces the weight of the individual tree. Ad-       1000 iterations and 10-fold cross-validation. Furthermore, to
justing this factor vigilantly ensures a smooth descent of the    derive an estimate of model uncertainty, two additional XG-
loss function (Chen and Guestrin, 2016). Besides the learning     Boost models were trained and similarly tuned to estimate
rate, XGBoost enables the use of multiple other regulariza-       the model error, which is defined as the squared difference
tion options. The parameters modulating the regularization        between the observed value and the predicted value in the
options in the model (so-called hyperparameters) are tuned        test dataset. The final models with the tuned hyperparame-
to make the final model more robust and prevent overfitting       ters and the 20 selected features were also trained on a sep-
on the training data. Here, we use the R package xgboost          arate training dataset containing data from 60 % of the sites
(Chen et al., 2020) to construct the model and the R package      (instead of 60 % of the data from each site) to validate model

Biogeosciences, 18, 4445–4472, 2021                                                 https://doi.org/10.5194/bg-18-4445-2021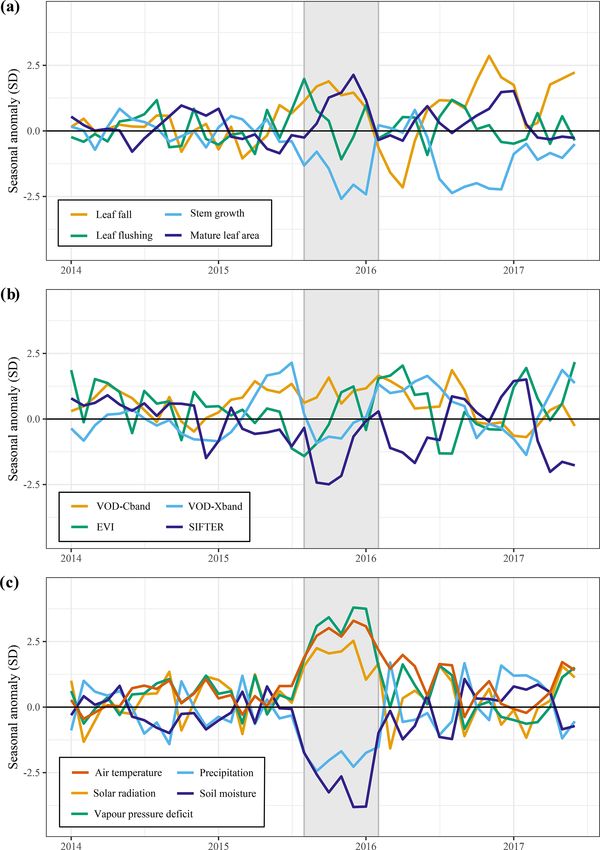
T. Janssen et al.: Drought effects on leaf fall, leaf flushing and stem growth                                                 4451

performance for between site variation. In this second vali-       of the observations resulting in the model estimates moving
dation procedure, complete time series of 60 % of the sites        closer to the observed mean. The underestimation of high
were used as training data to estimate complete time series        values and overestimation of low values of stem growth and
for 40 % of the remaining sites (Fig. S2).                         leaf litterfall are a limitation of this method when using it to
   To evaluate the drought responses of modelled stem              study extreme events like droughts, when extreme responses
growth, leaf litterfall and leaf flushing, two rectangular         of stem growth and leaf litterfall are expected. Therefore, the
drought areas were delineated within the Amazon basin for          results presented here should be considered a conservative or
the 2005 and the 2015 drought period. First, the drought           lower-bound estimate of the actual responses of leaf litterfall
period was identified for both droughts using the average          and stem growth to drought that are observed.
ERA5 topsoil moisture content for the entire Amazon basin.            The number of observations of leaf litterfall and stem
For each month in the time series, the seasonally detrended        growth per year are not evenly distributed over time in the
topsoil moisture content was calculated by subtracting the         dataset (Fig. S3a). The frequency of leaf litterfall and stem
monthly average and dividing by the standard deviation of          growth measurements in the dataset increased in the 1980s
that month. The drought period was defined as the consec-          and the 1990s to a maximum in the first decade of the 21st
utive months with a topsoil moisture content below 1 stan-         century and has since steadily declined (Fig. S3a), presum-
dard deviation (σ ) compared to its monthly average. Sub-          ably as a proportion of the more recent data have not yet been
sequently, a rectangular area was delineated that overlapped       published or are still under embargo. Despite the increase in
those areas within the Amazon basin that showed a topsoil          observation frequency over time, the model uncertainty, ex-
moisture content < − 1.5σ averaged over the entire drought         pressed as the NRMSE, has significantly increased over time
period.                                                            since the 1980s, both for leaf litterfall (r = 0.6, p
4452                                                 T. Janssen et al.: Drought effects on leaf fall, leaf flushing and stem growth

Figure 1. Model evaluation and feature importance. The scatterplots on the left side of panels (a) and (c) show the predicted biomass
production versus the measured biomass production of the test data that were used to validate the stem growth (a) and leaf litterfall (b)
models. The dashed black line is the 1 : 1 line, and the solid black line is the least-squares linear regression fit. The bar graphs on the right
side of panels (b) and (d) show the feature importance (gain) of the top 10 features selected for the final models. Feature names are detailed
in Table 1. Features with lags indicate the value of that climate variable a given number of months in the past (e.g. precipitation lag 11 is the
monthly precipitation 11 months in the past).

difference in the range of the field data (Fig. 1a, b). Although           , b). Furthermore, low stem growth and leaf litterfall rates
the spatial patterns in stem growth and litterfall rates differed,         are also observed in the montane environments of the Andes
some general trends can be identified. Relatively low rates of             (Fig. 2a, b). Relatively high rates of predicted stem growth
predicted stem growth and leaf litterfall are observed in the              are found in Central America, along the Pacific coast of
open savanna and xeric shrub ecosystems of the neotropics                  Colombia, and in the northern and western Amazon basin
such as the Cerrado and Caatinga in Brazil, the Llanos sa-                 (Fig. 2a). Leaf litterfall showed relatively high rates in the
vanna in Venezuela, and the Beni savanna in Bolivia (Fig. 2a               remaining Atlantic forest fragments of south-eastern Brazil,

Biogeosciences, 18, 4445–4472, 2021                                                             https://doi.org/10.5194/bg-18-4445-2021
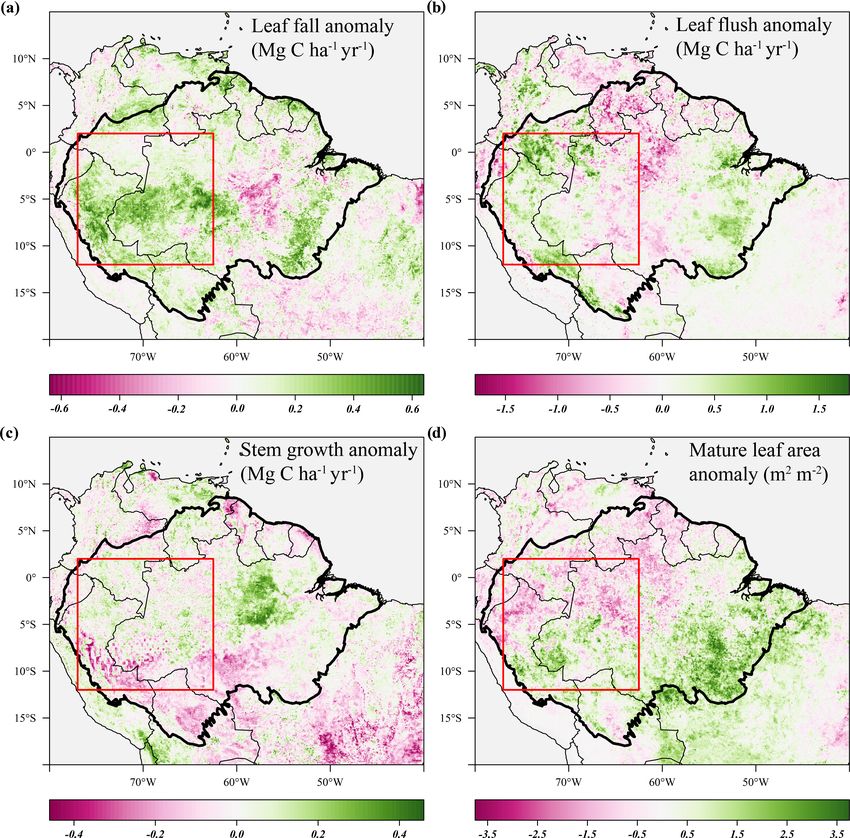
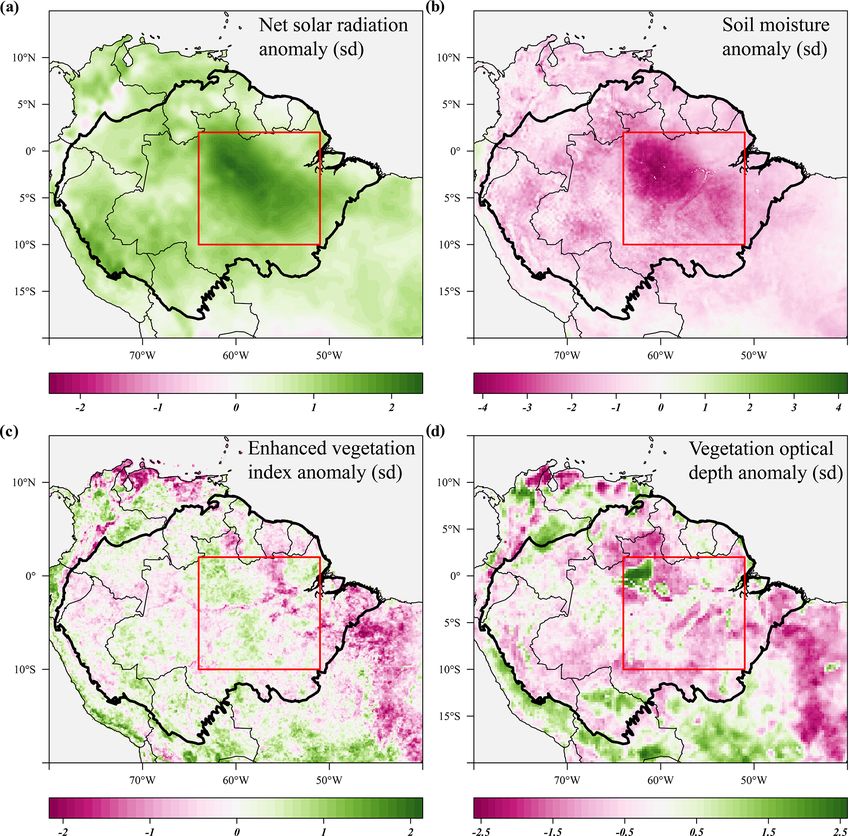
T. Janssen et al.: Drought effects on leaf fall, leaf flushing and stem growth                                                  4453

in Central America and across the forest-covered Amazon                significant negative anomalies in topsoil volumetric moisture
basin (Fig. 2b).                                                       content and positive anomalies in net solar radiation (Fig. 4a,
   As the range in predicted leaf litterfall rates was much            b). During the height of the drought in November 2015, pre-
larger than the range in predicted stem growth rates, the spa-         cipitation (−1.7σ ) and soil moisture (−2.6σ ) were signifi-
tial variability in leaf litterfall rates largely drives the spatial   cantly lower in the drought area compared to their monthly
variability in above-ground biomass production (defined as             average, while air temperature (+2.7σ ), vapour pressure
the long-term sum of leaf litterfall and stem growth) across           deficit (+2.8σ ) and solar radiation (+2.1σ ) were all signifi-
the neotropical ecosystems (Fig. 2c). Furthermore, the pre-            cantly higher compared to their monthly average (Fig. 5c).
dicted stem growth and leaf litterfall data show that in ar-              From August 2015 to January 2016 stem growth was on
eas with a relatively low above-ground biomass production,             average significantly lower (−1.8σ ) in the drought area while
for example in the Cerrado region and the Andes, the con-              leaf fall was higher (+1.4σ ) compared to the long-term av-
tribution of stem growth to the total above-ground biomass             erages for these months (Fig. 5a). In the dry season follow-
production is relatively large (>0.45). In contrast, in areas          ing the 2015 drought, from July 2016 to December 2016,
where above-ground biomass production is relatively high,              stem growth was also significantly reduced in the area af-
for example in the Amazon basin and Central America, the               fected by drought (−2.1σ ), while leaf fall was again elevated
contribution of stem growth to the total above-ground growth           (+1.7σ ) compared to their long-term averages. These results
is relatively low ( 50 %). For the Amazon basin (black contour) the               central Brazilian Amazon, roughly the west half of the de-
average estimated NRMSE is 12.5 % for the leaf litterfall              lineated drought area (Figs. 3d, 4c). However, in the east
model and 16.4 % for the stem growth model. This means                 half of the drought area, mainly negative anomalies in EVI,
that, on average, the error of the model estimates across the          leaf flushing and mature leaf area were visible (Figs. 3b,
Amazon basin is less than 20 % of the average seasonal vari-           d, 4c). This area experiences a relatively long dry season
ability in leaf litterfall and stem growth.                            (≥ 4 months) compared to the forest in the west (
4454 T. Janssen et al.: Drought effects on leaf fall, leaf flushing and stem growth
Figure 2. Predicted stem growth (a), leaf litterfall (b), and total above-ground biomass production (c) and the contribution of stem growth to
the above-ground biomass production (d) across the neotropics from 1982 to 2019. Site locations where stem growth (n = 458) (a) and leaf
litterfall (n = 377) (b) were measured are depicted as solid black circles. Country borders and the extent of the Amazon basin are marked by
thin and thick black lines, respectively.
3.4 Above-ground growth responses to the drought of Similar to the 2015 drought, the estimated leaf litterfall
2005 showed widespread positive anomalies in the 2005 drought
area (Fig. 6a). However, in contrast to 2015, stem growth
The long-term records of predicted leaf litterfall, leaf flush- does not show consistent negative anomalies across the
ing and stem growth enable looking back at changes in es- drought area (Fig. 6c). Leaf flushing shows mainly posi-
timated growth that occurred in response to other historic tive anomalies in the west of the drought area and negative
droughts. The drought of 2005 is considered a particularly anomalies in the east (Fig. 6b), while mature leaf area shows
severe drought in the western Amazon and was the first ma- positive anomalies in the south of the study area and negative
jor drought captured by the MODIS sensors, which led to the anomalies in the north (Fig. 6d).
first observations of Amazon forest green-up during drought The new generation of algorithms and the longer time se-
(Saleska et al., 2007). ries of MODIS EVI data confirm the findings of Saleska
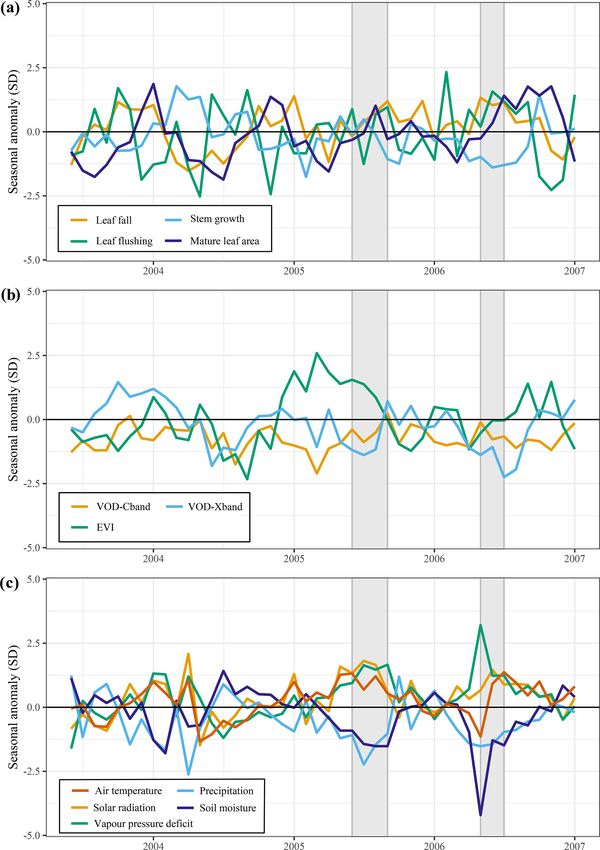
Biogeosciences, 18, 4445–4472, 2021 https://doi.org/10.5194/bg-18-4445-2021T. Janssen et al.: Drought effects on leaf fall, leaf flushing and stem growth 4455 Figure 3. Average anomalies in leaf fall, leaf flushing, stem growth and mature leaf area during the 2015 drought (August 2015–January 2016) compared to their long-term averages (1982–2019). Leaf fall (a) and stem growth (c) were directly retrieved from the long-term monthly model estimates. Leaf flush (b) was calculated from monthly predicted leaf fall (a) and changes in LAI (Eq. 1). Mature leaf area (d) is the sum of new leaf area flushed in the previous 2 to 5 months (Eq. 2). Country borders and the extent of the Amazon basin are marked by thin and thick black lines, respectively. The red rectangle delineates the drought area for which further results are reported. et al. (2007) – i.e. that EVI was significantly and consis- their monthly averages in the drought area (Figs. 7b, 8c). tently higher during the 2005 drought compared to the long- Air temperature (+0.9σ ), vapour pressure deficit (+1.4σ ) term average (Fig. 7c). EVI was significantly elevated before and solar radiation (+1.3σ ) were all higher during the 2005 and at the onset of the 2005 drought (+1.9σ ) in March to drought compared to their monthly averages (Figs. 7a, 8c). May 2005 and remained higher during the height of the 2005 The duration of the 2005 drought (4 months) was shorter drought (+1.3σ ) in June to August 2005 (Fig. 8b). Similar compared to the 2015–2016 drought (6 months), and when to 2015, we find that X-band VOD was significantly lower comparing the seasonal anomalies of the climatic variables in in the drought area during the height of the 2005 drought the drought areas, the 2015 drought was clearly more severe (−1.2σ ) in June to August 2005, while C-band VOD did not and more anomalous compared to the 2005 drought (Figs. 5c, show a clear effect of the 2005 drought (Fig. 8b). 8c). Approximately 1 year after the 2005 drought, another During the 2005 drought (June–September), precipitation short drought hit this part of the Amazon basin, with signifi- (−1.5σ ) and soil moisture (−1.3σ ) were lower compared to cant negative anomalies in topsoil moisture content (−2.3σ ) https://doi.org/10.5194/bg-18-4445-2021 Biogeosciences, 18, 4445–4472, 2021
4456                                               T. Janssen et al.: Drought effects on leaf fall, leaf flushing and stem growth

Figure 4. Standardized anomalies in net solar radiation (a), soil moisture (b), enhanced vegetation index (c) and X-band vegetation optical
depth (d) during the 2015 drought (August 2015–January 2016) compared to their long-term monthly averages. Soil moisture anomalies
are calculated from the ERA-5 volumetric soil moisture in the first soil layer (L1). Country borders and the extent of the Amazon basin are
marked by thin and thick black lines, respectively. The red rectangle delineates the drought area for which further results are reported.

and precipitation (−1.3σ ) and positive anomalies in VPD                lies in leaf fall (+1.2σ ) and leaf flushing (+1.0σ ) and neg-
(+1.9σ ) between May and July 2006.                                     ative anomalies in stem growth (−1.2σ ) and X-band VOD
   In the entire drought area, leaf flushing was higher at the          (−1.6σ ) in May to July 2006 (Fig. 8a). Enhanced leaf flush-
onset (+0.9σ in June 2005) and at the end of the drought                ing during and following this short 2006 drought resulted
(+0.8σ in August–September 2005) and lower at the height                in higher-than-average mature leaf area (+1.5σ ) and EVI
of the drought (−1.3σ in July 2005) compared to the long-               (+0.8σ ) in the months following the drought from August
term monthly average (Fig. 8a). Enhanced leaf flushing at               to November 2006 (Fig. 8).
the onset of the 2005 drought resulted in a higher mature
leaf area (+1.0σ in August 2005) at the end of the drought              3.5   Long-term trends and ENSO effects on
(Figs. 6b, 8a).                                                               above-ground growth
   Compared to 2005, the above-ground growth responses
were more pronounced during the short 2006 drought fol-
                                                                        The long-term monthly estimates of stem growth and leaf
lowing the drought of 2005, with significant positive anoma-
                                                                        litterfall were seasonally detrended (i.e. subtracting the

Biogeosciences, 18, 4445–4472, 2021                                                         https://doi.org/10.5194/bg-18-4445-2021
T. Janssen et al.: Drought effects on leaf fall, leaf flushing and stem growth 4457 Figure 5. Responses of above-ground growth and remotely sensed vegetation properties to the 2015 El Niño drought and key climatic variables. All graphs show the trend in the standardized seasonal anomaly, the deviation from the monthly mean divided by the standard deviation of that month. Leaf fall and stem growth (a) are derived from the two separate XGBoost models providing monthly values from January 1982 until September 2019. Mature leaf area (a) is the sum of flushed leaves from 2 to 5 months in the past. monthly average to omit seasonality) to identify long-term basin between 1982 and 2019 (Fig. 9a). However, this in- trends and multi-year fluctuations in above-ground biomass crease in leaf litterfall is partly offset by a decline in production (Fig. 9). The following statistics are derived stem growth in the same period (r = −0.52, p
4458                                               T. Janssen et al.: Drought effects on leaf fall, leaf flushing and stem growth

Figure 6. Average anomalies in leaf fall, leaf flushing, and stem growth and mature leaf area during the 2005 drought (June–September 2005)
compared to their long-term monthly averages (1982–2019). Leaf fall (a) and stem growth (c) were directly retrieved from the long-term
monthly model estimates. Leaf flush (b) was calculated from monthly predicted leaf fall (a) and changes in LAI. Mature leaf area (d) is the
sum of new leaf area flushed in the previous 2 to 5 months. Country borders and the extent of the Amazon basin are marked by thin and thick
black lines, respectively. The red rectangle delineates the drought area for which further results are reported.

monthly stem growth values were also extracted for the loca-            umetric moisture content declined (r = −0.52, p
T. Janssen et al.: Drought effects on leaf fall, leaf flushing and stem growth                                                         4459

Figure 7. Seasonal anomalies in net solar radiation (a), soil moisture (b), enhanced vegetation index (c) and X-band vegetation optical
depth (d) during the 2005 drought (June–September 2005) compared to their long-term monthly averages (1982–2019). Soil moisture anoma-
lies are calculated from the ERA-5 volumetric soil moisture in the first soil layer (L1). Country borders and the extent of the Amazon basin
are marked by thin and thick black lines, respectively. The red rectangle delineates the drought area for which further results are reported.

biomass production that seem strongly related to ENSO                    4     Discussion
(Fig. 9d). Here, the multi-variate ENSO index is used as a
measure of ENSO phase and intensity (Wolter and Timlin,                  4.1    Drought effects on leaf phenology and canopy
2011). The strong coupling between ENSO and the empiri-                         productivity in neotropical forests
cally modelled leaf litterfall and stem growth rates is to be
expected as the climate variables used to estimate leaf lit-
                                                                         This study aimed to investigate how leaf litterfall, leaf flush-
terfall and stem growth are also strongly impacted by ENSO.
                                                                         ing and stem growth change in response to drought in Ama-
Nonetheless, it is noteworthy that three major El Niño-related
                                                                         zonian forests. The long-term empirically modelled esti-
droughts in 1997, 2010 and 2015 can be identified as periods
                                                                         mates of leaf fall showed that during the peak of the 2005
with high temperatures, relatively low soil moisture, high leaf
                                                                         and 2015 droughts in the Amazon basin, leaf fall was sig-
litterfall and low stem growth (Fig. 9).
                                                                         nificantly higher compared to its monthly averages in these
                                                                         months. Furthermore, estimated leaf fall was also elevated
                                                                         during other historical droughts in 1987, 1997 and 2009–

https://doi.org/10.5194/bg-18-4445-2021                                                           Biogeosciences, 18, 4445–4472, 2021
4460 T. Janssen et al.: Drought effects on leaf fall, leaf flushing and stem growth Figure 8. Responses of above-ground growth and remotely sensed vegetation properties to the 2005 drought (June–September 2005) and key climatic variables. All graphs show the trend in the standardized seasonal anomaly, the deviation from the monthly mean divided by the standard deviation of that month. Leaf fall and stem growth (a) are derived from the two separate XGBoost models providing monthly values from January 1982 until September 2019. Mature leaf area (a) is the sum of flushed leaves from 2 to 5 months in the past. 2010 across the Amazon basin (Fig. 9). These results con- ter use. Next to a progressive closure of the leaf stomata to firm earlier site-specific studies that reported elevated leaf limit transpiration, many tropical tree species are found to litterfall during drought (Bonal et al., 2008; Rice et al., 2008; shed their leaves and thereby reduce the demand of water Roberts et al., 1990; Wieder and Wright, 2001) and during during drought (Wolfe et al., 2016). Therefore, leaf shedding periods of warm and dry conditions associated with a strong in trees helps to limit transpiration during drought and main- El Niño event (Detto et al., 2018; Thomas, 1999). A straight- tain the hydraulic integrity of the water transporting tissue forward explanation of the observed increase in leaf litterfall (Janssen et al., 2020a, b; Wolfe et al., 2016). Although there during drought is that leaf shedding directly reduces tree wa- is a large variability of drought avoidance and drought tol- Biogeosciences, 18, 4445–4472, 2021 https://doi.org/10.5194/bg-18-4445-2021
T. Janssen et al.: Drought effects on leaf fall, leaf flushing and stem growth                                                           4461

Figure 9. Long-term predictions of seasonally detrended anomalies in above-ground growth, air temperature and soil moisture across the
Amazon basin and the relation with the multivariate ENSO index (Wolter and Timlin, 2011). Black lines are the 9-month moving average
of the anomalies, and the dark grey uncertainty bands show the moving standard deviation of the same data. Red dashed lines represent the
least-squares linear regression fit through the averaged time series. Test statistics are provided for both the linear regression of the moving
average (black) and the original monthly data (grey).

erance strategies within Amazonian tree species, with some                   In contrast to leaf litterfall, the estimated seasonally de-
trees maintaining transpiration and leaf area during drought              trended time series of leaf flushing showed positive anoma-
(Bonal et al., 2000a; Brum et al., 2018, 2019; Janssen et al.,            lies in the early and final months of the 2005 and 2015
2020a, b; Maréchaux et al., 2018; Oliveira et al., 2019), if a            droughts (Figs. 5a, 8a). In particular, the pulse of newly
proportion of trees shed their leaves to avoid dehydration, all           flushed leaves in the early months of the 2015 drought re-
other things being equal, this will show up as increased leaf             sulted in above-average mature leaf area (i.e. the sum of
litterfall on the stand scale.                                            leaf area flushed in the past 2–5 months) during the peak

https://doi.org/10.5194/bg-18-4445-2021                                                            Biogeosciences, 18, 4445–4472, 2021
4462                                            T. Janssen et al.: Drought effects on leaf fall, leaf flushing and stem growth

of the drought. A similar response of leaf flushing was ob-       a later El Niño-related drought in 1997 resulted in positive
served during the short drought of 2006 (Fig. 8). Leaf flush-     AVHRR NDVI anomalies across the Amazon basin (Dessay
ing at the onset of a drought is in apparent contradiction with   et al., 2004). Furthermore, during the 2005 drought, posi-
the observed enhanced leaf shedding, which is presumably          tive anomalies in MODIS EVI were visible across the south-
drought-induced to limit transpiration. However, these re-        western Amazon, suggesting that the forest canopy greens
sults can be reconciled as follows: (1) the timing of enhanced    up in response to drought (Liu et al., 2018b; Saleska et al.,
leaf flushing at the onset and end of the drought was differ-     2007). This finding has been disputed and was attributed
ent from the peak in enhanced leaf litterfall during the height   to insufficient atmospheric correction (Asner and Alencar,
of the drought, and (2) leaf litterfall and leaf flushing often   2010; Samanta et al., 2010), sun-sensor geometry (Morton
simultaneously occur in wet tropical forests, sometimes on        et al., 2014) and structural changes in the forest canopy (An-
the same tree or even the same branch (Borchert, 1994). En-       derson et al., 2010). However, our results suggest that the
hanced leaf flushing at the onset of a drought in wet forests     observed green-up during 2005 and especially the later 2015
can be explained by maintained water uptake through deep          drought might not be an artefact in the remote sensing data
soil water access in the early months of a drought (Bonal         but an actual result of increased leaf flushing at the onset of
et al., 2000c; Brum et al., 2019; Meinzer et al., 1999; Nep-      drought.
stad et al., 1994). Furthermore, leaf photosynthetic capacity        It is noteworthy that droughts in which green-up has been
declines with leaf age (Albert et al., 2018; Kitajima et al.,     observed (1997, 2005, 2006 and 2015) occurred during the
2002; Menezes et al., 2021), and the capacity of stomates to      second half of the year (June–December), which encom-
close under dry conditions also declines with leaf age (Reich     passes the dry season and early wet season in the eastern
and Borchert, 1988). Therefore, the shedding of old leaves        Amazon (Sombroek, 2001). Contrastingly, droughts in which
and flushing of new leaves with high photosynthetic capacity      no green-up was observed (1983, 1987, 2010) occurred pre-
and highly responsive stomates might be a suitable strategy       dominantly in the first half of the year and therefore in the
for tropical trees to adopt during drought.                       wet season. As leaf exchange in the Amazon basin occurs
   Those areas in the Amazon basin that experienced in-           in the dry season, drought conditions might accelerate leaf
creased leaf flushing and showed a higher mature leaf area in     flushing synchronous to the general phenology in the dry sea-
2005 and 2015 also showed higher values of the MODIS en-          son but not in the wet season. That green-up during drought
hanced vegetation index (EVI). These results therefore cor-       occurs despite the observed positive anomalies in leaf lit-
roborate the finding that during the 2005 and 2015 droughts,      terfall suggests that during drought, older leaves with lower
large areas within the Amazon basin showed a green-up, vis-       photosynthetic capacity and higher near-infrared absorptance
ible as positive anomalies in the MODIS EVI (Saleska et al.,      (Doughty and Goulden, 2009; Kitajima et al., 2002; Roberts
2007; Yang et al., 2018). Furthermore, these findings support     et al., 1998) are shed, while newly flushed leaves are main-
in situ observations that showed that leaf flushing was signif-   tained. When taking into account the time that newly flushed
icantly enhanced at the end of the 2015 drought in the central    leaves need to fully expand and attain their highest photo-
Amazon, resulting in higher mature leaf area, associated with     synthetic capacity, which is 2–5 months (Albert et al., 2018;
positive EVI anomalies in the year following the drought          Gonçalves et al., 2020; Restrepo-Coupe et al., 2013), it can
(Gonçalves et al., 2020). However, enhanced leaf flushing,        be argued that the observed green-up is not a direct effect of
higher mature leaf area and positive anomalies in the MODIS       drought but rather a consequence of the environmental con-
EVI during the 2015 drought occurred mainly in ever-wet           ditions at the onset of the drought.
forest of the central Amazon experiencing a short dry season         Earlier studies hypothesized that increased incoming so-
(≤ 3 months). The eastern part of the basin that experiences a    lar radiation during drought, as a result of a decline in cloud
moderate to long dry season (>3 months) (Sombroek, 2001)          cover, might be driving the observed green-up (Saleska et
actually showed negative anomalies or no change in leaf           al., 2007). Indeed, both spatial and temporal correlations
flushing, mature leaf area, and EVI (Figs. 3a, d, 4c). These      between photosynthetically active radiation (PAR) and EVI
results suggest that leaf flushing and canopy green-up in re-     were found in response to the 2015 drought (Yang et al.,
sponse to drought only occurs in ever-wet forests which do        2018). Lengthening of the photoperiod has been recognized
not experience a regular long dry season.                         as a key environmental cue for leaf abscission and flushing
   Vegetation indices, such as the EVI and the normalized         across evergreen tropical forests (Borchert et al., 2002, 2015;
difference vegetation index (NDVI), are sensitive to veg-         Elliott et al., 2006). Reduced cloud cover and increased di-
etation chlorophyll content or “greenness” and have often         rect solar radiation reaching the forest canopy at the onset of
been used to assess the effect of drought on the Ama-             an atmospheric drought, when soil water is still readily avail-
zon forest canopy. The earliest effects of droughts observed      able, might therefore present an environmental cue for leaf
with satellites occurred during the 1983 and 1987 El Niño         flushing. This mechanism might explain the positive anoma-
events, which caused negative anomalies in the NDVI from          lies in leaf flushing observed at the onset of the 2005 and
the NOAA Advanced Very High Resolution Radiometer                 2015 droughts (Figs. 5a, 8a). Next to insolation, trees need
(AVHRR) (Asner et al., 2000; Batista et al., 1997). However,      to be well hydrated to enable cell expansion, bud break and

Biogeosciences, 18, 4445–4472, 2021                                                 https://doi.org/10.5194/bg-18-4445-2021
T. Janssen et al.: Drought effects on leaf fall, leaf flushing and stem growth                                                 4463

consequently leaf flushing (Borchert et al., 2002). In addi-        gor loss in the vascular cambium, limiting cell division and
tion, the presence of older leaves in the canopy can inhibit        therefore actual secondary growth (Borchert, 1994; Körner
leaf flushing (Borchert et al., 2002). Therefore, the excessive     and Basel, 2013; Muller et al., 2011; Worbes, 1999). There-
shedding of older leaves during the height of the 2005 and          fore, it is reasonable to assume that water availability directly
2015 droughts and tree rehydration following the first rain         reduced stem growth during drought.
events (Fig. S5) could have acted as a strong environmental            The long-term estimates of stem growth in this study point
cue for the second leaf flushing event that was observed at         to a significant negative trend in stem growth in the Amazon
the end of the 2015 drought (Figs. 5a, 8a) (Gonçalves et al.,       basin between 1982 and 2019 (Fig. 9b), which was not found
2020).                                                              in a basin-wide network of inventory plots for a similar time
                                                                    span (1983–2011) (Brienen et al., 2015; Hubau et al., 2020).
4.2   Drought effects on stem growth in neotropical                 This is surprising as 60 % of the data from these same inven-
      forests                                                       tory plots are used to train the stem growth model and were
                                                                    therefore expected to show similar long-term trends. As the
In contrast to the observed leaf flushing and leaf fall re-         plot scale data are very similar, this discrepancy has to be
sponses to drought, stem growth is significantly reduced in         explained by the method of upscaling these plot scale obser-
the drought areas of the Amazon basin during the 2015               vations. Firstly, the model provides stem growth estimates
drought and to a lesser extent in 2005 and 2006 (Figs. 3c,          for more than 54 000 grid cells covering the entire Ama-
6c). Other historical droughts in the Amazon basin in 1987,         zon basin, whereas the measured stem growth rates are mea-
1997 and 2009–2010 are clearly visible in the long-term             sured at around 320 inventory plots scattered across the basin
estimates as periods of reduced soil moisture and reduced           (Brienen et al., 2015). However, a spatial bias alone does
stem growth across the Amazon basin (Fig. 9). These results         not seem to be causing the discrepancy as a similar negative
generally confirm site-specific studies that found significant      trend in estimated stem growth was visible at the locations of
stem growth reductions in neotropical forests in response to        the inventory plots (Fig. S6). Secondly, the majority of stem
drought. These include the 1997 and 2010 droughts in Costa          growth observations from inventory plots are from the 2000s
Rica (Clark et al., 2003; Hofhansl et al., 2014), the 2008          and 2010s (Fig. S3), while the model estimates go back to
drought in French Guiana (Stahl et al., 2010; Wagner et al.,        1982. If this temporal bias is a factor causing the discrepancy,
2013), and the 2010 and 2015 droughts across the Amazon             it suggests that stem growth in the inventory plots was un-
basin (van Emmerik et al., 2017; Feldpausch et al., 2016;           derestimated in the 1980s and 1990s or that more productive
Rifai et al., 2018). The lack of a clear negative and long-         plots were included in recent years. However, this temporal
term impact of the relatively short 2005 drought on estimated       bias should have been corrected for in the trend analyses of
stem growth in the Amazon basin might explain why field             Brienen et al. (2015) (see also Brienen et al,. 2015, extended
observations failed to observed significant declines in stem        data Fig. 3). Finally, as the model uses the ERA5 long-term
growth during the 2005 drought (Phillips et al., 2009). The         reanalysis data of surface air temperature, precipitation and
relative importance of drought duration, intensity and timing       soil moisture to estimate stem growth, trends in the stem
(wet season or dry season) in limiting stem growth in tropical      growth estimates therefore reflect the trends in the climate
forests remains unclear, and the interactions between drought       data (Fig. 9). As stem growth in the Amazon basin generally
and local conditions (e.g. topography, water table depth, soil      declines in the dry season when soil moisture is low and air
water holding capacity) still need to be disentangled.              temperatures are high (e.g. Doughty et al., 2014; Girardin et
   Stem growth reductions in response to drought can be             al., 2016; Janssen et al., 2020a, b), a trend in soil moisture
expected as tree water status and stem growth are tightly           and temperature might therefore result in a predicted trend
coupled. Firstly, stem wood and bark can store substantial          in stem growth which might not necessarily reflect the ac-
amounts of water, which contribute 5 %–30 % to daily water          tual trend in stem growth. This would mean that the XG-
use in neotropical tree species (Meinzer et al., 2003; Oliva        Boost models exaggerate the contribution of the changing
Carrasco et al., 2015). About 50 % of stem wood and bark            climate variables on the long-term trends in stem growth.
volume consists of water which can in part be withdrawn dur-        Therefore, tree census data from permanent inventory plots
ing drought (Dias and Marenco, 2016; Poorter, 2008). The            (Brienen et al., 2015; Hubau et al., 2020) are essential to be
loss of water from elastic tissue can result in a decline in stem   able to accurately model and upscale stem growth at multi-
growth or even a decline in stem girth (Baker et al., 2002; van     decal timescales
Emmerik et al., 2017; Reich and Borchert, 1982; Stahl et al.,
2010). These elastic changes in stem volume arising from            4.3   What are satellite sensors actually sensing?
changes in stem wood and bark water content do not rep-
resent actual changes in secondary growth. However, these           The controversy surrounding the observation of Amazon
elastic changes are often unintentionally present in dendrom-       canopy green-up during drought is mainly caused by differ-
eter measurements and therefore also in our dataset. Sec-           ences in sensor sensitivity and the interpretation of the re-
ondly, tissue dehydration during drought can cause cell tur-        trieved signals. Generally, canopy green-up is observed in

https://doi.org/10.5194/bg-18-4445-2021                                                    Biogeosciences, 18, 4445–4472, 2021
You can also read