Department of Finance North West Provincial Government Republic of South Africa Provincial Economic Review and Overview 2013 - MACRO-ECONOMIC ANALYSIS
←
→
Page content transcription
If your browser does not render page correctly, please read the page content below
Department of Finance
                    North West Provincial Government
                         Republic of South Africa

                          MACRO-ECONOMIC ANALYSIS

           Provincial Economic Review and Overview
                            2013

                                                       1|P a g e
Macro-Economic Analysis
Executive summary........................................................................................................... 5

Chapter 1 Introduction..................................................................................................... 6

Chapter 2 National and Provincial Strategy overview

Millennium Development Goals ........................................................................................ 8

National Development Plan .............................................................................................. 9

Provincial Growth and Development Plan ......................................................................... 13

Local government strategic policies .................................................................................. 15

Chapter 3 Global Economic Performance

Global Market developments............................................................................................ 17

Emerging and developing markets .................................................................................... 18

Chapter 4 South African Economic Performance

South African economic developments ............................................................................. 20

South African Population .................................................................................................. 22

South African International Trade ..................................................................................... 24

Chapter 5 Provincial Economic Outlook

Provincial Economy........................................................................................................... 27

Economic Performance per Sector .................................................................................... 28

Employment per sub Sector .............................................................................................. 29

Primary Industries............................................................................................................. 30

Secondary Industries ........................................................................................................ 33

Tertiary Industries............................................................................................................. 35

Chapter 6 District Economic Overview
District Economic performance ......................................................................................... 38

District Unemployment and Population growth ................................................................ 39

Composition of District Economies.................................................................................... 40

                                                                                                                                      2|P a g e
Macro-Economic Analysis
Chapter 7 Budget Analyses: economic perspective

Constitutional framework ................................................................................................. 43

Budget Processes .............................................................................................................. 43

Budget process summery .................................................................................................. 44

Chapter 8 National Budget analyses

National Revenue and Expenditure ................................................................................... 45

Composition of National revenue ..................................................................................... 46

National Expenditure and Total Employment .................................................................... 48

Chapter 9 Provincial Budget Analyses

Provincial Budget .............................................................................................................. 50

Composition of Provincial Department Budget ................................................................. 51

Composition of Conditional grants .................................................................................... 54

Provincial Revenue collection ........................................................................................... 56

Provincial Expenditure ...................................................................................................... 58

Impact of provincial budget on economic growth ............................................................. 62

Impact of provincial budget on employment..................................................................... 63

Provincial departmental budget analysis........................................................................... 63

Department of Education and training .............................................................................. 64

Department of Health ....................................................................................................... 68

Department of Public Works ............................................................................................. 73

Department of Human Settlement .................................................................................... 78

Department of Social Development .................................................................................. 80

Department of Local government ..................................................................................... 83

Department of Economic development ............................................................................ 86

Chapter 10 Recommendations ......................................................................................... 90

                                                                                                                                      3|P a g e
Macro-Economic Analysis
Acknowledgement

The following team is acknowledged for their contribution in making this project a success.

Mr Stanley Mampana (Economist)                  : Author

Ms Gloria Kgalalelo Setou (Senior Economist)    : Editor

For enquiries contact: Mr S. Mampana

Tel: (018) 388 3555

E-mail: SMampana@nwpg.gov.za

North West Provincial Treasury

Third Floor

Ga-Rona Building

Private Bag X 2060

Mmabatho

2735

                                                                                              4|P a g e
Macro-Economic Analysis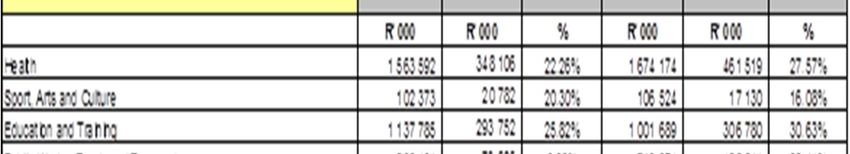
Executive Summary

The North West Provincial Review and Outlook (NWPERO) provides the audience with data and information
which may assist in planning, budgeting, determine the priorities or strategic direction of the province and
prioritization of funding. It is acknowledged that provincial departments across the North West province have
different capacities and therefore will use the information in this publication to align to provincial and national
policies and strategic objectives and priorities.

The publication is also intended to be a barometer that will gage the province’s contribution towards achieving
the key strategic outcomes outlined in the National Development Plan (NDP) of redressing the injustice of the
past through a faster economic growth, higher investment, and employment creation through the important
government tool (provincial budget).

The publication seeks to, in a wider spectrum, encourage informed public policy discourse amongst policy
makers in the public sector, private sector, organized labour and the broader civil society through scientific
research and analysis.

The areas covered in this profile include information on national and provincial long term plans, economic
environment that the province is linked and budget analyses at national and provincial level their respective
contribution in our economy. The indicators reflect the socio-economic reality of the province. As such valuable
insight can be gained as to the developmental challenges faced by communities residing within the province.

This profile uses data primarily sourced from Statistics South Africa, IHS Regional explorer, and World Bank
Data Bank. The latest survey data is available from Statistics South Africa 2011 Census.

The format of the profile allows for easy readability with the data being displayed in table or graph, followed by
the relevant trend analysis.

                                                                                                         5|P a g e
Macro-Economic Analysis
Chapter 1 Introduction

Economic development forms part of almost every national agenda, especial in less developed countries of
which South Africa is one. Several countries identified development areas that if addressed could lead to
accelerated economic growth. These development aspirations are well known as the Millennium Development
Goals (MDG). In South Africa, the government priorities are formulated in a way that one way or the other are
linked to the MDGs. One of the latest and important economic frameworks was produced by the national
planning commission called the National Development Plan (NDP) that emphasizes the importance of
economic infrastructure in spurring economic growth and that is job creating and poverty reducing thereby
translating into economic development. The Provincial Growth and Development Plan (PGDP) is intended to
capture and cascade the development initiatives in the NDP to the province. The North West province has
potential to develop and create thousands of jobs for its citizens, and that can be achieved by adjusting the
provincial budget composition to lean on infrastructure development and investment spending.

The sluggish growth in economic activity of advanced economies of 2.6 percent poses a setback to provinces,
with particular emphasis on North West province, which specialize in the extraction and exportation of raw
precious commodities in the international markets. The weak global economic performance emanating from
the banking crisis in the Euro zone and the sub-prime property markets in the US, has resulted in reduced
demand for commodities and other exportable goods. The prevailing economic quagmire implies that the
province needs to consider identifying alternative and sustainable markets for the commodities such as the
emerging and developing economies where the average growth rate was 5.3 percent in 2012 and is expected
to grow to 6.2 percent in 2017. Secondly the province may consider diversifying its economy in sectors of
competitive advantage like tourism to ensure economic sustainability and job creation and retention.

Currently the province is sustained mainly by Mining and Government Services sub sectors and needs to move
to activities that will generate enough wealth for the province and that are labour absorbing and self-
sustaining. Generally the secondary sector, particularly manufacturing, is associated with elasticity of demand.
This means that demand for manufactured goods increase as household income increases. It therefore implies
that for the province to increase employment and alleviate poverty it needs to invest more in labour absorbing
and job creating industries such as manufacturing, encouraging private sector participation in the provincial
economy.

                                                                                                       6|P a g e
Macro-Economic Analysis
The National Budgets continues to be broadly expansionary setting out steps to support the vision in the NDP
to support the economy, strengthen infrastructure investment and improve the public service performance but
also gradually to narrow the budget deficit. The provincial budget also followed the similar stance.
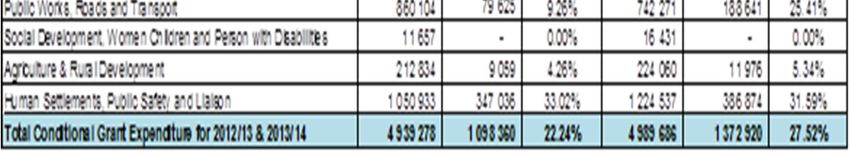
Nevertheless, the Department of Education, Health, Public Works, Roads and Transport, and Human
Settlement constituted the bulk of the increase in the provincial budget each representing 40.8 per cent, 26.3
per cent, 12.2 per cent and 4.7 per cent respectively in 2012/13. It is evident that if the provincial budget is to
be pro economic growth and pro job creation more resources need to be directed to Department of Economic
Development and Tourism to finance economic development initiatives. The department in the 2012/13
financial period only received 1.7 percent of the total provincial budget.
The budget is a very important fiscal tool at the disposal of provincial governments. Through this tool (Revenue
collection and Expenditure) the province can strategically direct resources to expenditure that will translate in
economic growth and development in the province. The province cannot do this alone, therefore a strategic
Public Private Partnership (PPP) needs to be established as the private sector plays an important role in the
province’s economy through job creation and goods and service delivery. Government is therefore constrained
to create a conducive environment that will attract investment, scarce skills and retain income circulation in
the province.
7|P a g e
Macro-Economic Analysis
Chapter 2 International, National and Provincial Strategy overview

2.1 Millennium Development Goals

At the United Nations Millennium Summit in 2000, the international community reached consensus on working
to achieve eight critical economic and social development priorities by 2015. The development priorities are
well known as the eight Millennium Development Goals (MDGs). According to Stats SA Millennium
Development Goals Report, the promotion of gender equality and empowering women is clearly embedded in
the Millennium Declaration.

Figure 1: The eight MDGs are listed below in their numeric order:

                                                            1. To eradicate
                                                                extreme
                                                             poverty and
                                8. To develop a                  hunger       2. To achieve
                                     global                                     universal
                                partnership for                                  primary
                                 development                                   education

                                                                                       3. To promote
                        7. Ensure
                                                                                      gender equality
                     environmental
                                                                                       and empower
                      sustainability
                                                                                           women

                                6. To combat
                                  HIV/AIDS,                                    4. To reduce
                                 malaria and                                  child mortality
                                other diseases
                                                             5. To improve
                                                            maternal health

Source: Stats Sa Millennium Development Goals Report 2010

                                                                                                        8|P a g e
Macro-Economic Analysis
The Millennium Development Goals and targets come from the Millennium Declaration, signed by South Africa
and other 188 countries in the year 2000. The goals and targets are interrelated and should be seen as a whole.
They enjoin the developed countries and the developing countries through a partnership that would be
conducive to development and to the elimination of poverty.

The assumption adopted in this declaration is that the priorities possess a multiplier effect where the
attainment of one of the priorities will be a lead or a propeller of the achievement of other development
priorities. The other factor is that the vision of the declaration is to converge developing countries to
developed nations. It should be noted that this standard declaration is entered into by multiple nations that
definitely do not possess homogenous political, social, economic, institutional, geographical, and
environmental characteristics. Therefore variance and disparities should be anticipated come 2015 when
implementation progress is assessed.

In 2011, the Financial and Fiscal Commission (FFC) undertook a study to determine the best method that could
assist the South African government to attain the Millennium Development Goals. The research looked at the
possibility of an expansionary fiscal policy to drive the attainment of MDGs and the outcomes indicated that it
is unlikely that South Africa will reach the goals in the four years from when the study was undertaken.

The study proposed that National, provincial and local government should further reprioritize expenditures in
respect of Equitable Share and Conditional Grants to move towards attaining the MDGs. Government should
weigh up carefully the impact of increasing spending against the risk associated with increasing taxation rates,
spending levels and deficit finance.

2.2 National Development Plan

South Africa has undergone significant transition from an economic and socio-political perspective. The
transition was ushered in by the advent of the democratic dispensation which emerged after the country
suffered a considerable period of political, social and economic turmoil. The democratic government, in
response to the social injustices inherited from the past, a number of macroeconomic policy reforms were
engineered to transform the South African economy to be more inclusive and promote economic participation,
with special attention on the marginalized. These policies ranged from Reconstruction and Development
Programme (RDP), Growth, Employment and Redistribution (GEAR) and Accelerated Shared Growth Initiative

                                                                                                       9|P a g e
Macro-Economic Analysis
of South Africa (ASGISA). The RDP formed the basis of government’s attempt to fight poverty and deprivation,
and to build a united, non racial and non sexist South Africa.

It is widely accepted that the country's macroeconomic policies required the necessary evolution since 1994.
The RDP was a necessary policy given its constitutional intention of redressing the social imbalances of the
past. Nevertheless, the shortfall of the policy was that it focused more on redistribution that was not
complimented with economic growth, wealth creation etc, therefore translating the policy to be a socialist
policy that did not have an explicit and sustainable plan to fund the redressing of the past injustices. The GEAR
policy was a counter policy that upheld the fundamentals of RDP but supporting it with increase in economic
growth measured by Gross Domestic Product (GDP) to support the redistribution of the country's wealth.
Although the country managed to support redistribution and complimented it by economic fundamentals,
growth of the economy was not adequate to achieve the intended priorities in GEAR. This necessitated the
introduction of ASGISA, a policy that acknowledged that a fast growing economy is a necessary condition for
any country to address development challenges such as unemployment, poverty and inequality.

While the country has made some progress in reducing poverty, unemployment and inequality, millions still
remain unemployed, inequality soars high, child mortality is still prevalent and many working households,
constituting of many young people, live close to the poverty line. The perspective that the NDP views the
growth of the economy as rather long term and sustainable as it creates an allowing environment for South
Africans to thrive and pioneer their own development. The approach is one that moves from a passive citizenry
receiving services from the government to one that systematically includes the socially and economically
excluded, where people are active champions of their own development, and where government works
effectively to develop people’s capabilities to lead the lives they desire.

The planning commission identified a number of challenges facing the country and if addressed could
transform the country’s status quo. The commission proposed the following to mitigate the challenges:

                                                                                                      10 | P a g e
Macro-Economic Analysis
Table 1: number of challenges facing the country
1. Drive an economy that will create jobs 7 Quality health care for all
2. Improve Infrastructure 8 Social protection
3. Transition to a low carbon economy 9 Building safer communities
4. An inclusive and integrated rural economy 10 Reforming the public sector
5. Revising the special effects of apartheid 11 Fighting corruption
6. Improving the quality of education, training and 12 Transforming society and uniting the country
innovation
Source: National Development Plan Vision for 2030
Figure 2: The NDP’s approach can be summarized as follow
Creating
Jobs and
Livelihood
Transformin
Expanding
g Sociaty
Infrastructu
and Uniting
re
the Nation
Transitionin
Fighting g to low
corruption carbon
NDP economy
APPROACH
Building a Improving
Capable Education
State and Training
Providing Transformin
Quality g Urban and
Heath Care Rural spaces
Source: National Development Plan Vision for 2030
11 | P a g e
Macro-Economic AnalysisTable 2: Overall targets of the plan, (selected targets)
South Africa In
Economy And Economic Health Care For Inclusive Rural
The Region And
Education And
Employment Infrastructure All Economy Training
The World
•Unemplyment •Access to •Life expectancy to •Create 643 000 •Intra- regional •80% of schools
reduced to 14% by Electricity grow to reach 70 rears direct jobs and trade in Southern should achieve
2020 and 6% 2030 95% in 2030 •Infant mortality 326 000 indirect Africa should 50% literacy
•GDP grow to 5.4% •Generate rate to decline to jobs in Agriculture, increase to 25% of •80% of students
•GDP per capita additional 40 000 20 per 1000 live agroprocessing trade by 2030 should complete
grow to R110 000 MW of electricity births and related •Trade with 12 years of
in 2030 •20 000MW should •Reduce maternal sectors regional schooling
•Exports grow by be renewable mortality to 100 neighbours should •Improve futher
10% in volume enegy per 100 000 live increase to 30% of education and
terms by 2030 •Reduce water births trade by 2030 training
•Savings Rate grow demand to 15 % in graduation rate to
to 25% Urban Areas 75%
•Broadband should
be defined as 2
MB per second
Source: National Development Plan Vision for 2030
2.2.1 Unemployment
The vision anticipates reducing unemployment to at least 14 per cent in the next seven years (2020). According
to the Quarterly Labour Force Survey (QLFS) a household-based sample survey conducted by Statistics South
Africa (Stats SA), unemployment in the second quarter of 2013 was recorded as 25.6 per cent. The variance
between the target and the status quo is 11.6 per cent. The North west unemployment is recorded at 24.5 per
cent. Provincial government will need to come up with programmes that will assist youth and women to attain
employment status to contribute to the goal of reducing national unemployment to 14 per cent.
2.2.2 GDP
According to the 2013 first quarter Gross Domestic Product release, South Africa's economic growth is
registered at 0.9 per cent, while the provincial growth was 1.5 per cent in 2012. South Africa needs an
economic growth that will ensure the attainment of the NDP vision, the framework targets a growth of 5.4 per
cent per annum to create the much needed jobs in the country. Given the current rate of growth, a
combination of both expansionary fiscal and monetary policy will have a significant impact in the formation of
a enabling environment for economic growth to thrive.
12 | P a g e
Macro-Economic Analysis2.2.3 GDP Per capita
The per capita GDP is especially useful when comparing one country to another because it shows the relative
performance of the countries. A rise in per capita GDP signals growth in the economy and tends to translate to
an increase in productivity. In 1996, the per capita income of the country was R 27 893 and in 2012 is was
recorded as R 37 404. It therefore took the country 16 years since 1996 to grow the per capita GDP by R 9 511.
Of cause this is due to both the population growth in the period under question and the sluggish economic
growth that was stalled by heavy reliance in agricultural production and mineral resources. The NDP envisages
per capita GDP to be R 110 000 by 2030.
2.2.4 Exports
According to IHS, South Africa's total exports amounted to R 746 517 998 913 in 2011 which recorded a growth
rate of 19.2 per cent year on year, this was 25.6 per cent of the country's GDP. The NDP is anticipating the
growth of exports to grow by at least 10 per cent as measured in volume terms by 2030.
The core of the plan is a development paradigm that seeks to involve communities, youth, workers, the
unemployed and business in partnership with one another, and with a more capable state. The aim is to
develop the capabilities of individuals and the country, and to create opportunities for all South Africans.
The attainment of the policy will require a stable political environment and consistent policy focus as a
pedestal. This is necessary but not sufficient. The country needs to grow the economy at a notable rate to spur
economic activity, which will be a catalyst for employment, infrastructure development, and other
developmental factors.
2.3 Provincial Strategic Priorities
2.3.1 Provincial Growth and Development Plan
The initiative to formulate a Provincial Growth and Development Strategy stems from a call made by the
President in his ‘State of the Nation Address’ in 2004 where he challenged Provincial and Local Structures to
align their Growth and Development Strategies and Programmes of Action, the National Priority Objectives, the
National Spatial Development Perspective and the Municipal Integrated Development Plans.
The North West Provincial Growth and Development Strategy provides a framework for integrated and
sustainable growth and economic development for the province and its people over the next ten years. It
13 | P a g e
Macro-Economic Analysisaddresses the formulation of a common vision, goals and objectives of what should be achieved and how the
provincial government and its social partners should achieve its objectives.
Figure 3: Challenges facing the province
The Province is
mostly rural in
nature.
Available resources
are unevenly
distributed and offer relative inadequate
limited potential for infrastructure,
improved delivery of especially in the
services and growth remote rural areas
Challenges
The Province is faced facing the Province has
by HIV/Aids as a province inherited an
social and economic enormous backlog in
challenge basic service delivery
great inequalities
between the rich The population is
and poor as well as predominantly poor
disparities between with high levels of
urban and rural. illiteracy
Source: Provincial Growth and Development Plan
The PGDP aims to support economic growth. The plan requires an average economic growth rate of 6.6 per
cent per annum, to halve unemployment over a ten-year period. This is considered the minimum economic
growth that would create enough capacity and momentum to place the province on a virtuous cycle of
integrated and sustainable growth and development during the next 10 years. The investment requirement to
achieve this average growth rate from both the private and public sector is estimated at R6.3 billion per
annum.
The Poverty Eradication Goal to wipe out the ‘basic needs’ backlog in accordance with the provisions of the
Constitution and prepare the poor for future growth and development, as calculated from the 2001 population
statistics supplied by Stats SA and included projections for new households expected to enter the market, will
annually require investment estimated at R 854 million per annum.
14 | P a g e
Macro-Economic Analysis2.4 Local government strategic policies
Local government policies such as Local Economic Development (LED) are just one of the strategic
implementation approaches of delivering on economic development imperatives to the people. Generally the
local government is in two fold. The first is that it is the sphere of government providing services to the public.
The other is to represent and involve citizens in determining specific local public needs that can be met. This
therefore means that when local government attempts to achieve the national plan, it will subject the national
and provincial policies to the unique needs of the local public.
Figure 4: Intergovernmental policy linkages
National Policies
(Propagate
economic growth
enhancing policies
which in turn
promote job
creation and
increased living
standards.)
Local
Government
Strategy
(Implementation
Plan)
Provincial
Strategies
(Cascade
national policies
to a geographic
location)
Conclusion
All the policies at international, national and provincial level provide government with a focused framework to
which energies, public funds and planning can be directed. These policies speak to developmental issues that
when addressed, the general living standards of citizen will be improved. Public funds need to be directed by
empirical research in the status of the socio-economic environment the government operates in.
South Africa entered into an international treaty that highlighted several indicators of development which are
well known as the Millennium Development Goals with the objective of strengthening its efforts to close the
social injustice gap in the country. In relative terms the country has a stable macro-economic framework which
15 | P a g e
Macro-Economic Analysisis a necessary condition of achieving the goals. The major challenge is for the country to increase its economic
growth potential. The inability of the South Africa to grow to its growth potential will limit its ability to address
many of the goals set out by the MDG process, to name but a few, the creation of jobs, drastic improvements
in the quality of especially technical education and health care.
Domestic policies such as the NDP are designed in a fashion that encompasses the intent to address the MDGs
although the policy is formulated with high consideration of local socio economic circumstances. Given that the
developmental factors are fundamentally similar globally, the formulation of corrective policies will not be
cumbersome; except for countries have varying methods of addressing the development priorities through
indigenous macroeconomic policies. The successful implementation of the NDP lies in various factors that are
both institutional and fundamental. The degree in which all the spheres of government understand the vision
of the NDP will determine the strategic direction adopted by the respective entities. National, provincial and
local government priorities should be aligned and support the attainment of the vision. The funding model,
which is informed by the planning processes and budget process, should capture the attempt of reaching the
targets embedded in the policy. Also a strong Public Private Partnership (PPP) will have a long run impact on
the fulfillment of the policy. Over and above all, it is necessary to have a monitoring and evaluation mechanism
that will track and determine the success of the policy.
The PGDP should be a micro replica of the national policy, in this instance being the NDP that will localize the
national economic development initiatives to the province with the aim of minimizing social injustice in the
country. The PGDP by default should not be opposing or seem to be deviating from the national framework. A
synchrony between the two is imperative and cannot be over emphasized.
It is therefore onus of policy advisors to draw a provincial development plan and establish reasonable targets
that correlate with the national plan. A provincial funding model should be adopted that will be responsive to
the aligned PGDP and NDP to support the required accelerated economic growth that should result in job
creation and poverty reduction in the province.
16 | P a g e
Macro-Economic AnalysisChapter 3 Global Economic Performance
3.1 Global Market developments
The world economy was subjected to a protracted contraction in economic activity from 2008 to 2010
stemming from losses in the capital market, intensified global macroeconomic uncertainties, the sovereign
debt crisis in the euro area, oil supply constraints in North Africa and the Middle East, social unrest in many
parts of the world, natural disasters and extreme oil price volatility. These crises subsequently resulted in
significant decline in aggregate demand for goods and services which led to a decrease in global output and
shedding of thousands of jobs.
According to the IMF, global economic growth decelerated from just above 5 per cent in 2010 to around 3.30
per cent in 2012. There is however widespread expectations that global growth will gradually start recovering
in 2013.
Output in the advanced economies declined towards the end of 2012, this was the first contraction since the
severe recessionary phase of the global crisis in 2008 and 2009. By contrast, the pace of economic expansion in
emerging and developing markets accelerated in 2012 as a result of faster growth in all regions, especially
emerging Asia. Although real output growth moderated somewhat in the sub-Saharan Africa region, it still
remained robust at around 5,3 per cent in 2012 according to the IMF. The strong growth performance was
underpinned by robust domestic demand, high commodity prices and rising export volumes.
International financial market conditions have improved since the beginning of 2013, partly due to
accommodative monetary policies by most central banks aimed at supporting economic recovery and growth.
However, these easy monetary policy conditions in advanced economies in many instances resulted in
depreciating exchange rates of the currencies concerned, thereby putting upward pressure on emerging-
market currencies, and making the exports of the latter group of countries more expensive and less
competitive.
According to the IMF, global economic outlook is projected to experience growth of 3.6 per cent in 2013 from
growth of 3.3 per cent in 2012. The anticipated modest growth is supported by strong stimulus macroeconomic
policies that seek to reduce risk crises and boost the weak aggregate demand that severely affected the USA
17 | P a g e
Macro-Economic Analysisand the Euro area which are South Africa’s main international markets. The IMF projects global economic
growth to grow up to 4.60 per cent by 2017.
Figure 5: World GDP, constant prices ( percentage Change)
6% 5.10%
4.40% 4.50% 4.60%
5% 4.10%
3.80% 3.60%
4% 3.30%
3%
2%
1%
0%
2010 2011 2012 2013 2014 2015 2016 2017
Source: International Monetary Fund, World Economic Outlook Database, October 2012
Economic growth in the US picked up somewhat in the second half of 2011, following subdued growth during
the first half of 2012. Activity in the first half of 2011 was suppressed by supply chain disruptions following the
natural disasters in Japan and the dampening effect of higher food and energy prices on consumer demand.
Growth in 2011 was largely underpinned by positive contributions from personal consumption expenditure,
exports and private investment, which more than offset the contraction in government consumption and
investment. The pace of increase in non-residential investment accelerated in 2011, whereas residential
investment remained subdued. In the first quarter of 2012 real growth in the US moderated slightly.
3.2 Emerging and developing markets
The integration into the world market by the non-OECD economies (Brazil, Russia, India, China and South
Africa, combined known as BRICS) was the latest development in globalization that redefined the economic
horizons. The OECD indicates that the world market and markets within BRIICS yielded economic incentives
and strengthened entrepreneurship as greater markets became accessible. In recent years emerging and
developing economies, on average, had fairly maintained a positive economic growth over the years
irrespective of the global financial crises. According to Price Waterhouse Coopers (PWC) report on World in
2050, emerging economies will become low cost production locations and large consumers in the markets. This
therefore creates a favourable investment platform for both international and local investors.
18 | P a g e
Macro-Economic AnalysisFigure 6: Gross domestic product, constant prices ( per cent)
9.0%
8.0% 7.4%
7.0% 6.2% 5.9% 6.1% 6.1% 6.2%
5.6%
6.0% 5.3%
5.0% 4.6%
4.0%
3.0% 2.6%
2.0%
1.0%
0.0%
2010 2011 2012 2013 2014 2015 2016 2017
World Advanced economies Emerging market and developing economies
Source: International Monetary Fund, World Economic Outlook Database, October 2012
The diagram is showing time series data of Gross Domestic Product (GDP) for Advanced, Emerging and
combined economies. The advanced economy’s GDP is relatively lower compared to the emerging economies.
The growth in advanced economies was extremely hampered by the Banking crisis and government debt crises.
The emerging economies’ GDP is relatively higher than then the advanced economies’ GDP, attributable to
China’s resilient national output growth and growth in developing economies in general. The world market is
expected to pick up in 2013 and ensuing years.
19 | P a g e
Macro-Economic AnalysisChapter 4 South African Economic Performance
4.1 South African economic developments
In South Africa real economic growth has been sustaining a low but positive growth since 2009. The labour
unrest in the mining sector had taken its toll and affected productivity and total production in the mining
sector. The country’s economy is supported by aggressive expansionary fiscal policy, although the government
has expressed a statement to apply fiscal consolidation. This may imply a cut in government expenditure,
thereby negatively influencing aggregate expenditure.
Figure 7: Gross Domestic Product at constant 2005 prices (per cent Change)
6.0% 5.6% 5.5%
5.3%
5.0% 4.6%
3.7% 3.6% 3.5%
4.0%
2.9% 3.1%
3.0% 2.5%
2.0%
1.0%
0.0%
2002 2003 2004 2005 2006 2007 2008 2009 2010 2011 2012
-1.0%
-2.0% -1.5%
Source: Stats Sa Gross Domestic Product Quarter1_2013
In the mining sector real value added contracted further towards the end of 2012 as a number of gold and
platinum mines continued to be adversely affected by strike activity. The GDP in the mining sector moved from
5.7 per cent in 2010 to -4.0 per cent in 2012. By contrast, agricultural output rose further as livestock
production held up fairly well over the period. The GDP growth in the agricultural sector improved from -0.1 in
2011 to a positive 2.3 per cent in 2012. The manufacturing sector is experiencing a difficult time in recovering
from the 2009 negative growth, subdued unemployment and the heavy indebtedness of the public is playing a
significant role in the slow recovery in the sector. The sector recorded a -10.1 per cent contraction in 2009,
improved its performance in 2010 to 5.5 per cent and slowed down in 2012 to 2,4 per cent. The expansion in
activity in emerging-market economies was accompanied by improved competitiveness arising from the
depreciation of the external value of the rand.
20 | P a g e
Macro-Economic AnalysisThe lackluster economic growth in 2012 was accompanied by subdued job creation. While the number of
workers in the public sector continued to rise, this was not always the case in the private sector, with a
significant number of jobs, for instance, lost in the mining sector in the third quarter of 2012. Labour
productivity continued rising at a pedestrian pace, while wage settlements averaged 7,6 per cent in 2012.
Figure 8: Gross Domestic Product by industry at constant 2005 prices ( per cent Change)
20.0% Agriculture, forestry and fishing
Mining and quarrying
15.0%
Manu-facturing
10.0%
Electricity, gas and water
5.0% Construction
0.0% Wholesale, retail and motor trade;
catering and accomodation
2007 2008 2009 2010 2011 2012 Transport, storage and com-munication
-5.0%
Finance, real estate and business services
-10.0% General government services
-15.0% Personal services
Source: Stats Sa Gross Domestic Product Quarter1_2013
All the main domestic expenditure components weakened in the fourth quarter of 2012, culminating in a slight
contraction in real gross domestic expenditure. Growth in household real final consumption expenditure
slowed somewhat over the period, constrained by slower growth in disposable income and rising inflation.
While moderating somewhat, the pace of increase in real spending on durable and semi-durable goods
remained sturdy, led by demand for furniture, household appliances, vehicle parts and recreational goods. Real
expenditure on non-durable goods and services increased at a considerably slower pace than on durables and
semi-durables. Household consumption expenditure growth continued to match growth in household
disposable income in the final quarter of 2012, and although household debt rose further, its pace of increase
did not match that of disposable income. Accordingly, the household debt-to-income ratio edged slightly lower.
The economy has not fully recovered from the negative economic growth rate in 2009, this is due to the fact
that the country's economic activity is linked to global economies such as America and Europe that are still
struggling to resuscitate their economies.
21 | P a g e
Macro-Economic Analysis4.2 South African Population
South African population is estimated at 52,83 million. The Black African population group are in the majority
(42,28 million) and constitute almost 80 per cent of the total South African population. The white population is
estimated at 4,60 million, the coloured population at 4,77 million and the Indian/Asian population at 1,33
million. Just over fifty-one per cent (27,08 million) of the population is female South African population grew
significantly in the past few years.
The provincial estimates show that Gauteng has the largest share of the population followed by KwaZulu-Natal
and Eastern Cape. Approximately 11 per cent of South Africa’s population lives in Western Cape. Northern
Cape has the smallest population. . Free State has the second smallest share of the South African population,
constituting just over 5 per cent of the population.
Figure 9: South Africa's population
Source: Stats Sa_Live Maps
Population growth plays a conflicting role in the economic development process. It can act as a stimulus or an
impediment to growth and development. The common view as far as the developing countries are concerned,
is that population growth presents an obstacle to the growth of living standards. This is due to the fact that a
rapid increase in population can force government to allocate a large portion of national revenue to social
expenditure (consumption requirements). This in turn potentially limits the amount of national or provincial
budget available for investment expenditure such as infrastructure, which is crucial in order to build
opportunities for improving the standard of living of the population as a whole. Slow rate of population growth
has the potential of availing resources needed to provide a given level of provision of overhead capital such as
22 | P a g e
Macro-Economic Analysisschools, housing and hospitals. These resources are then available for projects that raise social and economic
income per capita.
Figure 10: Unemployment rate versus Population growth
35.0%
30.0%
29.7% 29.3%
25.0% 27.5% 26.8% 26.3% 25.4%
24.1% 23.8% 24.7% 24.7% 25.0%
20.0% 22.8%
15.0%
10.0%
5.0% 1.3% 1.2% 1.2% 1.1% 1.1% 1.2% 1.2% 1.3% 1.2% 1.5% 1.5% 1.4%
0.0%
2001 2002 2003 2004 2005 2006 2007 2008 2009 2010 2011 2012
Unemployment Population Growth rate (%)
Source: IHS Global Insights
From the diagram above, it is clear that the growth in national population has been stable over time.
Nevertheless, the provinces have been experiencing a stochastic trend in population growth due to geo-
economic activities in the provinces. Gauteng, Kwa-Zulu Natal and Western Cape had to accommodate an
influx in population migration as these are the major economic hubs and have more job opportunities.
Unemployment in the country is not significantly correlated to population growth but the cyclical trends of the
country's economic activity. Empirical evidence shows that most countries with a fundamentally correct
population policy have low population growth rates. These countries are experiencing high economic growth in
general. However, the countries without a sound population policy generally have high population growth
rates. They are often less developed and experience low economic growth. South Africa experiences a low and
some periods negative economic growth. This leads to unemployment, poverty and deteriorating living
standards. Due past apartheid policies, it's the black population group that suffers in particular.
4.3 South African International Trade
The emphasis on trade liberalisation following South Africa’s political reforms in the early 1990s resulted in the
South African economy becoming more integrated into the global economy. According to the Department of
Trade and Industry's publication indicated that South Africa's top ten export destinations in 2009 being China
23 | P a g e
Macro-Economic Analysis(R42.5 bn), United States (R33.6 bn), Japan (R28.3 bn), Germany (R25.7 bn), United Kingdom (R21.5 bn),
Switzerland (R17.1 bn), Netherlands (R16.1 bn), India (R15.6 bn), Mozambique (R11.6 bn) and Zimbabwe
(R11.3bn).
National exports were steadily increasing since 2004. The trend was negative after 2008 which is explained by
the negative production growth in the mining sector and mining related products. The trend improved in 2010
going on to 2011. The country saw improved exports in the agricultural sector, and manufacturing sector.
Exports grew from R 310 billion in 2004 to R 746 billion in 2011.
Since 2009 until 2011, South Africa's exports exceeded imports; this meant an improvement in the trade
balance.
Figure 11: SA International Trade
International Trade (R,000,000)
Exports
Imports
2002 2003 2004 2005 2006 2007 2008 2009 2010 2011
Exports 277 993 255 560 291 143 320 385 383 177 474 250 636 791 506 476 575 700 659 821
Imports 274 458 258 430 306 369 350 721 464 643 562 502 721 082 535 764 575 087 690 485
Source: IDT_2011 SA Exports and Imports
The largest contributors to the country's exports include among other Mining of coal and lignite, Mining of gold
and uranium ore, Mining of metals, Fuel, chemical and rubber products, metal products, machinery, and
household appliances and transport equipment.
Similarly, major contributors of the country's Imports include among others Other mining and quarrying, Fuel,
petroleum, chemical and rubber products, Metal products, machinery and household appliances, Electronic,
sound/vision, medical & other appliances and Transport equipment.
24 | P a g e
Macro-Economic AnalysisFigure 12: 2011 SA Export Value
Special classification of original equipment components/parts… 23 521 070
Other unclassified goods 907 849 584
Works of art, collectors' pieces & antiques 259 487 959
Miscellaneous manufactured articles 4 375 156 702
Arms & ammunition; parts & accessories thereof -
Optical, photographic, cinematographic, measuring, checking,… 3 340 066 570
Vehicles, aircraft, vessels & associated transport equipment 47 882 534 669
Machinery & mechanical appliances; electrical equipment 52 732 760 786
Base metals & articles of base metal 95 040 057 862
Natural or cultured pearls, precious or semi-precious stones,… 178 131 394 833
Articles of stone, plaster, cement, asbestos, mica or similar… 2 229 639 480
Footwear, headgear, umbrellas, sun umbrellas, walking-sticks,… 335 879 502
Textiles & textile articles 5 264 318 255
Pulp of wood or of other fibrous cellulosic material 11 667 367 825
Wood & articles of wood; wood charcoal; cork & articles of cork 2 680 322 178
Raw hides & skins, leather, furskins & articles thereof 1 682 888 095
Plastics & articles thereof; rubber & articles thereof 11 577 542 384
Products of the chemical or allied industries 37 792 099 624
Mineral products 171 623 732 410
Prepared foodstuffs; beverages, spirits & vinegar; tobacco 13 389 561 774
Animal or vegetable fats & oils 1 705 940 447
Vegetable products 12 554 043 696
Live animals, animal products 4 625 760 917
- 50 000 000 000 100 000 000 000 150 000 000 000 200 000 000 000
Source: IDT_2011 SA Exports and Imports
Conclusion
Advanced economies are struggling to maintain and grow their economies. The unemployment soured high,
imports declined and economic activity suffered a protracted decline in productivity. The Sub Saharan
countries where affected by the developments as most of the Sub Saharan exports were absorbed by the
developed nations. Africa in general has enjoyed economic growth in its sphere. This raises potential for
African countries to promote trade between themselves. International trade policies should be reviewed to
promote regional trade and development.
25 | P a g e
Macro-Economic AnalysisChapter 5 Provincial Economic Outlook
5.1 Provincial Economic Performance
The province is centrally located on the subcontinent with direct road and rail links to all southern African
countries and with its own airport near the capital city, Mafikeng. The province is home to 9, 5 per cent of
South Africa's total population. The province borders Botswana and is fringed by the Kalahari Desert in the
west and the Witwatersrand area in the east. Out of a population of 3, 5 million people in the province, 65 per
cent live in rural areas. The Province contributes significantly to South Africa’s mining, agriculture, and
government sector.
For the past decade, North West province contributed 6.4 per cent on average to the national Gross Domestic
Product. At the end of 2012 the North West Province’s average annual GDP growth rate was 2.5 per cent. The
rate appeared to be a significant improvement from the negative growth rate of 1.5 per cent in 2009. North
West is known as the ‘Platinum Province’ because it is one of the largest producers of platinum and its related
metals worldwide. Due to platinum being an internationally sought commodity, the industry is directly
influenced by international economic outlook, subsequently in 2009 the global economy slowdown affected
the local production of minerals in the Province.
Figure 13: % Growth of GDP at market prices
8.0
5.3 5.6 5.5
6.0
4.6
3.6 3.5
4.0 2.9 3.1
2.5
GDP at market prices
2.0
Linear (GDP at market prices)
0.0
2003 2004 2005 2006 2007 2008 2009 2010 2011 2012
-2.0
-1.5
-4.0
Source: Stats Sa Gross Domestic Product Quarter3_2012
The main Pretoria to Zimbabwe railway line runs through the provincial capital of Mafikeng, linking North West
Province to several southern African countries, including Angola, Zambia and Botswana. An extensive road
network connects the major commercial centres of the province to the rest of the country through a network
of 1 785 km of national roads. The vital east-west corridor links the east Africa seaboard at Maputo to the west
26 | P a g e
Macro-Economic AnalysisAfrican seaboard at Walvis Bay, running through the North West en-route. This poses an opportunity of inter
provincial trade and development if well capitalized.
The North West Province, through its Provincial Growth Development Strategy (PGDS) aims to increase
economic growth to 6.6 per cent by 2014. As the province is currently reliant on commodity exports, it plans to
move towards higher value-adding manufacturing and manufactured exports in order to broaden its economic
base. To achieve this, it has identified 16 products from minerals and fertilizers to machinery and horticulture,
and the top five markets to which these products will be exported.
5.2 Economic Performance per Sector
The North West Province’ economy is hinged on mainly two economic sectors namely Primary and Tertiary
sector. Growth in the primary sector, which constitute of Agriculture, forestry and fishing and Mining and
quarrying, is consistent over time; this is irrespective of the expenditure injections by Provincial Department of
Agriculture and Rural development and growing market for small emerging farmers.
Table 3: Current prices - per cent contributions
Industry 2006 2007 2008 2009 2010 2011
Primary Industries 30.8 31.8 34.2 32.5 33.0 35.7
Agriculture, forestry and fishing 2.7 2.7 2.6 2.5 2.2 2.1
Mining and quarrying 28.0 29.1 31.6 30.0 30.8 33.6
Secondary Industries 9.2 9.3 8.8 9.6 9.1 8.4
Manufacturing 6.3 6.2 5.2 5.5 5.2 4.4
Electricity, gas and water 0.9 0.9 0.9 1.2 1.3 1.4
Construction 2.0 2.2 2.7 2.9 2.7 2.6
Tertiary industries 49.0 47.8 46.9 48.4 48.3 45.6
Wholesale, retail and motor trade; catering and accommodation 10.1 9.7 9.9 10.3 10.7 9.3
Transport, storage and communication 7.8 7.1 7.3 7.3 7.3 6.1
Finance, real estate and business services 12.3 12.5 11.8 11.8 11.5 11.1
Personal services 7.5 7.3 7.0 7.3 6.9 7.0
General government services 11.3 11.3 10.9 11.7 11.9 12.1
All industries at basic prices 89.0 89.0 89.8 90.4 90.4 89.7
Taxes less subsidies on products 11.0 11.0 10.2 9.6 9.6 10.3
GDPR at market prices 100.0 100.0 100.0 100.0 100.0 100.0
Source: Stats Sa Gross Domestic Product Quarter3_2012
For 2011, the primary sector contributed 35.7 per cent to the provincial GDP. Alone Agriculture, forestry and
fishing contributed only 2.1 per cent. The mining activity is largest contributor to GDP in the primary sector.
The precious metal prices and the rand fluctuations favoured the producers of minerals especially of platinum
27 | P a g e
Macro-Economic Analysisand coal. The Mining and Quarrying contributed 33.6 per cent of the 35.7 per cent contribution of the primary
sector to the province’s GDP.
Figure 14: Current prices - % contributions on GDP
60.0%
49.0% 47.8% 46.9% 48.4% 48.3%
50.0% 45.6%
40.0% 34.2% 35.7%
31.8% 32.5% 33.0%
30.8% Primary Industries
30.0%
Secondary Industries
20.0% Tertiary industries
9.2% 9.3% 8.8% 9.6% 9.1% 8.4%
10.0%
0.0%
2006 2007 2008 2009 2010 2011
Source: Stats Sa Gross Domestic Product Quarter3_2012
The diagram below shows that Primary and the Tertiary sector are the highest contributors to the province’s
gross domestic product. There’s an uptick in the primary sector that is observed in 2011 of 35.7 per cent . That
rise is attributed to international demand of minerals. Demand for agricultural produce remained relatively
constant.
5.3 Employment per sub Sector
Figure 15: NW Total employment by sector
Total Employment (Formal + Informal) 1996 Total Employment (Formal + Informal) 2011
1 Agriculture 1 Agriculture
11% 9% 8%
2 Mining 2 Mining
13% 3 Manufacturing 3 Manufacturing
4 Electricity 4 Electricity
18% 5 Construction 22% 23% 5 Construction
25% 6 Trade 6 Trade
4% 7 Transport 7 Transport
13% 5%
4% 8 Finance
17% 7% 8 Finance
8% 9 Community services 4% 0% 9 Community services
4%
4% 1% Households Households
Source: IHS, Regional Explorer
Total employment in both the formal and informal sector grew by 183 863 between 1996 to 2011 from
601 018 to 784 881. This implies that just over 12 000 jobs were created annually in the province over the 15
years. Employment in both community service and trade sub sector has shown a significant improvement
relative to other subsectors. Employment in both the community services and trade subsector grew by 4 per
28 | P a g e
Macro-Economic Analysiscent. It is concerning to note that employment in the Agriculture and Manufacturing is portraying a slowdown
in growth.
Intervention by Department of Agriculture and Rural Development (DARD) to support both large scale farmers
and small emerging farmers is becoming evidently crucial given the declining employment numbers in the
sector. Challenges such as land reform programmes, Low productivity in small-scale agriculture, the social and
economic impact of HIV/AIDS and barriers to increased production will need to be addressed by the
department.
Many economies are now transcending from raw material commodity production and exportation to a
knowledge economy where agro-processing and value adding activities in the manufacturing space flourish.
Department Of Economic Development, Environment, Conservation and Tourism (DEDECT) can be a vital
vehicle of the development of Special Economic Zones (SEZ). The SEZ is an economic development tool to
promote rapid economic growth by using incentive packages to attract targeted investments and technology.
The zones act as a magnet for investment in desirable activities in specially designated areas by providing
quality infrastructure complemented by an attractive incentives package, business support services, cluster
development and minimal red tape. The purpose of the SEZ programme is to contribute to the acceleration of
economic growth and employment generation through the promotion of export oriented manufacturing and
services industries.
5.4 Primary Industries
The North West primary sector consists of both the mining, agriculture, forestry and fishing. Mining is the
largest contributor to the provincial’s economic growth. According to StatsSA on industry contribution to GDP
for 2011 third quarter release, the provincial primary industry contribution was 35.7 per cent of which mining
makes up the bulk of the contribution of 94.1 per cent and the residual 5.6 per cent is attributed to the
agricultural sector and related subsectors.
Figure 16: NW Primary Industries
5.9%
Agriculture, forestry and fishing
94.1% Mining and quarrying
29 | P a g e
Macro-Economic AnalysisSource: Stats Sa Gross Domestic Product Quarter3_2012
5.4.1 Agriculture
The North West province is characterized by domination of primary sector (agriculture and mining) in the
economy. There are a few commercial farmers and a hand full of small-scale farmers. Due to limited market,
they only produce for themselves (subsistence farmers) or tenant farmers where the land belongs to chiefs and
they don’t have an incentive to realize economies of scale. The implication of a primary sector based economy
can impede economic growth.
The agricultural sector is one of the crucial sectors in the province. The province is an important food basket of
the country; one third of the country’s total maize crop production is produced in North West. This sector
accounts for over 7.9 per cent of total employment (2011). Agriculture is the only sector apart from mining, in
which the North West is acknowledged to have a comparative advantage over the other provinces. The main
farming activities are crop farming of sunflower seeds, groundnuts, maize and wheat and also animal farming.
The eastern part of the province has a higher rainfall so it produces vegetables, flowers and poultry.
Figure 17: NW Primary Sector GDPR at Constant 2005 prices - percentage changes
25.0
20.0
15.0
10.0
5.0
Primary
0.0 Industries
-5.0 2002 2003 2004 2005 2006 2007 2008 2009 2010 2011
-10.0
-15.0
-20.0
Source: Stats Sa Gross Domestic Product Quarter3_2012
Demand for agricultural products is income inelasticic i.e. The rise in household disposable income will only
lead to a marginal rise in quantity demanded of agricultural produce. The growth in the demand for agricultural
produce determines the growth in the labour force of this sector, and given the income inelasticity of demand
in the sector, it implies that the agricultural sector’s contribution in labour absorption in the province will
remain relatively constant and economic growth may not progress as desired.
30 | P a g e
Macro-Economic AnalysisYou can also read