Sector Skills: Update 2015 - 2020 - (Fp&M) Seta
←
→
Page content transcription
If your browser does not render page correctly, please read the page content below

Sector Skills: Update
2015 - 2020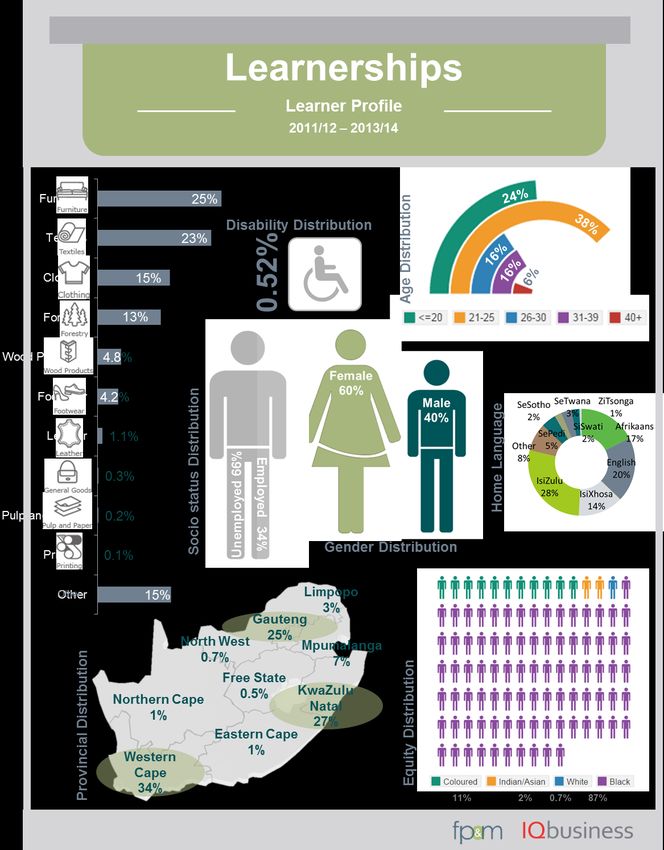
FOREW0RD .............................................................................................................................................................. 4
LIST OF ACRONYMS............................................................................................................................................... 5
CHAPTER 1: SECTOR PROFILE ....................................................................................................................... 7
  1.1  INTRODUCTION .........................................................................................................................................................7
  1.2  SCOPE OF COVERAGE................................................................................................................................................7
  1.3  KEY ROLE PLAYERS ..................................................................................................................................................9
  1.4  ECONOMIC PERFORMANCE .................................................................................................................................. 14
  1.5  EMPLOYER PROFILE .............................................................................................................................................. 16
  1.6  LABOUR MARKET PROFILE ................................................................................................................................... 17
  1.7  CONCLUSION .......................................................................................................................................................... 24
CHAPTER 2:                 KEY SKILLS ISSUES..................................................................................................................26
2.1.         INTRODUCTION .....................................................................................................................................26
2.2.   CHANGE DRIVERS ..................................................................................................................................26
  2.3.   ALIGNMENT WITH NATIONAL STRATEGIES AND PLANS .................................................................................. 30
  2.4.   ALIGNMENT WITH SECTORAL INDUSTRIAL STRATEGIES ................................................................................ 33
  2.5.   CONCLUSION .......................................................................................................................................................... 34
CHAPTER 3: EXTENT OF SKILLS MISMATCH ..........................................................................................35
  3.1. EXTENT AND NATURE OF SKILLS DEMAND ...................................................................................................... 35
  3.2. EXTENT AND NATURE OF SUPPLY ...................................................................................................................... 37
  3.3. SUPPLY IN THE FP&M SECTOR ........................................................................................................................... 39
  3.4. IDENTIFICATION OF SCARCE AND CRITICAL SKILLS ......................................................................................... 48
  3.5. CONCLUSION .......................................................................................................................................................... 50
CHAPTER 4: SECTOR PARTNERSHIPS .......................................................................................................52
  4.1  INTRODUCTION ...................................................................................................................................................... 52
  4.2  EXISTING FP&M PARTNERSHIPS ....................................................................................................................... 52
  4.3  NEW PARTNERSHIPS ............................................................................................................................................ 56
  4.4  CHALLENGES ENCOUNTERED WITH PARTNERSHIPS ...................................................................................... 57
  4.5  BEST PRACTICE FOR EFFECTIVE PARTNERSHIPS ............................................................................................ 58
  4.6  CONCLUSION .......................................................................................................................................................... 58
CHAPTER 5: SKILLS PRIORITY ACTIONS..................................................................................................59
  5.1. INTRODUCTION ...................................................................................................................................................... 59
  5.2. KEY FINDINGS FROM PREVIOUS CHAPTERS ....................................................................................................... 59
  5.3. KEY PRIORITY A ACTIONS ..................................................................................................................................... 61
REFERENCES ..........................................................................................................................................................68
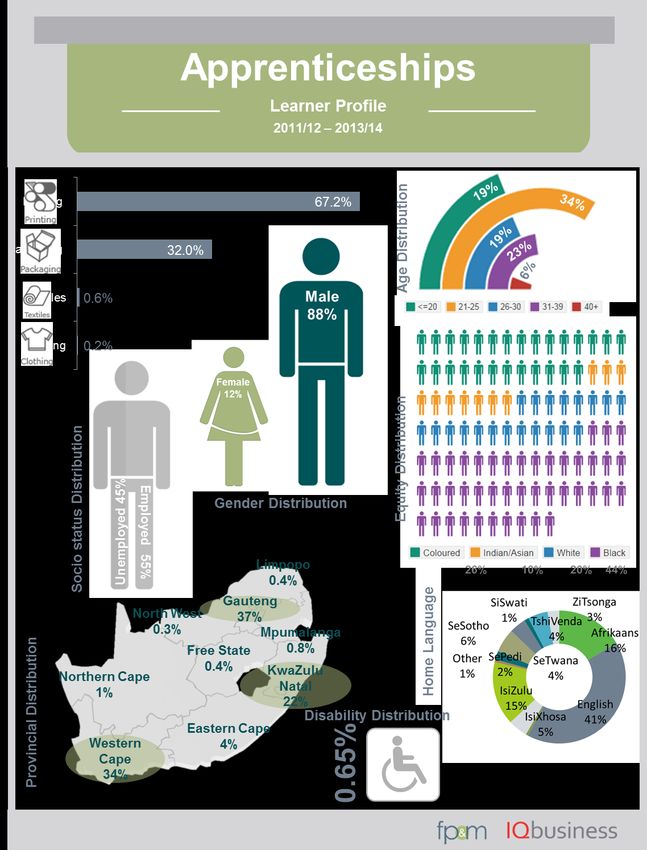
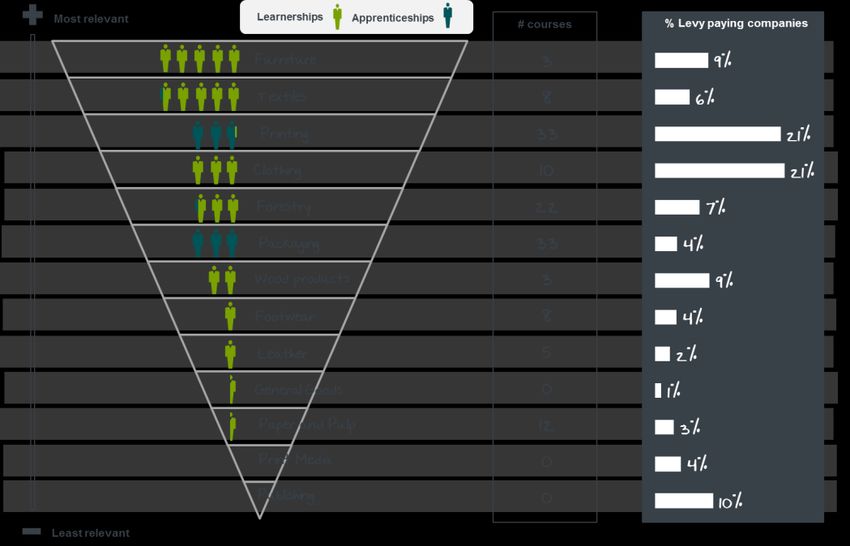
Table of Tables

Table 1: Key Role Players in the FP&M sector: Government Departments ........................................................10
Table 2: Key Role players in the FP&M sector: Per Sub Sector ...........................................................................11
Table 3: Employers in the FP&M Sector..............................................................................................................17
Table 4: National Distribution of FP&M Employers ............................................................................................17
Table 5: Total employment in the FP&M sector as a percentage of total employment in manufacturing and the economy
............................................................................................................................................................................18
Table 6: Employee age per sub-sector ................................................................................................................22
Table 7: Employee race and gender per sub-sector ...........................................................................................23
Table 8: Employee disability per sub-sector .......................................................................................................24
Table 9: Implications of change drivers on skills development in the FP&M sector ..........................................29
Table 10: FP&M SETA learner enrollment per course – 2011/12 to 2013/14 ....................................................40
Table 11: Employment increase by sector (based on those who completed a learnership) ..............................45
Table 12: Top 10 scarce skills in the FP&M sector ..............................................................................................48
Table 13: Top 10 critical skills in the FP&M sector .............................................................................................49

Table of Figures

Figure 1: 13 FP&M sub-sectors .............................................................................................................................7
Figure 2: FP&M Sector Value Chain ......................................................................................................................8
Figure 3: Year on year economic growth ............................................................................................................14
Figure 4: FPM sector output relative to the economy ........................................................................................15
Figure 5: Sub-sector contribution to total output (Rm 2010 prices) ..................................................................15
Figure 6: Exports by sub-sector (Rm 2010 prices)...............................................................................................16
Figure 7: Imports by sub-sector ..........................................................................................................................16
Figure 8: Change in employment over the past decade in FP&M, manufacturing as a whole and the economy19
Figure 9: Percentage change in employment: 2004-2014 ..................................................................................19
Figure 10: Employee Profile per Sub-sector........................................................................................................20
Figure 11: Sector occupational profile ................................................................................................................21
Figure 12: Beneficiating goat fibre along the value chain...................................................................................27
Figure 13: HIV prevalence by province, Source HSRC HIV Report (2012) ...........................................................29
Figure 14: Industrial Strategies ...........................................................................................................................33
Figure 15: Remuneration per employee rand in the FP&M sector .....................................................................36
Figure 16: An inverted education and training pyramid .....................................................................................38
Figure 17: Learnership profile .............................................................................................................................42
Figure 18: Apprenticeship profile........................................................................................................................43
Figure 19: Summary relevance of training to FP&M subsectors ........................................................................45

FP&M SETA Sector Skills Plan for 2015-2020                                                                                                                                 3
FOREW0RD
The FP&M SETA has been through a lengthy period of change and transition. After amalgamation of three
SETAs, there were operational challenges that had to be addressed, whilst at the same time maintaining a
focus on implementation of strategy. It was a hard balance to strike but with the support of a very pro-
active and engaged Board, an innovative and strategic CEO and a hard working management team the
work has been done.

One of the concerns with the previous versions of the SSP was that it seemed like a “piecing together” of
three separate plans of the three ex-SETAs. The management and board were concerned to rectify this
and to produce a plan for the sector as a whole. The discussions related to the FP&M “value chain” have
been particularly helpful in this respect. There is a sense that all of the 13 sub-sectors are now working
together to achieve economic growth and development, and there are opportunities within the value
chain to address further growth and sustainability of the FP&M sector. Another concern was that industry
provides the SETA with an enormous amount of valuable information, but the SPP was not reflecting that.
It was important to analyse the data and make meaning of it and to interpret the results of research in a
manner that informs strategy. Whilst there will always be improvements that can be made, we have now
found a way of analysing the sector and presenting the results in a manner that enables strategic
discussions, not just within the SETA board, but more broadly in the sector.

In August 2015 the senior management and board will engage over a period of two days on the sector
strategy contained in this SSP, on the strategic five year plan to implement the strategy, on some of the
strengths, weaknesses and risks involved in taking them forward and on the challenges of allocating both
financial and human resources to achieve effective service delivery. There is strong buy in at board and
management level for the plans that are now in place. It is important to emphasise that this is a “sector”
plan not just a SETA plan. The challenge now will be for the SETA to engage with each of the sub-sector
stakeholders and to develop partnerships, joint projects and delivery mechanisms and processes to
implement the plan. There is a strongly held view in the sector that development and expansion can be
achieved, and that jobs can be safeguarded and even expanded. This will require that the sector has the
human capacity to achieve growth and improve competitiveness. Skills development has an important role
to play in that.

The SSP aims to identify employment and growth trends, the skills requirements of the relevant sectors
and to prioritise these in terms of skills development. The process takes account of the environment, the
nature of the sector and the demand and supply of skills. We trust that the capacity we have built in our
sector will drive the plans toward achieving the results envisaged.

Signed

____________________________________
Felleng Yende  Chief Executive Office

____________________________________
Sipho Ngidi  Chairman

                                                                                                        4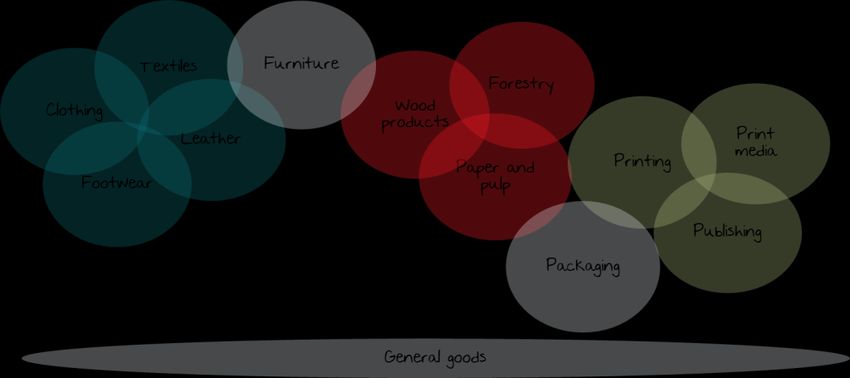
LIST OF ACRONYMS
             ATR                        Annual Training Report
             BBBEE                      Broad Based Black Economic Empowerment
             CSIR                       Centre for Scientific and Industrial Research
             CSP                        Customised Sector Programmes
             DTI                        Department of Trade and Industry
             DHET                       Department of Higher Education and Training
             DPE                        Department of Public Enterprises
             ESSP                       Environmental Sector Skills Plan
             FF                         Fast Fashion
             FP&M SETA                  Fibre, Processing and Manufacturing Sector Skills Training
                                        Authority
             FSA                        Forestry South Africa
             GDP                        Gross Domestic Product
             HIV                        Human Immunodeficiency Virus
             HOMTEX                     South African Home textiles Manufacturers Employers
                                        Organisation
             HRD-SA                     Human Resource Development for South Africa
             HSRC                       Human Resources Development Council
             ILO                        International Labour Organisation
             ILDP                       International Leadership Development Programme
             IPAP                       Industrial Policy Action Plan
             KZN                        KwaZulu-Natal
             NAWTM                      National Association of Worsted Textile Manufacturers
             NDP                        National Development Plan
             NFMA                       Narrow Fabric Manufacturers Association
             NGP                        New Growth Path
             NSDS 3                     National Skills Development Strategy 3
             NTMA                       National Textile Manufacturers Association
             PAMSA                      Paper Manufacturers of South Africa
             PIFSA                      Printing Industries Federation of South Africa
             PSET                       Post-School Education & Training
             QCTO                       Quality Council for Trades and Occupations
             QR                         Quick Response
FP&M SETA Sector Skills Plan for 2015-2020                                                           5
RPL         Recognition of Prior Learning
SABMEO      South African Blankets Manufacturers Employers Organisation
SACMEA      South Africa Carpet Manufacturing Employers Association
SACTPEA     South African Cotton textiles Processing Employers’
            Associations
SARS        South African Revenue Services
SETA        Sector Skills and Training Authority
SIC         Sector Industrial Classification
SIPS        Strategic infrastructure Projects
SMME        Small Medium and Micro Enterprises
SSP         Sector Skills Plan
SAWAMPEO    South African Wool and Mohair Processors Employers
            Organisation
TVET        Technical Vocational Education and Training
UOT         University of Technology
WC          Western Cape
WIL         Work Integrated Learning
WITS REAL   University of the Witwatersrand, Centre for Researching
            Education and Labour
WSP         Workplace Skills Plan

                                                                          6
CHAPTER 1: SECTOR PROFILE

1.1 Introduction
This chapter presents a profile of the Fibre Processing and Manufacturing (FP&M) sector. A value chain
approach is adopted in the discussion of the FP&M sector. This approach shows how the various sub-
sectors within the sector are linked, and also explores how sectors and entities external to FP&M, for
example suppliers of specialised inputs and services as well as providers of specialised infrastructure,
governmental and other institutions contribute to the development and sustainability of the FP&M sector.
Globally economic theory and labour market analysis is moving towards the understanding of value chains,
which is a powerful concept in understanding beneficiation and what is required to expand domestic
production and reduce reliance on imported machinery.

1.2 Scope of coverage
There are 13 sub-sectors that make up the FP&M sector: Clothing; Dry Cleaning; Footwear; Forestry;
Furniture; General Goods; Leather; Packaging; Print Media; Printing; Publishing; Pulp & Paper; Textiles and
Wood Products. Secondary and tertiary industry activities form the bulk of the sector and are focused on
turning raw materials into finished products and making these available for sale. The exception is the
forestry sub-sector, which is in the primary sector and dry cleaning, which is a service sector. Figure 1
represents the 13 sub-sectors, based on the standard industrial classification (SIC) framework, that fall
under the scope of the Fibre, Processing and Manufacturing (FP&M) Sector Education and Training
Authority (SETA). The FP&M SETA is responsible for skills development in the sector and reports directly
to the Department of Higher Education and Training (DHET).

Figure 1: 13 FP&M sub-sectors

Source: FP&M Tracer Study, 2014

The FP&M sector has value chain linkages with other sectors based on the exchange and feeder
relationships between primary and secondary production during manufacturing, and with the tertiary
sector in the marketing and sale of produced goods. The value chain linkages are highlighted in Figure 2

FP&M SETA Sector Skills Plan for 2015-2020                                                               7

Figure 2: FP&M Sector Value Chain
                       FP&M Seta
                       Value  Chain
                           Primary                                                       Secondary                                        Tertiary

              Waste Paper                                        Pulp / Paper Mills         Pulp                 Cellulose / Tissue     Packaging /
                                                                                                                                      Hygiene / Recycle

                                                                                                                                                                         ITC Sector
                                                                                                                      Paper

                                                                                                                                                          Print Media
                                                                                             Ra
          Sugar Cane

                                                                                                                                         Publishing
                                                                     Sawmills             Lumber
                        FORESTRY (Roundwood / Bark)

                                                                                                                                          Printing

                                                                                                                                                                         Construction
                                                                    Board Mills         Rayon Board
                                                                                       Particle Pulp

                                                                    Pole Plants         Treated Poles

                                                                 Mng Timber Mills      Mining Timber                                      Furniture

                                                                                                                                                                                           Retail Sector
                                                                 Charcoal/Matches     Charcoal/Matches
                                                                                                                                      Wooden Products

                                                                                                                                                                         Services Sector
                                                                   Tannin Plants           Tannin

                                                                                                                                                          Dry Cleaning
                                                                                                                                          Clothing
         industry

                        Synthetic Fibres
          Plastic

                                                                                          Textiles
                                                                                                                                         Footwear

                        Natural Fibres
                                                                                                                                          General

                                                                                                                                                                         Automotive
                                                                                          Leather                                          goods
         Agriculture
           Link to

                                                      Hide and
                                                        Skins

                                                                                                        Design

                                                                                                     Packaging

                                                                                         Beneficiation of Waste Streams

         NOTES: Items in red either feed into or from the FP&M SETA, they do not form part of the FP&M SETA value chain

SOURCE: FP&M SETA STAKEHOLDER DISCUSSIONS

Some of the linkages highlighted in Figure 2 are explained below:

1. The forestry sub-sector is the upstream feeder into the Milling and Wood Products industries, an
   upstream feeder into the Pulp, Wood Chips, Timber, Paper and Lumber (an upstream to the
   Construction sector). These have upstream linkages to the wholesale and retailing of Wooden
   Products, Furniture, Footwear, as well as Print Media, Publishing and Printing, in the tertiary sector.
2. The plastic sub-sector (which is not part of the FP&M industries) is the upstream feeder to synthetic
   fibres. Synthetic and Natural fibres (agriculture is an upstream feeder into Natural Fibres) are an
   upstream feeder into Textiles, which is an upstream feeder into Printing, Furniture, Clothing, and
   Footwear.
3. Agriculture (which is not part of the FP&M industries) is an upstream feeder of natural fibres hides and
   skins into the leather sub-sector. The leather sub-sector is an upstream feeder into Furniture, Clothing,
   and Footwear, which are an upstream feeder into Dry Cleaning.
4. General Goods are feeders into the automotive sub-sector.
5. The Design and Packaging streams feed into the complete value chain from the primary to the tertiary
   phase, as a side stream flow, together with the beneficiation of waste.

                                                                                                                                                                                                8
The value chain linkages as outlined in Figure 2 extend to other sectors of the economy. The FP&M sector
provides inputs into other sectors of the economy whilst relying on certain sectors for inputs:
Most of what gets produced within the FP&M sector ends up in the wholesale and retail sector.
Manufacturing, Engineering and Related Services Sector plays a support role in the supply of
machinery and equipment used in the production process and the servicing and repair thereof.
There are some inputs from the chemicals sector that are utilised in the production process.
Some of the goods produced in the FP&M sector e.g. wood products, are used in the construction
sector.
Products such as packaging, produced in the FP&M sector, are utilised extensively in the food and
beverages sector.
Transport sector plays a pivotal role in moving the goods produced in the FP&M sector to where
they are required.
Other sectors of the economy that provide services also have links with the FP&M sector, including banking
and financial services, insurance, media and information technology.
A value chain approach to profiling and analysing the sector exposes holistic and integrated opportunities
for sector development. For example it is evident where the major challenges are in relation to the
processing of primary products into secondary products and the need for interventions to beneficiate and
produce domestically what is currently being exported. Equally it is clear that there are opportunities to
produce in more environmentally sustainable ways and to make use of waste produced at different points
in the value chain – for example the huge amount of paper produced and discarded is a clear opportunity
for recycling. There are also points in the value chain that overlap with other sectors, where collaboration
could result in the expansion of jobs and a greater level of labour absorption than is currently taking place.
Opportunities for reskilling across the sub-sectors can also be identified, e.g. machine operators working
in one sub-sector could move horizontally to another sub-sector within the sector or identify career path
opportunities across related sub-sectors.
1.3 Key role players
This section provides a glimpse into to some of the key role players within the FP&M SETA. The key role
players within the FP&M sector include industry bodies, employer associations, government departments
and institutions that provide policy direction or play a regulatory role, trade unions, and suppliers (Table
1and Table 2). Many of the suppliers are located outside of the FP&M sector. Industry bodies and employer
organisations are represented within the FP&M SETA, as per the SETA’s constitution.
FP&M SETA Sector Skills Plan for 2015-2020 9
Table 1: Key Role Players in the FP&M sector: Government Departments
            Government Department                                       Definition

           Department of Agriculture,   There is a strong linkage between agriculture and forestry and the
           Fisheries and Forestry       FP&M sector. A lot of what gets manufactured in the FP&M sector
                                        would have been produced in the agricultural sector. The DAFF provides
                                        policy direction in Agriculture, Forestry and is an interested party in the
                                        development of the FP&M sector. Extension services are the
                                        responsibility of DAFF.

           Department of Trade and      The FP&M sector contributes significantly to South Africa’s
           Industry                     manufacturing capacity. It plays an important role in the beneficiation
                                        of various fibre related raw materials. The Department as the custodian
                                        of the industrial policy action plan is responsible for the strategy and for
                                        creating an enabling environment for sector expansion

           Department of Rural          The Department is tasked with ensuring the development of rural
           Development                  communities in South Africa. The FP&M sector, particularly its primary
                                        produce sub-sectors has a strong presence in rural areas and is
                                        therefore integral to the national strategy for building sustainable rural
                                        economies

           Department of Small          The FP&M sector is largely made up of small businesses. The
           Business Development         Department (alongside the DTI and DAFF) plays an important role in the
                                        development of small businesses within the sector. It is important that
                                        the SETA skills development interventions in relation to small
                                        businesses are aligned to the wider support framework provided by the
                                        responsible national departments.

           Department of                The Department as an interest in the preservation of the environment
           Environmental Affairs        and ensuring that environmentally sustainable methods of
                                        manufacturing are applied across the economy.

           Department of Water          The FP&M sector relies increasingly on water for manufacturing
           Affairs and Sanitation       processes. The Department is the custodian of the country’s water
                                        resources and provides policy direction in the preservation and use of
                                        fresh water resources.

           Department of Science and    Provides policy direction and spearheads research and development
           Technology                   (R&D) as well as innovation in the South African economy. The
                                        Department has agencies such as the Council for Scientific and Industrial
                                        Research (CSIR) and the National Research Foundation (NRF) whose
                                        purpose is to advance research in areas including those covered by the
                                        FP&M sector. The Department has a keen interest in commercialising
                                        R&D and bridging the chasm between national system of innovation and
                                        industry in South Africa. It is important that the SETA maintains a focus
                                        on new developments and the skills required to support them.

           Department of Higher         The Department is the custodian of the post school education and
           Education and Training       training system of the country and an important policy driver in the
                                        provision of skills and advancing research and development through
                                        universities.

                                                                                                                       10
Table 2: Key Role players in the FP&M sector: Per Sub Sector
Key Role Players in the FP&M Sector : Per Sub Sector
Sub- Organisation Description
Sector
Clothing Apparel Apparel Manufacturers of South Africa (AMSA), is a body
Manufacturers representing five out of every six garment manufacturers in the
Association of South country, and has sought intervention of Durban’s labour court for
Africa (AMSA) compelling the National Bargaining Council for the Clothing
Manufacturing Industry (NBC) to close about 400 companies that
are not willing to comply with the minimum wage norms.
SACTWU Southern Africa Clothing and Textile Workers Union (SACTWU) is
the biggest union in the clothing, textile and leather industry, with
more than 100 000 members. It negotiates wages and conditions
for the vast majority of workers in the clothing, textile and leather
industry and views skills development for its members as an
important objective.
Footwear South African SAFLIA is formally registered with the Department of Labour as a
Footwear and national employer organisation in terms of the Labour Relations
Leather Industries Act. Its constitution makes provision for three separate sections,
Association (SAFLIA) viz. Footwear Manufacturing Section, Supplier Section and the
Tanning Section.
National Footwear The National Footwear and Leather Cluster is a not-for-profit
and Leather Cluster - company established by the Department of Trade and Industry
VUT within the administration of Vaal University of Technology. It
seeks to promote and support the expansion of manufacturing in
the sector.
Forestry Forestry South Africa FSA is the largest forestry organisation representing growers of
(FSA) timber in South Africa. Membership includes all 11 corporate
forestry companies active in the Industry, approximately 1 300
commercial timber farmers and some 20 000 emergent small
scale growers etc.
South African SAFCA offers assistance to all contractors regarding public liability
Forestry Contractors and other insurance, forestry technical assistance (harvesting,
Association (SAFCA) silviculture and transport), business related assistance and
training (capacity development).
Furniture Federation of FBUMA serves as the collective entity of employers (businesses)
Furniture in this Industry and is registered (in terms of the Labour Relations
Manufacturers’ Act) as an Employers Organisation.
Association (FBUMA)
FBUMA represents its members in collective bargaining with
Unions at Industry level.
FP&M SETA Sector Skills Plan for 2015-2020 11Key Role Players in the FP&M Sector : Per Sub Sector
Western Cape The Western Cape Furniture Initiative was formally established in
Furniture Initiative 2009 and to play a role in the furniture sector by building and
(WCFI) marketing a South Africa Furniture Brand locally and
internationally.
Leather Southern African See section on footwear
Footwear and
Leather Industries
Association (SAFLIA)
Packaging The Institute of The Institute of Packaging South Africa (IPSA) was established in
Packaging South February 1970. One of its key objectives is to advance the
Africa (IPSA) standards and methods of education in the field of packaging and
related subjects.
The Packaging The Packaging Council of South Africa (PACSA) founded in 1984 -
Council of South is a voluntary industry body which aims to provide effective
Africa (PACSA) leadership and representation on major external and internal
issues in the packaging sector.
Printing Printing South Africa PSA represents the interests of printing, paper/flexible packaging
(PSA) and newspaper industries to be globally competitive and socially
responsible. Its mission is to promote the sector’s interests with
government, sectoral bodies and any other relevant entity, in
policy matters that affect the operations of its member
organisations.
Printing Employers An employer association looking after the interests of employers
Association of South in the printing industry.
Africa (PEASA)
South African The South African Typographical Union has traditionally
Typographical Union organised workers in the Printing Newspaper and Packaging
(SATU) Industry but has extended its scope to include workers in
Stationary Outlets, Book Shops, Publishing Houses, Advertising
Agencies, Screen and Sign Display Sectors, Photocopy Shops,
Printing Suppliers.
Print Print and Digital PDMSA is dedicated to promoting a free and independent press
Media Media South Africa through close interaction with members and by working together
(PDMSA) across print and digital media.
It promotes and supports compliance with internationally
recognised good governance practices and effective stakeholder
management.
12Key Role Players in the FP&M Sector : Per Sub Sector
The Media The Media Development and Diversity Agency (MDDA) was
Development and established in 2002 to enable historically disadvantaged
Diversity Agency communities and persons not adequately served by the media to
(MDDA) gain access to the media. Its beneficiaries are community media
and small commercial media.
Print Media SA Print and Digital Media South Africa is an umbrella body
incorporating print and digital media. The PDMSA evolved from
the long-established Print Media South Africa and is an
interactive organisation seeking to help its members keep in pace
with the fast-changing media world of the 21st Century.
Publishing Publishers PASA is the largest publishing industry body in South Africa, and
Association of South is committed to creativity, literacy, the free flow of ideas and
Africa (PASA) encouraging a culture of reading.
Library and LIASA is a professional non-profit organisation, uniting and
Information representing all institutions and people working in libraries and
Association of South information services in South Africa.
Africa (LIASA)
Pulp and Paper Manufacturers PAMSA promotes the interests and efforts of the South African
Paper Association of South pulp and paper industry and provides a forum for the
Africa development and presentation of common views on pre-
competitive industry issues, and engages stakeholders on
matters of legislation, skills upliftment, education, research,
environment, sustainability, and recycling.
Textiles South African Cotton SACTPEA represents the interests of employers in Cotton textiles
textiles Processing Processing.
Employers’
Associations
(SACTPEA)
South African Home NAWTM represents the interests of Worsted Textile
textiles Manufacturers.
Manufacturers
Employers
Organisation
(HOMTEX)
National Textile NTMA represents the interests of textile manufacturers.
Manufacturers
Association (NTMA)
Chemical, Energy, The union has members in industries ranging from Oil refineries,
Paper, Printing, Explosives, Chemical, Pulp, Paper, Printing, Furniture, Saw Milling
FP&M SETA Sector Skills Plan for 2015-2020 13Key Role Players in the FP&M Sector : Per Sub Sector
Wood Wood and Allied etc. and is a majority union in all these industries. The union has
Products Workers Union a membership of over 68,000 workers across these industries.
(CEPPWAWU)
Sawmilling South To promote the interest of sawmillers in South Africa including
Africa education and training in the industry.
1.4 Economic Performance
5.1.1. Contribution to the economy
In Figure 3 the effects of the global economic crisis are evident in 2008/9 when economic growth rates
within the FP&M sector, manufacturing broadly and throughout the economy began to plummet. A period
of recovery occurred between 2009/10. However, since 2010 average growth has tended to stagnate
across the economy. This is true even for FP&M despite cyclical upswings in growth in 2012 and more
recently.
Figure 3: Year on year economic growth
15.0%
10.0%
5.0%
0.0%
-5.0%
-10.0%
2005 2006 2007 2008 2009 2010 2011 2012 2013 2014
FPM Sector 2.4% 4.4% 3.1% 10.2% -8.5% 1.7% -1.3% 0.4% -0.7% 0.7%
Manufacturing 3.9% 4.3% 3.6% 4.1% -7.7% 2.1% 0.4% 1.0% 1.1% 0.1%
Total Economy 5.1% 6.0% 4.8% 3.7% -2.2% 2.4% 2.3% 2.8% 2.3% 1.7%
FPM Sector Manufacturing Total Economy
Source: Quantec data, 2015
In 2014, output in the FP&M sector comprised 13, 1% of total manufacturing output (Figure 4). The FP&M
sector’s contribution to total output in the economy has remained relatively stable over the past decade,
ranging from a high of 4% in 2008 to 3, 3% in 2014.
14Figure 4: FPM sector output relative to the economy
16.0%
14.0%
12.0%
10.0%
8.0%
6.0%
4.0%
2.0%
0.0%
2004 2005 2006 2007 2008 2009 2010 2011 2012 2013 2014
Manufacturing 13.3% 13.1% 13.1% 13.0% 13.8% 13.7% 13.6% 13.4% 13.3% 13.1% 13.1%
Total Economy 3.9% 3.8% 3.8% 3.7% 4.0% 3.7% 3.7% 3.6% 3.5% 3.4% 3.3%
Manufacturing Total Economy
Source: Quantec data, 2015
Figure 5 illustrates each sub-sector’s contribution to economic output in real terms. The highest
contributor is the paper and paper products sub sector, whose total contribution was R60 billion rand in
2014. Production in leather, leather products and footwear sub-sectors has stagnated over the past
decade and are the smallest contributors to total output in the sector, just over R5 billion Rand each in
2014.
Figure 5: Sub-sector contribution to total output (Rm 2010 prices)
80 000 Textiles
70 000 Furniture
60 000
Printing, publishing
50 000 and recorded media
Paper and paper
40 000 products
Wood and wood
30 000 product
20 000 Leather and leather
products
10 000 Footwear
- Clothing
2004 2005 2006 2007 2008 2009 2010 2011 2012 2013 2014
Source: Quantec data, 2015
Between 2008 and 2010, the global economic slowdown contributed to a sharp decline in exports across
all sub-sectors. There has been some recovery in Wood and wood products, Leather and leather products
and Textiles exports in recent years. The only sub-sector that had an “up-turn” in exports since 2012 is
Paper and Paper Products (see Figure 6). This is also by far the largest contributor to exports in the sector,
valued at R15 billion Rand in 2014. Since 2000, except for leather and leather products and to a lesser
extent printing, publishing and recorded media, there has been a contraction in exports across the FP&M
sector. This is likely to affect revenue within the sector, as well as the sector’s ability to retain and expand
employment.
FP&M SETA Sector Skills Plan for 2015-2020 15Figure 6: Exports by sub-sector (Rm 2010 prices)
Textiles
18 000
16 000 Furniture
14 000 Printing, publishing and
12 000 recorded media
Paper and paper
10 000 products
8 000 Wood and wood
product
6 000 Leather and leather
4 000 products
Footwear
2 000
- Wearing apparel
2004 2005 2006 2007 2008 2009 2010 2011 2012 2013 2014
Source: Quantec data 2015
While exports have declined, imports on the other hand, have increased dramatically in all sub-sectors
since 2000 (Figure 7), with the exception of the Printing, Publishing and Recorded Media sub-sectors. The
Clothing, Textiles, Footwear, Paper and Paper Products and Furniture sub-sectors have had the biggest
increases in imports. Except for clothing, the overall trend in the FP&M sector has been a stabilisation of
imports over the past two to three years. The total value of imports for the Clothing sub-sector has doubled
from about R6 billion Rand in 2004 to almost R13 billion Rand in 2014. Wood and Wood products, and
Leather and Leather Products have remained the smallest importers of products in the sector (Figure 7).
Figure 7: Imports by sub-sector
Imports per Sub-sector Textiles
Rm 2005-prices
16 000 Furniture
14 000
Printing, publishing
12 000 and recorded media
10 000 Paper and paper
products
8 000 Wood and wood
6 000 product
Leather and leather
4 000
products
2 000 Footwear
-
2004 2005 2006 2007 2008 2009 2010 2011 2012 2013 2014 Clothing
SOURCE: QUANTEC DATA, 2015
1.5 Employer profile
According to South African Revenue Service (SARS) database of employers in the FP&M sector, there are
currently 22 661 employers in the sector. The majority employers are classified as small, employing less
than 50 employees. About 50% of employers in the sector are classified as “unallocated.” The bulk of these
are small businesses that have either not selected an industry code (probably because they do not pay the
16skills levy), or have not chosen a specific code as their businesses overlap multiple sub-sectors making it
difficult to determine the most appropriate one.
Table 3: Employers in the FP&M Sector
Sub-sector Size Large Medium Small (0-49) Total
Unallocated (150+) (50-149)
Sub-sector 1176 110 273 10423 11982
Unallocated
Clothing 9 117 211 3388 3725
Dry Cleaning 2 40 42
Footwear 1 31 40 634 706
Forestry 5 56 66 356 483
Furniture 6 20 31 416 473
General Goods 2 4 9 48 63
Leather 1 14 15 418 448
Packaging 3 27 28 267 325
Print Media 8 12 138 158
Printing 17 50 82 1319 1468
Publishing 3 15 15 345 378
Pulp and Paper 1 10 11 62 84
Textile 7 70 112 1515 1704
Wood Products 3 50 53 516 622
Total 1234 582 960 19885 22661
SOURCE: SARS DATABASE
Most of the employers are based in Gauteng, although KwaZulu Natal has the largest number of large
employers employing more than 150 employees.
Table 4: National Distribution of FP&M Employers
Province Size Large Medium Small (0- Grand
Unallocated (150+) (50-149) 49) Total
Province Unallocated 8 4 12 454 478
Eastern Cape 69 35 39 1043 1186
Free State 21 15 40 526 602
Gauteng 496 141 190 7580 8407
KwaZulu-Natal 253 201 371 4128 4953
Limpopo 32 4 2 8 46
Mpumalanga 45 52 91 1116 1304
North West 24 1 6 239 270
Northern Cape 7 2 4 154 167
Outside SA 1 1
SA National (i.e. in SA but province 1 1
unspecified)
Western Cape 277 127 205 4637 5246
Grand Total 1234 582 960 19885 22661
SOURCE: SARS DATABASE
1.6 Labour market profile
The following section analyses employment in the sector including trends in the various sub-sectors and
occupational categories.
FP&M SETA Sector Skills Plan for 2015-2020 175.1.2. Total employment in the sector
Table 5 indicates that there are approximately 324 642 people employed in the FP&M sector1. This is about
a quarter of the employed in the entire manufacturing sector and 2, 1% of employment in the total
economy. The sector experienced a 27% decline in employment between 2004 and 2014, a total job loss
of 121 000. On the whole, total employment in the sector reflected a decline, dropping from a peak of
approximately 3, 6% of total employment in the country in 2004 to 2, 1% of total employment in 2014.
Table 5: Total employment in the FP&M sector as a percentage of total employment in manufacturing and the economy
FPM as %
Total Manufacturing FPM as % of of Total
Year Economy Sector FPM Sector Manufacturing Economy
2004 12 537 504 1 528 041 445 657 29,2% 3,6%
2005 12 846 267 1 582 427 449 324 28,4% 3,5%
2006 13 401 120 1 583 948 441 749 27,9% 3,3%
2007 13 803 938 1 584 483 439 077 27,7% 3,2%
2008 14 581 481 1 556 541 420 484 27,0% 2,9%
2009 14 189 346 1 434 872 372 704 26,0% 2,6%
2010 13 785 457 1 402 148 361 153 25,8% 2,6%
2011 14 067 125 1 390 198 353 064 25,4% 2,5%
2012 14 423 487 1 351 616 334 651 24,8% 2,3%
2013 14 864 716 1 381 682 334 588 24,2% 2,3%
2014 15 144 355 1 349 262 324 642 24,1% 2,1%
Quantec data, 2015
Over the past decade total employment in the FP&M sector has been in decline. The largest contraction
happened between 2007 and 2009 during the global economic crisis. Compared to the rest of the
manufacturing sector and the economy as a whole, the FP&M sector has been shedding jobs at a higher
rate. (See Change in employment over the past decade in FP&M, manufacturing as a whole and the
economy below):
1 Analysis based on Quantec data reflecting 2014 employment statistics. Figures exclude forestry and dry cleaning.
18Figure 8: Change in employment over the past decade in FP&M, manufacturing as a whole and the economy
0.08
0.06
0.04
0.02 Total Economy
-
2004 2005 2006 2007 2008 2009 2010 2011 2012 2013 Manufacturing
( 0.02) Sector
( 0.04) FPM Sector
( 0.06)
( 0.08)
( 0.10)
( 0.12)
( 0.14)
Quantec Data, 2015
The sector has generally been shedding jobs between 2004 and 2014. There was a 27% reduction in
employment during this period across the sector, with the clothing experiencing the highest proportion of
job losses at 47% (Figure 9). During this period, with the exception of paper and pulp sub-sector and
footwear, all other sub-sectors experienced some job losses. Sector stakeholders have indicated that
where job losses were as a result of imported goods being cheaper than locally produced goods, this is
likely to be reversed because of exchange rates. A consistently and relatively weaker rand has rendered
some imported goods expensive to import and these employers are starting to invest in local production,
contributing to local employment.
Figure 9: Percentage change in employment: 2004-2014
20%
10% 14% 9%
0%
-10%
-10%
-20% -24%
-26% -29% -28%
-30%
-40% -47%
-50%
Textiles Furniture Printing, Paper and Wood and Leather and Footwear Clothing
publishing paper wood leather
and recorded products product products
media
Source: Quantec data, 2015
FP&M SETA Sector Skills Plan for 2015-2020 195.1.3. Employee geographical spread
KwaZulu-Natal has the most employees, accounting for 34% of employees, followed by Western Cape
(26%) and Gauteng (19%). The Northern Cape, which has the lowest population density in the country
(Figure 10).
Figure 10: Employee Profile per Sub-sector
Employees per Province
60000
50000
40000
30000
20000
10000
0
Eastern KwaZulu- Mpumala North Northern Western
Freestate Gauteng Limpopo
Cape Natal nga West Cape Cape
Employees 7759 1871 30606 55220 1628 12096 3612 142 41180
SOURCE: FP&M SETA MIS DATABASE, WSP SUBMISSIONS 2014
5.1.4. Employee occupational profile
The occupational profile of the FP&M sector is informed by the nature of business that the sector is
involved in and therefore the type of skills required in the production process. Based on an analysis of WSP
submissions, Figure 11 depicts the highest proportion of the workforce employed in elementary
occupations (31%) followed by Plant and Machine Operators and Assemblers (29%). These occupation
groups account for 60% of the work force. Service and Sales Workers has the lowest representivity,
accounting for 2% of the workforce whilst managers (7%) and professionals (5%) together account for 12%
of the workforce. The occupational profile of the sector implies a requirement for lower level skills to
ensure competitiveness.
20Figure 11: Sector occupational profile
Clerical Support Workers
2%
Elementary Occupations
5%
11% 8% 7%
Managers
31%
Plant And Machine Operators and
29% 7% Assemblers
Professionals
Service and Sales Workers
Skilled Agricultural, Forestry, Fishery,
Craft and Related Trades Workers
Source: FP&M SETA MIS Database, WSP submissions
Each of the sub-sectors of the FP&M sector appears to have a different occupational profile. Based on an
analysis of WSPs in 2014:
6. Clothing sub-sector has the highest proportion of Plant And Machine Operators and Assemblers (47%)
followed by elementary occupations with 26%
7. Dry cleaning sub-sector has the highest proportion of Plant And Machine Operators and Assemblers
(62%) followed by Clerical Support Workers with a 27% representivity
8. Footwear sub-sector has the highest proportion of Plant And Machine Operators and Assemblers
(40%) followed by elementary occupations with a representivity of 38%
9. Forestry sub-sector employs more people in elementary occupations (64%) followed by Plant And
Machine Operators and Assemblers with a representivity of 14%
10. Furniture sub-sector employs more people in elementary occupations (34%) followed by Plant and
Machine Operators and Assemblers with a representivity of 21%. Skilled Agricultural, Forestry, Fishery,
Craft and Related Trades Workers make up 20% of employees in the sub-sector
11. General goods sub-sector employs more people in elementary occupations (75%) followed by Plant
And Machine Operators and Assemblers with a representivity of 12%
12. The leather sub-sector employs more Plant and Machine Operators and Assemblers (33%) followed by
elementary occupations with a representivity of 24%. Skilled Agricultural, Forestry, Fishery, Craft and
Related Trades Workers make up 14% of employees in the sub-sector
13. The packaging sub-sector has a high proportion of Plant And Machine Operators and Assemblers (47%)
followed by elementary occupations with a representivity of 22%
14. In the print media sub-sector, there is a high representivity of Plant and Machine Operators and
Assemblers (20%). Clerical Support Workers and professionals feature prominently at 18% and 17%
respectively.
15. Skilled Agricultural, Forestry, Fishery, Craft and Related Trades Workers has the highest representivity
in the printing sub-sector at 31% followed by Plant And Machine Operators and Assemblers at 14%.
Clerical Support Workers and Elementary Occupations each have a 13% representivity
16. The publishing sub-sector tends to employ high level skills with professionals at 36%, Clerical Support
Workers (20%), Technicians and Associate Professionals (13%) and managers at 12%
FP&M SETA Sector Skills Plan for 2015-2020 2117. The paper and pulp sub-sector has a high representivity of Plant And Machine Operators and
Assemblers (34%) followed by elementary occupations with a representivity of 20%
18. Textiles sub-sector employs more people in elementary occupations (37%) followed by Plant And
Machine Operators and Assemblers with a representivity of 33%
19. The wood products sub-sector employs more people in elementary occupations (46%) followed by
Plant And Machine Operators and Assemblers with a representivity of 22%
5.1.5. Employee age profile
Table 6 provides a breakdown of the age profile of employees per sub-sector. The number of employees
between the ages of 35-55 in the FP&M sector is higher than the rest of the other age categories at 52.1%.
Dry cleaning is the sub-sector with the highest proportion of people over the age of 55 at 21%. Printing is
the second highest with 11% proportion whist publishing together with Pulp & Paper each have 10%.
Across most sub-sectors with the exception of general goods (43%) and packaging (46%), the workforce is
between the ages 35 and 55. Although figures in Table 6 do not create significant concern for an aging
workforce across the FP&M sector, through stakeholder interviews it emerged that this is a challenge,
particularly amongst certain technical skills (such as patternmaking) in the clothing and textiles sub-
sectors.
Table 6: Employee age per sub-sector
Sub-sector Age: < 35 Age: 35 - 55 Age: > 55
Clothing 15204 23447 3673
Dry Cleaning 20 38 15
Footwear 2598 4467 738
Forestry 7306 9204 1408
Furniture 2820 3422 547
General Goods 1290 1097 151
Leather 1140 1733 273
Packaging 2573 2542 455
Print media 413 500 44
Printing 7393 9646 2044
Publishing 3586 4367 892
Pulp & Paper 2814 3832 710
Textiles 4250 5401 801
Wood Products 8949 9115 1421
#N/A 2526 4571 864
Total 62882 83382 14036
SOURCE: FP&M SETA MIS DATABASE, WSP SUBMISSIONS 2014
5.1.6. Employee race, gender and disability profile
Table 7 provides the racial and gender breakdown of FP&M employees per sub-sector. The majority of
employees in the FP&M sector are Africans, who represent 59.9% of employees in the industry. In terms
of sub-sectors, Dry cleaning has a very high proportion of Africans (97%2) followed by general goods (93%)
and forestry (90%). The least proportion of Africans is employed in the publishing sub-sector (26%),
2 This is based on very few WSP submissions and this could be an inaccurate reflection of the sub-sector in its totality
22dominated by the White population group. Females represent 53% of employees within the sector, whilst
males represent 47% of the sector’s employees. This is important as it articulates with the objectives of
the NDP, which prioritizes gender transformation and the empowerment of woman, working towards the
achievement of provision of equal opportunities for all women in the country. The Clothing and Textiles
sub-sectors have an overwhelming concentration of women employees. In terms of sub-sectors, clothing
has the highest proportion of females (72%) followed by dry cleaning (66%) and footwear (60%). Pulp &
paper (24%) together with packaging (25%) have the least number of females as a proportion of total
workforce for the sub-sector.
Table 7: Employee race and gender per sub-sector
Sub-sector African Coloured Indian White Male Female
Clothing 22840 13434 3825 2225 11762 30562
Dry Cleaning 71 1 0 1 25 48
Footwear 3363 2960 1045 435 3123 4680
Forestry 16231 897 136 654 11730 6188
Furniture 4272 1405 555 557 4943 1846
General Goods 2369 55 46 68 1618 920
Leather 1948 801 129 268 1461 1685
Packaging 3893 645 572 460 4194 1376
Print media 382 131 168 276 663 294
Printing 7613 5329 2255 3886 12192 6891
Publishing 2272 2259 722 3592 3848 4997
Pulp & Paper 3771 1520 657 1408 5603 1753
Textiles 6148 3001 590 713 4883 5569
Wood Products 16509 999 349 1628 13242 6243
#N/A 4685 1351 712 1213 5954 2007
Total 96367 34788 11761 17384 85241 75059
SOURCE: FP&M SETA MIS DATABASE, WSP SUBMISSIONS 2014
Table 8 indicates the number of disabled employees per sub-sector. The manufacturing sector makes
provision for equal opportunity of disabled people. The employee disability profile is based on analysis of
WSP data, which gives broad indications of the profile in the sector. Based on analysis of WSP submissions
by 676 employers in the sector, there are 942 people living with disabilities employed in the sector,
reflecting 0.6% of total employment reported. 41% of the people with disabilities are African, 28%
Coloured, 21% white and 9% Indian. The most people with disabilities are employed in the clothing sub-
sector (21%) followed by Printing (19%) and Pulp & Paper (14%).
FP&M SETA Sector Skills Plan for 2015-2020 23Table 8: Employee disability per sub-sector
Sub-sector African Coloured Indian White
Clothing 67 115 10 15
Dry Cleaning 0 0 0 0
Footwear 5 10 4 2
Forestry 26 3 0 5
Furniture 7 3 7 8
General Goods 1 3 0 0
Leather 16 8 8 3
Packaging 16 15 4 4
Print media 8 1 4 3
Printing 71 57 14 40
Publishing 21 7 7 62
Pulp & Paper 50 24 20 35
Textiles 11 10 4 3
Wood Products 84 5 4 8
#N/A 10 4 3 7
Total 393 265 89 195
Source: FP&M SETA MIS Database, WSP submissions 2014
1.7 Conclusion
Output in the FP&M sector has tended to follow that in the wider manufacturing sector and the economy
as a whole. Economic decline in 2008/9 was a feature of the global economic crisis. This led to some
recovery over 2009/10. Since 2010 growth in the sector, albeit with occasional cyclical upswings, has
stagnated, mirroring that of output across the economy. The highest contributor to output is the paper
and paper products sub sector, whose total contribution was R60 billion rand in 2014.
Exports followed a similar trajectory, declining substantially between 2004 and 2014. Since 2000, except
for leather and leather products and to a lesser extent printing, publishing and recorded media, there has
been a contraction in exports across the FP&M sector. There has been some export recovery in Wood and
wood products, Leather and leather products and Textiles exports in recent years. The only sub-sector that
had an “up-turn” in exports since 2012 is Paper and Paper Products. This is also by far the largest
contributor to exports in the sector, valued at R15 billion Rand in 2014.
Whilst exports have declined, imports have increased dramatically in all sub-sectors since 2000, with the
exception of the Printing, Publishing and Recorded Media sub-sectors. The total value of imports for the
Clothing sub-sector has doubled from about R6 billion Rand in 2004 to almost R13 billion Rand in 2014.
There are currently 22 661 employers in the sector, the majority of whom are small, employing less than
50 employees. The geographical spread of employers (both large and small) is biased towards the urban
regions of Gauteng, KwaZulu-Natal and the Western Cape.
24There are approximately 324 642 people employed in the FP&M sector3. This is about a quarter of the employed in the entire manufacturing sector and 2, 1% of employment in the total economy. The sector experienced a 27% decline in employment between 2004 and 2014, a total job loss of 121 000. KwaZulu-Natal has the most employees, accounting for 34% of employees, followed by Western Cape (26%) and Gauteng (19%). Compared to the rest of the manufacturing sector and the economy as a whole, the FP&M sector has been shedding jobs at a higher rate. With the exception of publishing and print media which have a higher proportion of highly skilled professionals (36% and 17% respectively) most of the sub- sectors employ mostly Plant and machine operators and assemblers, elementary occupations, and clerical support workers, based on an analysis of WSPs in 2014. The majority of employees in the FP&M sector are Africans, who represent 59.9% of employees in the industry. The least proportion of Africans is employed in the publishing sub-sector (26%), dominated by the White population group. Females represent 53% of employees within the sector, whilst males represent 47% of the sector’s employees. Based on analysis of WSP submissions by 676 employers in the sector, there are 942 people living with disabilities employed in the sector, reflecting 0.6% of total employment reported. This chapter reveals that the FP&M sector has value chain linkages with other sectors based on the exchange and feeder relationships between primary and secondary production during manufacturing, and with the tertiary sector in the marketing and sale of produced goods. A value chain approach to profiling and analysing the sector exposes holistic and integrated opportunities for sector development. For example it is evident where the major challenges are in relation to the processing of primary products into secondary products and the need for interventions to beneficiate and produce domestically what is currently being exported. Equally it is clear that there are opportunities to produce in more environmentally sustainable ways and to make use of waste produced at different points in the value chain – for example the huge amount of paper produced and discarded is a clear opportunity for recycling. 3 Analysis based on Quantec data reflecting 2014 employment statistics. Figures exclude forestry and dry cleaning. FP&M SETA Sector Skills Plan for 2015-2020 25
You can also read