Technical Assistance Consultant's Report
←
→
Page content transcription
If your browser does not render page correctly, please read the page content below
Technical Assistance Consultant’s Report

Project Number: 7106
May 2011

India: Preparing the Bihar Urban Development
Project—Urban Sector Road Map

Prepared by:
GHK Consulting Limited, UKG, in association with STUP Consultants P. Ltd., IND, and
Castalia Strategic Advisors, USA

For Urban Development and Housing Department, Government of Bihar

This consultant’s report does not necessarily reflect the views of ADB or the Government concerned, and
ADB and the Government cannot be held liable for its contents. (For project preparatory technical
assistance: All the views expressed herein may not be incorporated into the proposed project’s design.
Bihar Urban Development Investment
            Program (BUDIP)

                      Urban Sector Road Map
                           Volume 1 of 4
                              FINAL

                               May 2011

                                           Urban Development & Housing
GHK, UK                                                    Department
                                                    Government of Bihar
in association with
Castalia
                                          Asian Development Bank (ADB)
STUP Consultants
DISCLAIMER The contents of the reports are the recommendation of the consultants engaged under the project preparatory technical assistance (PPTA) by the Asian Development Bank (ADB). ADB missions subsequent to the PPTA will conduct due diligence and may modify the scope, implementation arrangements, safeguard measures and analysis. Therefore, the subsequent ADB‘s official documents (such as the legal documents, the framework financing agreement, the report and recommendations of the president, the facility administration manual, the aide memoirs) will supersede the contents of the reports, in case there are conflicts.
This submission is in 4 Volume.

Volume 1: A State-wide Urban Sector Development Roadmap - An ADB
MFF requires a road map (i.e., a sector strategy). Investments consistent with the
road map will be financed under the related MFF. The road map define (i) the
strategic directions for a sector, service, or industry; (ii) its importance to growth,
poverty reduction, gender and development, and inclusiveness (or the extent to
which it is a binding constraint); and (iii) the list of success factors for better
performance. The road map includes a detailed assessment of physical and non-
physical investments. These assessments highlight the main investment and non-
investment bottlenecks, risks, and mitigation measures. This Road Map
information then informs the strategic context, policy framework, and investment
programs as well as the interventions needed and their sequencing.

Volume 2: Investment Program - The ultimate objective of the investment
program is “sustainable economic growth through improved quality of urban life”.
The Investment Program seeks to improve the quality, coverage, and reliability of
water supply and wastewater management services for an estimated 1.6 million
residents in four participating towns in Bihar. Enhanced financial sustainability of
these services is essential. Under the Investment Program, service providers will
have clear roles and strengthened lines of accountability, be reoriented toward
cost recovery and sustainability, and be motivated to perform. The investment
program focuses on the sub-sectors, which promises maximizing the economic
potential of the state. The Investment Program covers (a) Identification of the
specific towns and sub-sectors for ADB financing,(b) urban local bodies regulatory
reforms required for making urban development efficient, (c) reforms required
improving financial governance, (d) shortlist of the subprojects in the selected
towns, with broad description and indicative cost, (e) feasibility and uncertainty
assessment to identify the implementation sequence of the short listed
subprojects, (f) sector-wide economic, financial, social analysis and safeguards
framework. The geographic coverage of the investment program is the four towns
with highest economic growth potential under four sub-sectors as prioritised by
the road map

Volume 3: Sector Reports - Volume 3A covering (i) Economic development,
(ii) Urban service delivery, and (iii) Cost of Road map implementation. Volume 3
B: include (i) Physical and non-physical investment in urban service delivery
namely, water supply, sewerage, solid waste management, and drainage, (ii)
Urban governance plan, (iii) Sector investment plan and (iv) Implementation
arrangements and (v) Financial management assessment.

Volume 4: Social and Environmental Safeguards – Covered in this
Volumes are: Social analysis, Poverty reduction and social strategy, Gender and
social action plans, Environment assessment, resettlement framework, Indigenous
peoples development framework and Consultation and participation planning
framework.
Acknowledgements

“Any city however small, is in fact divided into two, one the city of the poor, the other of the rich.
These are at war with one another.” Plato (BC 427-BC 347)

During the tenure of this assignment, help, co-operation and assistance have been obtained from
a large number of individuals, government departments, local bodies, para-statal agencies, social
workers, representatives of NGOs and CBOs. They have provided their valuable time and
suggestions to members of the PPTA team to assist in this study. It is rather difficult to thank them
individually. We express our sincere thanks to all those people collectively.

Their support, encouragement and insights into the social, economic, environmental and
infrastructure problems of the study area and the sector as a whole have provided an essential
input into the proposals in the report. More often than not, these suggestions triggered useful
discussions in shaping various projects in project tows of Bhagalpur, Darbhanga, Gaya and
Muzzaffarpur for infrastructure improvement.

In addition to the obviously critical technical support by the Asian Development Bank, preparation
of this Report was made possible through the enthusiastic support and guidance of Shri Girish
                              1
Shankar, Principal Secretary and Shri D K Shukla, Special Secretary of the Urban Development
and Housing Department, Government of Bihar and the Mayors, Municipal Commissioners and
their enthusiastic staff in the preparation of this PPTA report. At the very pragmatic level, Mr.
Hiroyuki Ikemoto, the ADB Urban Development Economist, continues the challenge of supporting
the consulting team and their enormous requests. Our thanks are also due to Shri Shashi Shekhar
Sharma who guided the completion of this final report upon taking over as Principal Secretary from
February 2011.

Unknown to them, but the daily observation of all residents, their situations and their needs
contributes the most to the exercise, and will be thanked by successfully contributing this project's
results to their future.

Consultants Team

S Bhattacharyya, Project Management Specialist /Team Leader
John R Block, Water Sector Specialist
John R Bowers, Urban Planer
Vijay Tandon, Project Economist / Project Director
Krishnan Padmanabhan, Financial Management & Accounting Specialist
Archana S Hinduja, Urban Planner
Parthajit Patra, Water Supply Specialist
Tapan Banerjee, Institutional Specialist
Sandeepan Choudhury, Sewerage Specialist
Ardhendu Mitra, Environment Specialist
Saswati Ghosh Belliappa, Social & Community Development Specialist
Naval Paswan, Economist
Rajeev Singh, Statistician
Suresh Gupta, Procurement Specialist
Sunil Kumar Goyal, Municipal Engineer
Arkaja Singh, PPP Specialist
P N Bhattacharya, Municipal Engineer
Bihar Urban Development Investment Program
Contents
1 Basic Assumptions .............................................................................................. 1
1.1 Population ................................................................................................................................ 1
1.2 Definition of Sub-sector in the Road Map ................................................................................ 5
2 Economic Development .................................................................................... 7
2.1 Existing Situation Assessment ................................................................................................. 7
2.2 Future Growth Assessment .................................................................................................... 15
3 Urban Service Delivery .................................................................................... 23
3.1 Current Coverage and Condition ........................................................................................... 23
3.2 Legal and Institutional Framework ......................................................................................... 30
3.3 Human Resources.................................................................................................................. 33
3.4 Finance for Urban Service Delivery ....................................................................................... 37
3.5 Binding Constraints on Efficient and Equitable Service Delivery ........................................... 41
4 National and State Policies .............................................................................. 45
4.1 Government Plans, Policies and Guidelines .......................................................................... 45
5 Bihar Urban Sector Road Map - Cost and Implementation ........................... 52
5.1 Physical Investments in Each Sub-Sector ............................................................................. 52
5.2 Non-Physical Investments – All Sub-Sectors ......................................................................... 53
5.3 Target Population Coverage .................................................................................................. 53
6 Sources of Financing ....................................................................................... 57
6.1 Details of Investment Planned / Ongoing- Centrally Sponsored Projects .............................. 57
6.2 Details of Planned / Ongoing Projects – State Plan............................................................... 61
6.3 Financing Sources for Roadmap Implementation .................................................................. 64
LIST OF TABLES
Table 1.1 Population by Town (sex disaggregated) 1981-2001 ...................................................... 2
Table 1.2 Population Projections by Town (sex disaggregated) 2010-2020 ................................... 4
Table 2.1 Recent GSDP Growth Rates ........................................................................................... 8
Table 2.2 Bihar and India Sector Employment (%) ....................................................................... 10
Table 2.3 Value and Share of 20 Districts in Bihar GSDP ............................................................. 12
Table 2.4 Impact of Sector Policies on Economic Growth of Bihar ............................................... 13
Table 2.5 Major Economic Activities and Engines of Past Economic Growth of State ................. 16
Table 2.6 Major Economic Activities and Engines of Future Economic Growth of Bihar State (as %
share of GSDP of Bihar) ................................................................................................ 17
Table 2.7 Change in Dominance of Economic Activities by District (2010-2020) ......................... 19
Table 2.8 Ratios (%ages) of Towns with Growth Potential by Economic Profiles ......................... 20
Table 2.9 Urban Services for Sector-based Economic Growth ..................................................... 21
Table 2.10 Urban Services Required by 6 Towns Having Largest SGDP Contributions ................ 21
Table 3.1 Level of Urban Service - Bihar in Comparison with National Standard, National Average
and 24 Town Average .................................................................................................... 23
Table 3.2 Index Value - Level of Criticality - Bihar Urban Services as Ratio of Existing Level of
Service and National Standard of MOUD ...................................................................... 25
Table 3.3 Level of Criticality of Bihar Urban Services ................................................................... 26
Table 3.4 Demand and Availability of Power in Bihar (Mega Watts) ............................................. 29
Table 3.5 Most Vulnerable Six Towns for Each Subsector in Bihar .............................................. 29
Table 3.6 Status of Current Slum Upgrading Projects in Bihar ..................................................... 30
Table 3.7 Proposed 64 Amendments to BMA by SPUR ............................................................... 31
Table 3.8 Government Departments and Agencies Involved in Urban Development ................... 32
Table 3.9 Cost of Solutions (Rs Million) ......................................................................................... 33
Table 3.10 Comparison Asset Management and O&M Staff with National Average ..................... 34
Table 3.11 General Qualifications of Asset Creation Staff .............................................................. 35
Table 3.12 World-Class Norms for Comparable Unit ...................................................................... 35
Table 3.13 Skilled Asset Management Staff Number Deficiencies in each Town ........................... 36
Table 3.14 Annual Cost of Mitigating Deficiency (Rs. Million) ......................................................... 37
Table 3.15 UD&HD Budget Allotment for Capital Works in ULBs (Rs. Million) ............................... 38
iBihar Urban Development Investment Program
Table 3.16 UD&HD Budget Allotment for O&M (Non Plan) in ULBs ............................................... 39
Table 3.17 Mobilizing More Revenue .............................................................................................. 40
Table 3.18 Binding Constraints on Efficient and Equitable Delivery................................................ 41
Table 3.19 Measures Proposed For Systemic Improvement Of Urban Service Delivery................ 44
Table 4.1 Water Supply Policies From Central Government ......................................................... 45
Table 4.2 Sewerage Policies From Central Government .............................................................. 46
Table 4.3 Solid Waste Management Policies From Central Government ..................................... 47
Table 4.4 Drainage Policies From Central Government ................................................................ 47
Table 4.5 Urban Transport Policies From Central Government .................................................... 48
Table 4.6 Urban Slum Policies From Central Government - On-Going and Planned Initiatives For
Slum Improvement In Bihar ........................................................................................... 49
Table 4.7 Water Supply Policies .................................................................................................... 50
Table 4.8 Sewerage Policies ......................................................................................................... 51
Table 4.9 Solid Waste Management Policies ................................................................................ 51
Table 4.10 Drainage Policies ........................................................................................................... 51
Table 4.11 Urban Transport Policies ............................................................................................... 51
Table 5.1 Physical Investment Cost - Roadmap Implementation (Rs. Million) .............................. 52
Table 5.2 Physical Investment Cost - Roadmap Implementation ($ Million) ................................. 53
Table 5.3 Non-Physical Investments for all Sub-Sectors (Rs Million) ........................................... 53
Table 6.1 Water Supply Projects ................................................................................................... 57
Table 6.2 Sewerage Projects ......................................................................................................... 58
Table 6.3 Solid Waste Management Projects ................................................................................ 58
Table 6.4 Drainage Projects .......................................................................................................... 59
Table 6.5 Road Projects ................................................................................................................ 59
Table 6.6 Slum Infrastructure and Housing Projects ..................................................................... 60
Table 6.7 Ongoing - State's Own Financed Projects Water Supply Projects ................................ 61
Table 6.8 Source of Financing – Total (Rs. Million) ....................................................................... 64
Table 6.9 Source of Financing - All Towns ($ Million) ................................................................... 64
Table 6.10 Source of Financing - 24 Towns (Rs Million) ................................................................. 64
Table 6.11 Source of Financing - 24 Towns (US $ Million) ............................................................. 65
Table 6.12 Source of Financing - 4 Towns (Rs Million) ................................................................... 65
Table 6.13 Source of Financing - 4 Towns (US $ Million) ............................................................... 65
LIST OF FIGURES
Figure 1.1 Road Map – 24 Towns ..................................................................................................... 3
Figure 2.1 GDP India and GDP Bihar (Rs Billions) ........................................................................... 9
Figure 2.2 Per Capita GSDP of Bihar and Per Capita NSDP of India (Rs) ..................................... 9
Figure 2.3 Share of Sector Employment in Bihar............................................................................ 11
Figure 2.4 Share of Sector Employment in India ............................................................................ 11
Figure 2.5 Bihar GSDP (Rs Billion) and Bihar GSDP Per Capita (Rs) ........................................... 16
Figure 2.6 Bihar Sector Growth Trends and Projections ................................................................ 18
Figure 5.1 Target Population Coverage Water Supply ................................................................... 54
Figure 5.2 Target Population Coverage Sewerage ........................................................................ 54
Figure 5.3 Target Population Coverage - Solid Waste Management ............................................ 55
Figure 5.4 Target Population Coverage- Drainage ......................................................................... 55
Figure 5.5 Target Population Coverage- Urban Roads .................................................................. 56
iiBihar Urban Development Investment Program
Abbreviations and Acronyms
ADB Asian Development Bank
AIFC Average Incremental Financial Cost
AIMS Asset Inventory Management System
AMPs Asset Management Plans
AP Affected Persons
ARV Annual Rental Value
ASI Archeological Survey of India
BHB Bihar Housing Board
BIS Bureau of Indian Standards
BMA Bihar Municipal Act
BMC Bhagalpur Municipal Corporation
BME Benefit Monitoring Evaluation
BOEC Bid Opening and Evaluation Committee
BOT Build Operate Transfer
BOOT Build Own Operate Transfer
BPL Below Poverty Line
BRCD Bihar Road Construction Division
BRJP Bihar Rajya Jal Parshad
BUDA Bihar Urban Development Agency
BUDP Bihar Urban Development Project
BUIDCO Bihar Urban Infrastructure Development Corporation
BUDIP Bihar Urban Development Investment Program
CAA Constitution Amendment Act
CAG Comptroller and Auditor General
CAGR Compounded Annual Growth Rate
CAPEX Capital Expenditure
CAPP Community Awareness and Participation Program
CBO Community Based Organisation
CC City Corporation
CCF City Challenge Fund
CDP City Development Plan
CFE Consent for Establishment
CFO Consent for Operation
CLC City Level Committee
CLIP City Level Infrastructure Plan
CLIP City Level Investment Plan
CMO Chief Municipal Officer
CPCB Central Pollution Control Board
CPHEEO Central Public Health and Environmental Engineering Organization
CSC Consultant Selection Committee
CSS Centrally Sponsored Schemes
DBOT Design Build Operate Transfer
DFID Department for International Development
DLAO District Land Acquisition Officer
DM District Magistrate
iiiBihar Urban Development Investment Program
DMA Directorate of Municipal Administration
DMC Darbhanga Municipal Corporation
DPR Detailed Project Report
DSC Design Supervision Consultants
EA Executing Agency
EAP Externally Aided Projects
EARF Environmental Assessment and Review Framework
EARP Environmental Assessment and Review Procedures
EC Empowered Committee
EIA Environment Impact Assessment
EIRR Economic Internal Rate of Return
EMP Environmental Monitoring/ Management Plan
EOIs Expression of Interest
ERP Enterprise Resource Planning
EU European Union
FBAS Fund Based Accounting System
FDI Foreign Direct Investment
FFA Financing Framework Agreement
FGD Focus Group Discussion
FGIA First Generation Imprest Account
FI Financial Institution
FIRR Financial Internal Rate of Return
FIS Financial Information System
FMAQ Financial Management Assessment Questionnaire
FOP Financial and Operating Plan
FYP Five Year Plan
GAP Gender Action Plan
GDP Gross Domestic Product
GEM Generators of Economic Momentum
GIS Geographic Information System
GMC Gaya Municipal Corporation
GoB Government of Bihar
GoI Government of India
GSDP Gross State Domestic Product
HH Household
HUDCO Housing and Urban Development Corporation
IA Implementing Agency
IAS Indian Administrative Service
ICB International Competitive Bidding
ICT Information Communication Technology
IEC Information, Education and Communication
IEE Initial Environmental Examination
IHSDP Integrated Housing and Slum Development Program
IP Indigenous People
IPDF Indigenous People‟s Development Framework
IPDP Indigenous People‟s Development Plan
IPT Intermediate Public Transport
ivBihar Urban Development Investment Program
JBIC Japanese Bank for International Cooperation
JNNURM Jawaharlal Nehru Urban Renewal Mission
KfW Kreditanstalt fur Wiederaufbau
Km Kilometer
LAA Land Acquisition Act
LCC Life Cycle Cost
M&E Monitoring and Evaluation
MFF Multi-Tranche Financing Facility
MFI Multilateral Financial Institutions
MIS Management Information System
MLD Million Litres per Day
MMC Muzaffarpur Municipal Corporation
MML Model Municipal Legislation
MoEF Ministry of Environment and Forest
MoUD Ministry of Urban Development
MoUDPA Ministry of Urban Development and Poverty Alleviation
MUDPA Ministry for Urban Development and Poverty Alleviation
NCB National Competitive Bidding
NCU National Commission on Urbanization
NGO Non Governmental Organization
NGRBA National Ganga River Basin Authority
NH National Highway
NHAI National Highway Authority of India
NIC National Informatics Centre
NIUA National Institute of Urban Affairs
NMAM National Municipal Accounting Manual
NMCP National Minimum Common Program
NMT Non Motorized Transport
NOC No Objection Certificate
NPRR National Policy for Resettlement and Rehabilitation
NSSO National Sample Statistics Organization
NUIS National Urban Information System
OHT Overhead Tank
O&M Operation and Maintenance
PAC Project Advisory Committee
PAF Project Affected Families
PAH Project Affected Households
PFDS Pooled Finance Development Scheme
PHED Public Health Engineering Department
PIU Project Implementing Unit
PMC Project Management Consultants /Patna Municipal Corporation
PMU Project Management Unit
PPMS Project Performance Monitoring System
PPP Public Private Partnership
PRDA Patna Regional Development Authority
PS Pumping Station
PSP Private Sector Participation
vBihar Urban Development Investment Program
PUA Patna Urban Area
PWB Patna Water Board
PWD Public Works Department
R&R Resettlement and Rehabilitation
RBI Reserve Bank India
RCC Reinforced Cement Concrete
RCD Road Construction Department
RFP Request for Proposal
RP Resettlement Plan
SBD Standard Bid Document
SC Sub Committee
SCADA Supervisory Control and Data Application
SEIAA State Environment Impact Assessment Authority
SFC State Finance Commission
SGIA Second Generation Imprest Account
SIA Social Impact Assessment
SIEE Summary Initial Environmental Examination
SJSRY Swarna Jayanti Sahari Rozgar Yojana
SLS Sanitary Landfill Site
SOE Statement of Expenditure
SPRSS Summary Poverty Reduction and Social Strategy
SPUR Support Program for Urban Reforms
SPV Special Purpose Vehicle
STP Sewage Treatment Plant
SWM Solid Waste Management
TAC Tender Approval Committee
TAC Technical Assistance Cluster
TEC Tender Evaluation Committee
TBA To Be Agreed
TC Town Committee
TCPO Town and Country Planning Organization
TP Town Panchayat
TPD Ton per day
UA Urban Agglomeration
UDHD Urban Development and Housing Department
UEPA Urban Employment and Poverty Alleviation
UFW Unaccounted for Water
UIDSSMT Urban Infrastructure Development Services in Small and Medium
Towns
ULB Urban Local Body
UNDP United Nations Development Program
URIF Urban Reform Incentive Fund
USAID United States Agency for International Development
WTP Willingness to Pay
WTP Water Treatment Plant
viBihar Urban Development Investment Program
1 Basic Assumptions
1.1 Population
1.1.1 Historical
Population of Bihar by town (sex disaggregated) between 1981-2001 is shown in Table
1.1.
1.1.2 Methods of Projections
Population projections have been estimated for Bihar state and the selected 24 towns
(Figure 1.1) up to the year 2041. Growth trends of decadal population of the State and
towns during 1961, 1971, 1981, 1991 and 2001, based on the available census data, have
been estimated and plotted on a polynomial graph. This trend, depicted as a formula, has
been applied to 2001 population for projecting 2010, 2011, 2015, 2020, 2021 and up to
2041 population.
Projected population has been disaggregated based on the sex ratio. This ratio has been
ascertained by growth trends of male and female population based on available census
data for 1981, 1991 and 2001.
1.1.3 Projections
Table 1.2 shows the population projections by town (sex disaggregated) for the next 10
years. For details refer Section 1 of Volume 3A - Sector Reports.
Volume 1: Urban Sector Road Map Page 1Bihar Urban Development Investment Program
Table 1.1 Population by Town (sex disaggregated) 1981-2001
Towns 1981 1991 2001
Total Male Female Total Male Female Total Male Female
1 Arrah 125111 67516 57595 157082 84726 72356 203380 109867 93513
2 Bagaha 32597 17327 15270 64627 34821 29806 91467 48526 42941
3 Begus arai 56633 30503 26130 71424 38881 32543 93741 49971 43770
4 Bettiah 72167 38460 33707 92653 49627 43026 116670 61753 54917
5 Bhagalpur 225062 121544 103518 253225 136583 116642 340767 182806 157961
6 Bihar Sharif 151343 79950 71393 201323 106916 94407 232071 122019 110052
7 Chapra 111564 59933 51631 136877 73948 62929 179190 95494 83696
8 Danapur Nizam at 58684 31250 27434 84616 45468 39148 131176 69419 61757
9 Darbhanga 176301 94149 82152 218391 116912 101479 267348 142377 124971
10 Dehri 90409 49209 41200 93594 50674 42920 119057 63540 55517
11 Gaya 247075 132085 114990 291675 156899 134776 389192 206498 182694
12 Hajipur 62520 33580 28940 87687 47093 40594 119412 63838 55574
13 Jam alpur 78356 42364 35992 86112 47056 39056 96983 51620 45363
14 Katihar 122005 66459 55546 154367 83986 70381 190873 102161 88712
15 Kis hanganj 51790 28221 23569 64568 34677 29891 85590 46253 39337
16 Motihari 57911 31677 26234 77432 42522 34910 100683 54261 46422
17 Munger 129260 69482 59778 150112 80662 69450 188050 101264 86786
18 Muzaffarpur 190416 103883 86533 241107 131537 109570 305525 164000 141525
19 Nawada 38759 20573 18186 53174 28299 24875 81891 43560 38331
20 Patna 813963 446394 367569 956417 524064 432353 1432209 781236 650973
21 Purnia 91144 49701 41443 114912 62249 52663 171687 92826 78861
22 Sahars a 57580 31734 25846 80149 44478 35671 125167 67718 57449
23 Sas aram 73457 39008 34449 98122 51916 46206 131172 69682 61490
24 Siwan 51284 27276 24008 83125 44168 38957 109919 58262 51657
Source: Census of India
Volume 1: Urban Sector Road Map Page 2Bihar Urban Development Investment Program
Figure 1.1 Road Map – 24 Towns
Volume 1: Urban Sector Road Map Page 3Bihar Urban Development Investment Program
Table 1.2 Population Projections by Town (sex disaggregated) 2010-2020
Towns 2010 2015 2020
Total Male Female Total Male Female Total Male Female
1 Arrah 250983 135983 115000 280428 152144 128284 312023 169508 142515
2 Bagaha 105240 54606 50634 124840 63724 61116 146440 73351 73089
3 Begusarai 117246 61041 56205 130836 67017 63819 145226 73202 72024
4 Bettiah 110010 57141 52869 120160 61722 58438 130810 66415 64395
5 Bhagalpur 418742 223684 195058 468672 249786 218886 522702 278047 244655
6 Bihar Sharif 277632 143581 134051 301712 153700 148012 326392 162996 163396
7 Chapra 221647 116444 105203 249352 129729 119623 279407 144005 135402
8 Danapur Nizamat 170260 89139 81121 200160 103982 96178 233060 120232 112828
9 Darbhanga 314102 166075 148027 339332 178514 160818 365162 191080 174082
10 Dehri 146700 77628 69072 158200 83275 74925 169700 88944 80756
11 Gaya 474882 247408 227474 530112 273623 256489 589442 301662 287780
12 Hajipur 134430 71130 63300 152880 80605 72275 172830 90809 82021
13 Jamalpur 100531 51269 49262 105396 52087 53309 110311 52646 57665
14 Katihar 230166 120881 109285 252156 130706 121450 274946 140569 134377
15 Kishanganj 104165 57067 47098 116140 64101 52039 128865 71640 57225
16 Motihari 107420 56307 51113 120720 62274 58446 135020 68513 66507
17 Munger 225963 122031 103932 248808 134601 114207 273303 148094 125209
18 Muzaffarpur 379488 199030 180458 423208 219184 204024 469828 240256 229572
19 Nawada 103730 55219 48511 120680 64204 56476 139130 73978 65152
20 Patna 1810381 984489 825892 2061096 1119198 941898 2330861 1264210 1066651
21 Purnia 221761 119687 102074 253976 137138 116838 288741 155996 132745
22 Saharsa 169024 88735 80289 196784 102080 94704 226744 116407 110337
23 Sasaram 157030 83375 73655 177480 94504 82976 199430 106504 92926
24 Siwan 151440 79888 71552 175040 92112 82928 200640 105299 95341
Source: Consultants estimates
Volume 1: Urban Sector Road Map Page 4Bihar Urban Development Investment Program
1.2 Definition of Sub-sector in the Road Map
The sub-sectors to be included in the Bihar Urban Development Project are (i) water
supply (ii) drainage (iii) sewerage (iv) solid waste management (v) urban road and traffic
management and (vi) slum improvement. Water supply, sewerage and drainage are three
components of the water cycle. The water cycle describes the continuous movement of
water on, above and below the surface of the Earth. The water moves from one location to
another by the physical processes of evaporation, condensation, precipitation, infiltration,
runoff, and subsurface flow.
1.2.1 Water Supply
Water supply from groundwater or surface water is defined as the abstraction,
conveyance, pumping, treatment, storage, distribution and delivery to households via
piped connections or public stand posts of water needed for daily living or for fire fighting,
industrial, agricultural or commercial purposes. Water supply in Bihar is heavily
dependent upon direct ground extraction.
1.2.2 Drainage
Drainage embraces the system of culverts, pipes, ditches, drains or canals needed to
remove excess rain water from cities. In Bihar towns, drainage is generally provided by
open ditches adjacent to major and some minor roads. These ditches are used not only for
storm-water collection and disposal but also for the discharge of sewage effluent, as a
public toilet and as a place where rubbish and garbage is dumped. The ditches are
therefore often blocked and represent a serious public health issue.
1.2.3 Sewerage
Sewerage refers to the infrastructure that conveys sewage and covers the system of
sewer pipes, septic tanks, pump stations, sewage treatment plants and outfall
arrangements necessary to safely remove water contaminated by faecal, household or
industrial wastes and thereby preserving public health. Septic tanks are the predominant
sewage treatment system in Bihar towns, (50-80% coverage) with septic tank effluent
discharged to open drains adjacent to household dwellings. Nearly all sewerage in Bihar is
therefore an 'open sewerage' system. In some towns such as Bhagalpur, 11 mld of open
drain flow is channelled to a sewage treatment plant constructed under the Ganga Action
Plan scheme where it is treated in aerated lagoons before discharge to river.
1.2.4 Solid Waste
Solid waste management is the collection, transportation and disposal of refuse, garbage,
household and industrial wastes normally to an engineered sanitary landfill. Hazardous
waste requires special treatment and arrangements for safe disposal. In Bihar, many
towns have contracted out the street sweeping, collection and transportation of solid waste
to NGOs, but due to the non availability of landfill disposal sites, most of the waste is
dumped along highways and in drains. This creates environmental degradation and
consequently poses a risk to public health and a deterioration of living standards.
1.2.5 Urban Road and Traffic Management
Urban road and traffic management relates to the planning, design, construction and
management of roads between and within cities, and the management of the diverse
range of vehicles which use the roads. Most Bihar towns are well connected to other parts
of the State, although main roads are often narrow, single lane in each direction and
crowded. Town‟s generally possess 5-15 km of National highway and 50-150 km of
municipal roads. About 90% of the municipal roads have metal surface (cement concrete,
brick or asphalt) and the remaining 10% have earthen surface. There are generally no
adequate parking facility for vehicles in towns nor organized bus terminals. In the north of
Volume 1: Urban Sector Road Map Page 5Bihar Urban Development Investment Program
the State the East-West National Highway is under construction which will greatly improve
travel between Muzaffarpur and Darbhanga and towns further east.
1.2.6 Slum Improvement
Slum improvement consists of the physical, social, economic, organizational and
environmental improvements to slums undertaken cooperatively and locally among
citizens, community groups, businesses and local authorities. The main objective of slum
upgrading is to alleviate the poor living standards of slum dwellers. In Bihar the proportion
of slums in typical larger towns ranges from 2% in Bhagalpur, 5% in Gaya and
Muzaffarpur to 20% in Darbhanga. The Municipal Commissioner of Gaya stated that slums
are increasing in number as the population of the town grows. All the slums are deficient
of basic infrastructure facilities like water supply, sanitation, drainage, SWM, approach
roads and street lighting.There are many small-scale slum improvement initiatives in 28
Bihar towns under the DFID funded SPUR programme. Bihar is defined as the state with
the “highest poverty risk” among Indian states (NIPFP, 2009). Current policy outlook of
GoI w.r.t urban poverty is embodied in its policies and programmes, chiefly the National
Urban Poverty Reduction Strategy (2010-20), programmes such as Basic Services for
Urban Poor (BSUP) under JnNURM, Integrated Housing and Urban Services
Development Program (IHSDP) under UIDSSMT and Rajiv Awas Yojana – Slum Free City
Planning.
Volume 1: Urban Sector Road Map Page 6Bihar Urban Development Investment Program
2 Economic Development
The Indian Government‟s data for 1980 to 1990 showed that the GSDP of the undivided
Bihar grew by 72%, which means that the economy was one of the fastest growing in the
1
country during the early 1980s .
In striking contrast the state experienced zero growth between1990-94 and since 1994-95,
2
when data for divided Bihar became available, annual growth averaged 3.8 per cent . As a
result, income growth and consumption levels in Bihar lagged seriously, thereby widening
the gap between Bihar and rest of India.
In 2000, when the division of Bihar resulted in the industrially advanced and mineral-rich
southern-half of the state been carved out to form the separate state of Jharkhand, this
had a strong impact on development in the north mainly through a loss of revenue. The
3
new State of Bihar inherited 75% of the total population and was estimated to account for
60% of the total output of the undivided Bihar.
After the bifurcation, the State is left with cultivable land in the Indo-Gangetic Plain and
abundant water, both surface and sub-surface, for irrigation. As a result of these natural
resource endowments, agriculture became the dominant economic activity and remains so
4
today occupying between 75 to 80 per cent of the workforce and contributing 42% of GDP
5
of the state .
Since 2000 onwards the Government of Bihar has taken assertive policy reform and
investment initiatives to revive the economy by improving the productivity and expanding
the agro-based industries as well as strengthening and increasing the rate of economic
diversification into other secondary and tertiary economic activities.
2.1 Existing Situation Assessment
The economy of Bihar is now poised for steady growth as a result of a number of positive
steps taken in the recent past by the state government, including:
Improvements in the quality of roads have
resulted in significant economic benefits. Getting anywhere in Bihar has
Compared to Rs 263.23 crore ($57.6 mill) always been an exercise in
spent on construction of roads in 2005-05, endurance. But that’s changing.
the expenditure has reached Rs 2489.15 More than 6,800 km of roads have
crore ($544.6 mill) in 2008-09, implying been relaid and 1,600 bridges and
culverts constructed in the last four
almost a ten fold increase (Economic Survey
years. Journey time in India’s 12th
2009-2010 GoB, Finance Department).
largest state, sprawling over 94,163
Projects included the completion of the sq km, has been cut by half today
expressway from the Purvanchal border in many places. Now, most of the
state’s 38 districts - from
through Bihar to Jharkhand and it has also
northernmost West Champaran to
been decided to improve the Patna to
Kaimur on the western end - are a
Muzaffarpur highway from a one lane to a drive of six hours or less from
four lane expressway. Also the central Patna.
government funded north-east expressway
Source: The Economic Times
will run through the northern part of the Bihar
10.01.2011
state making the north better connected with
the rest of India.
1
www.BiharDiary.com is the portal on the state of Bihar in India providing the latest information and the development of Bihar.
2 Bihar, Towards a Development Strategy, A World Bank Report, June 2005.
3 Census of India 1991 Bihar 82.88 mill and Jharkhand 26.96 mill.
4 Including forestry and fishing
5 Government of Bihar - Department of Agriculture,.
Volume 1: Urban Sector Road Map Page 7Bihar Urban Development Investment Program
6
The creation a more business friendly environment. - including measures such as:
granting pre-production incentive of subsidy/exemption from stamp duty and
registration fee and post production incentive of grant/exemption for preparation of
project reports, purchase of land/shed, technical know-how, captive power
generation/diesel generating set, quality certificate, Vat, luxury tax, electricity duty,
conversion fee, market fee etc.
As a result of these and other measures, in 2008-09 the total GSDP in Bihar at current
prices was estimated to be in excess of Rs.1.3 million, yielding a per capita income of
Rs.13,959 ($306). At constant prices, the GSDP for Bihar in 2008-09 was estimated to be
Rs.983,936 yielding a per capita income of Rs.10,415 ($228). For total GSDP, this implied
7
a growth in excess of 11 cent over the year 2008-09 (ref. Table 2.1).
Table 2.1 Recent GSDP Growth Rates
(Central Statistics Organisation and Bihar Economic Survey 2008-09).
Growth in % per annum
Year CSO
2004-05 12.17
2005-06 1.49
2006-07 22.00
2007-08 8.04
2008-09 11.44
Average growth 11.03
This was a surprise to many that Bihar, generally considered to be economically
backward, emerged as the fastest growing state recording a growth rate of 11.44 per cent
during 2008-09. Among the 18 states and Union Territories of which data is available,
Bihar recorded the highest State Gross Domestic Product (SGDP) in a year when the
global financial meltdown pulled down country's economic growth rate to 6.7 per cent from
9 per cent.
Despite its relatively good economic performance compared to all India, as illustrated by
GDP and Per Capita GSDP statistics (ref Figs 2.2 and 2.3), Bihar still has a per capita
income of $ 304 a year , over 64% less than India's average of $ 8338 and 30.6% of the
population live below the poverty line against India's average of 22.15%. For the per capita
income in Bihar to reach the level of the national average, the present momentum of
growth as displayed in the graphs below will need to be sustained for many years to come.
6 Industrial Incentives Policy 2006, Department of Industries: Incentive Policy for Accelerated Policy Growth of the State.
7 Central Statistics Organization and Bihar Economic Survey 2008-09
8 Economic Times 24.11.2010.
Volume 1: Urban Sector Road Map Page 8Bihar Urban Development Investment Program
Figure 2.1 GDP India and GDP Bihar (Rs Billions)
1000.0
416.3 449.4 487.9
325.4 356.6 389.9
296.8
186.4
100.0
Rs Billions
17.2 20.2
14.5
10.0 10.2 11.8
7.6 8.2
5.8 GDP-India
GSDP-Bihar
1.0
2000-01 2004-05 2005-06 2006-07 2007-08 2008-09 2009-10 2010-11
Years
Figure 2.2 Per Capita GSDP of Bihar and Per Capita NSDP of India (Rs)
40000
Bihar (Per Capita GSDP) : Rs.
35000
India (Per Capita NSDP) : Rs. 33731
30000 31801
30354
28083
25000
26025
24143
20000
15000 16172
11535
10000 11702 12883
8594 8517 9929 10599
8527
5000 7111
917 2655
0
1980-81 1990-91 2000-01 2004-05 2005-05 2006-07 2007-08 2008-09 2009-10
(P) (Q)
Primary Sector
The sector composition of Bihar‟s economy reveals the important role of agriculture in
aggregate production. Despite this, investment in irrigation and other agriculture facilities
has been grossly inadequate in the past.
Volume 1: Urban Sector Road Map Page 9Bihar Urban Development Investment Program
The unsatisfactory performance of agriculture, Bihar‟s most important sector was, to a
large degree responsible for the state‟s historically low aggregate growth rate. Agriculture
showed negative growth in the early 1990s, and since the mid-90s through 2001-02 it has
grown by less than 1.0 per annum, implying a negative growth rate of agricultural output
per capita.
Furthermore, the Bihar State Economic Survey 2008-09 indicates that the average growth
rate of the primary sector over the period 2005-06 to 2008-09 has been -0.77 percent, with
agriculture in particular doing even worse at an average of -0.87 percent. As a result those
employed in the sector will likely have witnessed an absolute fall in income over this period
and, as agriculture employs nearly 80 percent of the work force, with 96 percent of the
cultivators been small and marginal farmers; the impact will be particularly significant in
the rural communities.
Secondary and Tertiary Sectors
State Economic Surveys over the period 2005-06 to 2008-09 indicate that overall,
economic growth has been led by an increase of 21.75 percent in the performance of the
manufacturing sector which employs only about 9 percent of the state‟s workforce. This
secondary sector growth is primarily found to be led by growth in the construction sector,
which currently constitutes about 71 percent of secondary sector income and whose
annual growth rates for last four years yield an average of 41 percent, as is reflected by
Bihar State Economic Survey 2008-09.
The service sector has established itself as the leading driver of the Bihar economy by
constituting a 64.30 per cent at current prices and 56.05 per cent at constant prices share
of the total GSDP in 2008-09 and the tertiary trade, hotel & restaurants and banking and
insurance sectors are the leading economic activities with CAGR 13.50 per cent and 7.31
per cent recorded growth rates respectively over the past 5 years.
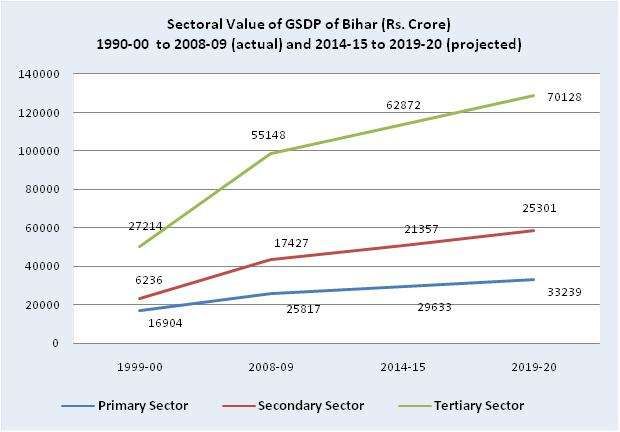
Sector Shares and Employment.
The secondary and tertiary sectors have been growing at much faster rates over the last
decade and the GSDP share at constant prices of primary, secondary and tertiary sectors
in 2008-09 were 26.24 per cent, 17.71 per cent and 56.05 per cent respectively.
Table 2.2 Bihar and India Sector Employment (%)
Bihar India
Sector 1993-94 2006-07 1993-94 2006-07
Primary Sector 76.6 74.0 75.3 57.3
Secondary Sector 4.9 12.9 12.0 18.5
Services Sector 18.5 13.1 12.7 24.2
All Sectors: 100.00 100.00 100.00 100.00
Source: Laveesh Bhandari and Sumita Kale (2009), Bihar : Performance, facts and Figures ( NSSO
and Census of India), Indicus.
In terms of work force, 74 per cent workers engaged in primary sector, 12.9 per cent in
secondary sector and 13.1 per cent in tertiary sector while in all India shows that 57.3 per
cent in primary sector, 18.5 per cent in secondary sector and 24.2 per cent in tertiary
sector (NSSO). See figures 2,3 and 2.4 below.
Volume 1: Urban Sector Road Map Page 10Bihar Urban Development Investment Program
Figure 2.3 Share of Sector Employment in Bihar
90
80 76.6
70 74
1993-94
60
2006-07
% share
50
40
30
20 18.5
12.9
13.1
10
4.9
0
Primary Sector Secondary Sector Services Sector
Figure 2.4 Share of Sector Employment in India
90
80
75.3
70
60
57.3 1993-94
50 2006-07
40
30
24.2
20 18.5
12 12.7
10
0
Primary Sector Secondary Sector Services Sector
2.1.2 Main Activities and Locations
Some of the major industrial activities in Bihar are Agro-based such as textiles, oil mills,
etc. Industries that are dependent on agriculture are the edible oils mills located at Araria,
rice mills located in Buxar, Forbesganj in Purnea district, spice industries, sugar mills
located at Banmankhi in Purnea district, jute mills and other agro-based industries. One of
the biggest oil refineries in the country is based at Barauni in Bihar. There are 13 sugar
mills in private sector and 15 in the public sector located in South and North Bihar. Bihar is
also the sixth largest producer of tobacco in the country.
Since 2005, besides the major road infrastructure development initiatives, the State
Government has created a more business friendly environment to enhance investment
opportunities and the leveraging of resources into big as well as small and medium-sized
Volume 1: Urban Sector Road Map Page 11Bihar Urban Development Investment Program
industrial establishments. As a result the growth of small industries, improvements in IT
infrastructure, the new software park in Patna, have taken place. Also the sugar Industry is
another sector which has benefited and continued to grow with 25 new sugar factories
committed in Bihar between 2006 and 2007 and likewise, the dairy Industry has become a
high performing sector.
Major Economic Activities of Bihar
Government data on economic activity is available on a district-wide basis and not by town
specific. Table 2.3 presents relevant data for the 20 districts which represent the selected
24 towns with population over 100,000. In 2004 the 20 districts (24 towns) accounted for
9
over 74 per cent of GDDP (at constant price); Patna alone leading with just over 25 per
cent followed by Muzaffarpur at 4.5 per cent and both Begusarai and East Champaran
each having 3.5 per cent.
Table 2.3 Value and Share of 20 Districts in Bihar GSDP
Ranking Districts of Bihar Rs. Crore % Share
1999-00 2004-05 1999-00 2004-05
All Districts of Bihar (38) 5019994 6003183 100.00 100.00
1. Patna 1035518 1507173 20.63 25.1
2. Muzaffarpur 239542 272353 4.77 4.5
3. Begusarai 174791 209898 3.48 3.5
4. E. Champaran 176431 207229 3.51 3.5
5. Gaya: 186933 200394 3.72 3.3
6. Bhagalpur 155167 188334 3.09 3.1
7. W. Champaran 165779 179958 3.30 3.0
8. Darbhanga 151672 177254 3.02 3.0
9. Rohtas 148602 167418 2.96 2.8
10. Saran 145546 162728 2.90 2.7
11. Vaishali 138259 156672 2.75 2.6
12. Katihar 119106 155812 2.37 2.6
13. Purnea 122558 140825 2.44 2.3
14. Siwan 122712 130604 2.44 2.2
15. Nalanda 126913 126467 2.53 2.1
16. Bhojpur 123983 122479 2.47 2.0
17. Munger 95873 102691 1.91 1.7
18. Saharsa 82797 95891 1.65 1.6
19. Nawada 81040 82354 1.61 1.4
20. Kisanganj 60744 69074 1.21 1.2
Total 3653966 4455607 72.79 74.22
Source: Derived from: Department of Statistics and Evaluation data, Government of Bihar.
9 Presently, Gross District Domestic Product (GDDP) data is available from 1999-00 to 2004-05 of 1999-00 base year at constant
and currents prices. Government is in process to revise the base year from 1999-00 to 2004-05, and hence unable to procure the
updated data from 2005-06 onwrds.
Volume 1: Urban Sector Road Map Page 12Bihar Urban Development Investment Program
The contribution of the top five economic activities by industry of origin in Bihar accounts
72.35 per cent in 1999-00 of the total GSDP (at constant prices) which increased to 78.92
per cent in 2008-09. Bihar is traditionally an agrarian economy and dominated by
10
agriculture and allied activities but their share in the GDP gradually decreased to 26 per
cent in 2008-09 from 33.5 per cent in 1999-00.
Among the 24 selected towns, primary sector is responsive for growth in 8 towns namely,
Saharsa, Purnea, Kisanganj, Katihar, Rohtas, East Champaran, West Champaran and
Vaishali and for remaining, service sector is the dominating.
2.1.3 Impact of Plan and Policies on Economic Growth
Different industries have performed differently during the period 2008 and 2009. Table 2.4
captures the performance level of different industries on the basis of certain key
parameters which reflect the impact of plan and policies on economic growth. The agro
and agro-based industries and tourism industry in Bihar expressed mixed trends in its
performance during 2008 and 2009 (CII, 2010).
Table 2.4 Impact of Sector Policies on Economic Growth of Bihar
Major initiatives taken under
Policies Impact on growth (2009 vs 2008)*
policies/ plan
Major investment policy initiatives
underway :
Bihar Single Window Clearance
Act-2006 Production Increased (4-6 %)
Bihar Infrastructure Development Level Increased (3-5%)
Enabling Act 2006. Exports Increased (1-2%)
New Industrial Policy -2006 Capacity Utilization Increased (up to 7%)
Price Preference Policy- 2006
Value of Production Increased (6-8%)
Industrial Policy New Policy Initiatives for
Inventory Increased (2-3%)
(agro & agro Entertainment, Tea Processing
Pricing Increased (4-5%)
Based ) and Sugar Sectors - 2006.
Profit Margin Increased (up to 6%)
Amendment of Sugarcane Act
1985 to provide for other products Employment Level No change (%)
from sugarcane apart from sugar Impact of Monsoon Major
Policy for establishing higher Impact of currency fluctuation Major
Technical Institutions in Private Impact of cost of capital Significant
Sector-2006
Simplification of VAT Regime -
2006.
Support programmes: Bihar's
Annual Marketable
National Horticulture Mission Crop/ Share
Production Surplus
State Horticulture Mission Enterprise In National
(Mn. Tonnes) (%)
Micro Irrigation Pool (%)
Macro Management Mode Of Vegetables 8.59 9.00 100.00
Agriculture Fruits 3.35 8.00 80.00
Integrated Scheme Of Oilseeds, Food Grain 11.90 5.60 75.00
Pulses and Maize Sugarcane 13.00 5.50 100.00
Recent initiatives: Fish 0.27 8.30 100.00
Extension Reforms To Promote Milk 4.06 4.40 100.00
Agriculture Public Private Partnership 5% Growth rate for food grains, 6% for
policy** Establishment Of KvkIn Every vegetable & 10% for fruit production
District For Research Support At % Share in Targeted
Present
District Level Agri Products National Production
Production
Horticulture College At Nalanda Production (2015)
For Exclusive Research And Maize 1.5 Mn. MT 10 4.5 Mn MT
Education In Horticulture Sugarcane 13.00 Mn. MT 46.72 Mn MT
Repeal of agriculture produce Litchi 0.28 Mn MT 71 0.5 Mn. MT
market act (APMC) to enable Makhana 0.003 Mn MT 85 0.050 Mn MT
Direct purchase from farmers Mango 1.4 Mn MT 13 3.0 Mn MT
Private & Co-operative Markets Rice Aromatic 0.015 Mn MT 0.05 Mn MT
Contract farming Dairy 4.06 Mn MT 8.46 Mn MT
10 These activities include, live stock products, forestry, fishing, and mining & quarrying.
Volume 1: Urban Sector Road Map Page 13Bihar Urban Development Investment Program
Speciality market Vegetables 8.60 Mn MT 9 12.4 Mn MT
For farmers: 0.27 Mn Lakh
Fishery 0.43 Mn MT
Prize of Rs1 lakh and title of Kisan- MT
Sri”for best farmer in all 534 Honey 1300 MT 13 3900 MT
blocksPrize of Rs2 lakh and title of
“Kisan-Bhushan”at district
levelPrize of Rs5 lakh and title of
“Kisan-Ratna”at state level every
year
Government to benefit from good
will of these 573 farmers every
year
As a catalyst, promoter, facilitator
and infrastructure provider
Inflow of tourist11 Increased (3-5 %)
Maintenance of law and order Industry revenue Increased (3-5%)
Deploying the tourist police force Foreign Exchange earnings Increased (2-4%)
Disposing grievance occupancy rate Increased (up to 5%)
Enacting suitable laws for the Pricing No change
Tourism policy development of tourism Profit margin Decreased (2-4 %)
Enabling private sector Employment Level No change (%)
participation to develop important Impact of Monsoon Significant
places whose tourism potential Impact of currency fluctuation Significant
has not yet been tapped. The Impact of cost of capital Significant
State Government would lay
Terrorism issues Significant
down rules and regulations for
Political environment None
such as Joint ventures.
The Government has initiated
various programs to promote the
development of sectors like Power,
Roads and Highways.
Mission Statement in respect of
roads which is “Provision of a
Road Infrastructure Equal to the
Best in the Country by 2015”.
The Bihar State Highway Improvement of Road by State Government
Development Project, an agency of Road Length Impact
Year Growth Rate
the Government of Bihar with (KM)
assistance from the Asian 2005-06 364
Road network and Development Bank (ADB) has Increased
transportation commenced work on converting 2006-07 773 212.36 accesabilit
programme State Highways into 2 – lane y
roads; the Government has also 2007-08 701 90.69 Increased
undertaken to improve and widen 2008-09 580 82.74 Increased
Major District Roads. 2009-1012 582 100.34 Increased
The Chief Minister‟s Bridge Total 3000
Construction Program was
launched in 2006 and it envisages
construction of bridges,
replacement of bridges wherever
required and the replacement of
narrow bridges with double lane
bridges
Note : * October 2008 to March 2009 vs April to September 2008 (summary of responses from selected companies within the
industry regarding performance during the period).** compiled from various sources including a presentation to the Investment
commission.
Source: Compiled from various Government Reports and Confederation of Indian Industry (CII), Industry Monitor-Bihar, 2010.
11 Times of India, 5thJanuary 2011, ―Bihar more happening tourist spots than Goa? ―.
12 Up to December.
Volume 1: Urban Sector Road Map Page 14Bihar Urban Development Investment Program
Though, the national economic policy initiatives apply equally to all the Indian States, their
effects can differ considerably across the States depending up on the nature of various
institutional factors and policies in the States, which can be classified under the broad
heading „investment climate‟. Thus, a market-oriented macro and trade policies at the
national level needs in general to be complemented with policies that foster a market-
friendly investment climate in the States.
The main industrial centres are Patna, Magadh, Muzaffarpur, Barauni, Bhagalpur, Munger,
Darbhanga and Tirhut. According to the Department of Industries, the number of large and
medium industries in the state is only 259, of which the highest concentration (38.2 per
cent) is in Patna division, followed by Tirhut (21.6 per cent) and Magadh (9.7 per cent).
Out of 38 districts spread over in 9 divisions, 10 districts do not have any large/medium
industrial unit.
Probably as important , if not more so, than deficits in the coverage of public utility
services, are other major infrastructure bottlenecks experienced by industries and
businesses including poor transport infrastructure in rural areas, shortfalls in power supply
and costs related high energy price for power generation and a poorly developed IT
communication infrastructure including internet and telephone.
2.2 Future Growth Assessment
2.2.1 Growth Projection Methods
Gross State Domestic Product (GSDP)
In projecting state economic trends and State Gross Domestic Products (SGDP) by
13
economic activities (industry origin) up to the year 2020-21 baseline scenario of the
actual situation in the year 2008-09 and the trend growth rate of each activities (current
and constant prices) during 1999-00 to 2008-09 were reviewed For simplifying projections,
the growth of each economic activity during the period 2010-11 to 2020-21 were
extrapolated by using a trend growth rate for each economic activity.
District Gross Domestic Product (GDDP)
As a proxy for „All Urban Bihar‟, 24 towns with above 100,000 populations (.representing
57% of the population and over 74% of GDDP) were adopted as a basis for the economic
appraisal. Furthermore, as the Government generates disaggregated data at a district and
14
not town level, district data was utilised. Since 4 of the selected towns are not district
headquarters, only the data from 20 districts was necessary as 4 districts represent 2
towns.
The latest district-wise data on economic activity (1999-00- 2004-05) was then used to
establish the economic profiles of the 20 Districts as a base from which to extrapolate and
project a trend growth for each economic activity over the period 2006-07 to 2020-21.
2.2.2 Future Economic Trends of Bihar
The average annual growth rate of GSDP was 10.40 per cent at constant prices and 7.27
per cent at current prices between 1999-00 to 2008-09. As the projected value is based on
trend growth rate, projections to base year 2009-10 are carried forward exponentially.
Under these unmodified trend line projection conditions, GSDP will approximately doubled
from Rs.152,030 Rs. million in 1999-00 to Rs. 314,040 Rs. million in 2019-20 at constant
prices.
13 Representing 24 selected towns in 20 Districts
14 1. Munger (Jamalpur and Munger), 2. Patna (Danapur and Patna), 3. West Champaran (Bagha and Bettiah) and 4. Rohtas (Dehri
and Sasaram).
Volume 1: Urban Sector Road Map Page 15You can also read