India: Greenhouse Gas Emissions 2007 - INCCA Indian Network for Climate Change Assessment
←
→
Page content transcription
If your browser does not render page correctly, please read the page content below
INCCA Indian Network for Climate Change Assessment

India: Greenhouse Gas Emissions 2007

   Ministry of Environment and Forests
   Government of India                         May 2010
INCCA Indian Network for Climate Change Assessment

India: Greenhouse Gas Emissions 2007

  Ministry of Environment and Forests
  Government of India                         May 2010
May 2010

Copy editing, layout and design: Ministry of Environment and Forests

Printed at: Print Process
Contents

Foreword ...........................................................................................................................................................
Executive Summary ............................................................................................................................................                        i - ix
1.      Context and Relevance ..............................................................................................................................                              1
2.      Climate Change Assessments in India .....................................................................................................                                         2
3.      Indian Network for Climate Change Assessment....................................................................................                                                  4
4.      Greenhouse gas estimation - 2007 ...........................................................................................................                                      8
        4.1      Coverage .........................................................................................................................................................       8
        4.2 Methodology, Activity data and Emission factors ....................................................................................                                        10
5.      Energy .........................................................................................................................................................                12
        5.1      Methodology and Choice of Emission Factors .........................................................................................                                   12
        5.2 Overview of GHG Emissions from the Energy Sector ............................................................................                                               13
        5.3 Electricity Generation ....................................................................................................................................                 13
        5.4 Petroleum Refining and Solid Fuel Manufacturing ..................................................................................                                          14
        5.5 Transport ..........................................................................................................................................................        14
        5.6 Residential / Commercial and Agriculture / Fisheries .............................................................................                                          15
        5.7 Fugitive Emissions ..........................................................................................................................................               16
6.      Industry ......................................................................................................................................................                 17
        6.1      Methodology and Choice of Emission Factors .........................................................................................                                   17
        6.2 Overview of GHG Emissions from Industry .............................................................................................                                       17
        6.3 Minerals ...........................................................................................................................................................        19
        6.4 Chemicals ........................................................................................................................................................          20
        6.5 Metals ..............................................................................................................................................................       20
        6.6 Other Industries .............................................................................................................................................              20
        6.7 Non energy product use ..............................................................................................................................                       20
        6.8 A Desciption of Fossil Fule and Process Based Emissions ......................................................................                                              20
7.      Agriculture .................................................................................................................................................                   22
        7.1      Overview of the Agriculture sector emissions .........................................................................................                                 22
        7.2      Enteric Fermentation .....................................................................................................................................             23
        7.3      Manure management ...................................................................................................................................                  24
        7.4      Rice Paddy cultivation ...................................................................................................................................             25
        7.5      Agriculture soils ..............................................................................................................................................       26
        7.6      Burning of Crop residue ...............................................................................................................................                27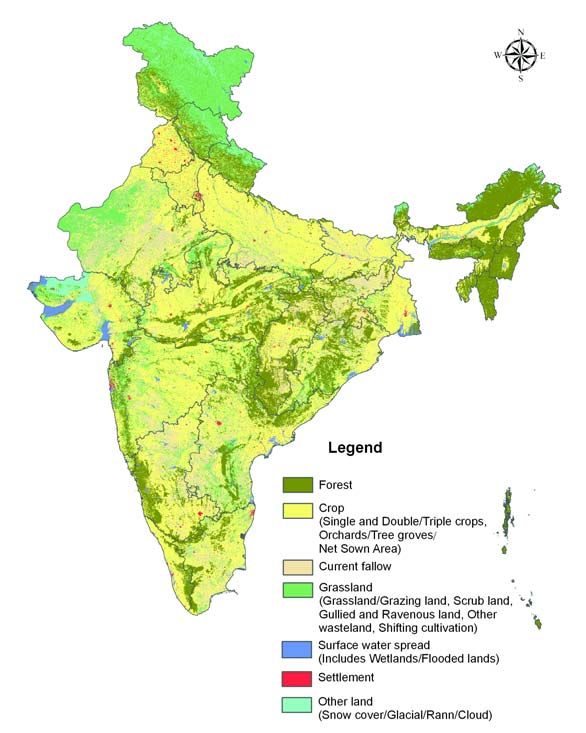
8.    Land Use, Land Use Change and Forestry ...............................................................................................                                        28
      8.1      Methodology – GPG Approach .................................................................................................................                         28
      8.2 estimating carbon stock changes ................................................................................................................                          29
      8.3 Inventory Estimation ......................................................................................................................................               30
      8.4 Land use change matrix ................................................................................................................................                   31
      8.5 Area under forests .........................................................................................................................................              32
      8.6 Carbon stock change in forest lands ..........................................................................................................                            34
      8.7 CO2 emissions and removal from non-forest land categories ...............................................................                                                 34
      8.8 Net GHG removal from LULUCF sector ...................................................................................................                                    36
9.    Waste ..........................................................................................................................................................              38
      9.1      Summary of GHG emissions from waste ..................................................................................................                               38
      9.2 Municipal Solid Waste ..................................................................................................................................                  38
      9.3 Waste water treatment and disposal ..........................................................................................................                             40
10. Greenhouse Gas Emission Profile: Key Features ....................................................................................                                              43
      10.1 Overview .........................................................................................................................................................       43
      10.2 Gas by Gas Emissions ...................................................................................................................................                 43
      10.3 Sectoral Emissions ..........................................................................................................................................            43
      10.4 Comparison with 1994 GHG inventory ....................................................................................................                                  47
      10.5 Per capita emissions ......................................................................................................................................              48
11.   Future Perspective .....................................................................................................................................                      51
      11.1 Riding the Tier ladder ....................................................................................................................................              51
      11.2 Capacity building ...........................................................................................................................................            54

Annexures
1.    Sources of Activity Data .........................................................................................................................................            55
2.    References ................................................................................................................................................................   57
3.    Scientists/ Experts - India : Greenhouse Gas Emissions 2007 .........................................................................                                         59
4.    INCCA Institutions ...................................................................................................................................................        61
5.    Glossary of Key Terms ............................................................................................................................................            63
Minister of State (Independent Charge)
                                                                                        Environment & Forests
                                                                                         Government of India
 Jairam Ramesh

                                                   Foreword
I am pleased to introduce the publication – India’s Greenhouse Gas Emissions 2007. This Report, being brought out
by the Indian Network of Climate Change Assessment (INCCA), provides updated information on India’s Greenhouse
Gas Emissions for the year 2007. Until today, the only official emissions estimates available were for the year 1994. This
was very inadequate. I had been keen that to enable informed decision-making and to ensure transparency, we should
publish updated emissions estimates. I am glad that our team of scientists took up this challenge and have prepared
this report with estimates for 2007 in record time. More than 80 scientists from 17 institutions across India have
contributed to this Assessment. I am particularly pleased that with this publication, India has become the first “non-
Annex I” (i.e. developing) country to publish such updated numbers. I am also happy to announce that we will publish
our emissions inventory in a two-year cycle going forward. We will be the first developing country to do so.

According to the results, India ranks 5th in aggregate GHG emissions in the world, behind USA, China, EU and Russia
in 2007. Interestingly, the emissions of USA and China are almost 4 times that of India in 2007. It is also noteworthy
that the emissions intensity of India’s GDP declined by more than 30% during the period 1994-2007, due to the
efforts and policies that we are proactively putting in place. This is a trend we intend to continue. As you are aware,
we have already announced our intent to further reduce the emissions intensity of our GDP by 20-25% between 2005
and 2020 even as we pursue the path of inclusive growth.

INCCA, launched on 14th October 2009, is a network comprising 127 research institutions, tasked with undertaking
research on the science of climate change and its impacts on different sectors of the economy across the various
regions of India. As I mentioned at the launch, we must make the “3 M’s” – Measurement, Modelling and Monitoring
– the essence of our policy making and we must build indigenous capacity for this. This report is a step in this direction.
I look forward to INCCA’s next major publication – a “4X4” assessment of the impacts of climate change on four
sectors – water resources, agriculture, forests and human health – in four critical regions of India – the Himalayan
region, North east, Western Ghats and Coastal India, which will be released in November 2010.

Once again, I congratulate our team of scientists who have put this assessment together. I look forward to the results
of the other upcoming studies of INCCA.

                                                                                                    Jairam Ramesh
Executive Summary
This assessment provides information on India’s - CO2 emissions were 1221.76 million tons;
emissions of Greenhouse gases (Carbon Dioxide [CO2], - CH4 emissions were 20.56 million tons; and
Methane [CH4] and Nitrous Oxide [N2O]) emitted from - N2O emissions were 0.24 million tons
anthropogenic activities at national level from: GHG emissions from Energy, Industry, Agriculture, and
Energy; Waste sectors constituted 58%, 22%, 17% and 3% of
Industry; the net CO2 eq emissions respectively.
Agriculture; Energy sector emitted 1100.06 million tons of CO eq,
2
Waste; and of which 719.31 million tons of CO2 eq were emitted
Land Use Land Use Change & Forestrmy (LULUCF). from electricity generation and 142.04 million tons of
CO2 eq from the transport sector.
The distribution of GHG emissions by sector are shown Industry sector emitted 412.55 million tons of CO
2
in Figure ES1. Detailed emissions estimates are provided eq.
in Annexure. LULUCF sector was a net sink. It sequestered 177.03
million tons of CO2.
A. KEY RESULTS India’s per capita CO eq emissions including LULUCF
2
were 1.5 tons/capita in 2007.
The net Greenhouse Gas (GHG) emissions from India,
that is emissions with LULUCF, in 2007 were 1727.71
million tons of CO2 equivalent (eq) of which
Note:
Other Energy: includes GHG emissions from petroleum refining, manufacturing of solid fuel, commercial & institutional sector, agriculture & fisheries and fugitive
emissions from mining, transport and storage of coal, oil and natural gas.
Other Industry: includes GHG emissions from production of glass and ceramics, soda ash, ammonia, nitric acid, carbides, titanium dioxide, methanol, ethylene
oxide, acrylonitrile, carbon black, caprolactam, ferro alloys, aluminium, lead, zinc, copper, pulp and paper, food processing, textile, leather, mining and quarrying,
non specific industries and use of lubricants and paraffin wax.
Agriculture: includes GHG emissions from livestock, rice cultivation, agricultural soils and burning of crop residue.
Waste: includes GHG emissions from municipal solid waste (MSW), industrial and domestic waste water.
LULUCF: includes GHG emissions and removals from changes in forest land, crop land, grass land, wet land, settlements and combustion of fuel wood in forests.
Figure ES1: GHG emissions by sector in 2007 (million tons of CO2 eq). Figures on top indicate the emissions by sectors
and in brackets indicate % of emission of the category with respect to the net CO2 equivalent emissions. See glossary for
defination of CO2 equivalent.
Page i India: Greenhouse Gas Emissions 2007
B. 1994 AND 2007 GHG EMISSIONS - A of Environment and Forests, Government of India. (Box
COMPARISON ES2 & Figure ES2).
The 1994 assessment is available in India’s Initial National
Communication to the UNFCCC. Both the 1994 and
Table ES1: A comparison of GHG emissions by sector
2007 assessments have been prepared using the IPCC
between 1994 and 2007 in million tons of CO2 eq.
guidelines for preparation of national greenhouse gas
1994 2007 CAGR
emissions by sources and removal by sinks. The distinctive
(%)
key features of the two assessments and the
improvements in the 2007 assessments are indicated in Electricity 355.03 (28.4%) 719.30 (37.8%) 5.6
Box ES1. Transport 80.28 (6.4%) 142.04 (7.5%) 4.5
Residential 78.89 (6.3%) 137.84 (7.2%) 4.4
The total GHG emissions without LULUCF have grown Other Energy 78.93 (6.3%) 100.87 (5.3%) 1.9
from 1251.95 million tons in 1994 to 1904.73 million tons Cement 60.87 (4.9%) 129.92 (6.8%) 6.0
in 2007 at a compounded annual growth rate (CAGR) Iron & Steel 90.53 (7.2%) 117.32 (6.2%) 2.0
of 3.3% and with LULUCF the CAGR is 2.9%. Between Other
1994 and 2007, some of the sectors indicate significant Industry 125.41 (10.0%) 165.31 (8.7%) 2.2
growth in GHG emissions such as cement production Agriculture 344.48 (27.6%) 334.41 (17.6%) -0.2
(6.0%), electricity generation (5.6%) and transport Waste 23.23 (1.9%) 57.73 (3.0%) 7.3
(4.5%). A comparative analysis of GHG emissions by Total without
sector is shown in Table ES1. LULUCF 1251.95 1904.73 3.3
LULUCF 14.29 -177.03
C. IMPLEMENTATION ARRANGEMENT Total with
LULUCF 1228.54 1727.71 2.9
This assessment has been prepared under the aegis of
Note: Figure in brackets indicate percentage emissions from each
the Indian Network for Climate Change Assessment sector with respect to total GHG emissions without LULUCF in 1994
(INCCA). An initiative being coordinated by the Ministry and 2007 respectively
Box ES1: 2007 and 1994 - Key Methodological Features and Improvements
1994 Assessment 2007 Assessment
Estimates made using only revised 1996 IPCC guidelines. Estimates made using revised IPCC 1996 guidelines
(1997), IPCC Good Practice Guidance (2000), the
LULUCF Good Practice Guidance (2003).
LULUCF included emissions from changes in forest land. Carbon pools in addition to forests have been considered
in the LULUCF sector (crop land, grass land, settlements).
Emission factors were a mix of default factors taken from Emission factors were also a mix of default and CS but
IPCC and country specific (CS) emission factors. 26% leading to improved accuracy as more number of CSs
of the source categories used CS factors. have been used in this assessment (35% of the source
categories used CS factors).
The 1994 assessment splits the emissions from industry The 2007 assessment reports both fossil fuel related and
in to two parts - fossil fuel and process. The fossil fuel process based emissions from Industry as a part of the
emissions are reported in Energy and process emissions Industry sector.
in Industry.
In 1994, 7% of the total CO2 eq emissions were made In 2007, 12% of the emissions are made using Tier III
using Tier III approach. approach, implying greater accuracy.
Indian Network for Climate Change Assessment Page iiBox ES2: Indian Network for Climate Change Assessment (INCCA)
Launched on October 14, 2009, the network comprises of 127 institutions and 228 scientists across India
Role
- Assess the drivers and implications of climate change through scientific research
- Prepare climate change assessments once every two years (GHG estimations and impacts of climate change,
associated vulnerabilities and adaptation)
- Develop decision support systems
- Build capacity towards management of climate change related risks and opportunities
2007 Assessment
BCKV Bidhan Chandra Krishi Viswavidyalaya
CII Confederation of Indian Industry
CIMFR Central Institute of Mining & Fuel Research
CLRI Central Leather Research Institute
CMA Cement Manufacturing Association
CRRI Central Road Research Institute
FSI Forest Survey of India
IARI Indian Agricultural Research Institute
IGFRI Indian Grass & Fodder Research Institute
IISc Indian Institute of Science
IVRI Indian Veterinary Research Institute
NDRI National Dairy Research Institute
NEERI National Environment Engineering Research Institute
NPL National Physical Laboratory
NRCS National Remote Sensing Centre
PPAC Petroleum Planning and Analysis Cell
TERI The Energy and Resources Institute
Figure ES2: INCCA and Network for preparing the Greenhouse Gas Emissions – 2007. For the complete list of
institutions participating in INCCA, see Annexure 4.
Page iii India: Greenhouse Gas Emissions 2007D. SECTORAL DESCRIPTION OF THE tons of CO2 eq. Road transport, being the dominant
EMISSIONS mode of transport in the country, emitted 87% of the
total CO2 equivalent emissions from the transport
Energy: The energy sector emitted 1100.06 million tons sector. The aviation sector in comparison only emitted
of CO2 eq due to fossil fuel combustion in electricity 7% of the total CO2 eq emissions. The rest were
generation, transport, commercial/Institutional emitted by railways (5%) and navigation (1%) sectors.
establishments, agriculture/fisheries, and energy intensive The bunker emissions from aviation and navigation
industries such as petroleum refining and manufacturing have also been estimated but are not counted in the
of solid fuels, including biomass use in residential sector. national totals. (Figure ES4).
Fugitive emissions from mining and extraction of coal,
oil and natural gas are also accounted for in the energy Residential & Commercial: The residential sector in
sector. The distribution of the emissions across the India is one of the largest consumers of fuel outside
source categories in energy sector is shown in Figure the energy industries. Biomass constitutes the largest
ES3. portion of the total fuel mix use in this sector.
Commercial and institutional sector uses oil & natural
Electricity Generation: The total greenhouse gas gas over and above the conventional electricity for its
emissions from electricity generation in 2007 was power needs. The total CO 2 eq emission from
719.31 million tons CO2 eq. This includes both grid residential & commercial/institution sector was 139.51
and captive power. The CO2 eq emissions from million tons of CO2 eq in 2007.
electricity generation were 65.4% of the total CO2 eq
emitted from the energy sector. Coal constituted about Agriculture & Fisheries: The agriculture/ fisheries
90% of the total fuel mix used. activities together emitted 33.66 million tons of CO2
eq due to energy use in the sector other than grid
Petroleum Refining and Solid Fuel Manufacturing: electricity.
These energy intensive industries emitted 33.85 million
tons of CO2 eq in 2007. The solid fuels include Fugitive Emissions: CH4 escapes into the atmosphere
manufacturing of coke & briquettes. due to mining of coal, and due to venting, flaring,
transport and storage of oil and natural gas. The total
Transport: The transport sector emissions are reported CO2 eq emissions from this source category in 2007
from road transport, aviation, railways and navigation. was 31.70 million tons CO2 eq.
In 2007, the transport sector emitted 142.04 million
Figure ES3: GHG emissions from Energy Sector (million tons of CO2 eq).
Indian Network for Climate Change Assessment Page ivNote:
Other Metals: includes GHG emissions from production of
ferroalloys, aluminium, lead, zinc and copper.
Chemicals: includes GHG emissions from production of ammonia,
Figurse ES4: GHG emissions from Transport Sector by nitric acid, adipic acid, caprolactam, carbide, titanium dioxide,
mode of transport in 2007 (million tons of CO2 eq). petrochemicals and black carbon, methanol, ethylene, ethylene
oxide, acrylonitrile, ethylene diochloride and vinyl chloride,
monomer and other chemicals (see glossary for details).
Industry: Industrial activities together emitted 412.55
Other Industries: includes GHG emissions from pulp and paper,
million tons of CO2 eq of GHG in 2007. Industry sector food processing, textile and leather, mining and quarrying and non
emissions have been estimated from manufacturing of specific industries. It also includes emissions from non-energy
minerals, metals, chemicals, other specific industries, and product use.
from non-energy product use. The emissions covered in
Figure ES5: GHG emissions from Industry Sector (million
the industry sector include fossil fuel combustion related
tons of CO2 eq).
emissions as well as the process based emissions. (Figure
ES5). rubber, plastic, watches, clocks, transport equipment,
furniture etc., together emitted 124.53 million tons.
Cement and Other Minerals: The cement industry The rest of the emissions in the Industry sector came
emitted 129.92 million tons of CO2, which is 32% of from the non-energy product uses and this sector
the total CO2 eq emissions from the Industry sector. emitted 0.85 million tons of CO2 eq, and was mainly
The emissions cover the entire technology mix for from use of oil products and coal-derived oils primarily
manufacturing of cement in the country covering intended for purposes other than combustion.
large, medium and white cement plants. The other
minerals like glass and ceramic production and soda Agriculture: The agriculture sector emitted 334.41 million
ash use together emit 1.01 million tons of CO2 eq. tons of CO2 eq in 2007. Estimates of GHG emissions
from the agriculture sector arise from enteric
Iron and Steel and Other Metals: The iron and steel fermentation in livestock, manure management, rice
industry emitted 117.32 million tons of CO2 eq. The paddy cultivation, agricultural soils and on field burning
estimate covers integrated and mini steel plants. The of crop residue. (Figure ES6)
production of other metals, namely, aluminum,
ferroalloys, lead, zinc and copper production lead to Livestock: Enteric fermentation in livestock released
an emission of 5.42 million tons of CO2 eq. 212.10 million tons of CO2 eq (10.1 million tons of
CH 4). This constituted 63.4% of the total GHG
Chemicals: The chemical industries together emitted emissions (CO2 eq) from agriculture sector in India.
8.1% of the total GHG emissions from the industry The estimates cover all livestock, namely, cattle,
sector (33.50 million tons). See figure ES5 and glossary buffalo, sheep, goats, poultry, donkeys, camels, horses
for sub categories included. and others. Manure management emitted 2.44 million
tons of CO2 eq.
Other Industries: Other industries comprising of pulp/
paper, leather, textiles, food processing , mining and Rice Cultivation: Rice cultivation emitted 69.87 million
quarrying, and non specific industries comprising of tons of CO2 eq or 3.27 million tons of CH4. The
Page v India: Greenhouse Gas Emissions 2007Figure ES6: GHG emissions from Agriculture Sector Figure ES7: GHG emissions and removals from LULUCF
(million tons of CO2 eq). sector (million tons of CO2 eq).
emissions cover all forms of water management Crop Lands: The emission estimates have been made
practiced in the country for rice cultivation, namely, from net sown area as well as fallow land. The crop
irrigated, rainfed, deep water and upland rice. The land sequestered 207.52 million tons of CO2 in 2007.
upland rice are zero emitters and irrigated
continuously flooded fields and deep water rice emit Grassland: Changes in Grassland resulted in the
maximum methane per unit area. emission of 10.49 million tons of CO2 due to decrease
in grass land area by 3.4 million ha between the two
Agricultural Soils and Field Burning of Crop Residue: periods.
Agricultural soils are a source of N2O, mainly due to
application of nitrogenous fertilizers in the soils. Settlements: Land converted to settlements though
Burning of crop residue leads to the emission of a increased by 0.01 million ha during the period,
number of gases and pollutants. Amongst them, CO2 however, the conversions did not lead to an emission
is considered to be C neutral, and therefore not but a net removal of 0.04 million tons.
included in the estimations. Only CH4 and N2O are
considered for this report. The total CO2 eq emitted Waste: The waste sector emissions were 57.73 million
from these two sources were 50.00 million tons. tons of CO2 eq from municipal solid waste management,
domestic waste water and industrial waste water
Land Use Land Use Change and Forestry: The estimates management. (Figure ES8)
from LULUCF sector include emission by sources and
or removal by sinks from changes in forest land, crop Municipal Solid Waste (MSW): Systematic disposal
land, grassland, and settlements. Wet lands have not been of solid waste is carried out only in the cities in India
considered due to paucity of data. The LULUCF sector resulting in CH4 emissions due to aerobic conditions
in 2007 was a net sink. It sequestered 177.03 million tons generated due to accumulation of waste over the
of CO2. (Figure ES7) years. It is estimated that the MSW generation and
disposal resulted in the emissions of 12.69 million
Forest Land: This includes estimates of emissions and tons of CO2 eq in 2007.
removal from above and below ground biomass in
very dense, moderately dense, open forests, and scrub Waste Water: The waste water generation emissions
lands. Estimates indicate that forest land sequestered are the sum total of emissions from domestic waste
67.8 million tons of CO2 in 2007. However, fuel wood water and waste water disposal in industries. Waste
extracted non-sustainably from forests lead to an water management in both these categories together
emission of 67.80 million tons of CO2 in 2007. emitted 45.03 million tons of CO2
Indian Network for Climate Change Assessment Page viFigure ES8: GHG emissions from waste
(million tons of CO2 eq).
E. FUTURE DIRECTIONS
The robustness of the GHG inventory making process is
dependent on the Tier of methodology used. Higher the
Tier, more representative is the emission estimated of
the actual emissions. Of the total 1727.71 million tons of
CO2 equivalent emissions from India in 2007, 21% of
the emissions have been estimated using Tier I
methodology, 67% by Tier II and 12% by Tier III.
Riding the Tier Ladder: For improving the inventory
estimations of key categories using Tier II and Tier I
methodologies, there is a need to move up the Tier
ladder. Strategies needed include improvement in
assimilation of activity data representing national
circumstances, bridging data gaps, and eliminating
uncertainties by developing country specific GHG
emission factors.
Capacity Building and National Greenhouse Gas
Inventory Management System: Capacity building is
essential at institutional and individual levels. Capacity
at the institutional level addresses the needs of inventory
preparation at national, sectoral and point source level
that requires collection and archiving of data on a
continuous basis. Establishment of a National Inventory
Management System is therefore necessary. It is also
important to involve additional institutions with varied
research experience, to widen the pool of researchers
and enable the integration of latest practices.
Page vii India: Greenhouse Gas Emissions 2007ANNEXURE
Greenhouse gas emissions by sources and removal by sinks from India in 2007 (thousand tons)
CO2 emissions CO2 removals CH4 N2O CO2 equivalent
GRAND TOTAL 1497029.20 275358.00 20564.20 239.31 1727706.10
ENERGY 992836.30 4266.05 56.88 1100056.89
Electricity generation 715829.80 8.14 10.66 719305.34
Other energy industries 33787.50 1.72 0.07 33845.32
Transport 138858.00 23.47 8.67 142038.57
Road transport 121211.00 23.00 6.00 123554.00
Railways 6109.00 0.34 2.35 6844.64
Aviation 10122.00 0.10 0.28 10210.90
Navigation 1416.00 0.13 0.04 1431.13
Residential 69427.00 2721.94 36.29 137838.49
Commercial / Institutional 1657.00 0.18 0.04 1673.18
Agriculture/ Fisheries 33277.00 1.20 1.15 33658.70
Fugitive emissions 1509.40 31697.30
INDUSTRY 405862.90 14.77 20.56 412546.53
Minerals 130783.95 0.32 0.46 130933.27
Cement production 129920.00 129920.00
Glass & cermic production 277.82 0.32 0.46 427.14
Other uses of soda ash 586.12 586.12
Chemicals 27888.86 11.14 17.33 33496.42
Ammonia production 10056.43 10056.43
Nitric acid production 16.05 4975.50
Carbide production 119.58 119.58
Titanium dioxide production 88.04 88.04
Methanol production 266.18 0.91 285.37
Ethylene production 7072.52 9.43 7270.64
EDC & VCM production 198.91 198.91
Ethylene Oxide production 93.64 0.19 97.71
Acrylonitrile production 37.84 0.01 37.98
Carbon Black production 1155.52 0.03 1156.07
caprolactum 1.08 336.22
Other chemical 8800.21 0.56 0.20 8873.97
Metals 122371.43 0.95 1.11 122736.91
Iron & Steel production 116958.37 0.85 1.09 117315.63
Ferroalloys production 2460.70 0.08 2462.29
Aluminium production 2728.87 0.01 0.00 2729.91
Lead production 84.13 0.00 0.01 86.38
Zinc production 76.11 0.00 0.01 77.99
Copper 63.25 0.01 0.00 64.70
Other Industries 123969.17 2.37 1.65 124530.44
Pulp and paper 5222.50 0.05 0.08 5248.35
Food processing 27625.53 1.12 0.22 27717.25
Textile and leather 1861.11 0.03 0.02 1867.94
Mining and qurrying 1460.26 0.06 0.01 1464.62
Non-specific industries 87799.77 1.11 1.32 88232.28
(contd…)
Indian Network for Climate Change Assessment Page viiiCO2 emissions CO2 removals CH4 N2O CO2 equivalent
Non energy product use 849.49 849.49
Lubricant 776.75 776.75
Paraffin wax 72.75 72.75
AGRICULTURE 13767.80 146.07 334405.50
Enteric fermentation 10099.80 212095.80
Livestock Manure management 115.00 0.07 2436.70
Rice cultivation 3327.00 69867.00
Soils 140.00 43400.00
Burning of crop residue 226.00 6.00 6606.00
LULUCF 98330.00 275358.00 -177028.00
Forestland 67800.00 -67800.00
Cropland 207520.00 -207520.00
Grassland 10490.00 10490.00
Settlement 38.00 -38.00
Wetland NE NE
Other land NO NO
Fuel wood use in forests 87840.00 87840.00
Waste 2515.58 15.80 57725.18
Municipal Solid waste 604.51 12694.71
Domestic waste water 861.07 15.80 22980.47
Industrial waste water 1050.00 22050.00
Bunkers* 3454 0.03 0.10 3484.45
Aviation Bunkers 3326 0.02 0.09 3355.31
Marine bunkers 128 0.01 0.003 129.14
Note: LULUCF: Land Use Land Use Change & Forestry
*Not included in the national totals.
NE: Not estimated; NO: Not occuring
Page ix India: Greenhouse Gas Emissions 20071 Context and Relevance Climate change is recognized both as a threat and a The physiographic features and the geographic location, challenge. The impact of human activities on climate and which control the climate of the country, bestows it with climate systems is unequivocal. Climate has a significant great wealth of its natural resources, surface and ground role in the economic development of India. Many sectors water availability, forestry and vegetation. The region of the economy are climate sensitive. Climate change abounds in very rich collection of flora and fauna, and has origins in anthropogenic activities and is engaging some of these locations exhibit a high degree of species the attention of planners, governments, and politicians endemism and constitute biodiversity hotspots of the worldwide. It is no longer a scientific question as to world. There is an ever increasing recognition of the need whether the climate is changing, but the question is the for national level assessments which provides an timing and magnitude of Climate Change. The opportunity to enhance our knowledge and governments of the countries across the world are understanding about the implication of both the current engaged in working out the impacts and associated climate variability as well as the projected adverse vulnerabilities of their economies to impending projected impacts of climate change. climate change. In India, the meteorological records indicate rise in the mean annual surface air temperature by 0.4°C with not much variations in absolute rainfall. However, the rates of change in temperatures and precipitation have been found to be varying across the region. The intensity and frequency of heavy precipitation events have increased in the last 50 years. The tide gauge observations in the last four decades across the coast of India also indicate a rise in sea level at the rate of 1.06-1.25 mm/year. Further, some preliminary assessments point towards a warmer climate in the future over India, with temperatures projected to rise by 2-4oC by 2050s. No change in total quantity of rainfall is expected, however, spatial pattern of the rainfall are likely to change, with rise in number and intensity of extreme rainfall events. The sea level is also projected to rise with cyclonic activities set to increase significantly with warmer oceans. The continuous warming and the changing rainfall pattern over the Indian region may jeopardize India’s development by adversely impacting the natural resources such as water forests, coastal zones, and mountains on which more than 70% of the rural population is dependent. Page 1 India: Greenhouse Gas Emissions 2007
2
Climate Change Assessments in India

Recognition of the need for assessing the implications       Development Bank study: Asia Least Cost Greenhouse
of Climate Change in India coincides with the emergence      Gas Abatement Strategy (ALGAS) was yet another
of the issue of global warming in late eighties and early    important assessment on Greenhouse Gases at the 1990
nineties. Globally, the decade of 1990’s which saw the       level (ALGAS, 1998). These studies in effect provided the
adoption of the United Nations Framework Convention          impetus to the work relating to impacts of Climate
on Climate Change (UNFCCC) and the publication of            Change in the country. Publications such as Climate
the update on Climate Change 1992 by the Inter               Change and India in 2002, 2003 and 2004 (Shukla et al.,
Governmental Panel on Climate Change (IPCC) could            2002 and 2003; Mitra et al., 2004) documented a
be taken as the beginning of preparation of the dedicated    consolidated picture on Climate Change Assessments.
assessments of climate change. In the Indian context,        The chronology of greenhouse gas emission estimates
researchers initiated work in their own limited fields. By   made in the country is shown in Table 2.1.
all means the information was scattered, diffused and
fragmented on various aspects of Climate Change. The         In 2004, for the first time in a well coordinated and
only source of information on climate was available          dedicated effort was made to produce assessing
through India’s Meteorology Department (IMD) and the         Greenhouse Gases of anthropogenic origin from sectors
Indian Institute of Tropical Meteorology (IITM) and          such as Energy, Agriculture, Industry, Land Use, Land Use
certain premier institutes such as Indian Institute of       Change and Forestry and Waste and efforts were also
Science (IISc) and the Indian Space Research                 made to assess the climate change Impacts and
Organization (ISRO) and its associated institutions.         vulnerability of key sectors of economy in India’s Initial
                                                             National Communication to the UNFCCC (NATCOM,
For the first time information on Climate Change was         2004).
consolidated for the preparation of India report of the
Asian development Bank’s study on Climate Change             Currently, 127 institutions are working on different
(ADB 1994). The study was limited to the compilation of      aspects of climate change. The National Action Plan on
literature and certain studies on impacts of Climate         Climate Change (NAPC, 2008) calls for launch on
Change on Agriculture, Water and Forests besides sea         missions on Agriculture, Water, Solar, Energy, Forestry,
level rise. During this period a nation wide campaign was    Himalayan Ecosystems and Strategic Knowledge on
instituted by MoEF to access the emission of CH4 from        Climate Change. The mission programmes are at
rice paddy cultivation in India. The study had an            advanced stages of preparation and would contribute
international impact on the global as well as national       to advancing the state of knowledge in the various
emissions of CH4 (Parashar et al., 1994). The Asian          aspects of Climate Change.

  Indian Network for Climate Change Assessment                                                                Page 2
Table 2.1: Chronology of greenhouse gas assessments carried out in India
Gases CO2, CH4 CO2, CH4 CO2, CH4, CH4 CO2, CH4, CO2, CH4,
CH4 N2O, NOX, N2O N2O
CO, NMVOC
Sectors Fossil fuel Transport All India Biomass Rice – All sources All sources
Rice Coal mines Campaign Cement extended (1996 (1996
Animals Rice Rice - Oil & natural campaign guidelines) guidelines)
Livestock seasonally gas, manure (organic and
integrated Crop residue, non organic
approach and soils, MSW soils)
water regimes
defined
Emission Published Used Developed Default and Developed Default IPCC 30% Country
Factors Emission published developed Specific and
Factors Emission 70% Default
Factors
Base Year 1990 1990 1992 1990 1998 1990-1995 1994
Reference Mitra et al., Mitra et al, Parashar et al, ALGAS India, Gupta et al., Garg , NATCOM
1991 1992 1994, 1997 1998 1999 Bhattacharya 2004
& Shukla, 2001
Page 3 India: Greenhouse Gas Emissions 20073
Indian Network for Climate Change Assessment
A national workshop towards preparation of a Assess the drivers and implications of climate change
Comprehensive Climate Change Assessment was through scientific research
organized by the Ministry of Environment & Forests at Prepare climate change assessments once every two
New Delhi on October 14th, 2009. The workshop was years (GHG estimations and impacts of climate
chaired by Hon’ble Minister of Environment & Forests change, associated vulnerabilities and adaptation)
and attended by nearly 200 scientists/ experts Develop decision support systems
representing premier institutions such as IIT, IIM, IISc, Build capacity towards management of climate change
Universities, and research development institutions related risks and opportunities
under the Council of Industrial Research, Indian
Council of Agricultural Research, government It is visualized as a mechanism to create new institutions
Ministries / Departments, autonomous institutions, and engage existing knowledge institutions already
Non-government al Organizations and private working with the Ministry of Environment and Forests as
companies. The workshop was also attended by well as other agencies. Currently, the institutions of the
representatives of the media. Scientists presented their various Ministries such as that of Ministry of Environment
work on multidisciplinary aspects of Climate Change & Forests, Ministry of Earth Sciences, Ministry of
presently supported by the MoEF. Principal Scientific Agriculture, Ministry of Science & Technology, Defence
Adviser to the Government of India addressed the Research and Development Organisation etc., along with
workshop and released the document titled, ‘Towards the research institutions of the Indian Space Research
Comprehensive Climate Change Assessment’. The Organisation, Council of Scientific and Industrial
workshop was also addressed by Secretary, Environment Research, Indian Council of Agriculture Research,
& Forests. Department of Science & Technology, Indian Council of
Medical Research, Indian Institute of Technology, Indian
During this workshop, Hon’ble Minister Jairam Ramesh Institute of Managements and prominent state and
announced the establishment of Indian Network for central Universities, and reputed Non Governmental
Climate Change Assessment (INCCA). Emphasizing the Organisations and Industry Associations are working in
need for INCCA, Minister underscored the significance the various studies on Climate Change
of availability of authentic national data for analysing the
implications of Climate Change vis-a-vis the The scope of the programmes under INCCA has been
understanding of Science of Climate Change, Impacts, developed on the basis of the fundamental questions
Vulnerability, Adaptation and Mitigation of Climate that we ask ourselves for climate proofing systems and
Change. In this context, it was emphasized that the ‘3 the society dependent on climate and include, inter alia:
Ms - Measuring, Modelling and Monitoring” are the Short, medium and long-term projections of climate
hallmarks of the initiatives relating to Climate Change. changes over India at sub regional scales
The impacts of changes in climate on key sectors of
The Indian Network for Climate Change Assessment economy important at various regional scales
(INCCA) has been conceptualized as a network based The anthropogenic drivers of climate change i.e.
scientific programme designed to: greenhouse gas and pollutants emitted from various
sectors of the economy
Indian Network for Climate Change Assessment Page 4 The processes through which GHGs and pollutants patterns and drivers of change that influences the
interact with the climate system and change the bio- sustainability of livelihoods dependent on these
physical environment systems across India;
Build capacity through thematic workshops and
The mandate of INCCA would continue to evolve to training programmes; and
include the new science questions that confront Synthesize information thus generated in appropriate
humanity including the population living within the Indian communication packages for informed decision
region. The aim of scientific research under INCCA is making
envisaged to encompass research that will develop
understanding on the regional patterns of climate across A schematic representation of the programmes in INCCA
India, how it is changing over time and likely to behave are shown in figure 3.1.
in the future. Consequently, INCCA will also focus on
the impacts of the changing climate on regional The approaches of the scientific programmes under
ecosystem hotspots, human systems and economic INCCA would be to further develop network of Indian
sectors. The following programmes are initially institutions drawing upon knowledge institutions that
contemplated to be carried out under the aegis of have so far contributed towards scientific knowledge and
INCCA: expand the same encompassing more number of
A provisional assessment of the Green House Gas institutions in the country. Besides, INCCA would harness
emission profile of India for 2007 by sources and Involvement of Indian as well as Indian expertise abroad
removal by sinks presented in this document; and would focus on four zones, namely, the Himalayan
An assessment of the impacts of climate change on region, the North eastern plains, the Western Ghats &
water resources, agriculture, forests and human health the Coastal region. The assessment would stress to
in the Himalayan region, North eastern region, develop climate projection scenarios and their impacts
Western ghats and Coastal regions of India; on systems to evaluate the associated vulnerabilities for
Undertake an assessment of black carbon and its developing adaptation strategies.
impact on ecosystems;
Undertake a long-term ecological, social, and The Ministry of Environment and Forests, would
economic monitoring of ecosystems to identify coordinate the activities under INCCA, taking advantage
Figure 3.1: Programmes envisaged under INCCA
Page 5 India: Greenhouse Gas Emissions 2007of the wide spread network of knowledge institutions emissions by sources and removals by sinks at 1994 level
established by the Ministry for carrying out various using Intergovernmental Panel on Climate Change
projects in areas related to climate change such as the guidelines 1996 (Revised). This is for reasons of
science and impacts of climate change and associated comparability of data across countries for calculation of
policy issues. global emission trends. The next level of common year
of reporting is the year 2000.
The MoEF, through a system of a wide consultative
process with scientists and experts, envisages formulating This assessment of greenhouse gas profile 2007 has been
the emerging scientific questions in the area of climate worked out by a number of scientists/ experts drawn
change research that will govern the development of the from the institutions which were involved in previous
programmes. A more comprehensive implementation estimation as well as currently engaged in the preparation
arrangement will be put in place during the operational of inventories of greenhouse gases (see Annexure 3).
phase of the programme which will include a scientific These estimates though provisional fill the long felt need
advisory committee for guidance and review of the for the latest emission data. For preparing the GHG
activities of the various programmes. emission inventory estimates presented in this document,
expertise of a number of institutions has been pooled in
THE 2007 ASSESSMENT & across the country and a network has been created that
IMPLEMENTATION ARRANGEMENT can generate information on a regular basis. The network
includes institutions that have been working in the area
The official Greenhouse gas Emission Profile of India at of greenhouse gas emission inventory development
1994 level was prepared for the India’s Initial National including the process of generation of country specific
Communication submitted to the UNFCCC in June, emission factors of GHGs for various anthropogenic
2004. The reason for restricting the estimation upto 1994 activities. It indeed makes the inventory scientifically
was in pursuance of the requirement of reporting towards robust. The network of institutions is drawn from a diverse
implementation of the obligations under the UNFCCC mix of premier national institutions currently working
and the guidelines enjoining upon all the developing under various aspects of Climate Change with MoEF.
countries to provide information on Greenhouse gas (figure 3.2)
Indian Network for Climate Change Assessment Page 62007 Assessment IGFRI Indian Grass & Fodder Research Institute
BCKV Bidhan Chandra Krishi Viswavidyalaya IISc Indian Institute of Science
CII Confederation of Indian Industries IVRI Indian Veterinary Research Institute
CIMFR Central Institute of Mining & Fuel Research NDRI National Dairy Research Institute
CLRI Central Leather Research Institute NEERI National Environment Engineering Research Institute
CMA Cement Manufacturing Association NPL National Physical Laboratory
CRRI Central Road Research Institute NRCS National Remote Sensing Centre
FSI Forest Survey of India PPAC Petroleum Planning and Analysis Cell
IARI Indian Agricultural Research Institute TERI The Energy and Resources Institute
Figure 3.2: INCCA and Network for preparing the Greenhouse Gas Emissions 2007.
Page 7 India: Greenhouse Gas Emissions 20074
Greenhouse Gas Estimation - 2007
Towards fulfillment of its obligations of furnishing the year 2007. The sectors included are Energy, Industry,
information relating to implementation of the Convention Agriculture, Land Use Land Use Change & Forestry and
in accordance with Article 4.1 and 12(1) of the United Waste. A schematic representation of the sectors, source
Nations Framework Convention on Climate Change, categories and the gases included in the present assessment
India has communicated its first national communication is shown in Figure 4.1.
to the UNFCCC in 2004 with GHG emission data for
the year 1994. Currently, India is preparing its second An assessment of the collective emissions of CO2, CH4
national communication for the base year 2000. and N 2O expressed as Carbon Dioxide equivalent
However, there is a need for latest data on GHG (CO2 eq) has also been presented here, wherein CO2
emissions from the country, especially for informed equivalent is the sum total of CO2, CH4 and N2O emitted
decision making. In this direction a network of institutions in terms of their respective global warming potentials
have been put in place to prepared the 2007 GHG (GWP). Relative values of GWP of CO2, CH4 & N2O are
inventory (Refer to Figure 3.1). presented in Table 4.1. For definition of GWP, see glossary.
4.1 COVERAGE By assigning a GWP value to a GHG, allows scientists
and policy makers to compare the potency of each gas
The 2007 assessment presents the estimates of CO2, CH4 to trap heat in the atmosphere relative to other gases.
and N2O emitted as a result of anthropogenic activities The heat trapping potential of other greenhouse gases
from various sectors of the economy at national level for are measured and compared with CO2. The GWP of CO2
Table 4.1: Global Warming Potential (GWP) of the GHGs
Industrial Designation Chemical Lifetime (years) Radiative Global Warming Potential for
or Common Name Formula Efficiency Given Time Horizon (100 yr)
(years) (W m–2 ppb–1)
Carbon dioxide CO2 Upto 100 yrs 1.4x10⁻⁵ 1
Methane CH4 12 3.7x10⁻⁴ 21
Nitrous oxide N2O 114 3.03x10⁻³ 310
Source: IPCC AR4, 2007a
Indian Network for Climate Change Assessment Page 8SECTOR EMISSION CATEGORY GAS
Electricity Generation CO2, CH4, N2O
Other energy industries CO2, CH4, N2O
Road
Transport Rail CO2, CH4, N2O
Aviation
ENERGY Navigation
Residential CO2, CH4, N2O
Commercial/ institutional CO2, CH4, N2O
Agriculture/ fisheries CO2, CH4, N2O
Coal mining
Fugitive Oil & Natural gas CH4
Minerals Cement, Lime, glass,
ceramics, soda ash
Industry Metals Iron, steel, Ferro alloys, zinc,
aluminum, magnesium, lead
Chemicals Ammonia, nitric acid, adipic acid,
carbonates, others CO2, CH4, N2O
Textiles, leather, paper, food
Other industries processing, food & beverages,
non specified industries,
mining & quarrying
Non energy products Lubricant use,
from fuels Paraffin wax use CO2
Enteric fermentation in livestock CO2, CH4, N2O
Manure management
Agriculture Rice cultivation CH4
Agricultural soils N2O
Burning of crop residue CH4, N2O
Land Use, Land Forest land
Use Change & Crop land CO2
Forestry Grass land
Settlements
Waste Municipal Solid Waste
CH4, N2O
Wsate Water
Figure 4.1: Sectors, emission categories and emissions presented in this assessment
(Also see glossary for details)
Page 9 India: Greenhouse Gas Emissions 2007is taken as one and accordingly CH4 has a GWP of 21 emissions factors of CO2 from coal (Choudhury et al.,
and N2O has a GWP of 310. 2004), CH4 from coal mining (Singh A K, 2004), N2O
from nitric acid production (Rao et al. ,2004), CO2 from
cement (Rao et al., 2006), CH 4 from rice (Gupta et
4.2 METHODOLOGY, ACTIVITY DATA al., 2004), CH4 from enteric fermentation in livestock
AND EMISSION FACTORS (Swamy et al., 2006), N2O from soils (Pathak et al.,
2002); CH4 from Municipal solid waste (Jha et al.,
Methodology: The estimates presented here have been 2007) amongst others. See Annexure 2 for complete
calculated using standard methodologies contained in list of references.
the Revised 1996 IPCC Guidelines for National
Greenhouse Gas Inventories (IPCC, 1997), the IPCC Tier of estimation: Tiers of estimation of GHGs is an
Good Practice Guidance and Uncertainty Management IPCC parlance suggesting the level of complexity applied
in National Greenhouse Gas Inventories (IPCC 2000), in estimating the GHG emissions from a particular source
and the IPCC Good Practice Guidance for Land Use, category. The Tiers of estimate range between Tier I. II,
Land-Use Change, and Forestry (IPCC 2003). & III. Higher Tier implies a more data intensive effort (see
box 4.3). For example, CH4 from rice cultivation is
The simplest representation of the methodology used estimated by using Tier III approach, where by the total
for estimating particular GHG emission from each source rice area is divided into areas characterizing different
category is when activity data for a source category is water management practices in the country. The GHG
multiplied by respective emission factor to obtain emission factors used for estimating CH4 from these
emissions from that source category for a specific gas. areas are actual measurements carried out that
To calculate the total emissions of a gas from all its source represent CH4 emission/unit area covering a each
categories, the emissions are summed over all source different water management practice. Efforts are
categories (see equation below). generally made to use a Tier II or III (i.e a data intensive
approach) for categories that are identified as key
EmissionsGas = ∑Category A x EF emissions categories (see Chapter 11, for more details
on key categories).
Here EmissionsGas is the emissions of a given gas from all
its source categories, A is the amount of individual source
category utilized that generates emissions of the gas
under consideration, EF is the emission factor of a given
gas by type of source category (emissions per unit of
activity data utilized).
Activity data: Activity data for 2007 have been primarily
derived from the published documents of the various
ministries and organizations of the Government of India,
from industry associations (such as the Cement
Manufacturers’ Association (CMA) of India) and from
reputed data organizations such as the CMIE. See
Annexure 1 for a comprehensive list of activity data
sources.
Emission factors: The emission factors used in this report
are a mix of default emission factors available in IPCC
publications (1997, 2000, 2003 and 2006) and country
specific emission factors. Default emission factors have
been used for gases and categories where country
specific factors are not available. Some of the country
specific emission factors used in this document include
Indian Network for Climate Change Assessment Page 10You can also read