INDIA SPOTLIGHT ACCESS TO NUTRITION INDEX 2020 - METHODOLOGY DEVELOPMENT, STRUCTURE, SCOPE, CONTENTS, SCORING AND RESULTS PRESENTATION February 2020
←
→
Page content transcription
If your browser does not render page correctly, please read the page content below
INDIA
SPOTLIGHT
ACCESS TO
NUTRITION
INDEX 2020
METHODOLOGY
DEVELOPMENT, STRUCTURE, SCOPE, CONTENTS,
SCORING AND RESULTS PRESENTATION

February 2020
INDIA SPOTLIGHT
ACCESS TO NUTRITION INDEX 2020
                    METHODOLOGY

                              2
Table of contents
Table of contents.............................................................................................................. 3
Abbreviations ................................................................................................................... 5
Introduction ..................................................................................................................... 6
1. Conceptual framework: Corporate benchmarking ....................................................... 8
2. ATNI’s Index methodology design process & background ......................................... 10
2.1 Purpose and Theory of Change behind ATNI’s Indexes ..................................................... 10
2.2 Stakeholder consultation and expert input ....................................................................... 12
2.3 Original Global Index Corporate Profile methodology development..................................... 13
2.4 Spotlight Index development .......................................................................................... 16
2.5 Product Profile methodology development ....................................................................... 17
2.6 BMS marketing methodology development ...................................................................... 17
3. Key Index elements and scope ................................................................................... 18
3.1 Key Index elements ....................................................................................................... 18
a) The Corporate Profile ............................................................................................................................. 18
b) The Product Profile ................................................................................................................................. 18
c) The breast-milk substitutes (BMS) marketing assessment .......................................................................... 19
3.2 Topics beyond the scope of all Indexes ........................................................................... 19
4. Structure of the methodologies and approach to scoring and ranking ...................... 20
4.1 Corporate Profile methodology........................................................................................ 20
4.2 Product Profile methodology ........................................................................................... 24
5. The India Spotlight Index 2020 ................................................................................. 27
5.1 Specific aim of the India Spotlight Index .......................................................................... 27
5.2 Basis of, and approach to developing, the India Spotlight Index methodology .................... 27
5.3 Company selection ........................................................................................................ 29
6. Key India Spotlight Index 2020 elements .................................................................. 31
6.1 Corporate Profile methodology: adaptation and changes since 2016 .................................. 31
6.2 India Spotlight Index Methodology structure .................................................................... 35
Approach to India Spotlight Index 2020 scoring and weighting ........................................................................... 37
Limitations to the Corporate Profile methodology .............................................................................................. 37
Product Profile Methodology ............................................................................................................................ 38
Limitations to the Product Profile methodology ................................................................................................. 39
Other research limitations and considerations ................................................................................................... 40
7. India Spotlight Index 2020 research methods ........................................................... 42
7.1 Corporate Profile assessment .......................................................................................... 42
3Product Profile assessment: Criterion B1 .......................................................................................................... 43
7.2 Quality assurance processes ........................................................................................... 43
8. Follow-up ................................................................................................................... 45
Appendices ..................................................................................................................... 46
Appendix I: India Spotlight Index Corporate Profile Methodology 2020 .................................... 46
Section 1 – Nutrition governance and management ........................................................................................... 46
Section 2 – Formulating and delivering appropriate, affordable, accessible products ............................................. 53
Section 3 – Influencing consumer choice and behavior ...................................................................................... 65
Appendix II: Organizations consulted .................................................................................... 81
Appendix III: ATNI India Review Panel and global Expert Group members .............................. 82
Disclaimer .......................................................................................................................... 84
4Abbreviations
ASCI Advertising Standards Council of India
ATNF Access to Nutrition Foundation
ATNI Access to Nutrition Initiative
BMS breast-milk substitute
CSO civil society organization
CSR corporate social responsibility
DOB date of birth
ESG environmental, social and governance
F&B food and beverage
FAO Food and Agriculture Organization of the United Nations
FBAI CNC Food & Beverage Alliance of India, Common Nutrition Criteria
FLW food loss and waste
FFRC Food Fortification Resource Centre
FSMS food safety management system
FSSAI Food Safety and Standards Authority of India
GAIN Global Alliance for Improved Nutrition
HFSS high in fat, salt and/or sugar
HSR Health Star rating
ICC International Chamber of Commerce
ICDS Integrated Child Development Services
IFBA International Food and Beverage Alliance
IMS Act Infant Milk Substitutes Act
INR Indian National Rupee
KPI key performance indicator
NDA non-disclosure agreement
NGO non-governmental organization
NITI Aayog National Institution for Transforming India
NNS National Nutrition Strategy
NPS nutrient profiling system
POSHAN Prime Minister’s Overarching Scheme for Holistic Nourishment
R&D research and development
SDGs Sustainable Development Goals
SEARO South-East Asia Regional Office (of WHO)
TGI The George Institute for Global Health
UN United Nations
WHO World Health Organization
5Introduction
This document sets out the methodology and design of the second Access to Nutrition India
Spotlight Index 2020, published by the Access to Nutrition Initiative (ATNI).
In 2016, this Index was the first independent national assessment to measure the contribution of
India’s largest food and non-alcoholic beverage (F&B) manufacturers towards Indian consumers’
nutrition and health needs. It showed that the largest F&B manufacturers in India are making
progress but falling short of what they can and must do to fight the double burden of malnutrition
(undernutrition and overweight/obesity challenges) in India. The 2016 Index scored companies on
their Corporate Profile and Product Profile with two separate rankings.1
To monitor and measure Indian companies’ impact further, the 2020 edition has been developed
and adapted to the present Indian context. The 2020 Index has increased the number of companies
assessed and presents one integrated ranking, with elements from the Product Profile now
incorporated into the Corporate Profile. As the underlying conceptual framework and methodology
of these two Profiles are distinct, they have been described as separate elements of the India
Spotlight Index 2020.
The purpose of the India Spotlight Index 2020 is to encourage companies to increase Indian
consumers’ access to healthy and affordable nutritious products and responsibly exercise their
influence on consumers’ choice and behavior. The Index is a relative ranking, allowing stakeholders
to compare performance between different companies and the development of individual corporate
performance over time. It is a tool that can be used by major food and non-alcoholic beverage
manufacturers to benchmark their nutrition practices and serves as an impartial source of
information for a wide range of stakeholders (investors, academics, government and civil society
organizations).
The Access to Nutrition Initiative (ATNI) is hosted by the Access to Nutrition Foundation (ATNF), an
independent, not-for-profit, international organization based in Utrecht, the Netherlands. It receives
core funding from the Dutch Ministry of Foreign Affairs, the UK Department for International
Development and the Bill & Melinda Gates Foundation. ATNI is independent from, and does not
accept funding from, companies it rates nor the wider F&B industry. It is overseen by a Board of
Directors. Further information about ATNI’s governance and operating policies is available here.
ATNI is also supported by more than 60 institutional investment organizations with $7 trillion in
assets under management, all of whom have signed the Access to Nutrition Index Investor
Statement. ATNI has worked extensively with the investment community to ensure that the Index is
a useful tool for investors as they engage with and invest in F&B companies.
1
The Corporate Profile measures companies’ policies, practices and disclosure related to promoting good nutrition for all
and the Product Profile assesses the nutritional quality of companies’ product portfolios. Details of these are described in
chapters 3 and 4.
6The India Spotlight Index follows the model of the Global Access to Nutrition Index, the concept
and methodology for which were initially developed by the Global Alliance for Improved Nutrition
(GAIN) over a four-year period from 2009 to 2012. The Index concept was developed through
extensive consultation with stakeholders including companies, governments, international
organizations, civil society organizations, academia and investors. Three Global Indexes have been
published to date: the first in March 2013, the second in January 2016 and the third Index in March
2018. These Indexes score and rank the performance of the world’s largest global F&B
manufacturers’ nutrition policies, practices and disclosure. The Indexes also include an assessment
of the world’s six largest baby-food manufacturers’ marketing policies and practices. The third
Global Index also introduced a new element – the Product Profile – which assesses the nutritional
quality of the companies’ product portfolios.
Chapters 1 to 4 of this document describe the general approach ATNI uses to develop its Indexes,
including the Theory of Change, which guides the Initiative’s work. It outlines the main topics
addressed by ATNI Indexes and provides an explanation of the different elements:
– the Corporate Profile,
– the Product Profile and
– the breast-milk substitutes (BMS) marketing assessment,
although a BMS marketing assessment is not included in the India Spotlight Index 2020. The India
Spotlight Index 2020 methodology is described in chapters 5, 6 and 7 with details about company
selection, differences from the Global Index 2018 and the approach used for data collection and the
principles for scoring and ranking that are applied in the 2020 India Spotlight Index. Chapter 8
concludes with ATNI’s intentions in terms of publishing future India Spotlight Indexes. A full
description of the indicators used in the India Spotlight Index 2020 is included in Appendix I.
71. Conceptual framework: Corporate
benchmarking
Over the last two decades, there has been a proliferation of independent benchmarks, ranking
initiatives and financial indexes that measure corporate performance on a range of environmental,
social, governance (ESG) and ethical issues. Research conducted several years ago identified more
than one hundred at that time, and today there are even more.2
ATNI’s Indexes are modelled on the types of ESG benchmarks developed primarily for or by the
investment and finance community. These benchmarks are broadly similar: they typically assess
one or more of the following:
i) corporate policies or commitments on the selected issue or issues;
ii) their approach to, and progress in, managing the selected issues; and
iii) the extent of disclosure of their policies and practices.
They can be used in various ways:
i) by investors in their investment research and decision-making, or in their engagement with
companies in which they invest;
ii) by companies to compare their performance to their competitors, and develop better strategies
and plans; and
iii) by organizations or individuals (e.g. in academia, the media, policymakers, certification agencies
and auditors or corporate advisors) interested in companies’ contribution to addressing malnutrition
challenges.
One of the first steps taken by GAIN, the organization that incubated the Indexes, was to undertake
an in-depth analysis of 32 such benchmarks and indexes to learn from them and incorporate their
best features. Several of those assessed, including the Access to Medicine Index, the Carbon
Disclosure Project and the Forest Footprint Disclosure Project, continue to be published today.3
2 For more information, see: SustainAbility (2011), Rate the Raters Phase Four: The Necessary Future of Ratings, available
at: http://sustainability.com/wp-content/uploads/2016/07/rtr_phase_4_report.pdf; and SustainAbility (2018), Rate the
Raters 2018: Ratings Revisited, available at: http://s10458.pcdn.co/wp-content/uploads/2017/12/SA-
RateTheRaters_Ratings-Revisited_March18.pdf.
3 More information on these can be found in:
– Access to Medicine Index [online], available at: https://accesstomedicineindex.org/
– Carbon Disclosure Project [online], available at: https://www.cdp.net/en
– Forest Footprint Disclosure Project [online], available at: https://www.nepcon.org/newsroom/forest-
footprint-disclosure-project
8The Access to Nutrition Indexes aim to embrace the key principles that emerged from that analysis
outlined in Box 1 in order to provide robust, comprehensive, independent analysis of the world’s
largest F&B manufacturers’ contribution to addressing the world’s nutrition challenges.
Box 1: Key design principles that guide the Access to Nutrition Indexes
Base the assessment methodologies on prevailing international standards, norms and established
best practices where possible
ATNI Indexes aim to reflect the existing consensus on best practice, not to define such practices. Prevailing
international standards, norms and established best practices form the starting point of the methodology. The
Indexes do not assess compliance with regulations or law but the degree to which companies voluntarily take
responsibility to improve their policies, practices and products.
Recognize current state of knowledge and continually evolve
As knowledge and practices about diets, nutrition and health continually evolve, the methodology should be
revised at regular intervals, while striving to retain comparability over time.
Ensure relevance and applicability to a range of company types
ATNI methodologies are designed to evaluate the degree to which core business activities such as product
formulation, marketing, distribution and product labeling embed nutrition considerations. This type of
assessment is relevant to a variety of company ownership types (i.e. publicly listed and privately owned), as
well as companies with different product portfolios (primarily food, primarily beverages, or a mix of both).
Identify, reward and spread good practice
ATNI Indexes aim to generate ‘healthy competition’ among the ranked companies to encourage them to do
better in each future Index iteration, thereby demonstrating their increasing contribution to addressing critical
nutrition challenges. They are not intended to be ‘name and shame’ exercises. The ATNI Indexes therefore
award credit for good practice beyond minimum standards, rather than penalizing companies for poor practice.
The Indexes aim to highlight which companies have the healthiest portfolios and the healthiest products within
categories, to stimulate them to improve their products and increase their contribution to public health.
Encourage transparency and good practice
The ATNI Indexes award credit to companies not only for their policies and practices, but also for the level and
quality of their public reporting. High levels of transparency allow other stakeholders to better understand the
extent to which companies are addressing nutrition matters, and to engage with them about their approach
and effectiveness.
Utilize an inclusive approach, incorporating multi-stakeholder input
Input from relevant stakeholder groups – including policymakers, experts, civil society organizations and
industry – was sought throughout the original methodology development process and subsequent revisions.
This applies to the Global Index methodology, which served as the basis for the Spotlight Index methodology,
and the same approach was applied in the development of the latter’s methodology.
92. ATNI’s Index methodology design
process & background
This chapter describes how the Index methodology was developed, to provide an understanding of
its scope and unique attributes. This is important background because the methodologies for all
Spotlight Indexes are derived from the Global Index methodology.
The first section outlines the purpose of the Indexes and the underlying Theory of Change before
outlining the critical role stakeholder consultation and expert input plays in all methodology design
and development. The following section explains the steps taken to design the initial Global Index
methodology and the three elements that make up the Indexes at present without referring to the
specific details of the India Spotlight Index 2020.
2.1 Purpose and Theory of Change behind ATNI’s Indexes
The purpose of ATNI is to develop and deliver tools that:
• track the contribution of the F&B industry to addressing the global nutrition challenges of
overweight and obesity, diet-related diseases, as well as undernutrition and
• can be used by stakeholders to hold companies to account for delivering their commitments
to these challenges.
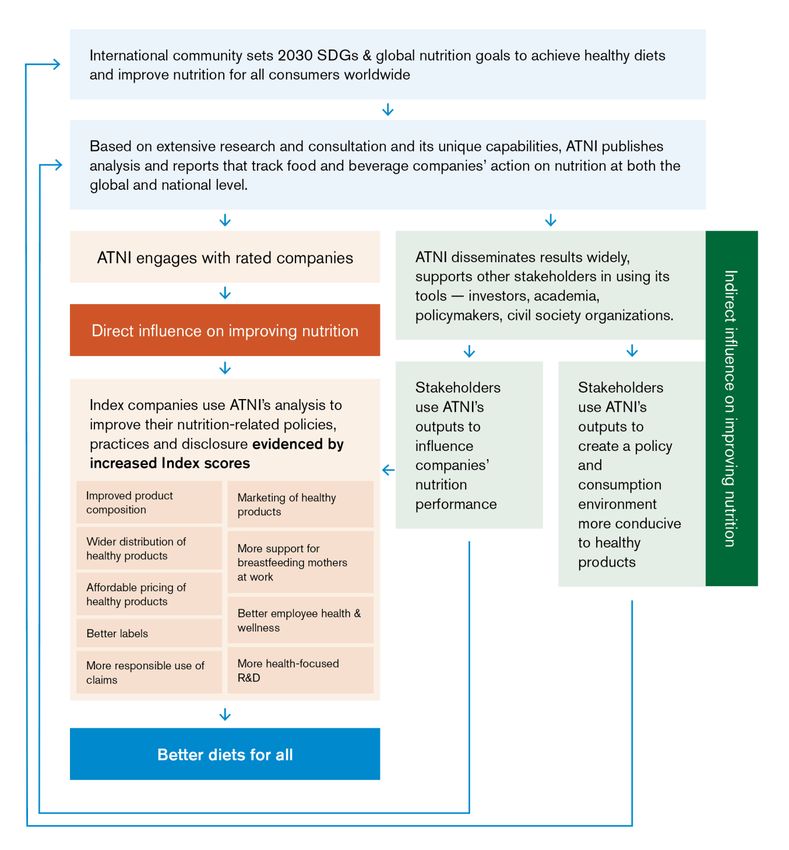
ATNI uses the Global Indexes – its flagship tools – to encourage F&B companies to do as much as
they can to improve the diets of adults and children around the world, as depicted in ATNI’s Theory
of Change below (Figure 1).
The point of departure for ATNI’s Theory of Change is contributing to the global effort to reach the
Sustainable Development Goals (SDGs): while improving nutrition and achieving sustainable diets
healthy for people and the planet is an important element for the achievement of at least 12 of the
17 SDG’s, ATNI prioritizes Goal 2: End hunger, achieve food security and improved nutrition and
promote sustainable agriculture.’ This objective is responsible for the tools that ATNI develops and
employs to help F&B manufacturers become further involved in the process of ending hunger and
ensuring access for all to safe, nutritious and sufficient food (Target 2.1) and ending all forms of
malnutrition (Target 2.2) by 2030. Likewise, Goal 3 – ‘Ensure healthy lives and promote well-being
for all at all ages’ – also guides ATNI’s work, aiming to improve access to more nutritious foods and
healthier lifestyles for all, with particular attention to the needs of mothers, newborns and children,
as well as underserved populations.
10Figure 1: ATNI’s Theory of Change
Given their scale and reach, globally as well as in India, large F&B manufacturers have a substantial
influence on the lives of consumers and employees, and as a result can play a meaningful part in
improving their diets and health.
112.2 Stakeholder consultation and expert input
As noted in the introduction, the Indexes were conceived by GAIN in 2009. In the three years
leading up to the launch of the first Global Access to Nutrition Index in 2013, stakeholder
consultations were held and extensive research was conducted. This was with the aim of building a
‘best in class’ Index that would be used by different stakeholders, and one that reflected the latest
thinking on the private sector’s role in tackling nutrition challenges.
Input from a wide range of stakeholders has informed every step of the Indexes’ design, beginning
with an early feasibility assessment undertaken by McKinsey & Co., and including development of
the methodology used for the first Index and the creation of a multi-year strategic plan for the
organization. ATNI has a wide range of stakeholders. These include:
• the F&B manufacturers included in the Indexes and their advisors;
• other F&B companies, including other manufacturers as well as food retailers and others in
the food processing value chain;
• F&B industry associations or groupings;
• investment banks, investment managers and investment-sector associations;
• non-governmental organizations (NGOs);
• United Nations (UN) agencies;
• academia;
• governments and policymakers;
• media;
• consultants and experts; and
• other commentators or opinion formers relating to the F&B sector, health and nutrition.
Index development began mid-2009 with a first phase of work to assess whether such a tool would
be useful to encourage companies to increase consumers’ access to more nutritious foods and
beverages. In this phase, a variety of stakeholders in high- and low-income countries were
consulted. A total of six group consultations were held from September to November 2009 in North
America, Europe, Asia and Africa to ensure diverse input. These were supplemented by a series of
individual conversations with representatives of key stakeholder groups. Overall, the stakeholders
consulted were receptive to the idea of an Index and provided essential insight into challenges and
opportunities in rating companies on their nutrition practices. The consultations also provided early
indications of how different stakeholders might use an Index.
Two multi-stakeholder groups were established in 2011 to provide advice on various aspects of
Index development: an Expert Group and an Independent Advisory Panel. In order to protect the
independence of the Index, no executives currently employed by F&B companies are eligible to
serve on either group. All members serve in their personal capacities and solely in an advisory role.
Expert Group
The mandate of the ATNI Expert Group is to advise on methodology development and to review
Index reports, i.e. it is a technical advisory group. Expert Groups are comprised of specialists in
12nutrition (including both undernutrition and obesity/diet-related chronic diseases) and in the role
that the F&B industry plays in the nutrition sector. A specific BMS Marketing sub-group also advises
on the approach to assessing BMS marketing, and on methodology development.
For each Spotlight Index, separate Expert Groups or Review Panels are set up, comprised of
members with specific insight and expertise with respect to that specific market. The members of
the India Spotlight Index Review Panel are listed in Appendix III, and a list of those who advise on
the Global Index is available here.
After the publication of each Index, ATNI consults stakeholders to solicit their views on the results
and recommendations, the methodology and how the Index should evolve. This is important to
ensure that the Indexes reflect current stakeholders’ knowledge and expectations, and because
ATNI relies on the active use by stakeholders of the results of the Index to amplify their impact.
The input received from these consultations is collated and shared with the Expert Group, along
with ATNI’s analysis of any changes to relevant standards, guidelines and international or national
strategies or frameworks, and informs changes that ATNI makes to each iteration of the Index
methodologies.
2.3 Original Global Index Corporate Profile methodology development
A thorough consultative process was used to develop the ATNI company assessment methodology,
called the Corporate Profile.
Figure 2: Overview of the original Global Index Corporate Profile methodology
development process
1. Review of lessons learned from existing indexes and benchmarks
Before beginning the development of the ATNI methodology, an in-depth review of 32 existing peer
indexes, ratings and ranking systems was conducted to assess best practice and identify their best
elements. Among the elements reviewed were these initiatives’ origins, rationale, structure,
governance, communications strategies, approach to stakeholder engagement and consultation,
13and the structure and content of their methodologies. Key lessons learned were identified about
how to design an effective Index and Index organization – not only on how to design the
methodology.
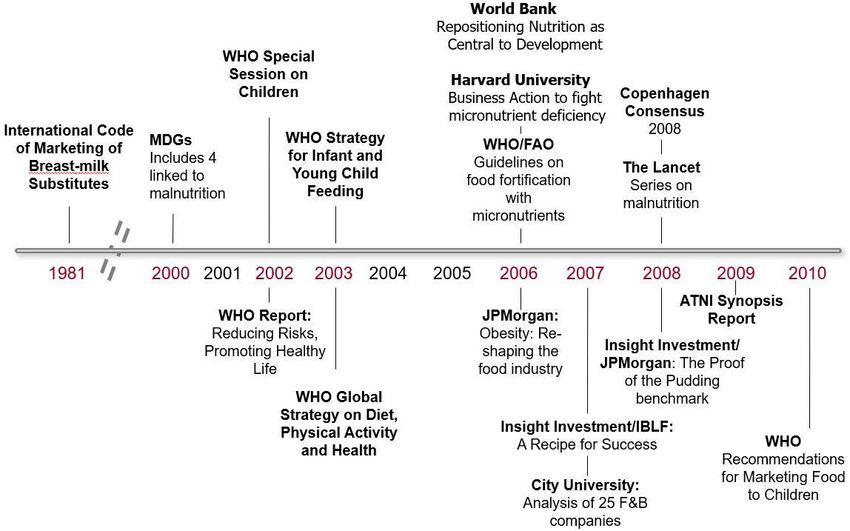
2. Catalog foundational documents
Extensive research was undertaken to identify all relevant international policies, norms and
guidelines relating to diets and nutrition, developed by, for example, the World Health Organization
(WHO), the Food and Agriculture Organization (FAO), and other pre-eminent international
organizations that provide guidance or recommendations on nutrition-related practices relevant to
the F&B industry. These were identified to provide the basis for the specification of indicators.4
Selected key documents available at the time are shown in Figure 3. This catalog is updated
regularly to reflect any new guidance or standards developed internationally by relevant UN bodies
and international organizations. ATNI’s methodologies are updated for each Index based on these
new developments.
In areas where no such international guidance existed, indicator specification was based on: reports
published by governments, NGOs, investors and industry associations; academic studies;
recommendations drawn from stakeholder consultations; examples of strong corporate practices,
and; advice from the ATNI Expert Group.
Figure 3: Foundations of the original Corporate Profile methodology
4
Indicators are the first-stage ‘unit’ of information that ATNI uses to measure companies’ performance in its
Indexes. These are defined as questions with pre-defined answer options, and organized in criteria and
categories, as described below. For more information on the process of weighting and scoring, please see the
section entitled ‘Structure of the methodologies and approach to scoring and ranking’, on page 20.
143. Iterative Corporate Profile methodology development process with the Expert Group
Extensive discussion with the ATNI Expert Group began in January 2011. This international group of
experts on diet, health and nutrition, and the F&B industry, met in full or as sub-groups over 20
times during a two-year period. The group provided advice on the scope and content of the
Corporate Profile methodology and shared its expertise on a range of topics, including international
policies and guidance on nutrition and their relevance to the various business functions of F&B
companies. This thorough development process yielded a draft methodology that was put to
stakeholder consultation in November 2011.
4. Stakeholder consultation
During November 2011 an extensive survey was posted on the ATNI website to solicit stakeholder
views on the proposed structure and content of the Corporate Profile methodology, with the goal of
strengthening the final methodology. While open for comment from any interested individual, the
project team reached out to a wide range of stakeholder groups, as outlined above. Experts from
both high- and low-income countries participated. Responses were analyzed to identify areas of
consensus and elements that raised concern. The ATNI Expert Group then convened to discuss the
feedback received and to help guide the ensuing revision process, which took place from December
2011 to February 2012.
5. Corporate Profile pilot using desk-based research
Using this revised Corporate Profile methodology, pilot research was conducted using publicly
available materials from a sample of companies to test the feasibility and relevance of the Corporate
Profile methodology. The sample of companies was selected to test the methodology against
variations in:
– type of company (multinational, local subsidiary of multinational, regional);
– form of company ownership (publicly listed, privately owned);
– company product lines (food and/or beverage); and
– Index (Global versus Spotlight).
This pilot research process led to additional revisions to the methodology. The final version of the
Corporate Profile was first used for the ATNI Global Index published in 2013.
All subsequent Global and Country Spotlight Index Corporate Profile methodologies were developed
similarly, following these steps:
– review of lessons learned (from previous iteration of the Index or from related Indexes);
– multi-stakeholder consultations (including companies);
– adaptation of the methodology with input from the Expert Group; and
– finalization of the methodology, publication and dissemination to companies selected for
inclusion in the Index.
152.4 Spotlight Index development
In 2012, the Index development team at GAIN conducted research in South Africa, Mexico and
India to determine whether Indexes modeled on the Global Indexes could be published for
individual countries, if adjustments were made to the Global Index methodology to reflect the local
legal, business and nutrition context.
Multi-stakeholder consultations were held in each of these three countries early in the development
process so that country-specific perspectives could be incorporated into the design of each Spotlight
Index and into the overall approach of ATNI. These consultations were particularly helpful in
understanding the local nutrition issues faced by the F&B industry and how companies interact with
various stakeholders in those countries.
South Africa: In May 2011, the Index development team held two roundtable discussions with
multi-stakeholder groups and one session with investment-community representatives in Cape
Town. It also held a roundtable discussion with investment-community representatives in
Johannesburg, as well as a series of individual conversations with various stakeholders.
India: In June 2011, the Index development team held two roundtable discussions in New Delhi.
One of these sessions was attended largely by representatives from NGOs, international
organizations, civil society groups and bilateral donors, while the second session consisted primarily
of F&B industry representatives, investors and industry consultants. One roundtable discussion was
also held in Mumbai with Indian stakeholders primarily from F&B companies.
Mexico: In July 2011, the Index development team held three multi-stakeholder meetings in
Mexico City. Two of these sessions were attended by F&B companies, civil society representatives
and academia, while the third session involved investors.
ATNI concluded that Spotlight Indexes could be a valid and valuable tool to help those countries to
address specific nutrition challenges. Having adjusted the methodology for each of the countries,
research was undertaken on the ten largest F&B manufacturers in each one, including a mix of
multinational and local companies. The results were not published, as they were intended only to be
preparatory research exercises for later Spotlight Indexes.
The first Spotlight Index for India was published in December 2016, after ATNI secured funding. A
second Spotlight Index for the United States was published in November 2018. ATNI aims to
publish Spotlight Indexes at regular intervals. Therefore, the India Spotlight Index 2020 will be the
second iteration.
162.5 Product Profile methodology development
In the Spotlight countries, in addition to assessing companies’ business practices, ATNI worked with
a team from the University of Oxford’s Nuffield Department of Population Health, led by Professor
Mike Rayner, to develop an approach to assessing the nutritional quality of each company’s
products. The methodology was developed over several months during 2011 with ATNI’s Expert
Group, of which Professor Rayner is also a member.
The research was undertaken in 2012 in seven stages:
1) selecting the nutrient profiling models used to analyze the nutritional quality of products;
2) specifying the population of foods and beverages to analyze;
3) sampling from this population of foods and beverages;
4) obtaining nutritional information for the sampled foods and beverages;
5) selecting product categories and sub-categories for analysis;
6) applying the nutrient profiling models; and
7) selecting the outputs for the analysis.
The teams assessed the nutritional quality of about half the products sold by the ten companies in
the Index pilots in each country, using a sampling frame to define a dataset of products
representative of the population. Products were assessed using two nutrient profiling models that
met the selection criteria agreed by the Expert Group. The full methodology and the results from
the Mexico study are available on request.
ATNI concluded that product assessments using an independent nutrient profiling model would be a
valuable element to include in each Index and identified several ways the methodology could be
improved. These were incorporated into the methodology used for the India Spotlight Index 2016,
the final report for which is available here, and the 2018 Global Index Product Profile, described
later, which is available here.
2.6 BMS marketing methodology development
A specific element of most Access to Nutrition Indexes is an assessment of major baby-food
manufacturers’ marketing policies, management systems, disclosure, and of their practices within
specific markets, using an additional, comprehensive methodology. ATNI began developing the
methodology for this element of the Indexes in 2014, again through extensive consultation with civil
society organizations, experts in the field and baby-food companies. The first BMS marketing
assessment using this methodology was included in the second Global Index published in 2016 and
in the India Spotlight Index published later that year. The third Global Index published in 2018 and
U.S. Spotlight Index 2018 also included BMS marketing assessments. The India Spotlight Index
2020 will not include a BMS marketing assessment. The 2016 BMS marketing assessment in India
showed the high standards of the Indian Infant Milk Substitutes (IMS) Act and relatively good
compliance by companies. ATNI has limited resources for on-the-ground assessment of BMS
marketing practices and aims to cover different markets for the next assessments.
173. Key Index elements and scope
This section describes the scope and purpose of the main elements of the Access to Nutrition
Indexes, as well as topics that are not included because they are beyond the scope of the Indexes.
3.1 Key Index elements
a) The Corporate Profile
Companies’ policies, practices and disclosure related to promoting good nutrition for all – i.e.
preventing and tackling obesity and diet-related chronic diseases, and undernutrition and
micronutrient deficiencies – are assessed using the Corporate Profile methodology. It reflects the
efforts companies have made to: incorporate nutrition into their overall corporate strategy, and
their governance and management systems; improve the nutritional quality of product portfolios
and develop healthy products; improve their pricing and distribution of healthy products; support
consumers to eat a healthy diet and live healthy lives; label their products effectively; market their
products responsibly; and engage with policymakers and their stakeholders.
The Corporate Profile was the first element of ranking developed by ATNI, to which most of the
methodology described in this document refers. Since the 2013 Global Index, several changes have
been made to the details of the methodology without altering the basic structure. ATNI consults
with stakeholders and the ATNI Expert Group periodically, to receive feedback and make
modifications to ATNI Indexes.
b) The Product Profile
An objective assessment of the nutritional quality of companies’ product portfolios was previously
presented in a separate Product Profile section. As of this assessment it is performed as part of the
product category assessment in the Corporate Profile that captures companies’ efforts towards
formulating and reformulating their products. The scores and ranking of the Product Profile provide
one of the independent assessments on the performance of companies in the Indexes and as of this
assessment contribute to the overall Corporate Profile scoring and ranking with a relatively high
weighting. It principally assesses how healthy companies’ products are. In other words, it analyzes
the nutritional quality of the products they sell, which is determined by the levels of fat, salt, sugar,
fruit, vegetables and other components.
The Product Profile also provides an overview of the ‘healthiness’ of products within categories and
the extent to which companies’ products meet nutritional standards so they are permitted to be
marketed to children. It provides a baseline to measure the improvements companies make with
18the formulation of their products. It also offers insights into the proportion of healthy products in a
company’s portfolio. A full description of the methodology used for the Product Profile, as applied
for the Global Index 2018, is available here.
c) The breast-milk substitutes (BMS) marketing assessment
ATNI Indexes can include an assessment of the marketing practices of major baby-food companies,
presented in the BMS marketing sub-ranking. This element is not included in the India Spotlight
Index 2020, but further information and the methodology used for such assessments, as applied for
the Global Index 2018, is available here.
3.2 Topics beyond the scope of all Indexes
The Access to Nutrition Indexes focus on F&B manufacturers’ efforts to improve the diets, and
thereby the health, of consumers. Certain topics are beyond the scope of the Indexes:
Products intended to address acute undernutrition or other special nutrition needs
The Indexes are not designed to take account of companies’ activities targeting people with special
nutritional or dietary needs such as athletes and people whose dietary/ therapeutic feeding
requirements are supervised by healthcare professionals.
Products that are a part of a formal weight-management program
If companies rated by the Indexes sell products intended to be a part of (or are marketed/branded
in association with) a formal weight-management program, their activities related to these products
are not included in the assessment, as there is currently no international consensus on the
appropriate nutritional standards for such products.
Issues not related to nutrition and health
Other issues that are related to the social and environmental impact of F&B companies are largely
outside the scope of ATNI Indexes. Some of these issues can be included in country-specific
Spotlight Indexes if local stakeholders and reviewers and the ATNI international Expert Group think
it is relevant. They include:5
– water-management practices;
– environmental sustainability, including sourcing of ingredients;
– impact on climate change;
– fair treatment of workers and communities; and
– crop breeding (e.g. hybridization and genetic modification).
5
Food safety is assessed in the India Spotlight Index 2020 as the Index is adapted to the local regulatory,
business, nutrition and health context of India. However, this is not assessed in other ATNI Indexes.
194. Structure of the methodologies and
approach to scoring and ranking
Each of the main ATNI Index elements has a different structure and methodology, and generates
the final score using different scoring and weighting systems. This section explains those aspects of
the Corporate Profile and Product Profile, and how they are combined to generate one score and
rank as of 2020.
4.1 Corporate Profile methodology
The overarching concept of the Corporate Profile methodology is that it inherently defines what
‘ideal performance’ is for the companies being assessed, drawn from all the foundational documents
and expert knowledge of good practice. In other words, were a company to have the policies,
commitment, objectives, targets, management systems, practices and disclosure described by the
wording for the top-level performance of each indicator, it would score 10 on each indicator, and
therefore would score 100% for each criterion and subsequently on each category, and achieve an
Index score of 10 out of 10.
The Corporate Profile methodology is organized into three sections, each reflecting a distinct aspect
of corporate activity: 1) Governance; 2) Delivering products; 3) Influencing consumer choice and
behavior.
Each of these sections is linked to:
– Categories: Seven broad topic areas or categories (A–G) relevant to companies’
nutrition-related practices. These categories do not change for any Index.
– Criteria: More detailed criteria are defined within each of the categories and are
adapted for each Index; there is no fixed number of criteria.
– Indicators: Indicators are the first-stage ‘unit’ of information that ATNI uses to
measure companies’ performance in its Indexes. These are defined as questions with
predefined answer options (the full list of indicators is provided in Appendix I). There are
three types of indicators: those related to companies’ commitments, practices and
disclosure.
While the weightings of the three indicator types are the same for all Indexes, and criteria within
categories are always equally weighted, the weighting of the categories varies between the Global
Indexes and the Spotlight Indexes, based on the local context and advice from different
stakeholders and expert reviewers consulted for each Index. As of 2020, all criteria have identical
20weight within a category except for Category B, which includes the Product Profile score. The
specific methodology of the Product Profile is described in section 4.2 of this chapter.
Figure 4 summarizes the general Corporate Profile methodology structure as of 2020 Indexes,
which includes the Product Profile.6
Figure 4: Topic areas of the new Corporate Profile
Seven topic areas (categories)
A. Governance B. Products C. Accessibility D. Marketing E. Lifestyles F. Labeling G. Engagement
A1. Corporate B1. Product C1. Product D1. Marketing E1. Supporting F1. Product G1. Engaging and
Commitment (25%)
nutrition strategy Profile results pricing policy: General employee health labeling influencing
Examples of criteria within categories
A2. Nutrition B2. Product C2. Product aspects of and wellness F2: Nutrition governments and
governance and formulation distribution responsible E2. Supporting and health policymakers
management B3. Defining marketing breastfeeding claims G2. Stakeholder
Three indicator types
systems healthy and D2. Marketing mothers at work engagement and
A3. Quality of appropriate policy: Specific E3. Supporting partnerships
reporting products arrangements consumer-
regarding oriented healthy
Performance (50%)
responsible eating and
marketing to active lifestyle
children and programs
teens
D3. Auditing
and compliance
with policy
Disclosure (25%)
Governance Delivering products Influencing consumer choice and behavior
Three sections
The Corporate Profile methodology for each Index follows the same approach to scoring and rating,
with variations on the number of indicators and the criteria. To generate each company’s overall
Corporate Profile score and ranking, the following process is used:
– Indicator level: Companies are assessed on the indicators within each criterion, using pre-
defined answer options. The top performance level on any indicator is a score of 10 points,
with lower scores awarded for lower levels of performance. Many indicators allow the
selection of one answer option, using a decreasing sliding scoring scale, e.g. if there are
three performance levels possible (e.g. the company has a policy in place, the company is
currently developing a policy, the company does not have a policy), the score for the top
level of performance is 10, the second level is 5, the third level is 2.5, and no information/no
activity is 0. These types of indicators may have multiple answer options with the same
6
Figure 4 shows the general structure of the Corporate Profile that includes the Product Profile without
describing the detailed changes that have been made for the India Spotlight Index 2020. The detailed
changes are described in chapters 5, 6 and 7.
21number of points for information purposes. Other types of indicators allow the selection of
multiple answer options that typically carry an equal number of points that add up to the
total maximum score of 10 points per indicator. If certain indicators are not applicable to the
company being assessed, it will be removed from the scoring algorithm.
Two types of multipliers are applied to some indicators; for some, both are applied:
Healthy multiplier: Many indicators assess what companies are doing in relation to
‘healthy foods.’ However, there is no universally recognized definition of ‘healthy foods.’
Each company uses a different definition. ATNI cannot verify whether products that meet a
company’s own healthy criteria are truly healthy (in the context of the Corporate Profile –
though this is precisely the purpose of the Product Profile, described later). As a proxy, ATNI
uses the score from B3, which assesses the rigor of the nutrient profiling system. A healthy
multiplier is applied between 0.5 (adjusting the underlying indicator score) and 1 (having no
effect on the underlying indicator score), based on the B3 score, thereby giving a higher
score to companies with a robust definition of healthy products.7
Geographic multiplier: In the Global Indexes this is applied to appropriate indicators to
reflect whether companies apply the same policies and practices across all markets of
operation, only in selected regions or only in their home markets. Similar to the healthy
multiplier, it results in higher scores (by a factor of two) if the activities being measured are
applied globally than if the activities are applied only in the company’s home market.
Geographic multipliers are not applied in the India or other Spotlight Indexes.
– Criterion level: Within each criterion, the score is calculated by totaling the ‘raw’ score for
commitments, and multiplying those with a weight of 25%, doing the same for the
performance indicators, though they are weighted 50%, and the same for the disclosure
indicators, also weighted at 25%. Performance is given twice the weight of Commitment and
Disclosure to reinforce the importance of turning commitments into practice. Adding up the
weighted scores for each of these three indicator types generates each company’s score for
each criterion.
– Category level: Each criterion is weighted equally within each category; therefore, a
company’s score for a category is the average score of the criteria within that category.
Category B is an exception in this regard. By integrating the Product Profile score into
Category B in the India Spotlight Index 2020 (and future Indexes), Criterion B1 has a higher
weight (20%) than Criteria B2 (7.5%) and B3 (7.5%), adding up to the total weight of 35%
for Category B.
– Final score: The final category weightings are then applied. The result is the company’s
Corporate Profile score, out of a maximum of 10.
7
A new technical implementation of the healthy multiplier has been implemented in the India Spotlight Index
2020, ranging in value between 0.5 and 1, to improve the approach to scoring and weighting individual
indicators. In previous Indexes the value ranged between 1 and 2.
22The results will be presented as a ranking in the main report, showing companies’ overall Corporate
Profile score and their score for each category. More detailed results for each category will be
published separately after the main report.
Figure 5: Corporate Profile theoretical framework
The Corporate Profile aims to track the contribution of the
food and beverage industry to improving diets and
addressing the global nutrition challenges of overweight
and obesity, diet-related diseases and undernutrition
High-level aim:
W e i g h t i n g s t e p s ( ba s e d Qualitative assessment of
on expert judgement ): companies’ overall nutrition
performance
Category-specific
Divided into:
weights
Categories
(topic areas)
Equally-weighted
Criteria within
Categories Further divided into:
Criteria
(subdivisions)
Fixed score per
indicator :
Commitment (1x weight)
Performance (2x weight) Made concrete into:
Disclosure (1x weight)
Indicators
The Corporate Profile produces a score (between 0-10
points) and a ranking amongst food and beverage
manufacturers that are assessed
It is important to note that Criterion B2 (Product formulation), within Category B Products of the
Section ‘Delivering products’, assesses companies’ own commitments and targets to improve the
nutritional quality of their products and invest in improving the healthiness of their portfolios. This is
not the same as the Product Profile, which is an objective assessment of nutritional quality based on
the Health Star Rating (HSR) system and is explained below. For the first time in an Index, in the
India Spotlight Index 2020, the results of the Product Profile are integrated as Criterion B1 into
Category B.
234.2 Product Profile methodology
The Product Profile assessment adds an objective assessment of the nutritional quality of
companies’ product portfolios, for each company’s best-selling categories in the geographic area
covered by the Index. It therefore complements the qualitative product-related criteria in the
Corporate Profile, i.e. nutrition formulation and nutrition profiling. Prior to the India Spotlight Index
2020, the Product Profile had been presented as a separate ranking and score. In the India
Spotlight Index 2020, the results of the Product Profile are presented as a sub-analysis with the
scores integrated into Category B, resulting in one overall Corporate Profile score and ranking.
To determine the nutritional quality of products, ATNI uses two nutrient profiling systems (NPSs)8
that meet the qualitative criteria developed by ATNI ’s Expert Group,9 from research of many such
systems collated for WHO:
– The Health Star Rating (HSR) nutrient profiling system, which is used in Australia, but
applicable in any market, to determine how healthy each product is. Products are rated
between 0.5 stars (least healthy) to 5 stars (most healthy). Any product that scores 3.5 or
above is considered healthy.
– A WHO Regional Office Nutrient Profile Model to identify which products are suitable to be
marketed to children.
The methodology used for the Product Profile assessment was developed in partnership with the
Food Policy Division of The George Institute for Global Health (TGI), based at the University of
Sydney, the organization that ATNI commissions to undertake these studies. It draws on the
experience of the pilot studies outlined earlier, undertaken by Professor Mike Rayner of the
University of Oxford. Professor Rayner is a member of the ATNI Expert Group and advises the TGI
research team on their Product Profile methodology.
A full description of the methodology used to assess nine markets for the 2018 Global Access to
Nutrition Index, is available in TGI’s report of that study. The same two NPSs were used for all
8 Nutrient profiling is ‘The science of classifying or ranking foods according to their nutritional composition for reasons
related to preventing disease and promoting health.’ The first systems were developed over 20 years ago for voluntary
food labeling schemes. At around the same time, governments and regulatory agencies began to use them to set
standards for the use of nutrition and health claims, and they have been used – or proposed for use – by governments to
regulate the advertising of foods to children. Retailers, media outlets and others have also developed proprietary systems
to help guide decision-making on product formulation, labeling, use of ‘healthy’ logos and marketing to children. More
than 100 NPSs are known to be in use around the world today: World Health Organization (2010). Nutrient Profiling
(available at: http://www.who.int/nutrition/topics/profiling/en/).
9 The criteria used to select these two systems are:
– developed with appropriate stakeholder consultation;
– covered the majority of categories of processed food and beverage products;
– took into account both positive and negative nutrients;
– was not designed solely to address school foods, given the requirement to assess foods in the general market;
– well-validated with results published in the peer-reviewed literature demonstrating that the models produce
internally consistent classifications of ‘healthy’ and ‘unhealthy’ foods, consistent with general nutrition principles;
– enabled differentiation of nutritional quality within and between categories;
– algorithm in the public domain so as to be able to access and apply it; and
– able to generate meaningful results across all countries.
24countries for consistency, i.e. to be able to compare results across countries. A summary of the
approach is outlined in Figure 6, and the description below.
Figure 6: Product Profile theoretical framework
– Food category selection: For each of the companies assessed, ATNI identifies a
maximum of five of the companies’ best-selling categories in which the companies sell
products (data extracted from Euromonitor International’s 2018 industry publications of:
Packaged Food, Hot Drinks and Soft Drinks). Products eligible for inclusion are all packaged
foods and non-alcoholic beverages manufactured by the included companies available for
purchase. A food or beverage is considered as a unique item, used in Product Profile
calculations, based upon the brand name and description irrespective of serving size and
packaging (i.e. a specific brand of cola sold in 330ml cans is considered to be the same food
item as the same specific brand of cola sold in 600ml bottles).
– Nutrient content data: TGI’s FoodSwitch database has been the main source of product
and nutrient content data in ATNI’s previous Product Profile assessments. Nutrient content
information was extracted from photographs of product packaging and entered into TGI’s
FoodSwitch databases or similar databases to which TGI had access via agreement with
their developers. New for the India Spotlight Index 2020, product and nutrient content data
from Innova Market Insights (based in Arnhem, the Netherlands) will be combined with
TGI’s FoodSwitch database to use the most comprehensive, up-to-date information.
– Research process: The companies will be provided with their product lists and nutrient
content, from the database, and offered an opportunity to make corrections or additions.
– Calculation of HSR: The HSR is first calculated for each product. These scores are then
aggregated by category, adding up the HSRs for each product in the category and dividing
the result by the number of products in the category to generate a mean HSR for that
category. The company’s non-sales-weighted average HSR for the portfolio is calculated by
adding up the HSRs of all its products and dividing that figure by the total number of
25You can also read