INDIA SOLAR HEAT FOR INDUSTRY - SOLAR HEAT INDUSTRY - Solar Payback
←
→
Page content transcription
If your browser does not render page correctly, please read the page content below
PROFITABILITY

COMPETITIVENESS

AR
T
        SOLAR HEAT FOR INDUSTRY
STRY                              INDIA
                                    Solar
                                    Payback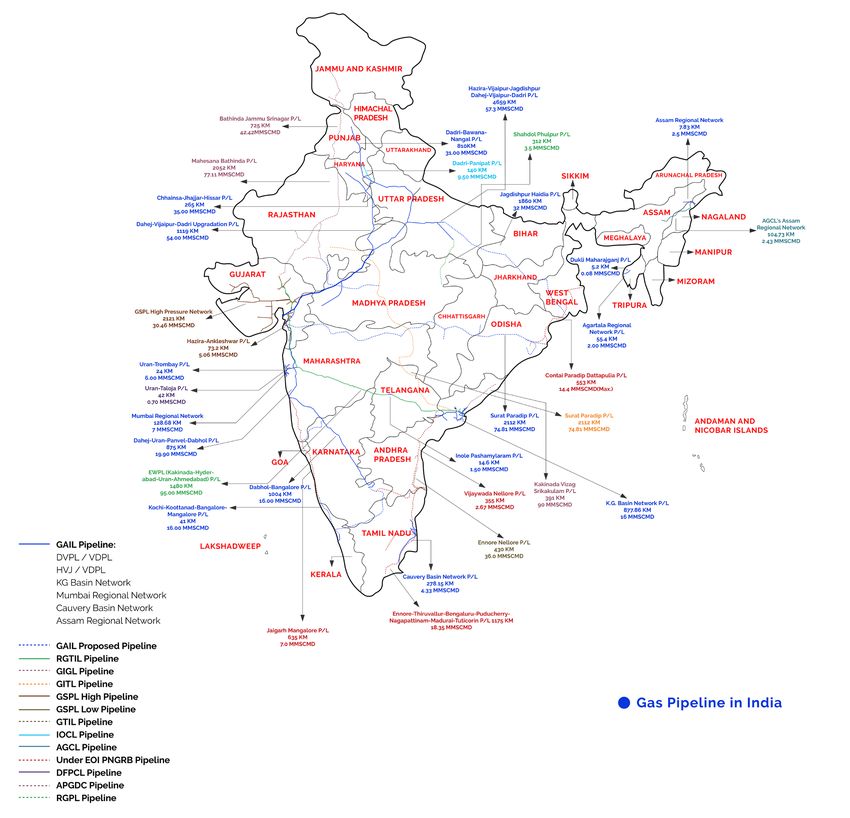
CONTENTS
ACKNOWLEDGEMENT AND AUTHORS.................................................. 2
        About Solar Payback................................................................................... 2

EXECUTIVE SUMMARY.................................................................................................3

 1. INTRODUCTION .....................................................................................................4

 2. ECONOMIC AND INDUSTRIAL POLICY IN INDIA............................... 6
        2.1 Macro-Economic Outlook....................................................................... 7
        2.2 Energy Policy in India............................................................................. 8
        2.3 Renewable Energy in the Institutional Setting............................................. 15
        2.4 The Economic and Political Situation on Energy Use in India........................ 17

 3. SOLAR THERMAL FOR INDUSTRIAL PROCESSES........................... 18
        3.1 Solar Thermal Technologies for Industrial Processes................................... 19
        3.2 Temperature Ranges of SHIP . . ................................................................ 22
        3.3 Solar Thermal Industry in India . . ............................................................... 23
        3.4 The Indian Solar Thermal Market.............................................................. 24
        3.5 Limits in the Spread of Solar Thermal Usage in India.. ................................. 28
        3.6 Conclusions ........................................................................................ 28

 4. SOLAR THERMAL ENERGY FOR INDUSTRIES IN INDIA .................. 29
        4.1 Relevant Industrial Sectors.. .................................................................... 30
        4.2 Conclusions about the Industry Analysis for India....................................... 46

 5. PROJECT DEVELOPMENT OF A SHIP PLANT. . ................................. 50
        5.1 General Process of the SHIP Plant Design . . ............................................... 48
        5.2 Structure of a SHIP Project in India.......................................................... 52
        5.3 Process Heat System Integration for India................................................. 54

 6. ECONOMIC PROFITABILITY OF SHIP SYSTEMS............................... 55
        6.1 Methodological Considerations. . .............................................................. 56
        6.2 Economic Calculations of Case Studies under Certain Frame Conditions....... 59
        6.3 Conclusions ........................................................................................ 64

 7. CONCLUSIONS................................................................................ 65
        7.1 Recommendations for investors and the solar industry ............................... 66

ABBREVIATIONS...........................................................................................................69

                                                                                                                             CONTENTS I   1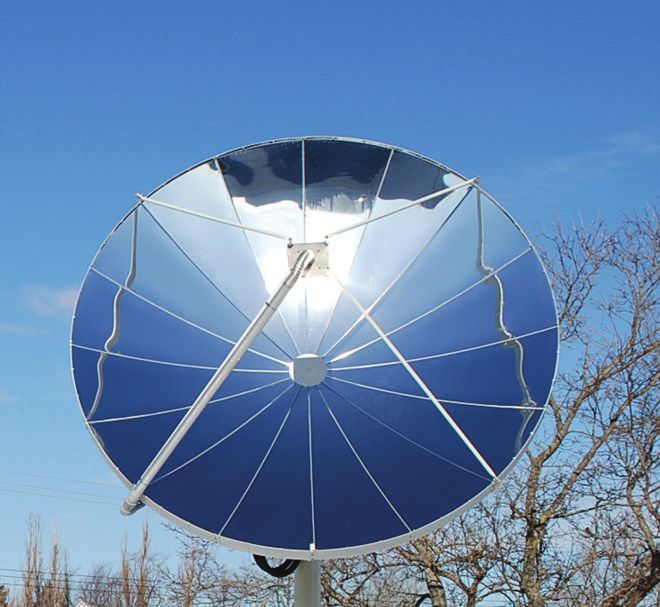
ACKNOWLEDGEMENT
       AND AUTHORS
       Editors:
       Jan Knaack, German Solar Association (BSW)
       Jaideep Malaviya, Solar Thermal Federation of India (STFI)

       Acknowledgements: Harshad Phadnis, Indo-German Chamber of Commerce (AHK),
       Dipti Kanitkar (Indo-German Chamber of Commerce, AHK).

       Cover images: Tigi, Modulo Solar, Silke Anders / Industrial Solar, Jaideep Malaviya,
       Inventive Power, Chinese Solar Thermal Industry Federation / Sun & Wind Energy

       About Solar Payback
       •   The objective of the three-year Solar Payback project (from October 2016 to December
           2020) is to promote the use of Solar Heat for Industrial Processes (SHIP) in four countries
           – South Africa, India, Mexico and Brazil.
       •   This project is financed by the International Climate Initiative (IKI).
       •   The Federal Ministry for Environment, Nature Conservation, and Nuclear Safety supports
           this initiative on the basis of a decision adopted by the German Bundestag (German
           parliament).
       •   The project raises awareness of the technical and economic potential of SHIP
           technologies through clear and transparent information about the costs and benefits of
           SHIP applications, and helps to create reference systems.
       •   Solar Payback also collaborates with financial institutions to develop models that assist
           different actors and investors in accessing financing.
       •   For more information, please consult www.solar-payback.com

       Project Coordinator

                              BSW - Bundesverband Solarwirtschaft e.V.
                              – German Solar Association –
                              Lietzenburger Straße 53
                              10719 Berlin
                              Germany

2 I SOLAR HEAT FOR INDUSTRY: INDIA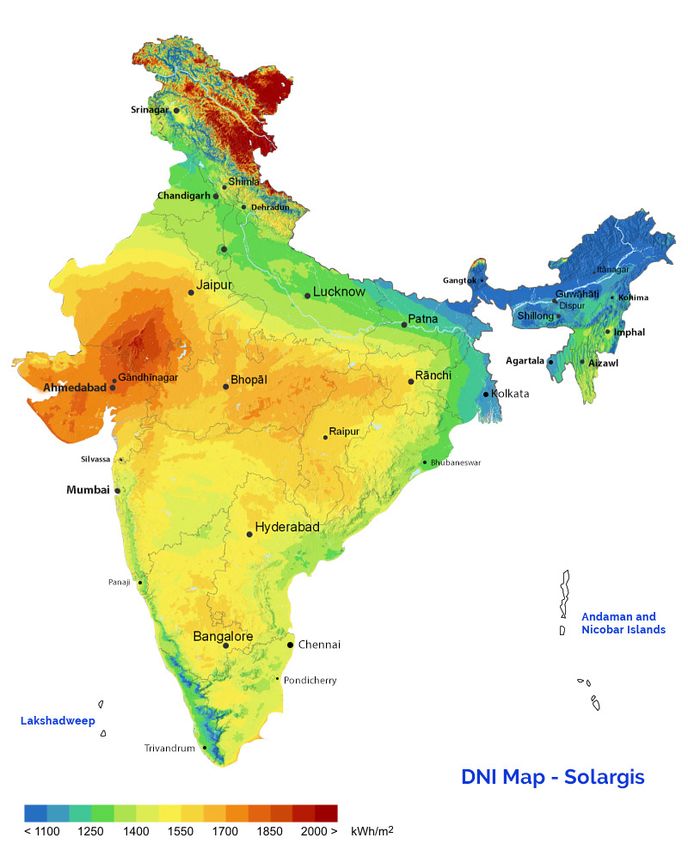
EXECUTIVE SUMMARY

Energy efficiency is an important accompaniment to renewable energy. Energy savings should
be realised before implementing new-generation capacities. India’s industrial sectors account
for more than 50% of the country’s energy needs, and are projected to grow massively during
the next decades. So far, much of this energy has to be imported, whether oil and gas or high-
quality coal, and a significant share of it goes towards fulfilling heating needs. However, many
industries in India use only low to medium temperatures of below 400°C, which Solar Heat for
Industrial Processes (SHIP) can easily provide. In this context, industries of particular importance
are food and beverages and dairy, automotive, textiles, chemicals, and pharmaceuticals, where
India is either a global leader or among the top. Incidentally, these industries are widely spread
around the country and well established in regions with excellent insolation.

A mix of sources currently covers India’s energy needs, including electricity, petroleum
products as well as coal and biomass. Sources such as electricity and petroleum are often
more expensive than SHIP, which makes a good potential business case for the latter. This is
especially true in states with high irradiation, such as in the north western and central states,
which can be supplied on a decentralised level.

While India has an already established industry of solar thermal companies and suppliers that
have installed more than 78,000 m² of plants for SHIP, different solar technologies require quite
a lot of space, which is often scarce at many industrial plants. In addition, these technologies
have to be integrated into existing processes. In each case, such an integration requires careful
analysis of technical and economic potential. For this, the Solar Payback Project illustrates
market niches and applications in identified industries and provides a methodology as a basic
tool to facilitate the economic calculation of SHIP projects.

                                                                                     EXECUTIVE SUMMARY I   3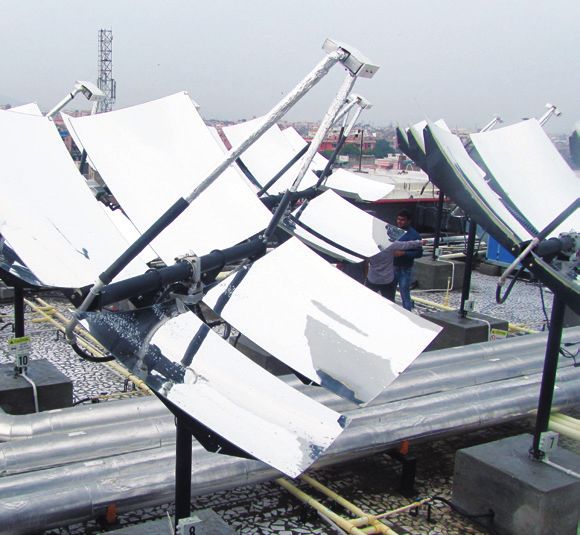
CHAPTER 1
       INTRODUCTION

4 I SOLAR HEAT FOR INDUSTRY: INDIA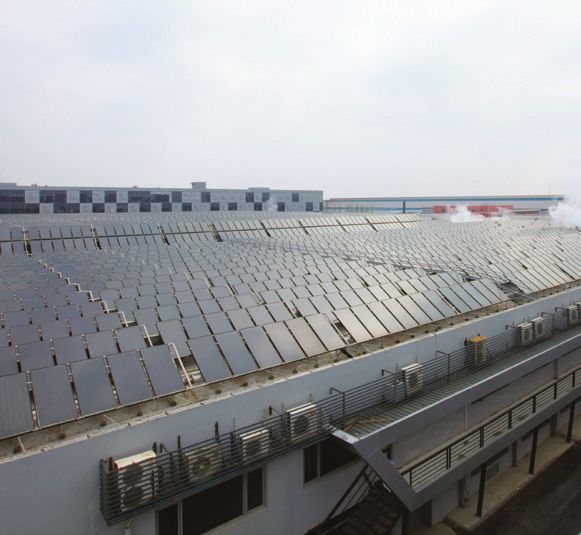
India’s energy consumption, heavily fossil-fuel dependent, goes hand-in-hand with the
country’s huge industrial demand for heat energy. However, this demand has limited
representation from the excellent insolation that India receives, which in annual global
horizontal irradiation (GHI) terms has a variation of 1,600-2,000 kWh/m² for almost 250-
300 days a year. 1 The direct normal irradiance (DNI) value averages 5.5 kWh/m²/day due
to India’s geographic position in the Equatorial Sun Belt of the earth 2 – which takes the
country’s equivalent energy potential to about 6,000 million GWh per year. Though this
resource potential is the highest in India’s north-western regions and desert wastelands,
the central and southern industrialized states also receive fairly large amounts of direct as
well as diffused radiation. Thus, using solar energy for heating processes at the industrial
scale appears to be a logical solution.

To push the adoption of solar technologies, the Government of India, with its Ministry of New
and Renewable Energy (MNRE), has launched the National Solar Mission (NSM) in 2010
and rolled out policy initiatives to incentivize the use of renewable energy technologies.
Since 2014, this mission has highly ambitious targets for scaling up the implementation of
solar technologies – to 100 GW out of the 175 GW total renewable energy capacity that
India would have by 2022 – and to increase the installed solar thermal collector area by 20
million square metres (m²), also by 2022.

While conventional energy production still suffers from traditional limiting factors such as
raw-material availability and import dependency, the new renewable energy sector has
leapfrogged technologically and seen capacity additions. With industries of all sizes looking
at energy transitions, solar thermal technologies are not only perceived to be appropriate,
but also feasible for heating applications. Technologically, India has been an early adopter
of solar thermal systems, with many plants having proven their life and cost efficiencies.
This study explores the prevailing market conditions and factors that can support the
spread of solar thermal technologies in India.

Solar Heating for Industrial Process (SHIP) systems can be significant contributors to
optimization of heat demand in process applications and meaningfully reduce greenhouse
gas emissions (GHGs). One of the limiting factors for SHIP is that every installation
needs detailed engineering, techno-commercial study and specialized installation, unlike
for solar photovoltaic (PV), which is comparatively plug-and-play. Highly effective and
rapidly scalable stationary and concentrator solar thermal technologies, such as parabolic
trough and compound parabolic concentrator, are gaining momentum. Th i s study, with a
technological, commercial, and policy overview, aims to explore a variety of aspects that
either favour or limit the large-scale adoption of SHIP.

1   GHI is the total amount of shortwave radiation received from above by a surface horizontal to the ground
2   DNI is the amount of solar radiation received per unit area by a surface that is always held perpendicular (or normal) to the rays that
    come in a straight line from the direction of the sun at its current position in the sky

                                                                                                                CHAPTER 1: INTRODUCTION       I5
CHAPTER 2
       ECONOMIC AND INDUSTRIAL
       POLICY IN INDIA

6 I SOLAR HEAT FOR INDUSTRY: INDIA
India’s Gross Domestic Product (GDP) has seen tremendous growth since 1990 at 6.0-7.5%
annually. Foreign direct investments have crossed USD 40 billion and trade barriers for economic
and industrial development have diminished compared to 25 years ago.

The most important industries in India today are agriculture, bulk processing, manufacturing
and the services. While agriculture constitutes all aspects of food production, processing and
food security, the large manufacturing industry base constitutes of sectors such as cement,
steel, automotive, textile, chemicals, and fertilizers.

Since India is a market-based economy for the most part, pricing of commodities is driven by
non-linear demand and supply. Both state and central government public sector undertakings
(PSUs) own bulk-processing industries. India also has public-private partnership ventures,
including international joint ventures (JVs). The size of these industries varies from very small
to very large. Most of these industries are resource intensive and have often faced obstacles
in matching energy supply to demand because of availability, quality, and regulation-related
issues. Recently, the government has pushed for large-scale infrastructure development.

Energy supply is the mainstay for the economy. In most sectors, coal, oil and natural gas
have the highest penetration. Due to an overdependence on imported fossil fuel over a long
period, recently, there has been a renewed impetus on deregulation of coal and for indigenous
discovery of natural gas in the country.

2.1 Macro-Economic Outlook

The Indian economy moves based on a variety of factors such as political dispensation,
international oil pricing, domestic inflation, and global economic conditions. As of 2018, India’s
GDP was measured at USD 2.716 trillion in nominal terms with an annual GDP growth of 7%. 3
Rising inflation, a challenge in the past 7-10 years, has seen a sharp decline of late. Figure
1 and Figure 2 depict important economic parameters, corresponding US dollar values, and
provide an outlook.

8.50%
                                   8.17%
                        8.00%
8.00%
                                                                                    7.74% 7.73% 7.74% 7.74%

              7.41%                                                       7.49%
7.50%
                                                                 7.26%
                                            7.17%
                                                       7.05%
7.00%

6.50%

6.00%
              2014      2015      2016      2017      2018 2019P 2020P 2021P 2022P 2023P 2024P

FIGURE 1: ECONOMIC DEVELOPMENT INDICATORS IN INDIA, ESTIMATIONS, AND OUTLOOK
Source 1: Statista.com 4

3 https://www.statista.com/statistics/263771/gross-domestic-product-gdp-in-india/
4 https://www.statista.com/statistics/263771/gross-domestic-product-gdp-in-india/

                                                                         CHAPTER 2: ECONOMIC AND INDUSTRIAL POLICY IN INDIA I   7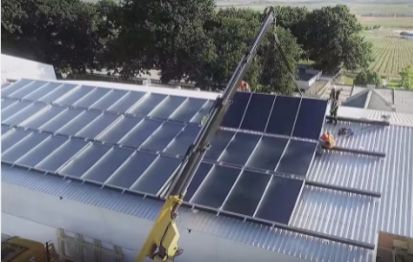
5,000.00
           4,500.00
           4,000.00
           3,500.00
           3,000.00
           2,500.00
           2,000.00
           1,500.00
           1,000.00
             500.00
                0.00
                           2014      2015    2016      2017      2018 2019P 2020P 2021P 2022P 2023P 2024P

       FIGURE 2: GROSS DOMESTIC PRODUCT (GDP) IN INDIA (IN BILLION USD)
       Source 2: Statista.com 5

       Economic growth continues and has reached high levels. Overall economic indicators for India
       look promising, as visible in Table 1.

           TABLE 1: Important Macroeconomic Indicators for India 2018

           Parameter/Criteria                         Definition                                                     Value (2018)

           GDP (current US$)                          The total value of goods produced and services provided        2,71 trillion
                                                      in the country during one year

           GNI, PPP (current international $)         PPP GNI (formerly PPP GNP) is the gross national income        7.78 billion
                                                      (GNI) converted to USD using purchasing power parity
                                                      rates

           GDP growth (annual %)                      Annual growth rate of the GDP in per cent at market            7.0 %
                                                      prices, based on constant local currency

           Inflation, GDP deflator (annual %)         Inflation as measured by the annual growth rate of the         3.8 %
                                                      GDP implicit deflator shows the rate of price change in the
                                                      economy as a whole

           Domestic credit provided by financial      Domestic credit provided by the financial sector includes      76.14 %
           sector (% of GDP)                          all credit to various sectors on a gross basis, with the
                                                      exception of credit to the central government

           Foreign direct investment, net inflows     Foreign direct investment refers to direct investment equity   40 billion
           (BoP, current US$)                         flows in the reporting economy

       Source 3: The World Bank, OECD, Reserve Bank of India

       2.2 Energy Policy in India

       Along with economic growth, India’s energy demand has grown steadily in the past decade.
       Figure 3 shows that India’s energy consumption is set to grow by around 4.2% annually in
       the coming two decades, faster than all major economies of the world (IEA 2015, 6 BP 2018).
       India’s consumption growth of fossil fuels will be the highest by 2035, and it will surpass China
       as the largest growth market for energy in volume terms by 2030. The country remains import
       dependent, despite an increase in production and exploration of conventional and renewable
       fuel sources. The role of renewable energies in limiting fuel imports will assume increasing
       importance, even as conventional energy sources continue to play a large part.

       5      https://www.statista.com/statistics/263771/gross-domestic-product-gdp-in-india/
       6      http://petroleum.nic.in/

8 I SOLAR HEAT FOR INDUSTRY: INDIA
100%
90%
80%
70%
60%
50%
40%
30%
20%
10%
0%
2017-18(P)
2016=17
2008-09
2009-10
2010-11
2011-12
2012-13
2013-14
2014-15
2015-16
Coal Lignite Crude Oil Natural Gas Electricity
FIGURE 3: GROWTH OF ENERGY DEMAND FROM 2008 TO 2018 IN INDIA IN PETAJOULES
Source 4: Ministry for Statistics 2019 7
2.2.1 Fossil Fuel Resources in India
India’s Ministry of Petroleum and Natural Gas 8 estimated hydrocarbon resources in India at
about 28.1 billion tonnes (oil and oil equivalent of gas). So far, close to 50% of resources
could be covered through exploration. The estimated Coal Bed Methane (CBM) resources are
at 2,600 billion Cubic Meters (BCM) or 91.8 trillion cubic feet (TCF), spread over 11 states in
the country. The recoverable shale gas reserves are estimated to be 500-2,000 trillion cubic
meters.
TABLE 2: Estimated conventional energy reserves
Energy source Reserves as of 31 March 2018
Coal 319.20 billion tonnes
Lignite 45.66 billion tonnes
Crude oil 594.49 million tonnes
Natural gas 1,339.57 billion m³
Coal bed methane 2,600 billion m²
Source 5: Ministry of Statistics, 2018 9
India remains a net importer of coal, crude oil, petroleum products and natural gas. In the
electricity market, from being from an importer over the past 10 years as indicated in Figure 4,
is has switched to becoming a significant exporter.
7 http://www.mospi.gov.in/sites/default/files/publication_reports/Energy%20Statistics%202019-finall.pdf
8 http://petroleum.nic.in/
9 http://www.mospi.gov.in/sites/default/files/publication_reports/Energy%20Statistics%202019-finall.pdf
CHAPTER 2: ECONOMIC AND INDUSTRIAL POLICY IN INDIA I 96,000
Coal
5,000 Crude Oil
4,000 Petroleum Products
Natural Gas (Billion m3)
3,000
Electricity (GWh)
2,000
1,000
0
2008-09 2009-10 2010-11 2011-12 2012-13 2013-14 2014-15 2015-16
-1,000
2016-17
-2,000 2017-18
-3,000
FIGURE 4: NET OIL AND COAL IMPORTS FROM 2008 TO 2018
Source 6: Ministry of Statistics, 2019 10
2.2.2 Sectoral Energy Demand and Growth
According to the concentrating solar thermal (CST) Roadmap by GEF-UNIDO, 57% of India’s
final energy consumption was in the industry segment in 2017. 11 The Draft National Energy
Policy 12 by NITI Aayog projects energy consumption between 2012 and 2040 under alternative
scenarios, with respect to efforts towards achieving greater energy efficiency and conservation.
Table 3 shows these estimates under a range of two sets of assumptions: a baseline effort and
a significantly more ambitious effort. The baseline scenario (BAU) generates the higher demand
bound and the ambitious scenario is represented by the lower bound. Industrial energy will
range between 48% and 55% of all energy demand between 2012 and 2040. In the ambitious
scenario, industrial energy consumption ends up being 17% below one of the baseline cases,
illustrating the influence of energy conservation and
24%efficiency.electricity
TABLE 3: Projections of Different Sectors and Industries
Annual Energy Consumption
Sectors 2012 2022 2040
(TWh) (TWh) (TWh)
BAU Ambitious BAU Ambitious
Buildings 238 568 525 1,769 1,460
Industry 2,367 4,010 3,600 8,764 7,266
Transport 929 1,736 1,628 3,828 3,243
Pumps and Tractors 237 423 388 728 592
Telecom 83 131 124 207 164
Cooking 1,072 829 684 524 467
Total 4,926 7,697 6,949 15,820 13,192
Source 7: Draft National Energy Policy, NITI Aayog 13
In the following section fossil fuel resources will be looked at separately for a more detailed
overview.
10 http://www.mospi.gov.in/sites/default/files/publication_reports/Energy%20Statistics%202019-finall.pdf, Table 4.1
11 https://mnre.gov.in/sites/default/files/India.pdf
12 https://niti.gov.in/writereaddata/files/new_initiatives/NEP-ID_27.06.2017.pdf
13 https://niti.gov.in/writereaddata/files/new_initiatives/NEP-ID_27.06.2017.pdf
10 I SOLAR HEAT FOR INDUSTRY: INDIA2.2.2.1 Oil/Petroleum Products
India is heavily dependent on crude oil imports, with crude petroleum accounting for about
34% of the total inward shipments. It is anticipated that by 2025, India will overtake Japan
to become the world’s third largest oil consumer after the US and China. 14 India is expected
to be one of the largest contributors to non-OECD petroleum consumption growth globally.
Nevertheless, many oil products used in the industry have seen a rapid decline from 2008,
while Liquefied petroleum gas (LPG) has seen a massive increase in the compound average
growth rate (CAGR) as shown in Table 4.
TABLE 4: Use of Selected Petroleum Products in the Industry in India
Unit in 1,000 tonnes
2008-09 2017-18 Change CAGR 2008-09 to 2017-18
High Speed Diesel Oil 1,310 1,120 -1.55%
Light Diesel Oil 171 145 -1.67%
Furnace Oil 2,843 2,299 -2.10%
Low Sulphur Heavy Stock 1,294 54 -27.24%
Liquefied Petroleum Gas 825 2,290 10.74%
Source 8: Ministry of Statistics, 2018
2.2.2.2. Natural Gas
India’s production of natural gas was 40.91 billion cubic meters (BCM) in 2018. The country’s
gas production is expected to more than double by 2040 to 90 BCM. Industry-wise off-take of
natural gas shows that natural gas has been used both for energy (56%) and non-energy (44%)
purposes. The gross import of natural gas has increased to 19.87 billion m³ in 2017-18 from
8.06 billion m³ in 2008-09, a CAGR of 9.44%.
30
Power Generation
25 Industrial Fuel
Tea Plantation
20 Transport/ Distribution Network
Refinery
15 Internal consumption
Fertilizer Industry
10 Petrochemicals
LPG Shrinkage
5 Sponge Iron
Miscellaneous
0
2017-18
2008-09
2009-10
2010-11
2011-12
2012-13
2013-14
2014-15
2015-16
2016-17
FIGURE 5: INDUSTRY-WISE OFF-TAKE OF NATURAL GAS IN INDIA FOR ENERGY AND NON-
ENERGY PURPOSES (IN BILLION M³)
Source 9: Ministry of Statistics, 2019 15
14 http://petroleum.nic.in/sites/default/files/pngstat_1.pdf
15 http://www.mospi.gov.in/sites/default/files/publication_reports/Energy%20Statistics%202019-finall.pdf
CHAPTER 2: ECONOMIC AND INDUSTRIAL POLICY IN INDIA I 11India is the fourth-largest Liquefied Natural Gas (LNG) importer after Japan, South Korea and
China, and accounts for 5.8% of the total global trade. Domestic LNG demand CAGR is seen
at 16.9% to 306.54 Million Metric Standard Cubic Meter per Day (MMSCMD) by 2021 from 73
MMSCMD in 2018. A small part of this will be used to fuel industrial production.
2.2.2.3 Coal and Lignite
India is one of the biggest lignite and coal producers worldwide. Coal deposits are mainly
confined to eastern and south-central parts of the country. The states of Jharkhand, Odisha,
Chhattisgarh, West Bengal, Madhya Pradesh, Telangana and Maharashtra account for 98.58%
of the total coal reserves in the country. 16 The estimated amount of coal resources in the
country is 315.149 billion tonnes as per “The inventory of Geological Resources of Indian
Coal” prepared by the Geological Survey of India. The total coal extracted from the coalfields
of India during 2017-2018 was 675.40 million tonnes. 17 Every year about 3-5 billion tonnes
of resources are added to India’s coal inventory through fresh exploration. Though coal and
lignite are mostly used in electricity production, they are also important to the steel and cement
industries, as well as to sponge iron and others. 18
The average quality of Indian coal is not too high, which necessitates the import of high-quality
coal to meet the requirements of steel plants. In fact, the imports of coal have seen a rising
trend, steadily increasing to 208.27 MTs in 2017-18 from 59.00 MTs in 2008-09. In the same
time frame, the quantum of coal exported decreased to1.50 MTs from 1.66 MTs.
Coal (62%) and lignite (90%) contribute mainly to electricity production and the cement industry,
but
700
relatively little to other industrial use, as is visible in Figure 6.
600
500
400
300
200
100
0
2017-18
2008-09
2009-10
2010-11
2011-12
2012-13
2013-14
2014-15
2015-16
2016-17
Electricity Steel & Washery Cement
Paper Textile Sponge Iron
Fertilizers & chemicals Brick Others
FIGURE 6: TRENDS IN INDUSTRY-WISE CONSUMPTION OF RAW COAL IN INDIA
Source 10: Based on Ministry of Statistics 2019 19
16 http://www.mospi.nic.in/sites/default/files/publication_reports/Energy_Statistics_2017r.pdf.pdf . 1 April 2017 http://www.mospi.gov.in/
sites/default/files/publication_reports/Energy%20Statistics%202019-finall.pdf
17 https://www.gsi.gov.in/
18 Trends in Consumption of Lignite in India * Includes sponge iron, colliery consumption, jute, bricks, coal for soft coke, chemicals, fertilisers
and other industries’ consumption
19 http://www.mospi.gov.in/sites/default/files/publication_reports/Energy%20Statistics%202019-finall.pdf Table 6.4
12 I SOLAR HEAT FOR INDUSTRY: INDIAFigure 7 shows that lignite has also seen an overall increase in use, though not as much as raw
coal. Nevertheless, only a small portion is used for non-electricity energy.
45
40
35
30
25
20
15
10
5
0
2008-09 2009-10 2010-11 2011-12 2012-13 2013-14 2014-15 2015-16 2016-17 2017-18
Electricity Steel & Washery Cement Paper Textile Others *
FIGURE 7: TRENDS IN INDUSTRY-WISE CONSUMPTION OF LIGNITE IN INDIA
Source 11: Ministry of Statistics 2019 20
2.2.2.4 Highlights of the Energy Sector 2017-18
Production and consumption
• Production CAGRs of coal and lignite from 2008-09 to 2017-18 were 3.20% and 3.62%
respectively, while their consumption CAGRs were 5.01% and 3.70%.
• Crude oil and natural gas, production CAGRs were +0.63% and (-) 0.06% while consumption
CAGRs were +4.59% and +4.82%.
• CAGR in generation of electricity was 5.71% and consumption of electricity was 7.39%.
Imports and exports
• CAGR in imports of coal from 2008-09 to 2017-18 was 13.44% while the exports CAGR
was -0.96%.
• CAGRs of imports of natural gas and crude oil were 9.44% and 5.20%.
• CAGR in imports of petroleum products was 6.67%, while CAGR in exports was 5.55%.
• For electricity, the net imports saw a significant change in the last two years i.e., 2016-18.
Exports have shown a robust CAGR of 61.83% in 2008-09 to 2017-18 whereas imports
saw a CAGR of -0.50%.
Usage of energy
• The most energy intensive sector was the industrial sector, accounting for about 56% of
the total energy consumption.
• CAGR in per-capita consumption of energy was 2.54% for 2011-12 to 2017-18.
20 http://www.mospi.gov.in/sites/default/files/publication_reports/Energy%20Statistics%202019-finall.pdf. Table 6.5
CHAPTER 2: ECONOMIC AND INDUSTRIAL POLICY IN INDIA I 132.2.3 Energy Infrastructure
Supply of fuel oil is decentralised, distributed, and largely controlled by PSU oil marketing
companies (OMCs) that have done a commendable job in maintaining petroleum supplies
through a strong dealer network. This is possible through an efficient road transportation and
rail infrastructure. Transportation of fuel nearly accounts for 5% of the total retail fuel price. India
consumes close to 4 million barrels per day, which translates to 73 million barrels per year of
oil wasted in transportation until it reaches beneficiaries.
To curb emissions, substitution of liquid fuel by natural gas is the key, and will have to be
prioritised. To increase penetration of natural gas, a national gas grid is planned to be rolled out
throughout the country. Ensuring sufficient supply will require funding support to provide storage
infrastructure. Gas pipeline infrastructure in the country stood at 16,470 km in September 2017.
FIGURE 8: GAS PIPELINES AS OF 2018
Source 12: Petroleum and Natural Gas Regulatory Board
14 I SOLAR HEAT FOR INDUSTRY: INDIAInfrastructure will play an important role in delivering energy to distant locations in the country. It
is obvious that with an over three times expansion in energy supply, there would be a naturally
accompanying growth in infrastructure. As the energy mix evolves, the type of infrastructure
would also change, with an ensuing impact on investment, revenue model and technology. By
nature, infrastructure must precede energy supply, but will not be created unless the latter is
assured. Therefore, there is an interdependent relationship between energy and infrastructure.
The NITI Aayog 21 report states that the government will ensure that the policy framework for
energy supply and related infrastructure will be harmonious.
2.3 Renewable Energy in the Institutional Setting
The potential for renewable energy in India is huge. The MNRE estimates that in the electricity
sector, there exists around 900 GW from commercially exploitable sources, of which the largest
share consists of 750 MW of solar electricity (MNRE 2017). 22
The MNRE is a nodal Ministry of the Government of India for all matters pertaining to new and
renewable energy. It has evolved from the previous commission and departments since 1981,
and has its current name and form since 2006.
The broad aim of this Ministry is to develop and deploy new and renewable energy for
supplementing the energy requirements of the country. It is responsible for formulating and
implementing policies and programmes for development of new and renewable energy, apart
from coordinating and intensifying research and development (R&D) in the sector. Its most
important task since 2010 has been the implementation of the National Solar Mission (NSM).
The Solar Potential
In India, and area of 3,287,240 km² receives solar radiation worth 4,300 quadrillion kcal (5,000
trillion kWh) every year. The daily average solar energy incident over India varies from 3,500 to
6,000 kcal/m² with about 2,300-3,200 sunshine hours per year, depending on the location.
Even if a fraction of this natural and inexhaustible energy is captured, it would be enough to
meet all heat and electricity needs for India’s industries.
Figure 9 shows the Direct Normal Irradiance (DNI) map of India.
21 http://niti.gov.in/writereaddata/files/new_initiatives/NEP-ID_27.06.2017.pdf
22 https://mnre.gov.in/file-manager/annual-report/2016-2017/EN/pdf/1.pdf
CHAPTER 2: ECONOMIC AND INDUSTRIAL POLICY IN INDIA I 15FIGURE 9: DIRECT NORMAL IRRADIATION IN INDIA Source 13: solargis s.r.o., Slovakia 16 I SOLAR HEAT FOR INDUSTRY: INDIA
2.3.2 Energy Efficiency Programmes and Incentives

The Energy Resources Institute (TERI) 23 indicated in a study in 2015 that the industrial sector
accounts for about 45% of total commercial energy consumption in India.

Newly established large plants in industries such as cement and                           paper mostly adopt energy
efficient, state-of-the-art technological options on their own, in                       line with global standards.
However, as already established plants tend to use outdated                              technologies and unskilled
manpower, these often present opportunities for energy efficiency                        improvements.

The Bureau of Energy Efficiency (BEE) is the apex body certifying energy auditors in India
through an academic programme. 24 It implements the Perform Achieve and Trade (PAT) scheme
that awards and trades in energy efficiency certificates to the country’s most energy-intensive
industries with an aim to improve and reduce energy consumption. 25 It is a market-based
mechanism to enhance the cost effectiveness in improving energy efficiency in energy-intensive
industries (called Designated Consumers DCs) through certification of energy saving, which
can be traded in form of ECerts (Energy Certificates).

2.4 The Economic and Political Situation on Energy Use in India
•    India will see fast growth in energy demand and will become the third biggest energy
     consumer of the world by 2025.
•    The high import dependency on fuel sources (such as petroleum based fuels, especially
     LPG and natural gas) create a great opportunity for the country to benefit from its abundant
     solar resources in the form of high solar irradiation.
•    Coal and lignite only play a minor role in the industry for heating, while LPG, natural gas
     and to a lesser extend diesel-based fuels play an important role, but need the relevant
     infrastructure (such as pipelines) that might not be available everywhere.
•    India’s industry has a growing demand for energy sources to produce heat.
•    Government programmes, especially the NSM, have been promoting the use of solar
     thermal systems for the industry.
•    Solar heat rivals other technologies in terms of energy cost savings. Therefore, investments
     in energy efficiency will often be the first approach before investing in solar heat.

23   http://www.teriin.org/projects/green/pdf/National-Industry.pdf
24   http://www.beeindia.gov.in/
25   https://beeindia.gov.in/content/pat-read-more

                                                                      CHAPTER 2: ECONOMIC AND INDUSTRIAL POLICY IN INDIA I   17
CHAPTER 3
SOLAR THERMAL FOR
INDUSTRIAL PROCESSES
18 I SOLAR HEAT FOR INDUSTRY: INDIA3.1 Solar Thermal Technologies for Industrial Processes
For many years now, solar thermal technologies have been used for domestic hot water, and
in colder climates, for space heating. However, production of heat for direct use in industrial
processes is rather new. At the end of 2018, there were around 741 SHIP plants in operation
worldwide. 26
FIGURE 9
Solar thermal collectors convert solar radiation into usable heat. SHIP describes systems that
provide solar heat in a factory.
FIGURE 9
Figure 10 shows a SHIP plant where a solar collector field heats up a thermal transfer fluid in
a heat exchanger. This transfers the generated heat to supply a system or production process
in the factory with hot water, air flow, or steam. Storage units also make it possible to use the
generated heat at night-time. Usually, solar thermal energy only supports an existing heating
process and is optimized according to the demand at times of maximum irradiation, especially
during the summer.
Heat
storage
unit
Pump
Heat Collector
exchanger
Heat
storage
unit
Pump
Heat Collector
exchanger
FIGURE 10
FIGURE 10: SCHEME OF A SHIP PLANT
Source 14: Solar Payback 2017
FIGURE 10
SOLAR
HEATED WATER
EVACUATED TUBE
COLLECTOR
HOT WATER
INDUSTRIAL FLOW
PROCESS BOILER
FUEL
HOT WATER RETURN HOT WATER RETURN
Example of a solar system which suppliesSOLAR
heat directly to an industrial process IRENA [8]
FIGURE 11: SIMPLIFIED ILLUSTRATION OF WATER
HEATED THE PROCESS-HEAT-CIRCLE CYCLE
Source 15: Solar Payback 2017, IRENA
EVACUATED TUBE
26 https://www.iea-shc.org/solar-heat-worldwide
COLLECTOR
HOT WATER
INDUSTRIAL FLOW
PROCESS BOILER
FUEL
CHAPTER 3: SOLAR THERMAL FOR INDUSTRIAL PROCESSES I 19
HOT WATER RETURN HOT WATER RETURNWhen exposed to the sun, the ‘collector’ heats up a thermal transfer fluid (either water with or
without glycol for frost protection or thermo-oil). Collectors are connected to the production
process or to a storage tank, either directly or via a heat exchanger. Electric pumps move the
heat transfer liquid within the solar circle. Figure 11 shows a simplified illustration of the process
heat cycle.
Various collector technologies available in the market supply heat at different temperature levels
and can be used for different processes:
• Stationary collectors: Are orientated towards the sun on fixed racks. They can be unglazed,
air, flat plate, and evacuated tube collectors and can yield temperatures of up to 150°C,
but are mostly used for applications below 100°C.
• Concentrating collectors: Work on the principle of reflecting and concentrating direct solar
radiation at its focus (a point or line), thereby using the concentrated solar radiation as a
high temperature thermal energy source to produce process heat. The mirror elements that
reflect and concentrate solar radiation vary in geometry and size. To facilitate concentration
of direct normal irradiation (DNI), the mirrors need to be continuously tracked following the
path of the sun in single or two-axes. Fresnel and parabolic trough collectors are 1-axis
tracking systems. Concentrating dish collectors are mostly 2-axes tracking solutions. Thus,
they make sense in areas with a lot of direct solar irradiation. They can generate heat
with temperatures of up to 400°C and even higher for electricity production, and can be
operated by pressurized water or thermal oil.
TABLE 5: Overview of collector types for solar process heat generation
Air collector
Air collectors use air to transport heat. Various types of air collectors use
either glazed, unglazed or vacuum tubes to collect usable heat. They rely
on either natural convection, or use fans to transport air via a well-insulated
tube system. In industrial processes, air collectors are well suited for drying
processes providing hot air between 20°C to 70°C.
Photo: Grammer Solar
Flat-plate collector
Flat-plate collectors use water to transport heat to the heat exchanger, the
storage tank, or the production process. They consist of an insulated case
containing a metallic absorber, which has an absorber sheet and a piping
system below to transport the heat. The casing is covered with a single or
double-glass plate, as anti-reflective coating reduces transmission losses.
They achieve operating temperatures of between 30°C and 90°C and are
produced in many countries. For solar process heat applications, usually Photo: E3 Energy group
large-scale collectors are used. Evacuated flat plate collectors can supply
even significantly higher temperatures due to reduced convection losses.
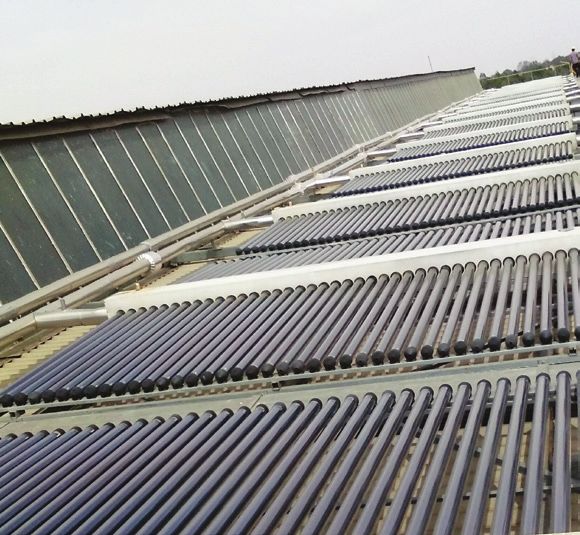
20 I SOLAR HEAT FOR INDUSTRY: INDIAEvacuated tube collector
Evacuated tube collectors use vacuum as an insulation to protect the
absorber from the environment. Double-glass evacuated tube collectors
consist of two tubes that are evacuated between them while single-glass
evacuated tube collectors consist of one evacuated tube. With direct flow
types, the heat transfer liquid flows through the tube. With so-called heat
pipe or U-pipe collectors, a separated circuit inside the tube transports
the collected heat to the top of the tube. Inside the header, the energy is
Photo: Himin
transferred to the heating circuit.
To improve efficiency, some types of evacuated tube collectors are
equipped with a reflective metal sheet behind the tubes, called compound
parabolic concentrators (CPC). Evacuated tube collectors can deliver
temperatures of 50–150°C.
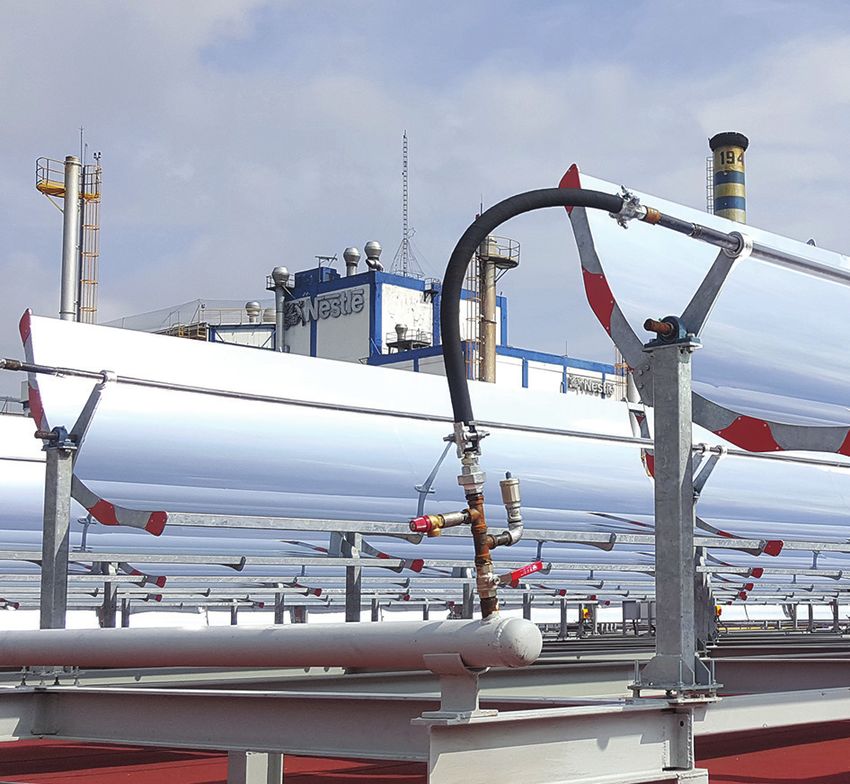
Parabolic trough collectors
In parabolic trough collectors, bent mirrors reflect sunlight on to the receiver
tubes. The mirrors or troughs are mostly aligned on a north-south axis, and
rotate from east to west to track the sun along its daily path. Temperatures
of up to 400°C can be produced and direct steam generation is possible.
The temperature levels depend on the size of the parabolic trough and the
evacuation of the receiver tube.
Photo: Amul Fed Dairy
Linear Fresnel collectors
Fresnel collectors concentrate the sun with several flat mirrors that track
sunlight on one axis onto a central receiver tube. The single mirrors are
easy to replace and the exposure to wind is only minimal. There are Fresnel
collectors that have a secondary mirror placed above the receiver tube to
reflect light back down to the absorber. Temperatures of up to 400°C can
be produced and direct steam generation is possible.
Photo: Industrial Solar
Concentrating dish collector
Parabolic dishes concentrate solar irradiation on one spot and produce
high temperatures of up to 400°C depending on the size of the mirror field
and the evacuation of the receiver tube. Examples include Scheffler dishes
used for cooking in India and some process applications. Tracking via two
axes requires a high level of precision.
Photo: ARS Glasstech
Source 16: Overview by Solar Payback
CHAPTER 3: SOLAR THERMAL FOR INDUSTRIAL PROCESSES I 213.2 Temperature Ranges of SHIP
Industrial process temperatures typically vary according to the production process involved.
They are classified into three ranges (see Figure 12): first below 150°C (called low temperature),
a second range of 150-400°C (medium temperature), and above 400°C (high temperature).
Many industrial processes in the chemicals, food and beverage, machinery, mining, textiles and
wood industries use temperatures that can be easily generated with solar thermal technologies
– as hot water or steam. Since fixed costs dominate the overall cost structure of solar thermal
energy, processes that have a summer peak load as well as those that can be applied all-year-
long are of special interest for the use of solar thermal applications. As the economics of SHIP
improve, the costs for competing energy sources become higher, and the savings that can be
realised by the use of SHIP increase.
The type of solar thermal collector used depends greatly on the temperature level required. In
some applications, such as for washing or drying processes, only a low temperature of about
50°C is needed, for which mainly flat-plate collectors or air collectors are used. Numerous
industrial processes require temperatures of up to 95°C. Both evacuated tube collectors and
improved flat-plate collectors are able to provide this temperature with very good efficiency.
Higher temperature levels can be FIGURE
reached 11
if a vacuum is used for insulation.
Above approximately 140°C solar radiation must be concentrated. Higher concentration factors
of parabolic trough, linear Fresnel collectors, or concentrating dish systems provide operating
temperatures up to 400°C. For most applications, more than one collector type could be used.
The criteria are – available space, economics, and location among others.
INDUSTRY LOW MEDIUM HIGH
Below 150 ºC 150 to 400 ºC > 400 ºC
Chemical • Boiling • Distilling
Food and • Drying • Boiling
beverage • Pasteurising • Sterilising
Machinery • Cleaning • Drying
Mining • Nitrate melting
• Mineral drying processes
Textile • Washing • Bleaching • Dyeing
Wood • Steaming • Pickling • Compression • Drying
• Cooking
100 ºC 150 ºC 250 ºC 350 ºC
Flat plate
Evacuated tube
Evacuated tube CPC
Small parabolic trough
Evacuated flat plate / linear Fresnel
without evacuated receiver
Large parabolic trough
Concentrating dish / linear Fresnel
with evacuated receiver
FIGURE 12: COLLECTOR TEMPERATURE RANGES, APPLICATIONS, AND TECHNOLOGIES
Source 17: IEA TASK 49
22 I SOLAR HEAT FOR INDUSTRY: INDIA3.3 Solar Thermal Industry in India
As per a survey undertaken by Global Environment Facility – United Nations Development
Programme (GEF-UNDP) annually over 15 million tonnes of fuel oil in industries requiring heat
up to 250°C, and 500 trillion units of electricity in various sectors is consumed for heating
water and air. Main thermal applications – process heat, residential cooking, and water heating
– account for more than 90% of the thermal energy requirement. Presently, this demand is
primarily met through coal, biomass and petroleum fuels. However, several areas in India
receive good Direct Normal Irradiance (DNI) and solar thermal energy has the potential to
convert this radiant energy to meet heating needs of up to 250°C. Even if only 1% of this
heating energy requirement is met by using concentrated solar thermal, the potential for SHIP
is estimated to be over 2.5 million m². 27
SHIP largely achieves this through concentrating technologies on opportunities for increasing
yield per unit. Only on rare occasions are flat-plate collectors used, when low temperatures are
needed and area availability is not a problem.
In India, the main drivers for SHIP are the GEF-UNDP programme for concentrating solar thermal
(CST) market development, and the GEF-UNIDO programme for solar thermal industrial process
heat. While GEF-UNDP achieved 44,949 m² of CST market, GEF-UNIDO is progressing with
an additional 45,000 m² installed area of CST systems. As an incentive, the Indian Renewable
Energy Development Agency (IREDA) 28 offers a 5%-interest loan. This scheme is also extended
to manufacturing now, which makes this the first instance of any incentive for the solar thermal
manufacturing industry ever announced.
The country has achieved a little over 50% of the target set under the National Solar Mission
until December 2018, largely from solar water heating systems. Almost 80% of India’s present
solar thermal operative capacity was installed since 2010.
The federal subsidy scheme on solar thermal collectors has been removed, but concentrating
solar thermal systems continue to receive a subsidy of 30% (60% in special category states) or
a fixed benchmark cost per square metre 29 until the fiscal year 2018-19. It has been reduced
to 20% (40% in special category states) for the next fiscal period.
TABLE 6: Benchmark Cost for Different Types of Concentrating Collectors
Sl. Solar collector type Benchmark cost (INR/m²)
1. Solar collector systems for direct heating 12,000
2. Concentrator with manual tracking 7,000
3. Compound Parabolic Collector, direct heating and drying 12,000
4. Single Axis tracking and Scheffler dishes 15,000
5. Single Axis tracking using solar grade mirrors 18,000
6. Double axis tracking 20,000
Source 18: MNRE, Government of India, 2019
27 Solar Thermal Federation of India (STFI)
28 http://www.ireda.in/writereaddata/Approved%20UNIDo%20Loan%20scheme..pdf
29 http://mnre.gov.in/file-manager/UserFiles/subsidies_solar_thermal_systems_devices.pdf
CHAPTER 3: SOLAR THERMAL FOR INDUSTRIAL PROCESSES I 233.4 The Indian Solar Thermal Market
India has profound experience in the solar thermal sector with the last decade seeing an
upsurge of medium high temperature solar thermal systems such as parabolic troughs, Scheffler
dishes, Fresnel lens, parabolic dish, and compound parabolic collectors, stimulated by the
solar thermal programme initiated by MNRE and its predecessors. Table 6 and Table 7 provide
the cumulative installed solar thermal area that is operative until December 2018.
TABLE 7: Cumulated Collector Area in Operation by the end of 2018
Water Collectors (m²] Air Collectors [m²] Concentrators [m²] Total [m²]
Unglazed Glazed Evacuated Unglazed Glazed PTC, Fresnel, etc.
0.0 40,56,399 74,25,876 0 12,150 77,473 11,566,648
Source 19: Renewables 2019 Global Status Report 30
MNRE has estimated the potential of solar thermal collectors to be about 140 million m². The
Government of India wants to install 175 GW of renewable energy for power generation and an
estimated 20.13 million m² installed area of solar thermal collectors by the year 2022. 31 According
to the information available from MNRE, until March 2019, India had an installed capacity of
about 78.316 MW of grid-connected renewable energy, largely from solar photovoltaics, wind
energy, small hydro, and biomass waste in the electricity sector.
According to information available from International Energy Agency (IEA), India’s installed
cumulative capacity of solar water heaters stands close to 1.16 million m² and little over 72,000
m² through concentrated solar thermal technologies.
The National Solar Mission (NSM), which was announced in January 2010, was a turning point
for the solar thermal market development. The mission, which will last until March 2022, targets
a cumulative solar thermal area of 20 million m² and is spread over three phases:
• Phase 1 (2010 – 2013) - 7 million m²
• Phase 2 (2013 – 2017) - 15 million m²
• Phase 3 (2017 – 2022) - 20 million m²
The MNRE has a separate programme for CSH 32 used for community cooking, process heating,
and air drying and cooling. It will continue its policy to support concentrated solar thermal
systems and has set a target (as part of its continuation of policy for community cooking,
process heating and cooling) with a budget of INR 70 million. The support will be in force until
fiscal 2019-2020 and targets 90,000 m² area during this period. Year-wise targets are given
in Table 8.
TABLE 8: MNRE Programme on CSH with Targets
Fiscal Year Target area (m²)
2017-18 20,000
2018-19 30,000
2019-20 40,000
TOTAL 90,000
Source 20: MNRE, Government of India
30 https://www.ren21.net/gsr-2019/
31 https://mnre.gov.in/sites/default/files/uploads/potential_electricitysSavings_swhs.pdf
32 https://mnre.gov.in/file-manager/dec-solar-thermal-systems/CST-Scheme-2017-2020.pdf
24 I SOLAR HEAT FOR INDUSTRY: INDIAAs per the Renewables Global Status Report 2018 (REN21 2018), 33 India continues to maintain
its position among the top-five markets for solar thermal globally. 34 SHIP is an upcoming market
in India and placed fourth in the world. The Indian solar thermal capacity saw a 25% y-o-y
growth in 2018, the highest globally. With a capacity of 2.8 MW thermal, India was among the
top-10 markets for concentrated heat technologies in 2018, along with Oman, China, Italy and
Mexico. When it comes to solar water heating collector capacity in operation, India was in sixth
position, behind China, the US, Turkey, Germany, and Brazil.
Solar water collectors dominate the market with 90% share and the rest is for process heat.
Figure 13 shows the year-wise solar water collector market in India until 2018. Within process
heat, the market share of industrial process heat is around 55% and the rest is for cooking.
The Indian solar thermal market is on the growth path as the year 2018 showed an impressive
performance in comparison to the previous year. Overall, the glazed collector market grew by
20% to 1.79 million m² (1,248 MWth). Another 4,500 m² were installed for use in concentrating
collector systems. 35
Imports of solar thermal components and systems with no checks on quality can be a problem
for the sustainability of the market. Unless the government intervenes by establishing stringent
and mandatory Indian standards, more and more sub-standard imports will enter the country
from China. For local manufacturers, this competition is a serious threat, since it could even
drive them out of the manufacturing business.
1,80
1,55
1,60 1,43
1,40 1,18 1,16 1,20
1,06 1,10
1,20 0,98 0,98
1,00
0,80 0,62 0,45
0,40 0,42 0,56
0,62
0,60
0,20
0,40
0,10 0,13
0,20 0,03
0,00
Up to 2001
2017-18
2018-19
2014-15
2015-16
2016-17
2012-13
2013-14
2009-10
2010-11
2011-12
2006-07
2007-08
2008-09
2003-04
2004-05
2005-06
2001-02
2002-03
FIGURE 13: SOLAR COLLECTOR INSTALLATIONS IN INDIA YEAR-WISE
Source 21: Solar Thermal Federation of India
3.4.1 Solar Thermal Energy Research and Development (R&D) at MNRE
The MNRE plans activities on research, design, and development that lead to deployment. It
also proposes the commercialization of various solar thermal technologies for power generation,
industrial process heat systems, and solar cooling. 36 In addition to this, it aims at continuing
efforts to develop technologies for improving various low-temperature applications, namely
solar water heating and solar cooking. The major thrust areas of the plan include solar thermal
33 http://www.ren21.net/status-of-renewables/global-status-report/
34 https://www.ren21.net/wp-content/uploads/2019/08/Full-Report-2018.pdf
35 This analysis is based on the import statistics of vacuum tubes and a survey among the few flat plate collector manufacturers still in
business in the country today.
36 https://mnre.gov.in/concentrating-solar-system-solar-cookers-steam-generating-systems
CHAPTER 3: SOLAR THERMAL FOR INDUSTRIAL PROCESSES I 25power generation, parabolic trough technology, central receiver technology, dish, engine,
turbine technology and solar heat (up to 250℃) for industrial processes and cooking systems.
Other areas include solar distillation/water purification systems, solar air heating, drying and
food processing systems, solar cooling, solar architecture, solar detoxification of wastes,
development of low-cost materials, and development of performance standards.
R&D on Solar Heat (up to 250℃) for Industrial Processes
Efforts will be made to develop advanced solar collectors with optical efficiency greater than
75% and with overall heat loss coefficient reduced to 4.0 W/m²K (or lower) for flat plate
collectors. For industrial process heat applications, the development of high performance solar
concentrating collectors and systems will be initiated. It is proposed to undertake up to 20 R&D
installations, each of about 50 kWth capacity based on the developed technology in different
industries with a view to fine-tune the technology and technology validation.
The Indian solar thermal industry is still largely dominated by the solar collector business. As
per IS 12933 of the Bureau of Indian Standards (BIS) there are 58 approved manufacturers. 37
However, for evacuated tube manufacturing, no BIS standard is mandatory, hence the list is
not published.
There are 29 manufacturers empanelled by MNRE for sale and distribution of concentrating
solar cooking devices and can be accessed at a website. 38
For process heating and cooling, there are 34 manufacturers and an additional 16 new
entrepreneurs empanelled by MNRE for sale and distribution and can be accessed at the
overview of channel partners of MNRE. 39 All the listed manufacturers have their manufacturing
bases in India.
3.4.2 Testing Agencies
For testing of solar thermal process heating systems using concentrated solar thermal, the
National Institute of Solar Energy, Gurugram, and Savitribai Phule University of Pune, School of
Energy Studies, are approved by MNRE. 40
3.4.3 Promoting Agencies
Solar Thermal Federation of India (STFI)
STFI works towards the larger interest of the industry. It constitutes members with over 80%
share of the solar thermal market. 41
National Institute of Solar Energy (NISE)
The Government of India converted a 25-year-old Solar Energy Centre (SEC) under MNRE to
an autonomous institution in September 2013, to assist the MNRE in implementing the National
Solar Mission and to coordinate research, technology, skill development, training, consultancy,
incubation, and other related works.
37 https://mnre.gov.in/sites/default/files/uploads/list_ahs.pdf
38 https://mnre.gov.in/file-manager/UserFiles/list_manufacturers_dsc.pdf
39 https://mnre.gov.in/file-manager/UserFiles/OM-list_channelpartners_st_cst_jnnsm.pdf
40 https://mnre.gov.in/file-manager/UserFiles/Advising-manufacturers-CSTs.pdf
41 STFI is a pan-India body Registered under Societies Registration Act XXI of 1860 Regd. No. S/69506/2010 working
26 I SOLAR HEAT FOR INDUSTRY: INDIAIndian Renewable Energy Development Agency (IREDA)
IREDA is a Government of India Enterprise under the administrative control of MNRE. It is a
public limited government company, established as a non-banking financial institution in 1987,
engaged in promoting, developing, and extending financial assistance for setting up projects
relating to new and renewable sources of energy and energy efficiency/conservation.
Solar Energy Corporation of India (SECI)
The SECI is a central public sector undertaking under the administrative control of MNRE to
facilitate the implementation of the NSM, which has set an ambitious target for encouraging
solar thermal applications in domestic and industrial segment. The key strategies are:
• To make solar heaters mandatory through building by-laws and incorporation in the national
building codes.
• To ensure effective mechanisms for certification/rating of manufacturers.
• To promote such thermal applications through local agencies/power utilities.
• To support the upgrading of technologies and manufacturing capacities through concessional
funding.
3.4.4 Quality Standards, Certification and Norms
The Bureau of Indian Standards (BIS) 42 is the national standards body of India working under the
aegis of the Ministry of consumer affairs, food and public distribution, Government of India. It is
established by the Bureau of Indian Standards Act. BIS has put in place standards for flat plate
collectors as IS 12933-1 (2003), which is mandatory for all installations in India.
Similarly, it has also set draft standards for Evacuated Tube Collectors as IS 16544: 2016,
which will soon be made mandatory.
For concentrating solar technologies, BIS standards are available for the following:
1. Solar Flat Plate Collectors
IS 12933(Part1):2003 Solar Flat Plate Collector – Specification Part 1 Requirements (Second Revision)
IS 12933(Part 2):2003 Solar Flat Plate Collector – Specification Part 2 Components (Second Revision)
IS 12933(Part 3):2003 Solar Flat Plate Collector - Specification Part 3 Measuring Instruments (First Revision)
IS 12933(Part 5):2003 Solar Flat Plate Collector – Specification Part 5 Test Methods (Second Revision)
IS 16368: 2015 Test Procedure for Thermosyphone Type Domestic Solar Hot Water Heating System
2. All Glass Evacuated Tubes Solar Collectors
IS 16542 : 2016 Direct Insertion Type Storage Water Tank for All Glass Evacuated Tubes Solar Collector
— Specification
IS 16543 : 2016 All Glass Evacuated Solar Collector Tubes — Specification
IS 16544 : 2016 All Glass Evacuated Tubes Solar Water Heating System
3. Concentrated Solar Thermal
IS 16648 (Part 1):2017 Concentrated Solar Thermal – Specification Part 3 Parabolic Through Concentrator
IS 16648 (Part 2):2017 Concentrated Solar Thermal – Specification Part 2 Scheffler Concentrator
IS16648( Part 3):2017 Concentrated Solar Thermal – Specification Part 3 Parabolic Trough Concentrator
IS16648 (Part 4):2017 Concentrated Solar Thermal Specification Part 4 Non-Imaging Concentrator
IS16648(Part 5):2017 Concentrated Solar Thermal - Specification Part 5 Test Methods
42 https://bis.gov.in/
CHAPTER 3: SOLAR THERMAL FOR INDUSTRIAL PROCESSES I 27You can also read